Embed Size (px)
Citation preview

Hari Srinivasan, Jean Yamanis, Rick Welch, Sonia Tulyani, and Larry Hardin
United Technologies Research Center, East Hartford, Connecticut
Solid Oxide Fuel Cell APU Feasibility Studyfor a Long Range Commercial AircraftUsing UTC ITAPS ApproachVolume I: Aircraft Propulsion and Subsystems
Integration Evaluation
NASA/CR—2006-214458/VOL1
December 2006

NASA STI Program . . . in Profile
Since its founding, NASA has been dedicated to the
advancement of aeronautics and space science. The
NASA Scientific and Technical Information (STI)
program plays a key part in helping NASA maintain
this important role.
The NASA STI Program operates under the auspices
of the Agency Chief Information Officer. It collects,
organizes, provides for archiving, and disseminates
NASA’s STI. The NASA STI program provides access
to the NASA Aeronautics and Space Database and its
public interface, the NASA Technical Reports Server,
thus providing one of the largest collections of
aeronautical and space science STI in the world.
Results are published in both non-NASA channels and
by NASA in the NASA STI Report Series, which
includes the following report types:
• TECHNICAL PUBLICATION. Reports of
completed research or a major significant phase
of research that present the results of NASA
programs and include extensive data or theoretical
analysis. Includes compilations of significant
scientific and technical data and information
deemed to be of continuing reference value.
NASA counterpart of peer-reviewed formal
professional papers but has less stringent
limitations on manuscript length and extent of
graphic presentations.
• TECHNICAL MEMORANDUM. Scientific
and technical findings that are preliminary or
of specialized interest, e.g., quick release
reports, working papers, and bibliographies that
contain minimal annotation. Does not contain
extensive analysis.
• CONTRACTOR REPORT. Scientific and
technical findings by NASA-sponsored
contractors and grantees.
• CONFERENCE PUBLICATION. Collected
papers from scientific and technical
conferences, symposia, seminars, or other
meetings sponsored or cosponsored by NASA.
• SPECIAL PUBLICATION. Scientific,
technical, or historical information from
NASA programs, projects, and missions, often
concerned with subjects having substantial
public interest.
• TECHNICAL TRANSLATION. English-
language translations of foreign scientific and
technical material pertinent to NASA’s mission.
Specialized services also include creating custom
thesauri, building customized databases, organizing
and publishing research results.
For more information about the NASA STI
program, see the following:
• Access the NASA STI program home page at
http://www.sti.nasa.gov
• E-mail your question via the Internet to
• Fax your question to the NASA STI Help Desk
at 301–621–0134
• Telephone the NASA STI Help Desk at
301–621–0390
• Write to:
NASA STI Help Desk
NASA Center for AeroSpace Information
7115 Standard Drive
Hanover, MD 21076–1320

NASA/CR—2006-214458/VOL1
December 2006
National Aeronautics and
Space Administration
Glenn Research Center
Cleveland, Ohio 44135
Prepared under Contract NAS3–01138 Task 20
Hari Srinivasan, Jean Yamanis, Rick Welch, Sonia Tulyani, and Larry Hardin
United Technologies Research Center, East Hartford, Connecticut
Solid Oxide Fuel Cell APU Feasibility Studyfor a Long Range Commercial AircraftUsing UTC ITAPS ApproachVolume I: Aircraft Propulsion and Subsystems
Integration Evaluation

Available from
NASA Center for Aerospace Information
7115 Standard Drive
Hanover, MD 21076–1320
National Technical Information Service
5285 Port Royal Road
Springfield, VA 22161
Available electronically at http://gltrs.grc.nasa.gov
Trade names and trademarks are used in this report for identification
only. Their usage does not constitute an official endorsement,
either expressed or implied, by the National Aeronautics and
Space Administration.
This work was sponsored by the Fundamental Aeronautics Program
at the NASA Glenn Research Center.
Level of Review: This material has been technically reviewed by NASA technical management.

NASA/CR—2006-214458 1
Solid Oxide Fuel Cell APU Feasibility Study for a Long Range Commercial Aircraft Using UTC ITAPS Approach
Volume I: Aircraft Propulsion and Subsystems Integration Evaluation
Hari Srinivasan, Jean Yamanis, Rick Welch, Sonia Tulyani, and Larry Hardin United Technologies Research Center
411 Silver Lane East Hartford, Connecticut 06108
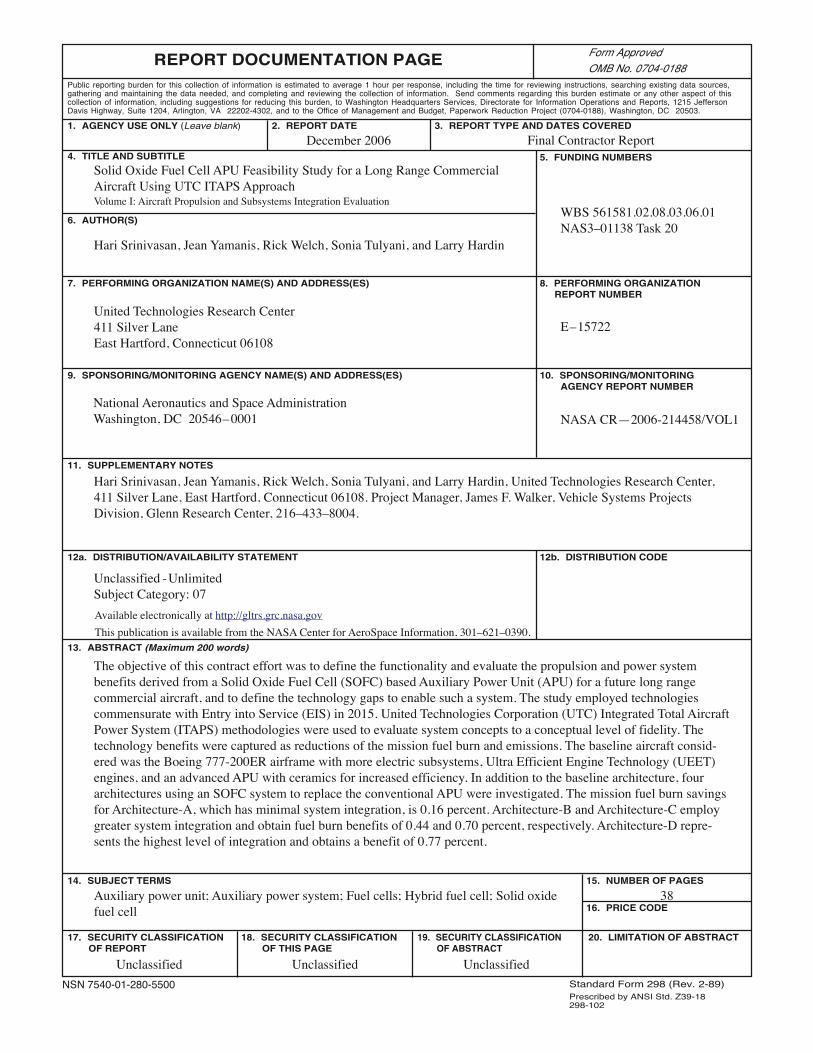
Summary The objective of this contract effort was to define the functionality and evaluate the propulsion and
power system benefits derived from a Solid Oxide Fuel Cell (SOFC) based Auxiliary Power Unit (APU) for a future long range commercial aircraft, and to define the technology gaps to enable such a system. The study employed technologies commensurate with Entry into Service (EIS) in 2015. United Technologies Corporation (UTC) Integrated Total Aircraft Power System (ITAPS) methodologies were used to evaluate system concepts to a conceptual level of fidelity. The technology benefits were captured as reductions of the mission fuel burn and emissions; however, the life cycle cost was not part of the work scope.
At the system level, the overall integration of a fuel cell power unit, turbine engine and power subsystems for a long-range commercial transport was evaluated and the associated enabling technologies were identified. The baseline aircraft considered was the Boeing 777-200ER airframe with more electric subsystems, Ultra Efficient Engine Technology (UEET) engines, and an advanced APU with ceramics for increased efficiency. In addition to the baseline architecture, four architectures using an SOFC system to replace the conventional APU were investigated.
Architecture-A simply replaced the APU with a 450 kW SOFC—gas turbine (GT) hybrid system, which operated for all phases of the mission, including the flight climb-cruise-descent operation, thereby reducing the engine shaft extractions substantially. Architecture-B comprised greater integration between the SOFC system and aircraft Environmental Control System (ECS), Thermal Management System (TMS), and Electrical Power System (EPS), and let to improved overall system efficiency and hence reduced the mission fuel burn. Architecture-C employed greater integration of the SOFC with aircraft sub-systems and advanced aircraft technologies to improve the benefits and applications of the SOFC system. Architecture-C also utilized proprietary UTC technology to extend the fuel heat sink capability thus enabling recovery of the waste heat from the SOFC to pre-heat the fuel for the propulsion engines. This waste heat recovery further reduced the mission fuel burn. Architecture-D explored the potential for reducing parasitic power losses due to pressurization by running the Architecture-C SOFC system at one atmosphere pressure.
System integration is critical to maximize benefits from the SOFC APU for aircraft application. The mission fuel burn savings for Architecture-A, which had minimal system integration, was 0.16 percent. Architecture-B and Architecture-C employed greater system integration and obtained fuel burn benefits of 0.44 and 0.70 percent, respectively. Architecture-D had the highest level of integration and obtained a benefit of 0.77 percent. System integration will also minimize the technology development cost/time.
Recognizing that most of the benefits of the SOFC system were realized during ground operations, the potential benefits for a short-range mission were also explored. The preliminary short-range mission study showed that the SOFC system provided more benefits to short-range mission aircraft (about 3 percent mission fuel burn savings for the 500 NM B777-200ER aircraft mission) as compared to the long-range mission aircraft (0.7 percent mission fuel burn benefit).
The SOFC APU produced zero emissions, thus eliminating the emissions of the conventional APU during ground operations. The reduction in engine fuel burn (partly due to reduced extractions) also resulted in a reduction in emissions from the engines. For Architecture-C, the engine emissions in flight decreased by 0.23 percent for oxides of nitrogen (NOX), 1.46 percent for carbon monoxide (CO) and 2.89 percent for unburned hydrocarbons (UHC). The ground emissions from the engines were reduced by 15.55 percent for NOX, 3.35 percent for CO, and 4.82 percent for UHC.

NASA/CR—2006-214458 2
The noise level of the baseline APU during ground operations was 90 dBA. A silencer was required to achieve the noise target of 80 dBA. The Architecture-C SOFC APU produced a noise level of 72 dBA, needing no silencer. However, the Architecture-D SOFC APU produced a noise level of only 51 dBA.
A paradigm shift is needed in the SOFC stack concepts to achieve the year 2015 goal metrics (weight, life, etc.). This is based on the 4X improvement needed for the stack weight and 7X improvement needed for the SOFC system weight, based on the current state of the art technologies. Additional areas requiring further development are the fuel processing to remove sulfur, either on board or on the ground, and extending the heat sink capability of the fuel to allow greater waste heat recovery.
1. Introduction Recent advancements in fuel cell technology from the Department of Energy (DOE) and industry
have set the stage for the use of SOFC systems in aircraft applications. Conventional APUs account for 20 percent of airport ground based emissions. Airport ground emissions will only worsen with increased air travel unless new technology is introduced. To address these issues, NASA formulated a plan to advance solid oxide fuel cell capabilities for a wide range of aircraft power and propulsion applications (ref. 1). The plan builds on the DOE’s Solid State Energy Conversion Alliance (SECA) program by complementing SECA’s program objectives on cost reduction to address power density (kW/L) and specific power (kW/kg) challenges critical for aircraft applications. As part of this plan, NASA issued several contracts to conduct studies targeting a jet fuel based fuel cell with a 2015 Entry-Into-Service (EIS) application. This present NASA study is intended to look into the potential benefits of tightly integrating the SOFC fuel cell with the aircraft subsystems using Integrated Total Aircraft Power Systems (ITAPS, United Technology Corporation) proprietary methodologies.
1.1 Objective
The objective of the ‘Aircraft Propulsion and Subsystems Integration Evaluation’ (NAS3–01138: Task Order 20) contract effort is to define the functionality and evaluate the propulsion and power system benefits derived from a Solid Oxide Fuel Cell (SOFC) based Auxiliary Power Unit (APU) for a future aircraft, and define the technology gaps to enable such a system.
1.2 Scope
The project scope regarding the technologies, system evaluation methodologies, performance metrics and the baseline system used to benchmark the benefits is listed below.
• The technologies would be commensurate with the year 2015 Entry into Service (EIS) • The Boeing 777-200ER mission requirements and the United Technology Corporation UTC
Integrated Total Aircraft Power System (ITAPS) methodologies were used to evaluate technologies as elements of complete system concepts.
• The future SOFC systems were designed to meet at least the Department of Energy (DOE) program Solid-state Energy Conversion Alliance (SECA) goals.
• The system architectures were evaluated to a conceptual level of fidelity. • Metrics: The technology benefits were captured as reductions of the mission fuel burn and
emissions (NOX, CO, and UHC). However, the life cycle cost (capital cost, installation cost and the maintenance cost) was not within project scope.
• Baseline System: Fixed B777-200ER airframe (Long Range Commercial Aircraft) with o More electric subsystems o Ultra Efficient Engine Technology (UEET) engines o Advanced APU (with ceramics)
1.3 Tasks
At the system level, the overall integration of a fuel cell power unit, turbine engine and power subsystems for a long-range commercial transport were evaluated and the associated enabling

NASA/CR—2006-214458 3
Figure 1.—Tasks and events.
technologies were identified. The work covered the following general areas of activity: analysis of a pre-established baseline (Task-1), estimation of future fuel cell performance (Task-2), generation of three fuel cell integration concepts (Task-3), evaluation of performance of the system architectures (Task-4), and identification of enabling technologies (Task-5). Figure 1 shows the key events and the tasks executed for this project.
1.4 Study Challenges
The technical challenges involved in using the SOFC system for aircraft application are listed below:
• The SOFC system specific power (kW/kg) is about three times lower than that of a conventional gas turbine APU. The corresponding weight penalty increases the amount of fuel burned by the aircraft (equivalent of 0.4 percent aircraft mission fuel burn).
• The SOFC system operation during flight cruise condition requires input air stream and providing that air from the ambient (ram air) introduces ram-drag penalty. This ram-drag penalty increases the amount of fuel burned by the aircraft (equivalent of 0.3 percent aircraft mission fuel burn).
• The SOFC system (which is a hybrid system with the SOFC stack and the turbo-machinery) generates both ac and dc power. The dc power is from the stack and the ac power is from the turbine generator. The distribution of the power (ac and dc) generated by the SOFC system in the aircraft requires additional power electronics (power converters etc), which, in turn, increase the amount of fuel burned by the aircraft.
• The current technology of the SOFC system requires a longer time (more than 30 min) to startup the SOFC system. Therefore, frequent starting and stopping cycles for the SOFC system may not be a good option for the aircraft application.
• The processing of the Jet-A fuel with sulfur levels between 300 to 1000ppm requires a bulkier de-sulfurizer, which restricts the de-sulfurization options for the aircraft.
• The exhaust gas coming out of the SOFC system is at rather high temperature (> 600 °F) and utilization of this hot stream is a challenge.
To realize any potential benefit from the SOFC system for aircraft application, the system integration concepts for the SOFC system should provide substantial benefits to overcome penalties imposed by the technical challenges listed above.
1.5 Related Documents
A companion report, “Solid Oxide Fuel Cell APU Feasibility Study for a Long Range Commercial Aircraft Using UTC ITAPS Approach: Volume II—Subsystem Details of Architectures Studied,” documents the details of the subsystems involved in the study. The subsystem details report contains limited-rights data.

NASA/CR—2006-214458 4
Figure 2.—Baseline: APU electrical loads for ground operation.
2. Power System Architectures: Synthesis and Benefits This section presents the system evaluation results for the various power system architectures: (i)
Baseline system, (ii) Architecture-A, (iii) Architecture-B, and (iv) Architecture-C.
2.1 Baseline System
The baseline aircraft system is a UEET aircraft from an earlier Pratt & Whitney / NASA study. The baseline consists of B777-200ER mission with UEET engines, advanced APU (with ceramics material) and more-electric-aircraft (MEA) sub-systems (electric engine start, electric environmental control system, electric anti-ice and electric and hydraulic actuation).
The APU electric load requirements and the ground operation time are shown in figure 2. During regular flight operation, the APU remains operational until the “taxi-out”. During the flight segment the APU will not be operated; however, for the emergency and anti-ice requirements, the APU may be operated during flight. The APU was sized at 450 kW to satisfy all of its requirements (ground operation, emergency operation and also to satisfy anti-ice loads).
TABLE I.—BASELINE : MISSION PROFILE
Mission Poin t Descri ptio n
Altitude (ft) Ma ch
El apse d T ime (m in )
1 E ngine Start 0 0.00 02 End of Taxi 0 0.00 93 Tak e Off 0 0.23 9.54 Beginning of Cl imb 1500 0.39 10.985 Climb 10000 0.45 14.26 Cruis e 35000 0.85 33.027 C limb for B CA 35000 0.85 438.58 Beginning of Final Cruise 39000 0.85 448.379 End of Cruise 39000 0.85 942.110 Cutbac k 39000 0.85 942.111 Des cent 1 32159 0.85 944.4412 Des cent 2 1500 0.39 964.55
The baseline system analyzed is a 305 passenger, 7700 nautical miles (NM) long-range mission, EIS
2015 aircraft with a maximum cruising altitude 39000 ft at Mach number 0.85. Table I and figure 3 show the aircraft mission for the climb-cruise-descent segment. In table I, BCA refers to the Best Cruise Altitude. The flight segment represented by the mission points MP1 through MP3 corresponds to the taxi-out segment in figure 2. After the end of the descent segment, the taxi-in continues (as in fig. 2). The engine will be operational from the beginning of the taxi-out (engine start represented as MP1) to the end of taxi-in (engine stop). The APU will be operational during the taxi-out and taxi-in segment operating at zero loads.

NASA/CR—2006-214458 5
0
10000
20000
30000
40000
50000
0 200 400 600 800 1000
Time (min)
Alti
tude
(ft)
Altitude-Time Mission Points
MP1, 2 & 3
MP4MP5
MP6
MP7
MP8 MP9 & 10
MP11
MP120
10000
20000
30000
40000
50000
0 200 400 600 800 1000
Time (min)
Alti
tude
(ft)
Altitude-Time Mission Points
MP1, 2 & 3
MP4MP5
MP6
MP7
MP8 MP9 & 10
MP11
MP12
Figure 3.—Baseline : Mission profile.
Electrical Loads: Climb/Cruise/Descent
0100200300400500600700800900
1000
MP1 MP2 MP3 MP4 MP5 MP6 MP7 MP8 MP9 MP10 MP11 MP12
kW (
Per
Airc
raft
)
All Loads Except Anti-ICE Anti-ICE Loads Figure 4.—Baseline : Electrical loads for climb/cruise/descent mission.
Figure 4 shows the total electrical load requirement for the aircraft for the climb-cruise-descent segment, which includes the aircraft electrical service load, ECS electrical load and the actuation electrical load.
The anti-ice load requirement was taken into account while designing/sizing the APU/engine-mounted-generators for different architectures. However the anti-ice performance/benefits were not evaluated in the ITAPS environment, since the standard day performance mission does not include icing condition. To satisfy the overall electrical load two engine-mounted generators of 450 kW were required. Using the UTC ITAPS tools the baseline system was evaluated. The mission fuel burned during the APU ground operation and that of the flight during the climb-cruise-descent segment were 1849 and 187400 lb, respectively. The Take Off Gross Weight (TOGW) of the baseline system was 571000 lb.
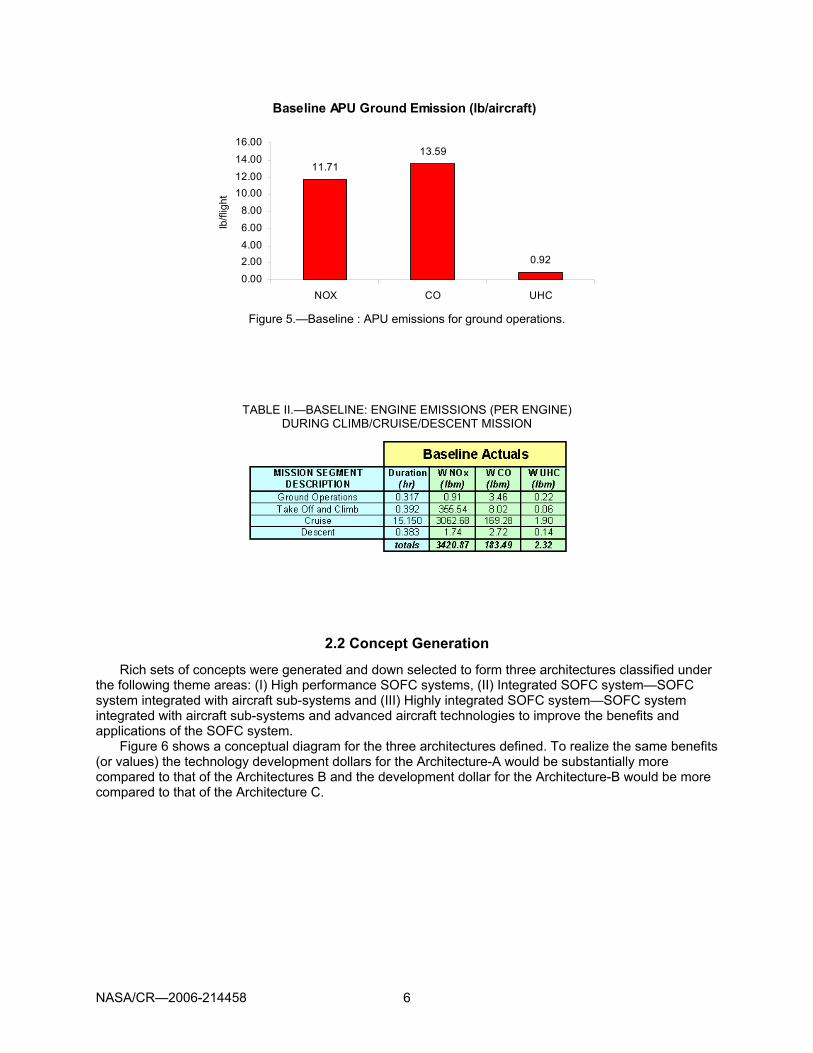
The NOX, UHC and CO emissions for the baseline APU and that of the engine (per engine numbers) are shown in figure 5 and table II. The ground operation time listed for the engine emissions include engine start, taxi-out, and taxi-in. Note that there is not a separate mission point in table I for taxi-in as the importance of including this part of the flight was recognized after running the simulations. This did not pose a problem because the taxi-in segment is essentially the same as the taxi-out segment, which was computed.
NASA/CR—2006-214458 6
Baseline APU Ground Emission (lb/aircraft)
11.7113.59
0.92
0.00
2.004.00
6.00
8.00
10.0012.00
14.00
16.00
NOX CO UHC
lb/fl
ight
Figure 5.—Baseline : APU emissions for ground operations.
TABLE II.—BASELINE: ENGINE EMISSIONS (PER ENGINE) DURING CLIMB/CRUISE/DESCENT MISSION
2.2 Concept Generation
Rich sets of concepts were generated and down selected to form three architectures classified under the following theme areas: (I) High performance SOFC systems, (II) Integrated SOFC system—SOFC system integrated with aircraft sub-systems and (III) Highly integrated SOFC system—SOFC system integrated with aircraft sub-systems and advanced aircraft technologies to improve the benefits and applications of the SOFC system.
Figure 6 shows a conceptual diagram for the three architectures defined. To realize the same benefits (or values) the technology development dollars for the Architecture-A would be substantially more compared to that of the Architectures B and the development dollar for the Architecture-B would be more compared to that of the Architecture C.

NASA/CR—2006-214458 7
Figure 6.—Development costs for chosen architectures.
To illustrate this, consider the following example: Architecture-A with specific power of 0.5 kW/kg
SOFC system requiring Z amount of development dollars to achieve Y fuel burn benefits. Compared to the current technology, about 7X improvement in specific power is needed to achieve the above goal. With integrated system concepts (such as that of Architectures B and C) the overall performance of the SOFC system can be increased with few advances to the aircraft sub-system thereby realizing the benefits (Y) of the Architecture-A with <0.5 kW/kg SOFC system. Therefore the development dollars needed to achieve <7X improvement in weight would be substantially less (<Z) compared to that of the less-integrated systems (Architecture-A). The major concept areas analyzed as a part of different architectures are shown in table III.
TABLE III.—CONCEPTS EMBODIED IN CHOSEN ARCHITECTURES

NASA/CR—2006-214458 8
Figure 7.—2015 SOFC system weight goals.
Figure 8.—Architecture-A: benefits of included concepts.
Architecture-A achieves overall 0.16 percent savings on fuel burn.
2.3 Architecture-A
Architecture A includes the features of the baseline system and two additional architecture concepts: (i) SOFC system serving as an APU in place of the gas turbine APU and (ii) SOFC system operating during the flight climb-cruise-descent segment thereby reducing the engine shaft extractions substantially.
The SOFC system APU is a 450 kW system with efficiency of 53.2 percent at cruise conditions (at full load operation) and 48.4 percent at ground conditions (at full load operation). The SOFC system uses de-sulfurized fuel (de-sulfurization performed on-ground) and weighs 2372 lb. Figure 7 shows the weight distribution for the SOFC system. The weight is based on the following assumptions: (i) 1 kW/kg stack and (ii) 0.5 kW/kg system (without pressure vessel) consistent with other earlier studies. The pressure vessel weight is based on an integral shell design at ground temperature; it should be considered as a lower bound estimate.
For Architecture-A, the APU electric load during the ground operation, the total electrical load requirement for the aircraft for the climb-cruise-descent and the flight climb-cruise-descent operation mission remain the same as that of the baseline system. However, the engine-mounted generators provide the electrical power for the anti-ice loads.
Using the UTC ITAPS tools the Architecture-A system was evaluated. Figure 8 shows the benefits or the penalties of the Architecture-A concepts relative to the baseline system in terms of the percentage equivalent mission fuel burn. Relative to the baseline, the overall system weight increased by 1980 lb (0.43 percent mission fuel burn penalty), drag increased by 32 lb (0.27 percent mission fuel burn penalty), fuel consumption at climb-cruise-descent decreased (equivalent of 0.1 percent mission fuel) and the ground fuel usage decreased (equivalent of 0.76 percent mission fuel burn). The overall mission fuel burn savings for the Architecture-A system is 0.16 percent (as shown in fig. 9). The overall benefit is the sum of the individual contributions.

NASA/CR—2006-214458 9
Figure 9.—Architecture-A : Equivalent fuel burn relative to baseline, showing 0.16 percent fuel burn savings overall.
Figure 10.—Architecture-A : NOx emissions relative to baseline.
For the Architecture-A, the NOX, UHC and CO emissions for the engine and that of the APU relative
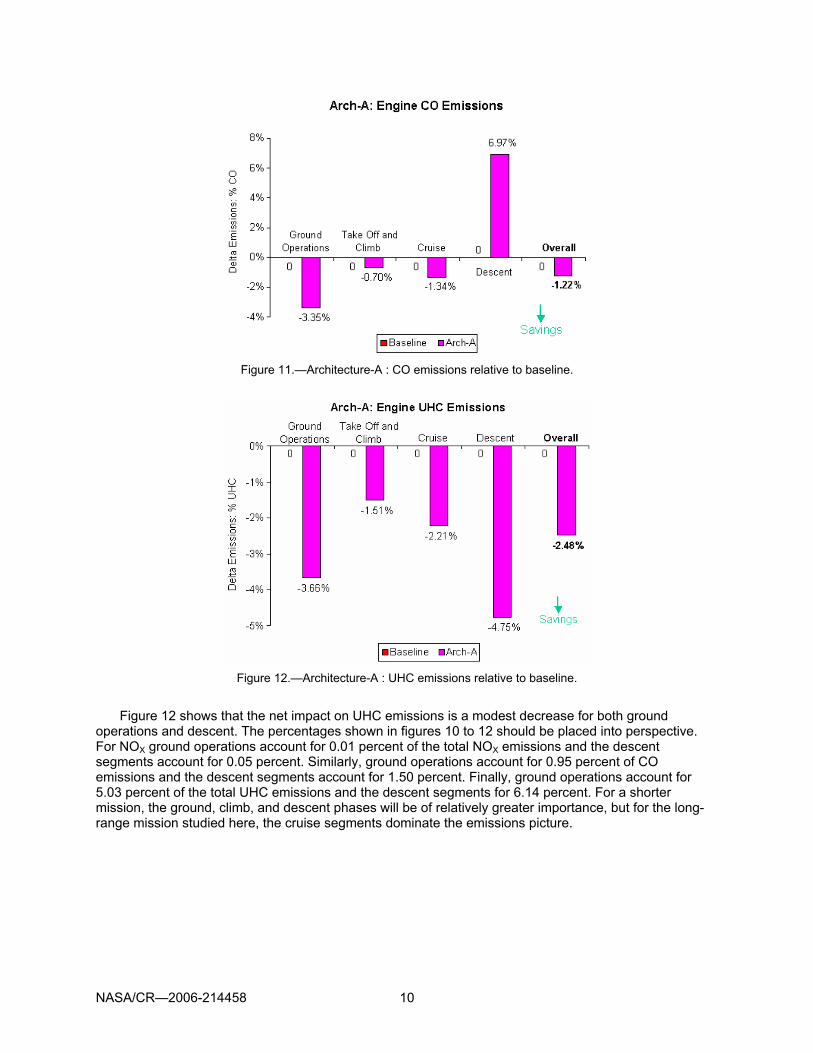
to that of the baseline system are shown in figures 10 to 13, respectively. The SOFC system operates at zero-emissions, (100 percent improvement relative to baseline) and the engine emissions also reduce by 0.06 percent for NOX, 1.22 percent for CO and 2.48 percent for UHC (figs. 11 to 13, respectively). The overall benefit over the entire mission is not simply the sum of the benefits for each segment of the mission. It is effectively a weighted sum where the weighting is dependent on the duration (or total fuel burned) during each segment of the mission.
The large percentage reduction in the NOX emissions (fig. 10) for ground operations and for descent results from the fact that the engine is operating near idle in those mission segments. The reduction in horsepower extracted from the high spool for architecture A represents a sizable fraction of the total energy consumption of the engine and hence a reduction in fuel flow. Associated with that reduction in fuel flow is a reduction in the combustor inlet temperature that decreases the emissions index for NOX. Combined with the reduced fuel flow, the lower emissions index (g of emission per kg of fuel) gives a substantial reduction in the net production of NOX. The reduced combustor temperature leads to a lower combustor efficiency which increases the emissions indices for CO and unburned hydrocarbons. Combined with the reduced fuel flow, there is a small reduction in CO for ground operations and a modest increase in the descent segments (fig. 11).
NASA/CR—2006-214458 10
Figure 11.—Architecture-A : CO emissions relative to baseline.
Figure 12.—Architecture-A : UHC emissions relative to baseline.
Figure 12 shows that the net impact on UHC emissions is a modest decrease for both ground
operations and descent. The percentages shown in figures 10 to 12 should be placed into perspective. For NOX ground operations account for 0.01 percent of the total NOX emissions and the descent segments account for 0.05 percent. Similarly, ground operations account for 0.95 percent of CO emissions and the descent segments account for 1.50 percent. Finally, ground operations account for 5.03 percent of the total UHC emissions and the descent segments for 6.14 percent. For a shorter mission, the ground, climb, and descent phases will be of relatively greater importance, but for the long-range mission studied here, the cruise segments dominate the emissions picture.

NASA/CR—2006-214458 11
Arch-A: APU Emissions
0 0 0
-100% -100% -100%-100%
-80%
-60%
-40%
-20%
0%NOX CO UHC
Del
ta E
mis
sion
s (%
)
Baseline Arch-A
Savings
Arch-A: APU Emissions
0 0 0
-100% -100% -100%-100%
-80%
-60%
-40%
-20%
0%NOX CO UHC
Del
ta E
mis
sion
s (%
)
Baseline Arch-A
SavingsSavings
Figure 13.—Architecture-A : APU emissions relative to baseline;
SOFC APU achieves 100 percent reduction in emissions.
Figure 14.—Architecture B : Benefits of included concepts
achieve 0.44 percent overall fuel burn savings.
2.4 Architecture-B
Architecture-B achieves greater integration between the SOFC and aircraft sub-systems. It includes the features of the Architecture-A system and three additional architecture concepts: (i) SOFC system configuration concept and (ii) SOFC input air concept and (iii) SOFC exhaust gas usage concept. The first concept improves the mission reliability, the second one improves the SOFC system operating efficiency and the third concept improves the mission fuel burn. The SOFC efficiency goes up to 65.4 percent at cruise conditions (at full load operation) and 51.8 percent at ground conditions (at full load operation). For Architecture-B, the APU electric load during the ground operation and the flight climb-cruise-descent operation mission remains the same as that of the baseline system. However, due to the elimination of the inert gas generation system, the total electrical load requirement for the aircraft for the climb-cruise-descent goes down by 4 to 20 kW for different mission points. In addition, the engine-mounted generators provide the electrical power for the anti-ice loads, similar to that of the Architecture-A.
Using the UTC ITAPS tools the Architecture-B system was evaluated. Figure 14 shows the benefits or the penalties of the Architecture-B concepts relative to the baseline system in terms of the percentage equivalent mission fuel burn.
Relative to the baseline, the overall system weight increased by 2134 lb (0.46 percent mission fuel burn penalty), drag increased by 43 lb (0.37 percent mission fuel burn penalty), fuel consumption at climb-cruise-descent decreased (equivalent of 0.49 percent mission fuel) and the ground fuel usage decreased (equivalent of 0.77 percent mission fuel). The overall mission fuel burn savings for the Architecture-B system is 0.44 percent (as shown in fig. 15).
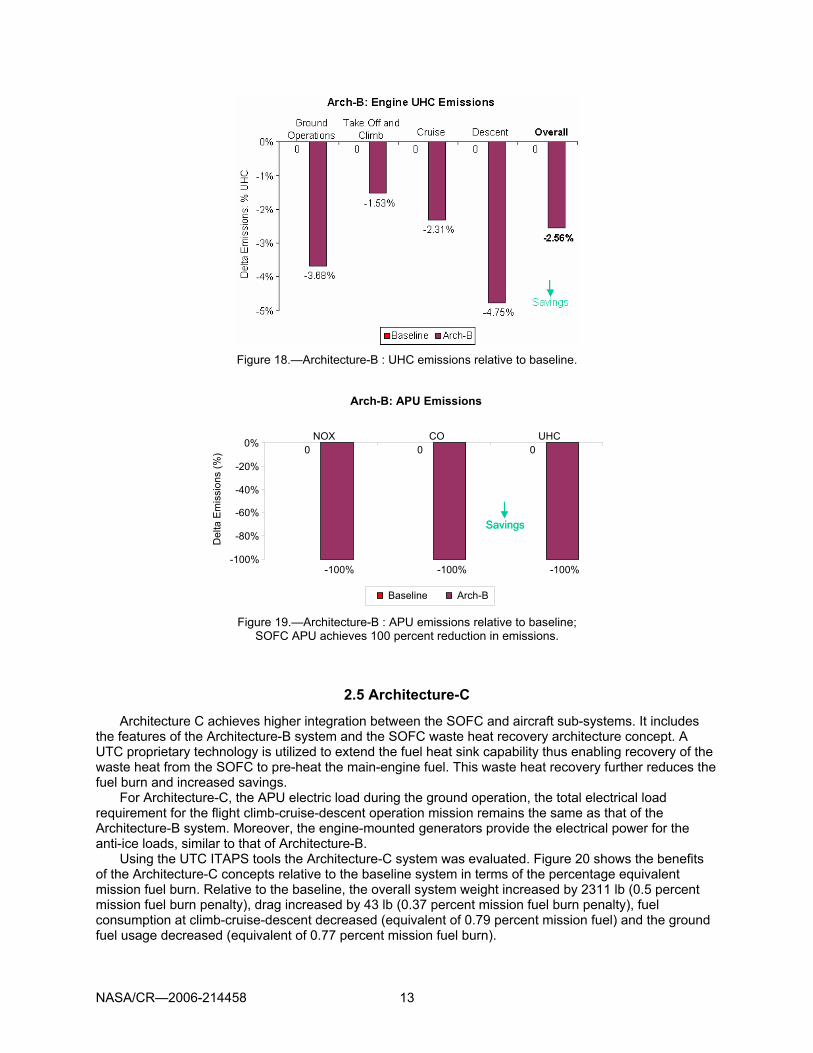
For the Architecture-B, the NOX, UHC, and CO emissions for the engine and that of the APU relative to that of the baseline system are shown in figures 16 to 19, respectively. The SOFC system operates at zero-emissions (100 percent improvement) and the engine emissions increase by 0.06 percent for NOX and decrease by 1.22 percent for CO and 2.56 percent for UHC.

NASA/CR—2006-214458 12
Figure 15.—Architecture B : equivalent fuel burn relative to baseline and Architecture A. Architecture-B
achieves 0.44 percent fuel burn savings and nearly 3X improvement over Architecture-A.
Figure 16.—Architecture-B : NOx emissions relative to baseline.
Figure 17.—Architecture-B : CO emissions relative to baseline
NASA/CR—2006-214458 13
Figure 18.—Architecture-B : UHC emissions relative to baseline.
Arch-B: APU Emissions
0 0 0
-100% -100% -100%-100%
-80%
-60%
-40%
-20%
0%NOX CO UHC
Del
ta E
mis
sion
s (%
)
Baseline Arch-B
Savings
Arch-B: APU Emissions
0 0 0
-100% -100% -100%-100%
-80%
-60%
-40%
-20%
0%NOX CO UHC
Del
ta E
mis
sion
s (%
)
Baseline Arch-B
SavingsSavings
Figure 19.—Architecture-B : APU emissions relative to baseline;
SOFC APU achieves 100 percent reduction in emissions.
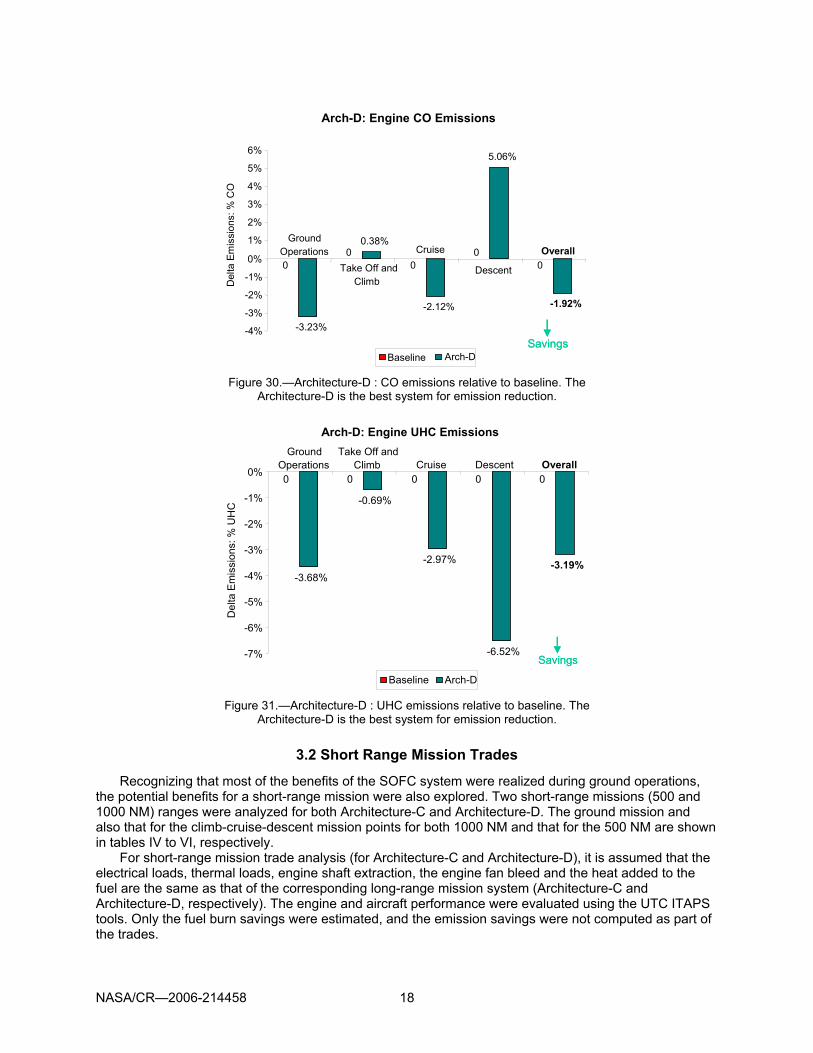
2.5 Architecture-C
Architecture C achieves higher integration between the SOFC and aircraft sub-systems. It includes the features of the Architecture-B system and the SOFC waste heat recovery architecture concept. A UTC proprietary technology is utilized to extend the fuel heat sink capability thus enabling recovery of the waste heat from the SOFC to pre-heat the main-engine fuel. This waste heat recovery further reduces the fuel burn and increased savings.
For Architecture-C, the APU electric load during the ground operation, the total electrical load requirement for the flight climb-cruise-descent operation mission remains the same as that of the Architecture-B system. Moreover, the engine-mounted generators provide the electrical power for the anti-ice loads, similar to that of Architecture-B.
Using the UTC ITAPS tools the Architecture-C system was evaluated. Figure 20 shows the benefits of the Architecture-C concepts relative to the baseline system in terms of the percentage equivalent mission fuel burn. Relative to the baseline, the overall system weight increased by 2311 lb (0.5 percent mission fuel burn penalty), drag increased by 43 lb (0.37 percent mission fuel burn penalty), fuel consumption at climb-cruise-descent decreased (equivalent of 0.79 percent mission fuel) and the ground fuel usage decreased (equivalent of 0.77 percent mission fuel burn).

NASA/CR—2006-214458 14
The overall mission fuel burn savings for Architecture-C system is 0.70 percent (as shown in fig. 21). For Architecture-C, the NOX, UHC, and CO emissions for the engine and that of the APU relative to that of the baseline system are shown in figures 22 to 25, respectively. The SOFC system operates at zero-emissions (100 percent improvement) and the engine emissions decrease by 0.23 percent for NOX, 1.46 percent for CO and 2.89 percent for UHC.
Figure 20.—Architecture-C : Benefit of included concepts.
Architecture-C achieves overall 0.70 percent savings on fuel burn.
Figure 21.—Architecture-C : Equivalent fuel burn relative to baseline and Architectures A and B.
Architecture-C achieves 0.7 percent fuel burn savings and nearly 5X improvement over Architecture-A.
Figure 22.—Architecture-C : NOx emissions relative to baseline.

NASA/CR—2006-214458 15
Figure 23.—Architecture-C : CO emissions relative to baseline.
Figure 24.—Architecture-C : Unburned hydrocarbons
emissions relative to baseline.
Arch-C: APU Emissions
0 0 0
-100% -100% -100%-100%
-80%
-60%
-40%
-20%
0%NOX CO UHC
Del
ta E
mis
sion
s (%
)
Baseline Arch-C
Savings
Arch-C: APU Emissions
0 0 0
-100% -100% -100%-100%
-80%
-60%
-40%
-20%
0%NOX CO UHC
Del
ta E
mis
sion
s (%
)
Baseline Arch-C
SavingsSavings
Figure 25.—Architecture-C : APU emissions relative to baseline; SOFC APU achieves 100 percent reduction in emissions.

NASA/CR—2006-214458 16
3. Additional Architecture Trades The ITAPS evaluation results for the baseline architecture and three fuel cell powered architectures
(Architectures A, B and C), estimated the benefits of a pressurized SOFC system for a long-range commercial aircraft. As an extension, two additional architecture trades have been performed to estimate the benefits of the fuel cell system for one atmosphere pressure operation and also that for a short-range aircraft mission.
3.1 Architecture-D Trades
Architecture-D explored the potential for reducing parasitic power losses due to pressurization by running the Architecture-C SOFC system at one-atmosphere pressure conditions. The SOFC system efficiency decreases during both the cruise and ground operations due to ambient pressure operation. However, the waste heat recovery concept improves the overall aircraft system efficiency and reduces the mission fuel burn. The comparison of the SOFC system efficiency for various architectures is shown in figure 26.
For Architecture-D, the APU electric load during the ground operation, the total electrical load requirement during the flight climb-cruise-descent operation mission remains the same as that of the Architecture-C system. Moreover, the engine-mounted generators provide the electrical power for the anti-ice loads, similar to that of Architecture-B. For Architecture-D trade analysis, it is assumed that the engine shaft extraction and the engine fan bleed are the same as that of Architecture-C. The SOFC system performance and weight due to ambient pressure operation, the thermal management system performance and weight due to the waste heat recovery concept and their impact on the engine and aircraft performance were evaluated using the UTC ITAPS tools.
Figure 27 shows the benefits of the Architecture-D concepts relative to the baseline system in terms of the percentage equivalent fuel burn. Relative to the baseline, the overall system weight increased by 1891 lb (0.41 percent mission fuel burn penalty), drag increased by 41 lb (0.35 percent mission fuel burn penalty), fuel consumption at climb-cruise-descent decreased (equivalent of 0.84 percent mission fuel) and the ground fuel usage decreased (equivalent of 0.70 percent mission fuel). The overall mission fuel burn savings for the Architecture-D system is about 0.77 percent. For the Architecture-D, the NOX, UHC and CO emissions for the APU and that of the engine relative to that of the baseline system are shown in figures 28 to 31, respectively. The SOFC system operates at zero-emissions (100 percent improvement) and the engine emissions decrease by 0.71 percent for NOX, 1.92 percent for CO and 3.19 percent for UHC.
Figure 26.—SOFC system efficiency for architectures examined.

NASA/CR—2006-214458 17
Arch-D: Equivalent Fuel Burn (%)
0.50 0.37
-2.12
1.33
-0.77 -0.70
0.41 0.35
-2.33
1.49
-0.70 -0.77
-3.00
-2.50
-2.00
-1.50
-1.00
-0.50
0.00
0.50
1.00
1.50
2.00
Weight Drag
Engine Performance
SOFC Fuel@Cruise
Ground Fuel Overall
Equi
vale
nt F
uel B
urn
Del
ta (%
)
Arch-C Arch-D
SavingsBaseline
0 00
00 0
Arch-D: Equivalent Fuel Burn (%)
0.50 0.37
-2.12
1.33
-0.77 -0.70
0.41 0.35
-2.33
1.49
-0.70 -0.77
-3.00
-2.50
-2.00
-1.50
-1.00
-0.50
0.00
0.50
1.00
1.50
2.00
Weight Drag
Engine Performance
SOFC Fuel@Cruise
Ground Fuel Overall
Equi
vale
nt F
uel B
urn
Del
ta (%
)
Arch-C Arch-D
SavingsSavingsBaseline
0 00
00 0
Figure 27.—Architecture-D : equivalent fuel burn compared to baseline and Architecture-C;
showing 0.77 percent fuel burn savings overall and 10 percent improvement over Architecture-C.
Arch-D: APU Emissions
0 0 0
-100% -100% -100%-100%
-80%
-60%
-40%
-20%
0%NOX CO UHC
Del
ta E
mis
sion
s (%
)
Baseline Arch-D
Savings
Arch-D: APU Emissions
0 0 0
-100% -100% -100%-100%
-80%
-60%
-40%
-20%
0%NOX CO UHC
Del
ta E
mis
sion
s (%
)
Baseline Arch-D
SavingsSavings
Figure 28.—Architecture-D : Total emissions relative to baseline;
SOFC APU achieves 100 percent reduction in emissions.
Arch-D: Engine NOX Emissions
00
0 0 0
-13.70%
1.19%
-0.92%
-14.32%
-0.71%
-16%
-14%
-12%
-10%
-8%
-6%
-4%
-2%
0%
2% GroundOperations
Take Off andClimb
Cruise Descent Overall
Del
ta E
mis
sion
s: %
NO
X
Baseline Arch-D
Savings
Arch-D: Engine NOX Emissions
00
0 0 0
-13.70%
1.19%
-0.92%
-14.32%
-0.71%
-16%
-14%
-12%
-10%
-8%
-6%
-4%
-2%
0%
2% GroundOperations
Take Off andClimb
Cruise Descent Overall
Del
ta E
mis
sion
s: %
NO
X
Baseline Arch-D
SavingsSavings
Figure 29.—Architecture-D : NOx emissions relative to baseline.
The Architecture-D is the best system for emission reduction.
NASA/CR—2006-214458 18
Arch-D: Engine CO Emissions
00
00
0
-3.23%
0.38%
-2.12%
5.06%
-1.92%
-4%
-3%
-2%
-1%
0%
1%
2%
3%
4%
5%
6%
GroundOperations
Take Off andClimb
Cruise
Descent
Overall
Del
ta E
mis
sion
s: %
CO
Baseline Arch-DSavings
Arch-D: Engine CO Emissions
00
00
0
-3.23%
0.38%
-2.12%
5.06%
-1.92%
-4%
-3%
-2%
-1%
0%
1%
2%
3%
4%
5%
6%
GroundOperations
Take Off andClimb
Cruise
Descent
Overall
Del
ta E
mis
sion
s: %
CO
Baseline Arch-DSavingsSavings
Figure 30.—Architecture-D : CO emissions relative to baseline. The
Architecture-D is the best system for emission reduction.
Arch-D: Engine UHC Emissions
0 0 0 0 0
-3.68%
-0.69%
-2.97%
-6.52%
-3.19%
-7%
-6%
-5%
-4%
-3%
-2%
-1%
0%
GroundOperations
Take Off andClimb Cruise Descent Overall
Del
ta E
mis
sion
s: %
UH
C
Baseline Arch-D
Savings
Arch-D: Engine UHC Emissions
0 0 0 0 0
-3.68%
-0.69%
-2.97%
-6.52%
-3.19%
-7%
-6%
-5%
-4%
-3%
-2%
-1%
0%
GroundOperations
Take Off andClimb Cruise Descent Overall
Del
ta E
mis
sion
s: %
UH
C
Baseline Arch-D
SavingsSavings
Figure 31.—Architecture-D : UHC emissions relative to baseline. The
Architecture-D is the best system for emission reduction.
3.2 Short Range Mission Trades
Recognizing that most of the benefits of the SOFC system were realized during ground operations, the potential benefits for a short-range mission were also explored. Two short-range missions (500 and 1000 NM) ranges were analyzed for both Architecture-C and Architecture-D. The ground mission and also that for the climb-cruise-descent mission points for both 1000 NM and that for the 500 NM are shown in tables IV to VI, respectively.
For short-range mission trade analysis (for Architecture-C and Architecture-D), it is assumed that the electrical loads, thermal loads, engine shaft extraction, the engine fan bleed and the heat added to the fuel are the same as that of the corresponding long-range mission system (Architecture-C and Architecture-D, respectively). The engine and aircraft performance were evaluated using the UTC ITAPS tools. Only the fuel burn savings were estimated, and the emission savings were not computed as part of the trades.

NASA/CR—2006-214458 19
TABLE IV.—SHORT RANGE MISSION WITH MULTIPLE FLIGHTS PER DAY
TABLE V.—1000 NM RANGE MISSION FOR THE FLIGHT CLIMB-CRUISE-DESCENT SEGMENT
TABLE VI.—500 NM RANGE MISSION FOR THE FLIGHT CLIMB-CRUISE-DESCENT SEGMENT
Figures 32 and 33 show the benefits of the short-range mission for that of the Architecture-C and
Architecture-D, respectively relative to the baseline system in terms of the percentage equivalent fuel burn. For short-range B777-200ER aircraft mission, the overall mission fuel burn savings for the Architecture-C is about 3.57 percent for 500 NM and 2.55 percent for 1000 NM (as shown in fig. 32). Similarly, for the Architecture-D system, the overall mission fuel burn savings is about 3 percent for 500 NM and 2.23 percent for 1000 NM (as shown in fig. 33).

NASA/CR—2006-214458 20
Figure 32.—Architecture-C : Fuel burn savings for all missions. SOFC
system leads to higher fuel burn savings in short-range missions
Figure 33.—Architecture-D : Fuel burn savings for all missions. SOFC
system leads to higher fuel burn savings in short-range missions.
4. Technology Planning The key technology development areas for the SOFC system application for the long-range
commercial aircraft are presented in this section. The areas for development were identified based on comparing the current status of the key components and sub-systems technologies with that of the year 2015 goals/requirements.
4.1 Summary of Key Technologies
The key components/sub-systems for development and its requirements can be categorized into three sections (as listed below):
• SOFC System
o Develop SOFC Stack (for 1 kW/kg stack, >40 K hr life, 0.01 percent/T.C., 0.5 kW/kg system) o Develop Jet-A Fuel De-Sulfurizer (fuel intake composition of 300 to 1000ppm sulfur, outlet
fuel composition of <1ppm sulfur) o Develop Jet-A Fuel Reformer (with >95 percent fuel conversion and size <25 kg/25 L)
• Aircraft Integration (being addressed by the existing technology plans)

NASA/CR—2006-214458 21
o Develop desiccant system to ensure dry air (–65 °F dew point) for inerting (exhaust gas usage concept).
o Resolve aircraft power quality issues for generator and electrical power distribution related to More Electric Aircraft (Federal Aviation Regulation FAR Chapter-25).
• Advanced Aircraft Technologies o Extend fuel heat sink to 800 °F (from 325 °F)
The technology development areas listed under the “Aircraft Integration” section are already being
addressed by the existing technology plans (such as the power by wire programs). Regarding, the area listed under the “advanced aircraft technology”, a UTC proprietary technology and roadmap exists. The following sub-sections detail the technology planning for the SOFC system components.
4.2 SOFC De-Sulfurizer
The current technology for the de-sulfurizer is in Technology Readiness Level (TRL) 2. The year 2015 requirements, technology gaps and the roadmap for the de-sulfurizer are presented below.
4.2.1 Year 2015 Requirements/Goals The year 2015 requirements/goals for the SOFC de-sulfurizer are listed below for both on-ground de-
sulfurization system and also that for the non-regenerative on-board de-sulfurization system. • Lifetime: 1 year (on-ground system) and 1 day (on-board system) • Fuel: Reformate (Jet-A fuel) • Fuel composition: 300 to 1000 ppm sulfur • Outlet fuel composition: <=1 ppm sulfur • Percent sulfur at breakthrough: 0.22 percent (on-ground) and 1.5 percent (on-board) • Size (for 225 kW system): 400 kg (on-ground) and 60 kg (on-board)
4.2.2 Technology Gaps The technology gaps for the de-sulfurizer system comparing the current best practices/technology
with that of the year 2015 goals/requirements are listed below. • Percent sulfur breakthrough increase by factor of 1.5 • Sorbent weight decrease by factor of 2
4.2.3 Roadmap The key recommendations for the de-sulfurizer development are (i) To consider development of on-
board de-sulfurization techniques in parallel with that of the on-ground de-sulfurization. (ii) The environmental factors should be evaluated in selecting the material for the de-sulfurizer. Figure 34 shows the top-level roadmap for the de-sulfurizer development. In this roadmap, BT refers to the sulfur breakthrough. The key milestone accomplishments in terms of the year and the TRL reached for the de-sulfurizer are shown.

NASA/CR—2006-214458 22
Figure 34.—Roadmap for de-sulfurizer technology development.
4.3 SOFC Reformer
The current technology for the SOFC fuel reformer is in Technology Readiness Level (TRL) 2. The year 2015 requirements, technology gaps and the roadmap for the reformer are presented below.
4.3.1 Year 2015 Requirements/Goals The year 2015 requirements/goals for the SOFC reformer are listed below. • Lifetime: 10000 hr • Performance: >=95 percent fuel conversion • Size: <=25 kg/25L (per 225 kW system)
4.3.2 Technology Gaps The technology gaps for the reformer system comparing the current best practices/technology with
that of the year 2015 goals/requirements are listed below. • Highly active and stable catalyst development. • Fuel reformer size decrease by factor of 2
4.3.3 Roadmap The key recommendations for the reformer development are: (i) To develop new catalyst materials
and supports and (II) Consider modified Auto Thermal Reformer (ATR) type designs. Figure 35 shows the top-level roadmap for the reformer technology development. The key milestone accomplishments in terms of the year and the TRL reached for the reformer are shown.

NASA/CR—2006-214458 23
Figure 35.—Roadmap for reformer technology development.
4.4 SOFC Stack
The current technology for the SOFC stack is in Technology Readiness Level (TRL) 3-4 and that for the SOFC system is in TRL-2. The year 2015 requirements, technology gaps and the roadmap are presented below. The high-level roadmap presented includes all the other key sub-systems as well.
4.4.1 Year 2015 Requirements/Goals The year 2015 requirements/goals for the SOFC stack and the system are listed below. • Lifetime: 40000 hr • Robustness to thermal cycling (TC): 0.01 percent/T.C. • Fuel: Reformate • Fuel utilization: 85 percent • Stack specific power: 1 kW/kg • System specific power: 0.5 kW/kg
4.4.2 Technology Gaps The technology gaps for the SOFC stack and the system comparing the current best practices/
technology with that of the year 2015 goals/requirements are listed below. • Current technology does not meet lifetime and thermal cycling durability. • Stack specific power is off by 4X in best case. • System specific power is off by 7X for the best case. • Start-up time is off by several hours. • Cost targets $400/kW.

NASA/CR—2006-214458 24
Figure 36.—Roadmap for SOFC system technology development.
4.4.3 Roadmap The key recommendations for the SOFC stack and system development are: (I) Need paradigm shift
in stack and system concepts and (II) Substantial new investment in stack development. The above two recommendations are based on the fact that the current SECA technologies will limit the maximum specific power (kW/kg) that can be reached for the stack and achieving 0.5 kW/kg system is not a reality. High specific power concepts (such as the UTC proprietary concept presented during the contract final review) will achieve the 2015 goals. Figure 36 shows the top-level roadmap for the SOFC system technology development. The key milestone accomplishments in terms of the year and the TRL reached for the SOFC system and other key technologies are also shown.
5. Discussion of Results 5.1 Fuel Burn Benefits
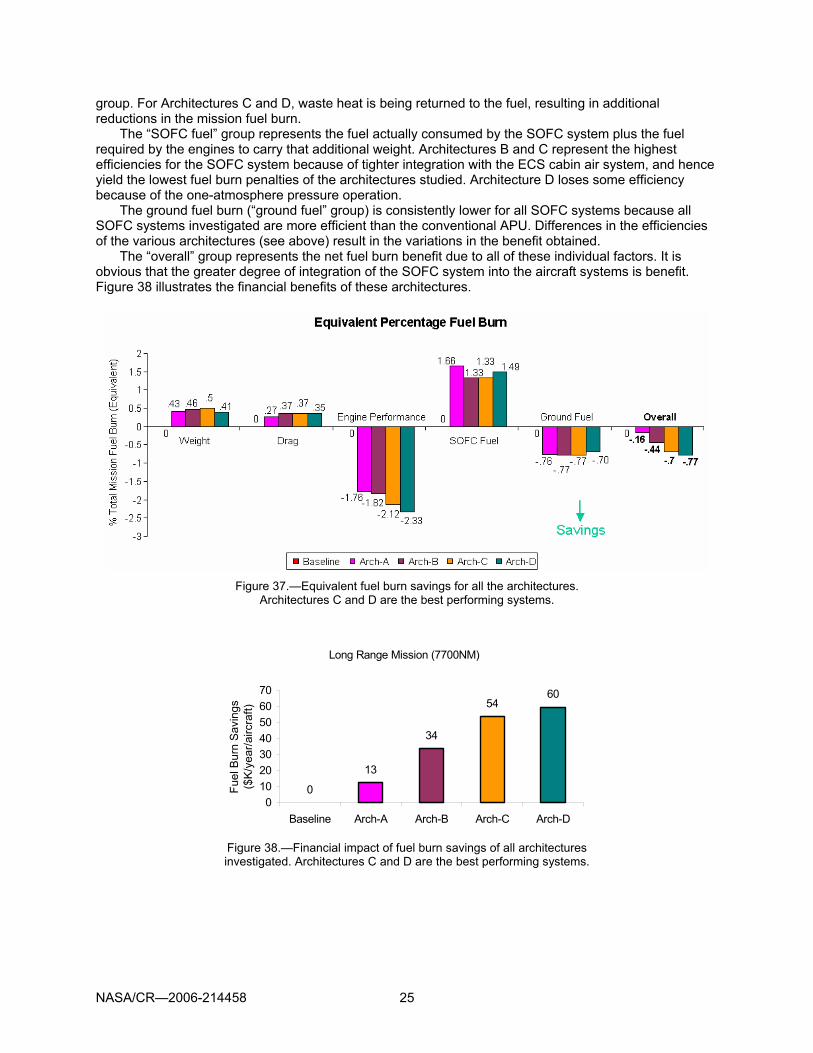
The impact of the changes embodied in the four architectures studied is shown in figure 37. Replacing the conventional APU with an SOFC system resulted in a weight increase (1980 lb for Architecture A). This weight increase consistently led to an increase in mission fuel burn, with the differences in the SOFC weights for the different architectures accounting for the different fuel burn penalties shown in the “weight” group below. Architecture-A is the most basic SOFC system. Architectures B and C required additional hardware to achieve greater integration with the aircraft systems. In Architecture-D the weight was lower than for the other architectures because the stack was run at ambient pressure and did not require a pressure vessel.
All SOFC system architectures required an air source during flight when a conventional APU would be shut down. The ram drag required to obtain this air, and the loss in cabin air thrust recovery for Architectures B, C, and D resulted in increased mission fuel burn, which is shown in the “drag” group.
The use of the SOFC system reduced the extractions required from the engine (shaft power and bleed air) and thus resulted in a decrease in the mission fuel burn shown in the “engine performance”
NASA/CR—2006-214458 25
group. For Architectures C and D, waste heat is being returned to the fuel, resulting in additional reductions in the mission fuel burn.
The “SOFC fuel” group represents the fuel actually consumed by the SOFC system plus the fuel required by the engines to carry that additional weight. Architectures B and C represent the highest efficiencies for the SOFC system because of tighter integration with the ECS cabin air system, and hence yield the lowest fuel burn penalties of the architectures studied. Architecture D loses some efficiency because of the one-atmosphere pressure operation.
The ground fuel burn (“ground fuel” group) is consistently lower for all SOFC systems because all SOFC systems investigated are more efficient than the conventional APU. Differences in the efficiencies of the various architectures (see above) result in the variations in the benefit obtained.
The “overall” group represents the net fuel burn benefit due to all of these individual factors. It is obvious that the greater degree of integration of the SOFC system into the aircraft systems is benefit. Figure 38 illustrates the financial benefits of these architectures.
Figure 37.—Equivalent fuel burn savings for all the architectures.
Architectures C and D are the best performing systems.
Long Range Mission (7700NM)
0
13
34
5460
010203040506070
Baseline Arch-A Arch-B Arch-C Arch-D
Fuel
Bur
n S
avin
gs
($K/
year
/airc
raft)
Figure 38.—Financial impact of fuel burn savings of all architectures investigated. Architectures C and D are the best performing systems.

NASA/CR—2006-214458 26
5.2 Emissions
None of the SOFC systems studied produce any NOx, CO, or UHC. The use of an SOFC system in place of a conventional APU impacts the emissions from the engine in a number of ways. The main impact is through the change in fuel burn as discussed in section 5.1. The changes in engine extractions cause some changes in the temperatures and pressures inside the engine for a given thrust level; hence, the emissions do not track exactly with fuel burn. The engine and aircraft emissions for the four architectures relative to the baseline are shown in figures 39 and 40.
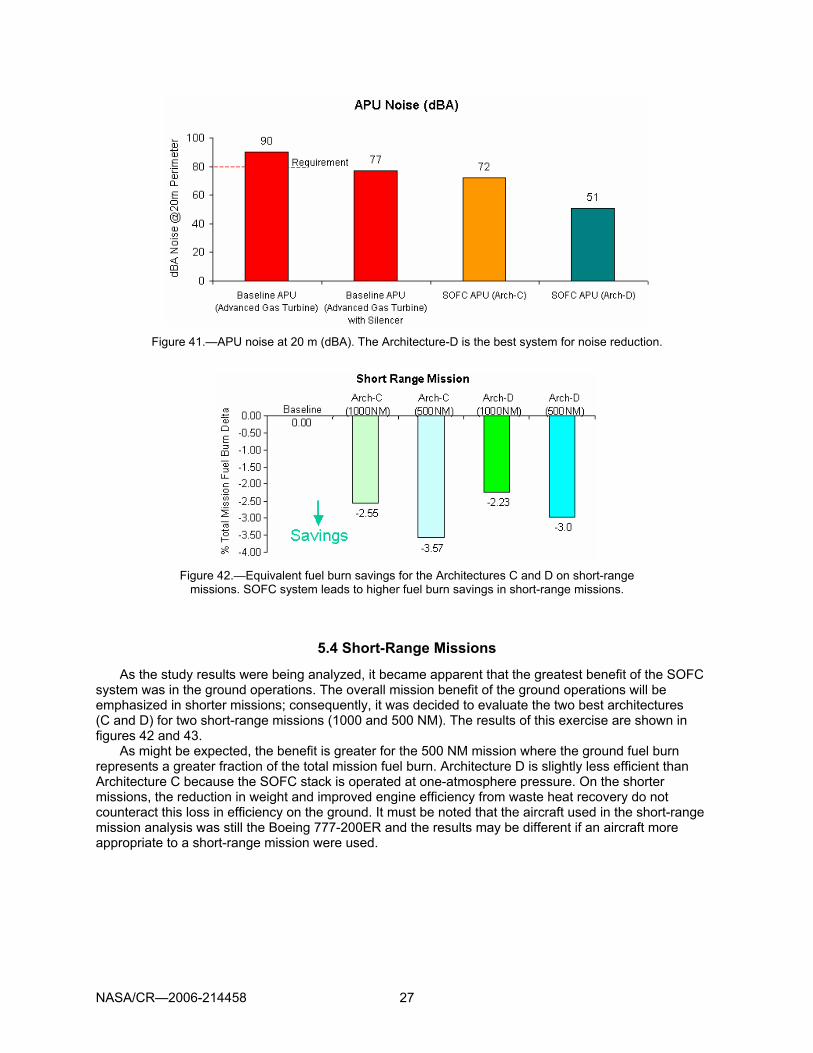
5.3 APU Noise
While prediction of the noise levels of the SOFC APU was not part of the contract, a preliminary estimate was made of the noise levels for ground operations. The noise level at 20 m is shown in figure 41 for the baseline APU and for the SOFC APU of Architectures C and D. Without a silencer, the conventional APU exceeds the 80 dBA noise requirement, but with the addition of a silencer, the requirement is met. The Architecture C SOFC APU is significantly under the requirement at 72 dBA with the main noise contribution coming from the combustion noise of the turbo-machinery necessary to pressurize the stack for ground operations. The Architecture-D APU is operated at ambient pressure and does not need that turbo-machinery. The resulting noise level is only 51 dBA.
Engine Emissions (%)
0 0 0-0.06%
-1.22%
-2.48%
0.06%
-1.22%
-2.56%
-0.23%
-1.46%
-2.89%
-0.71%
-1.92%
-3.19%
-3.0%
-2.5%
-2.0%
-1.5%
-1.0%
-0.5%
0.0%
NOX
CO UHC
% E
mis
sion
s
Baseline Arch-A Arch-B Arch-C Arch-D
Savings
Engine Emissions (%)
0 0 0-0.06%
-1.22%
-2.48%
0.06%
-1.22%
-2.56%
-0.23%
-1.46%
-2.89%
-0.71%
-1.92%
-3.19%
-3.0%
-2.5%
-2.0%
-1.5%
-1.0%
-0.5%
0.0%
NOX
CO UHC
% E
mis
sion
s
Baseline Arch-A Arch-B Arch-C Arch-D
SavingsSavings
Figure 39.—Engine emissions for complete mission relative to baseline.
The Architecture-D is the best system for emission reduction.
Figure 40.—Aircraft emissions for complete mission relative to baseline.
The Architecture-D is the best system for emission reduction.
NASA/CR—2006-214458 27
Figure 41.—APU noise at 20 m (dBA). The Architecture-D is the best system for noise reduction.
Figure 42.—Equivalent fuel burn savings for the Architectures C and D on short-range
missions. SOFC system leads to higher fuel burn savings in short-range missions.
5.4 Short-Range Missions
As the study results were being analyzed, it became apparent that the greatest benefit of the SOFC system was in the ground operations. The overall mission benefit of the ground operations will be emphasized in shorter missions; consequently, it was decided to evaluate the two best architectures (C and D) for two short-range missions (1000 and 500 NM). The results of this exercise are shown in figures 42 and 43.
As might be expected, the benefit is greater for the 500 NM mission where the ground fuel burn represents a greater fraction of the total mission fuel burn. Architecture D is slightly less efficient than Architecture C because the SOFC stack is operated at one-atmosphere pressure. On the shorter missions, the reduction in weight and improved engine efficiency from waste heat recovery do not counteract this loss in efficiency on the ground. It must be noted that the aircraft used in the short-range mission analysis was still the Boeing 777-200ER and the results may be different if an aircraft more appropriate to a short-range mission were used.

NASA/CR—2006-214458 28
Figure 43.—Financial impact of fuel burn savings for short range missions.
SOFC system leads to higher fuel burn savings in short-range missions.
Figure 44.—Benefits of various modes of operation for SOFC APU. Best benefit is achieved
for SOFC system operating at both ground and climb-cruise-descent operation.
5.5 SOFC System Trades
Figure 44 presents the benefits and penalties of various ways in which an SOFC system might be used. First, it is possible to use the SOFC system as a ground cart with a conventional gas turbine APU on board for emergency power. This application provides benefit during ground operations because the SOFC is more efficient than a conventional gas turbine APU.
The benefit comes without the penalty of increased weight because the SOFC unit stays on the ground. The second option explored was to simply replace the gas turbine APU with an SOFC equivalent, which is only used during ground operations. This approach yields less benefit because the aircraft has to carry the increased weight of the SOFC APU. A third option would be to use an SOFC system as a secondary power source during the climb, cruise, and descent portions of the mission instead of extracting the power from the engines. While this strategy unloads the engines, there is a net penalty because of the weight and drag associated with the SOFC system. The final option considered is to replace the conventional APU with an SOFC system, which is used both for ground operations and as a secondary power source during the flight. This option yields the greatest benefits.

NASA/CR—2006-214458 29
Figure 45.—Benefits of Architecture B exhaust
gas usage concept with SOFC in tailcone.
Figure 46.—Benefits of Architecture C waste heat recovery
and exhaust gas usage concepts with SOFC in tailcone.
Determining the optimal location of the SOFC APU was not within the scope of the contract; however,
the impact of locating the SOFC APU in the tail cone as is common with a conventional APU was considered. Preliminary results shown in figures 45 and 46 indicate that the weight penalty of the ducting necessary to accomplish waste heat recovery into the fuel and the use the SOFC exhaust effectively negate the expected benefits of the waste heat recovery and exhaust gas usage concepts. Location of the SOFC APU in the wing root region appears more attractive.
5.6 Impact of SOFC System Weight
The study was done with certain goals for SOFC system weights in the year 2015. The basic power density used in this study was 0.5 kW/kg for the SOFC system. This assumption is consistent with other similar studies. The weight of the pressure vessel and any additional equipment was assumed to be in addition to the weight calculated from this power density figure. The impact of additional SOFC system weight increase relative to this goal was estimated and is presented in figure 47. The better architectures can accommodate significant weight gains and still match the fuel burn of the baseline system. For example, Architecture D can accommodate an additional 3600 lb of weight and still break even on fuel burn. The full benefit in ground emissions savings would still be realized. In flight, the increased system weight will negate some of the emissions benefits.
The net power density for each architecture and the power density corresponding to zero fuel burn benefit (i.e., the break even points) is shown in figure 48.

NASA/CR—2006-214458 30
Effect of Additional SOFC System Weight On Benefits System
-1
-0.8
-0.6
-0.4
-0.2
0
0.2
0.4
0.6
0.8
0 400 800 1200 1600 2000 2400 2800 3200 3600 4000
Additional SOFC System Weight
% T
otal
Mis
sion
Fue
l Bur
n D
elta
Arch-A Arch-B Arch-C Arch-D
Additional SOFC System Weight (in lb)
Effect of Additional SOFC System Weight On Benefits System
-1
-0.8
-0.6
-0.4
-0.2
0
0.2
0.4
0.6
0.8
0 400 800 1200 1600 2000 2400 2800 3200 3600 4000
Additional SOFC System Weight
% T
otal
Mis
sion
Fue
l Bur
n D
elta
Arch-A Arch-B Arch-C Arch-D
Additional SOFC System Weight (in lb)
Figure 47.—Effect of additional SOFC system weight on the fuel burn benefits.
2015 SOFC System Weight Goals and
Break-Even-Points (No Fuel Burn Savings)
0.42 0.41 0.410.52
0.320.22 0.18 0.18
0.000.100.200.300.400.500.60
Arch-A Arch-B Arch-C Arch-DSpec
ific
Pow
er (k
W/k
g)
CY2015 Goal Break Even Points (No Fuel Burn Savings)
2015 SOFC System Weight Goals andBreak-Even-Points (No Fuel Burn Savings)
0.42 0.41 0.410.52
0.320.22 0.18 0.18
0.000.100.200.300.400.500.60
Arch-A Arch-B Arch-C Arch-DSpec
ific
Pow
er (k
W/k
g)
CY2015 Goal Break Even Points (No Fuel Burn Savings) Figure 48.—Year 2015 SOFC system weight goals and the break even points (no fuel burn savings).
6. Conclusions This study selected a more-aggressive year 2015 aircraft baseline system (UEET engines, advanced
APU with ceramics and more-electric aircraft sub-system concepts). The potential benefits (emissions, noise and fuel burn) of the SOFC system application were quantified relative to this long-range commercial aircraft baseline system. The key technology development areas and potential future study areas were also presented.
System integration is critical to maximize benefits from the SOFC APU for aircraft applications and will minimize the technology development cost/time. The mission fuel burn savings for Architecture-A, which has minimal system integration, is 0.16 percent. Architecture-B and Architecture-C employ greater system integration and obtain fuel burn benefits of 0.44 and 0.70 percent, respectively. Architecture-D represents the highest level of integration and obtains a benefit of 0.77 percent.
To realize any fuel burn benefit from an SOFC system for a long-range commercial aircraft, the SOFC system specific power should be >0.18 kW/kg (best case SOFC system—Architecture C/D). The SOFC system specific power will not affect the ground APU emission benefits; however, the engine emissions will increase due to increased fuel burn for increases in the SOFC system weight.
A paradigm shift is needed in the SOFC stack concepts to achieve the year 2015 goal metrics (weight, life, etc.). This is based on the 4X improvement needed for the stack weight and 7X improvement

NASA/CR—2006-214458 31
needed for the SOFC system weight, based on the current state of the art technologies. The SECA-funded programs will not achieve the required specific power metrics. This is due to the limitation imposed by the ceramic technology for the anode-supported-cells, which restricts the SOFC system weight reduction to 0.5 kW/kg. NASA should fund the development of stack concepts (such as the UTC proprietary concepts presented during the contract final review) that increase the specific power of the SOFC system (kW/kg) for aircraft applications.
NASA should fund the development of on-ground de-sulfurization and non-regenerable on-board de-sulfurization for the processing of jet-A fuel (with sulfur levels of 300 to 1000 ppm). NASA should fund the development of advanced technologies (such as the UTC proprietary concept presented during the contract final review) to extend fuel heat sink capability above the current 325 °F limit.
The SOFC system provides more benefits to short-range mission aircraft. Preliminary analysis of the short-range mission (500 NM) for the B777-200ER aircraft shows about 3 percent mission fuel burn benefits compared to about 0.7 percent mission fuel burn benefit for the long-range mission (7700 NM). It is recommended that NASA fund a future study on SOFC system applications for short-range mission aircraft.
The SOFC system location should be closer to wing roots (or engine) to maximize system integration benefits. The benefits due to the waste heat recovery and the exhaust gas utilization concepts will not be realized if the SOFC APU is in the tail cone. Therefore, a future study should be performed to determine the optimal location of the SOFC-APU system in the aircraft.
Any future system study on the SOFC system application for the aircraft should also evaluate the cost goals of the SOFC system for the year 2015.
References 1. A.D. Liang, "NASA Fuel Cell Power System Development for Aerospace Vehicles,” 2004 Fuel Cell
Seminar, San Antonio, TX, Nov. 1–5, 2004. 2. C. Song and X. Ma, “Applied Catalysis B” : Environmental vol. 41, 2003, pp. 207–238. 3. DOE Report, "Monthly Electric Utility Sales and Revenue Report with State Distribution", Energy
Information Administration, Form EIA-826, December 2003.


NASA/CR—2006-214458 33
Appendix—Symbols Symbol Description Units M Mass Flow kilograms /.sec P Pressure atmospheres T Temperature degrees Fahrenheit Acronym Meaning APU Auxiliary Power Unit ATR Auto Thermal Reformer BCA Best Cruising Altitude CO Carbon Monoxide DOE Department of Energy ECS Environmental Control System EPS Electrical Power System EIS Entry into Service ITAPS Integrated Total Aircraft Power Systems (United Technology Corporation) KW kilowatts MEA More Electric Aircraft NM Nautical Mile NOx Oxides of Nitrogen ppm Parts per Million SECA Solid-state Energy Conversion Alliance SOFC Solid Oxide Fuel Cell TMS Thermal Management System TRL Technology Readiness Level UEET Ultra Efficient Engine Technology UHC Unburned Hydrocarbons
This publication is available from the NASA Center for AeroSpace Information, 301–621–0390.
REPORT DOCUMENTATION PAGE
2. REPORT DATE
19. SECURITY CLASSIFICATION OF ABSTRACT
18. SECURITY CLASSIFICATION OF THIS PAGE
Public reporting burden for this collection of information is estimated to average 1 hour per response, including the time for reviewing instructions, searching existing data sources,gathering and maintaining the data needed, and completing and reviewing the collection of information. Send comments regarding this burden estimate or any other aspect of thiscollection of information, including suggestions for reducing this burden, to Washington Headquarters Services, Directorate for Information Operations and Reports, 1215 JeffersonDavis Highway, Suite 1204, Arlington, VA 22202-4302, and to the Office of Management and Budget, Paperwork Reduction Project (0704-0188), Washington, DC 20503.
NSN 7540-01-280-5500 Standard Form 298 (Rev. 2-89)Prescribed by ANSI Std. Z39-18298-102
Form ApprovedOMB No. 0704-0188
12b. DISTRIBUTION CODE
8. PERFORMING ORGANIZATION REPORT NUMBER
5. FUNDING NUMBERS
3. REPORT TYPE AND DATES COVERED
4. TITLE AND SUBTITLE
6. AUTHOR(S)
7. PERFORMING ORGANIZATION NAME(S) AND ADDRESS(ES)
11. SUPPLEMENTARY NOTES
12a. DISTRIBUTION/AVAILABILITY STATEMENT
13. ABSTRACT (Maximum 200 words)
14. SUBJECT TERMS
17. SECURITY CLASSIFICATION OF REPORT
16. PRICE CODE
15. NUMBER OF PAGES
20. LIMITATION OF ABSTRACT
Unclassified Unclassified
Final Contractor Report
Unclassified
1. AGENCY USE ONLY (Leave blank)
10. SPONSORING/MONITORING AGENCY REPORT NUMBER
9. SPONSORING/MONITORING AGENCY NAME(S) AND ADDRESS(ES)
National Aeronautics and Space AdministrationWashington, DC 20546–0001
Available electronically at http://gltrs.grc.nasa.gov
December 2006
NASA CR—2006-214458/VOL1
E–15722
WBS 561581.02.08.03.06.01NAS3–01138 Task 20
38
Solid Oxide Fuel Cell APU Feasibility Study for a Long Range CommercialAircraft Using UTC ITAPS ApproachVolume I: Aircraft Propulsion and Subsystems Integration Evaluation
Hari Srinivasan, Jean Yamanis, Rick Welch, Sonia Tulyani, and Larry Hardin
Auxiliary power unit; Auxiliary power system; Fuel cells; Hybrid fuel cell; Solid oxidefuel cell
Unclassified -UnlimitedSubject Category: 07
United Technologies Research Center411 Silver LaneEast Hartford, Connecticut 06108
Hari Srinivasan, Jean Yamanis, Rick Welch, Sonia Tulyani, and Larry Hardin, United Technologies Research Center,411 Silver Lane, East Hartford, Connecticut 06108. Project Manager, James F. Walker, Vehicle Systems ProjectsDivision, Glenn Research Center, 216–433–8004.
The objective of this contract effort was to define the functionality and evaluate the propulsion and power systembenefits derived from a Solid Oxide Fuel Cell (SOFC) based Auxiliary Power Unit (APU) for a future long rangecommercial aircraft, and to define the technology gaps to enable such a system. The study employed technologiescommensurate with Entry into Service (EIS) in 2015. United Technologies Corporation (UTC) Integrated Total AircraftPower System (ITAPS) methodologies were used to evaluate system concepts to a conceptual level of fidelity. Thetechnology benefits were captured as reductions of the mission fuel burn and emissions. The baseline aircraft consid-ered was the Boeing 777-200ER airframe with more electric subsystems, Ultra Efficient Engine Technology (UEET)engines, and an advanced APU with ceramics for increased efficiency. In addition to the baseline architecture, fourarchitectures using an SOFC system to replace the conventional APU were investigated. The mission fuel burn savingsfor Architecture-A, which has minimal system integration, is 0.16 percent. Architecture-B and Architecture-C employgreater system integration and obtain fuel burn benefits of 0.44 and 0.70 percent, respectively. Architecture-D repre-sents the highest level of integration and obtains a benefit of 0.77 percent.