Embed Size (px)
Citation preview

GENDERSTATISTICS2015
COPENHAGEN BUSINESS SCHOOLSOLBJERG PLADS 32000 FREDERIKSBERGDENMARKTEL: +45 3815 3815E-MAIL: [email protected]
TEXT & LAYOUTCOUNCIL FOR DIVERSITY AND INCLUSION, COMMUNICATIONS
PHOTO BYMADS NISSEN
PRODUCTIONGRAFISK RÅDGIVNING APS
DESIGN CONCEPT1508 A/S
PRINTEDOCTOBER 2016

3
GEN
DER
STAT
ISTI
CS 2
015
With the distinctiveness of its diversity, Copenhagen Business School aims to become a world-leading business university. Diversity in academic disci-plines, research methods and programmes has been a major contributing fac-tor to CBS’ remarkable development over the last decades. We also believe that diversity in our faculty, staff and students shapes our thinking and leads to more creative and innovative ideas and solutions. This booklet is dedicated to create awareness about gender imbalances at CBS. I am convinced that the documented skewed gender balance will not change by itself within a reasonable timeframe, and that unconscious gender bias plays a role in our evaluation and selection of talent. Furthermore, according to research a positive development in the gender balance will only be furthered if the issue has the attention of the Top Management. That is why I am chairing the CBS Council for Diversity and Inclusion, established in recognition that CBS faces a general challenge in ensuring a better gender balance in both academic and administrative posi-tions and leadership. The purpose of the Council for Diversity and Inclusion is to take initia-tives that will facilitate a broader use of the talent base. I see these initiatives as part of a one hundred year long process in Denmark, where the univer-sities have continuously and gradually included yet unused talent to the benefit of Danish society.
Per Holten-Andersen,President
WHEREBUSINESSMEANSUNIVERSITY

5
GEN
DER
STAT
ISTI
CS 2
015THE CBS LEAKING PIPEL INE, POPULATION
The figure shows the gender composition among students and academicstaff at CBS from bachelor students to full professor in four select years: 1999, 2005, 2010 and 2015.
The leaking pipeline metaphor refers to the continuous loss of women in academia as the climb the career ladder.
The figure shows that in 2015 men constitute around half of the employees at the level of assistant professor, while more than 80 % of the full professors are male. Thus, in 16 years CBS has managed to create gender balance until the level of assistant professor.
However, the gender imbalance at the level of full professor hasn’t changed. CBS data show that qualified female candidates for academic positions are hired in a larger share than their share of the qualified applicants. Thus, CBS has decided to work towards increasing the number of qualified female applicants for full professorships.
This target has been included in the CBS Development Contract for 2015–2017.
SOURCE Moderniseringsstyrelsen (Agency for Modernisation, Ministry of Finance)
SHARE OF WOMEN/MEN IN ACADEMIC STAFF AND STUDENTS
0%
25%
50%
75%
100%2015 Men
2010 Men
2005 Men
1999 Men
2015 Women
2010 Women
2005 Women
1999 Women

7
GEN
DER
STAT
ISTI
CS 2
015THE CBS LEAKING PIPEL INE, RECENT
RECRUITMENTS
The bottom figure and the table show the gender composition of newly recruited academic staff at CBS from 2011 to 2015.
In each of the years between 44% and 58% of the academic staff recruited to the position as assistant professor/post doc are male. In 2015 55% of the academic staff recruited are male.
Between 64% and 100% of the academic staff recruited to the position as professor mso are male in each of the years 2011 to 2015. In 2015 100% of the academic staff recruited are male. Similarly, between 57% and 92% of the academic staff recruited to the position as professor are male. In 2015 57% of the academic staff recruited are male.
Please note that the numbers are relatively small and thus even small variations between years will appear to be significant.
SOURCE CBS (HR)
0%
25%
50%
75%
100%2015 Men
2010 Men
2005 Men
1999 Men
2015 Women
2010 Women
2005 Women
1999 Women
0%
25%
50%
75%
100%
Assistant
professor/postdoc
Associate professor Professor mso Professor
2015 Men
2014 Men
2013 Men
2012 Men
2011 Men
2015 Women
2014 Women
2013 Women
2012 Women
2011 Women
2011 2012 2013 2014 2015
Men Women Men Women Men Women Men Women Men Women
Assistant prof./postdoc 13 13 29 21 17 22 11 11 17 14
Associate professor 10 6 19 12 22 12 4 6 7 3
Professor mso 6 2 8 4 7 4 4 1 2 0
Professor 9 3 11 1 12 1 10 5 4 3
SHARE OF WOMEN/MEN IN ACADEMIC STAFF AND STUDENTS
NEWLY RECRUITED – SHARE OF MEN AND WOMEN

9
GEN
DER
STAT
ISTI
CS 2
015THE CBS LEAKING PIPEL INE BY DEPARTMENT
2010 and 2015 are selected. The figures show that the gender composition varies signifi-cantly between departments, and between years. Please note that the numbers are rela-tively small and thus even small variations between years will appear to be significant.
50%
Department ofBusiness and Politics (DBP)
3
33
1
1
41
10
1
1
32
2
8
52
6
26
0%
25%
75%
100%
PhD students
Assistant professor
Associate professor
Professor mso
Professor PhD students
Assistant professor
Associate professor
Professor mso
Professor
2010 2015
50%
Department ofManagement, Politics and Philosophy (MPP)
11
2
4
1
1
6
4
52
5
3
21 12
1
5
183
15
0%
25%
75%
100%
PhD students
Assistant professor
Associate professor
Professor mso
Professor PhD students
Assistant professor
Associate professor
Professor mso
Professor
2010 2015
50%
Department ofAccounting and Auditing (ACC)
11
2 22
39
3 2
3 36
2 4
0%
25%
75%
100%
PhD students
Assistant professor
Associate professor
Professor mso
Professor PhD students
Assistant professor
Associate professor
Professor mso
Professor
2010 2015
50%
Department ofIT Management (ITM)
32
4 2 12
31
62
7 5 44
10
3
2
0%
25%
75%
100%
PhD students
Assistant professor
Associate professor
Professor mso
Professor PhD students
Assistant professor
Associate professor
Professor mso
Professor
2010 2015
50%
Department ofEconomics (ECON)
3
4
25 5
1
1
6
5
1
5
45 4
8
0%
25%
75%
100%
PhD students
Assistant professor
Associate professor
Professor mso
Professor PhD students
Assistant professor
Associate professor
Professor mso
Professor
2010 2015
50%
Department ofMarketing (MARKTG)
1 1 52
4
2
4 1
4 3 12
3
32
12
1
3
0%
25%
75%
100%
PhD students
Assistant professor
Associate professor
Professor mso
Professor PhD students
Assistant professor
Associate professor
Professor mso
Professor
2010 2015
50%
Department ofFinance (FI)
11
31
1
2
77
3 6
74
92 13
0%
25%
75%
100%
PhD students
Assistant professor
Associate professor
Professor mso
Professor PhD students
Assistant professor
Associate professor
Professor mso
Professor
2010 2015
50%
Department ofOperations Management (OM)
1 1
1 3
21
2
84 11
1
5
4
811
1
4
0%
25%
75%
100%
PhD students
Assistant professor
Associate professor
Professor mso
Professor PhD students
Assistant professor
Associate professor
Professor mso
Professor
2010 2015
50%
Department ofIntercultural Communication and Management (ICM)
57
7 2
2 5 413 5
21
15 3
1 2 213
4
5
0%
25%
75%
100%
PhD students
Assistant professor
Associate professor
Professor mso
Professor PhD students
Assistant professor
Associate professor
Professor mso
Professor
2010 2015
50%
Department ofStrategic Management and Globalization (SMG)
32
21
34
22
6
0%
25%
75%
100%
PhD students
Assistant professor
Associate professor
Professor mso
Professor
2010
3
11
1
2
25
24
PhD students
Assistant professor
Associate professor
Professor mso
Professor
2015
50%
Department ofInternational Economics and Management (INT)
1
5
2
24
8
1 1
2
4
6
2 7
13
9
6 9
0%
25%
75%
100%
PhD students
Assistant professor
Associate professor
Professor mso
Professor PhD students
Assistant professor
Associate professor
Professor mso
Professor
2010 2015
50%
Department ofInnovation and Organizational Economics (INO)
6 1
2
6 1
83 6
0%
25%
75%
100%
PhD students
Assistant professor
Associate professor
Professor mso
Professor
2010
2
5
2 3
6
1
5
2
10
PhD students
Assistant professor
Associate professor
Professor mso
Professor
2015
50%
Department ofOrganization (IOA)
82
51
3
2
83
5
0%
25%
75%
100%
PhD students
Assistant professor
Associate professor
Professor mso
Professor
2010
78
72
2
32
71
8
PhD students
Assistant professor
Associate professor
Professor mso
Professor
2015
50%
Department ofInternational Business Communication (IBC)
6
2
24
4
5 315 3
5
5
11
1
5
1 19
2
2
0%
25%
75%
100%
PhD students
Assistant professor
Associate professor
Professor mso
Professor PhD students
Assistant professor
Associate professor
Professor mso
Professor
2010 2015
50%
Lawdepartment (LAW)
1
3
1 1
24
24
0%
25%
75%
100%
PhD students
Assistant professor
Associate professor
Professor mso
Professor
2010
5 2
1
3
2 1
6
4
PhD students
Assistant professor
Associate professor
Professor mso
Professor
2015
The figures show the gender composition from PhD student to full Professor at the 15 departments at CBS. Men Women
11
GEN
DER
STAT
ISTI
CS 2
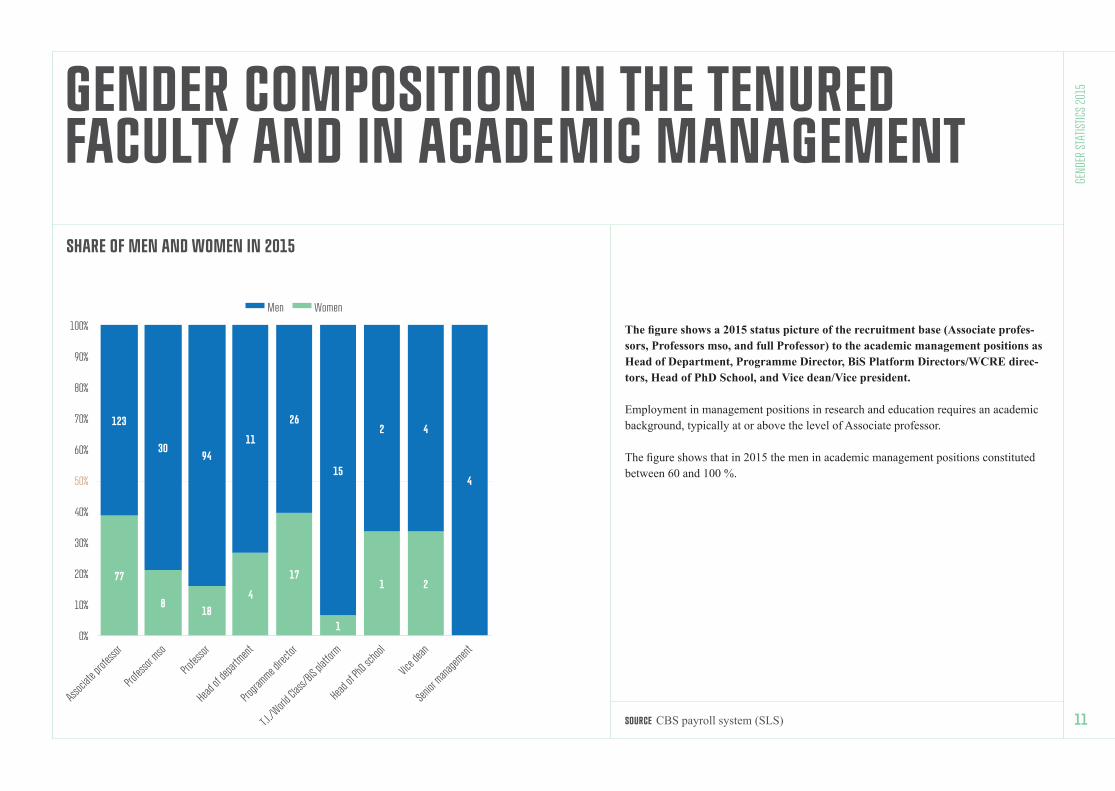
015GENDER COMPOSITION IN THE TENURED
FACULTY AND IN ACADE MIC MANAGEMENT
The figure shows a 2015 status picture of the recruitment base (Associate profes-sors, Professors mso, and full Professor) to the academic management positions as Head of Department, Programme Director, BiS Platform Directors/WCRE direc-tors, Head of PhD School, and Vice dean/Vice president.
Employment in management positions in research and education requires an academic background, typically at or above the level of Associate professor.
The figure shows that in 2015 the men in academic management positions constituted between 60 and 100 %.
SOURCE CBS payroll system (SLS)
SHARE OF MEN AND WOMEN IN 2015
Men Women
77
818
4
17
1
1 2
123
3094
11
26
15
2 4
4
0%
10%
20%
30%
40%
50%
60%
70%
80%
90%
100%
13
GEN
DER
STAT
ISTI
CS 2
015GENDER COMPOSITION IN THE
ADMINISTRATIVE STAFF AT CBS
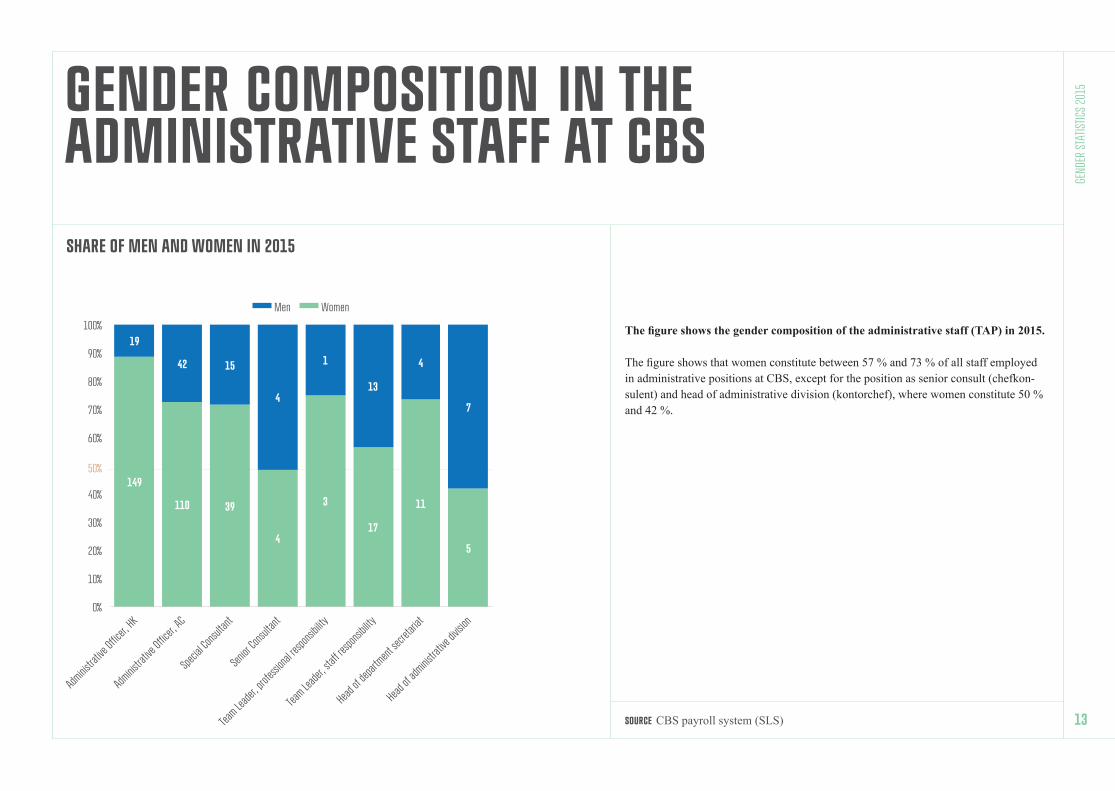
The figure shows the gender composition of the administrative staff (TAP) in 2015.
The figure shows that women constitute between 57 % and 73 % of all staff employed in administrative positions at CBS, except for the position as senior consult (chefkon-sulent) and head of administrative division (kontorchef), where women constitute 50 % and 42 %.
SOURCE CBS payroll system (SLS)
SHARE OF MEN AND WOMEN IN 2015
149
110 39
4
3
17
11
5
19
42 15
4
1
13
4
7
0%
10%
20%
30%
40%
60%
70%
80%
90%
100%
50%
Men Women

15
GEN
DER
STAT
ISTI
CS 2
015MORE INFORMATION
Action plan for diversity and inclusion Copenhagen Business School, 2015-2018
CBS action plan for gender diversityin management, 2013-2017
Recommendations from the Taskforce for More Women in Research, April 2015
Gender and academic leadership practices Copenhagen Business School, September 2016