Embed Size (px)
Citation preview
SolarWinds Network Performance Monitor
NETWORK AVAILABILITY AND PERFORMANCE MANAGEMENT
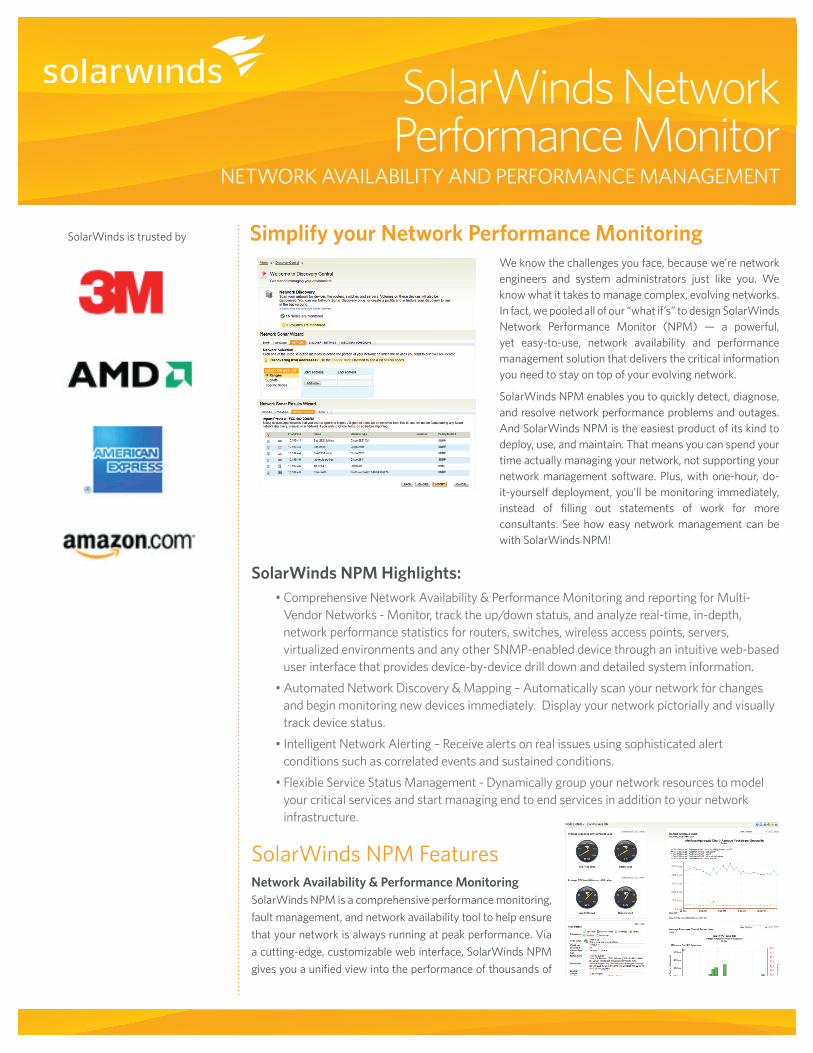
We know the challenges you face, because we’re network engineers and system administrators just like you. We know what it takes to manage complex, evolving networks. In fact, we pooled all of our “what if’s” to design SolarWinds Network Performance Monitor (NPM) — a powerful, yet easy-to-use, network availability and performance management solution that delivers the critical information you need to stay on top of your evolving network.
SolarWinds NPM enables you to quickly detect, diagnose, and resolve network performance problems and outages. And SolarWinds NPM is the easiest product of its kind to deploy, use, and maintain. That means you can spend your time actually managing your network, not supporting your network management software. Plus, with one-hour, do-it-yourself deployment, you’ll be monitoring immediately, instead of filling out statements of work for more consultants. See how easy network management can be with SolarWinds NPM!
SolarWinds NPM Highlights:• Comprehensive Network Availability & Performance Monitoring and reporting for Multi-
Vendor Networks - Monitor, track the up/down status, and analyze real-time, in-depth, network performance statistics for routers, switches, wireless access points, servers, virtualized environments and any other SNMP-enabled device through an intuitive web-based user interface that provides device-by-device drill down and detailed system information.
• Automated Network Discovery & Mapping – Automatically scan your network for changes and begin monitoring new devices immediately. Display your network pictorially and visually track device status.
• Intelligent Network Alerting – Receive alerts on real issues using sophisticated alert conditions such as correlated events and sustained conditions.
• Flexible Service Status Management - Dynamically group your network resources to model your critical services and start managing end to end services in addition to your network infrastructure.
SolarWinds NPM FeaturesNetwork Availability & Performance MonitoringSolarWinds NPM is a comprehensive performance monitoring,
fault management, and network availability tool to help ensure
that your network is always running at peak performance. Via
a cutting-edge, customizable web interface, SolarWinds NPM
gives you a unified view into the performance of thousands of
Simplify your Network Performance MonitoringSolarWinds is trusted by
NetFlow Traffic Analyzer | Orion Module
“I have continued to watch this
product evolve since version 7.0 and
have always found the interface
and built in tools helpful and well
thought out. The drill downs into
more detailed reports on interfaces,
nodes and resources have made this
product a mainstay in the network...
Definitely the best NPM product I
have ever worked with.”
- eusbreeves posted on solarwinds.com
nodes and interfaces on your network. From a single web page, you can drill into any element on your network
to see exactly what’s happening in real time.
SolarWinds NPM’s web interface provides real-time views of network performance and availability statistics,
as well as detailed monitoring and analysis of data from routers, switches, servers, and any other SNMP-
enabled devices. This performance monitoring data alerts you to poor network conditions like slow traffic,
loss of packets, or impaired devices.
With SolarWinds NPM, you can also automatically monitor and set alerts on disk space, CPU load, and
memory utilization for your network devices. With out-of-the-box support for many vendors and operating
systems, SolarWinds NPM ensures that you can easily collect and alert on conditions that could potentially
cause a network outage or performance degradation.
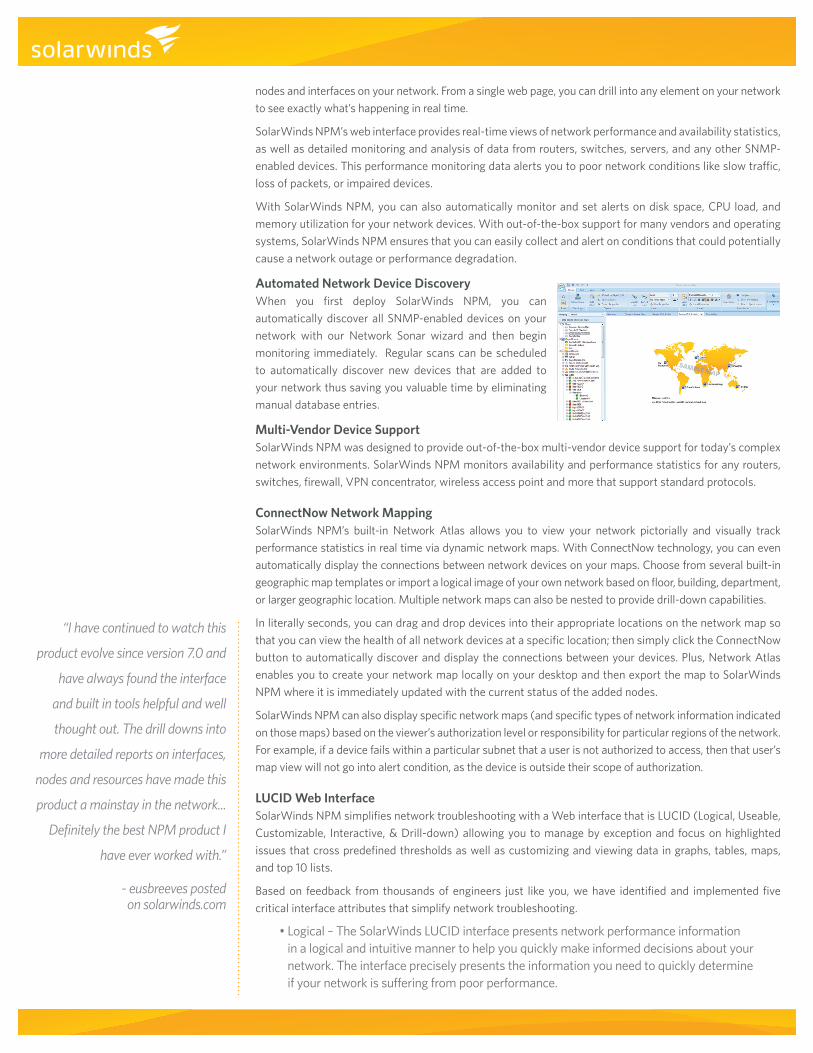
Automated Network Device DiscoveryWhen you first deploy SolarWinds NPM, you can
automatically discover all SNMP-enabled devices on your
network with our Network Sonar wizard and then begin
monitoring immediately. Regular scans can be scheduled
to automatically discover new devices that are added to
your network thus saving you valuable time by eliminating
manual database entries.
Multi-Vendor Device SupportSolarWinds NPM was designed to provide out-of-the-box multi-vendor device support for today’s complex
network environments. SolarWinds NPM monitors availability and performance statistics for any routers,
switches, firewall, VPN concentrator, wireless access point and more that support standard protocols.
ConnectNow Network MappingSolarWinds NPM’s built-in Network Atlas allows you to view your network pictorially and visually track
performance statistics in real time via dynamic network maps. With ConnectNow technology, you can even
automatically display the connections between network devices on your maps. Choose from several built-in
geographic map templates or import a logical image of your own network based on floor, building, department,
or larger geographic location. Multiple network maps can also be nested to provide drill-down capabilities.
In literally seconds, you can drag and drop devices into their appropriate locations on the network map so
that you can view the health of all network devices at a specific location; then simply click the ConnectNow
button to automatically discover and display the connections between your devices. Plus, Network Atlas
enables you to create your network map locally on your desktop and then export the map to SolarWinds
NPM where it is immediately updated with the current status of the added nodes.
SolarWinds NPM can also display specific network maps (and specific types of network information indicated
on those maps) based on the viewer’s authorization level or responsibility for particular regions of the network.
For example, if a device fails within a particular subnet that a user is not authorized to access, then that user’s
map view will not go into alert condition, as the device is outside their scope of authorization.
LUCID Web InterfaceSolarWinds NPM simplifies network troubleshooting with a Web interface that is LUCID (Logical, Useable,
Customizable, Interactive, & Drill-down) allowing you to manage by exception and focus on highlighted
issues that cross predefined thresholds as well as customizing and viewing data in graphs, tables, maps,
and top 10 lists.
Based on feedback from thousands of engineers just like you, we have identified and implemented five
critical interface attributes that simplify network troubleshooting.
• Logical – The SolarWinds LUCID interface presents network performance information in a logical and intuitive manner to help you quickly make informed decisions about your network. The interface precisely presents the information you need to quickly determine if your network is suffering from poor performance.
NetFlow Traffic Analyzer | Orion Module
• Useable – SolarWinds NPM provides a tremendous breadth of information in every view, yet the interface is very useable. Administrator tasks have all been designed to allow you to maintain SolarWinds NPM with just a few clicks of your mouse.
• Customizable – Rearrange Web resources, Top 10 views, modify time periods, and customize resources to meet your specific network environment. Easily tailor SolarWinds NPM’s maps to match so you can quickly discover any performance related issues.
• Interactive – SolarWinds NPM automatically updates your network’s latest performance indicators to help you quickly determine if any network issues could potentially impact users.
• Drill-down – View detailed information on virtually every device, performance indicator, and status link by simply drilling into respective hot performance indicators.
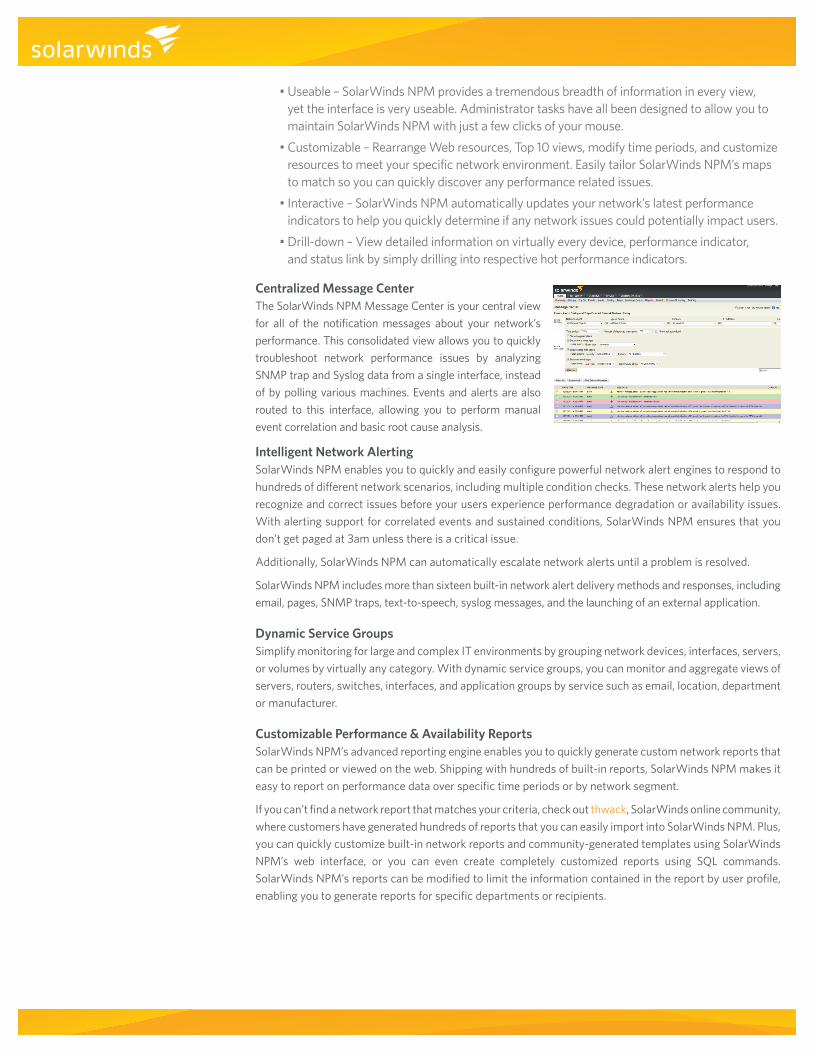
Centralized Message CenterThe SolarWinds NPM Message Center is your central view
for all of the notification messages about your network’s
performance. This consolidated view allows you to quickly
troubleshoot network performance issues by analyzing
SNMP trap and Syslog data from a single interface, instead
of by polling various machines. Events and alerts are also
routed to this interface, allowing you to perform manual
event correlation and basic root cause analysis.
Intelligent Network AlertingSolarWinds NPM enables you to quickly and easily configure powerful network alert engines to respond to
hundreds of different network scenarios, including multiple condition checks. These network alerts help you
recognize and correct issues before your users experience performance degradation or availability issues.
With alerting support for correlated events and sustained conditions, SolarWinds NPM ensures that you
don’t get paged at 3am unless there is a critical issue.
Additionally, SolarWinds NPM can automatically escalate network alerts until a problem is resolved.
SolarWinds NPM includes more than sixteen built-in network alert delivery methods and responses, including
email, pages, SNMP traps, text-to-speech, syslog messages, and the launching of an external application.
Dynamic Service GroupsSimplify monitoring for large and complex IT environments by grouping network devices, interfaces, servers,
or volumes by virtually any category. With dynamic service groups, you can monitor and aggregate views of
servers, routers, switches, interfaces, and application groups by service such as email, location, department
or manufacturer.
Customizable Performance & Availability ReportsSolarWinds NPM’s advanced reporting engine enables you to quickly generate custom network reports that
can be printed or viewed on the web. Shipping with hundreds of built-in reports, SolarWinds NPM makes it
easy to report on performance data over specific time periods or by network segment.
If you can’t find a network report that matches your criteria, check out thwack, SolarWinds online community,
where customers have generated hundreds of reports that you can easily import into SolarWinds NPM. Plus,
you can quickly customize built-in network reports and community-generated templates using SolarWinds
NPM’s web interface, or you can even create completely customized reports using SQL commands.
SolarWinds NPM’s reports can be modified to limit the information contained in the report by user profile,
enabling you to generate reports for specific departments or recipients.
NetFlow Traffic Analyzer | Orion Module
Integrated Wireless PollingSolarWinds NPM’s Integrated Wireless Poller enables you to easily manage wireless thin and autonomous
access points and their associated clients. Now SolarWinds NPM can monitor your wireless devices alongside
your wired devices and provide you with alerts, reports, and Top 10 lists for your wireless infrastructure!
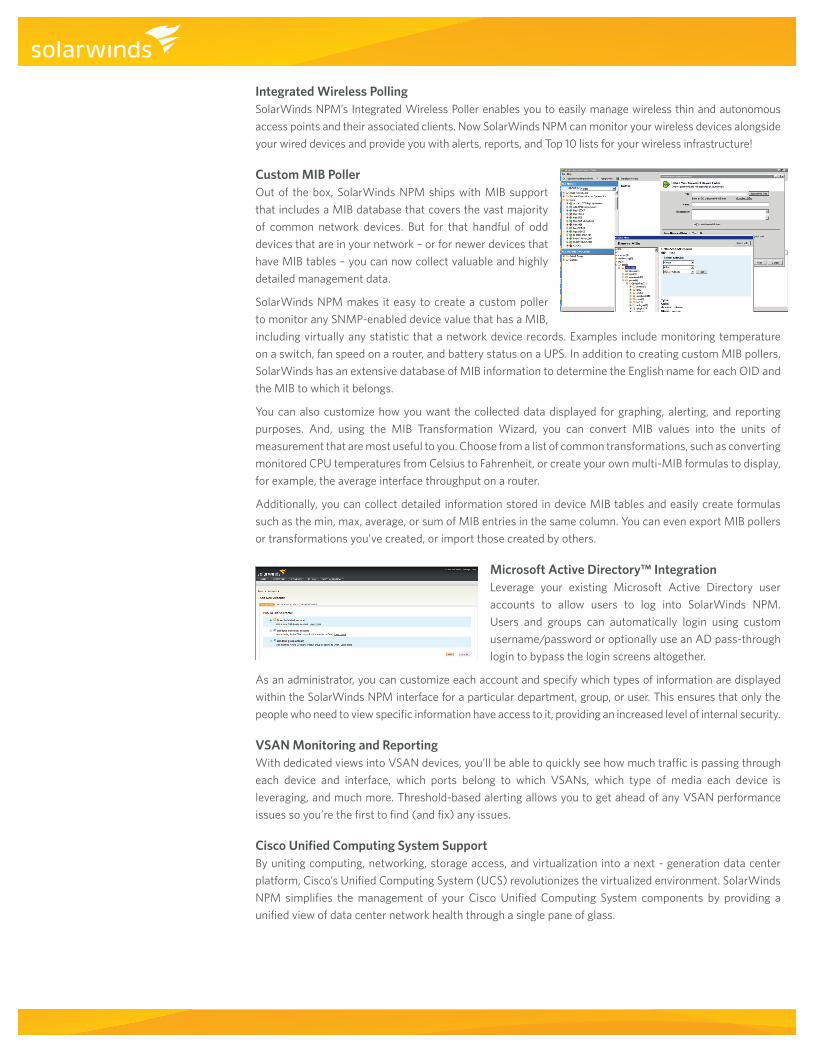
Custom MIB PollerOut of the box, SolarWinds NPM ships with MIB support
that includes a MIB database that covers the vast majority
of common network devices. But for that handful of odd
devices that are in your network – or for newer devices that
have MIB tables – you can now collect valuable and highly
detailed management data.
SolarWinds NPM makes it easy to create a custom poller
to monitor any SNMP-enabled device value that has a MIB,
including virtually any statistic that a network device records. Examples include monitoring temperature
on a switch, fan speed on a router, and battery status on a UPS. In addition to creating custom MIB pollers,
SolarWinds has an extensive database of MIB information to determine the English name for each OID and
the MIB to which it belongs.
You can also customize how you want the collected data displayed for graphing, alerting, and reporting
purposes. And, using the MIB Transformation Wizard, you can convert MIB values into the units of
measurement that are most useful to you. Choose from a list of common transformations, such as converting
monitored CPU temperatures from Celsius to Fahrenheit, or create your own multi-MIB formulas to display,
for example, the average interface throughput on a router.
Additionally, you can collect detailed information stored in device MIB tables and easily create formulas
such as the min, max, average, or sum of MIB entries in the same column. You can even export MIB pollers
or transformations you’ve created, or import those created by others.
Microsoft Active Directory™ IntegrationLeverage your existing Microsoft Active Directory user
accounts to allow users to log into SolarWinds NPM.
Users and groups can automatically login using custom
username/password or optionally use an AD pass-through
login to bypass the login screens altogether.
As an administrator, you can customize each account and specify which types of information are displayed
within the SolarWinds NPM interface for a particular department, group, or user. This ensures that only the
people who need to view specific information have access to it, providing an increased level of internal security.
VSAN Monitoring and ReportingWith dedicated views into VSAN devices, you’ll be able to quickly see how much traffic is passing through
each device and interface, which ports belong to which VSANs, which type of media each device is
leveraging, and much more. Threshold-based alerting allows you to get ahead of any VSAN performance
issues so you’re the first to find (and fix) any issues.
Cisco Unified Computing System SupportBy uniting computing, networking, storage access, and virtualization into a next - generation data center
platform, Cisco’s Unified Computing System (UCS) revolutionizes the virtualized environment. SolarWinds
NPM simplifies the management of your Cisco Unified Computing System components by providing a
unified view of data center network health through a single pane of glass.
© 2012 SolarWinds Worldwide, LLC. All rights reserved. SOLARWINDS, SOLARWINDS & Design and other SolarWinds marks, identified on the SolarWinds website, as updated from SolarWinds from time to time and incorporated herein, are registered with the U.S. Patent and Trademark Office and may be registered or pending registration in other countries. All other SolarWinds trademarks may be common law marks or registered or pending registration in the United States or in other countries. All other trademarks or registered trademarks contained and/or mentioned herein are used for identification purposes only and may be trademarks or registered trademarks of their respective companies. DS-1205
For additional information, please contact SolarWinds at 866.530.8100 or e-mail [email protected]. To locate an international reseller near you, visit http://www.solarwinds.com/partners/reseller_locator.aspx
“The web-based interface provides
instant, constant updates as to the
status of our network to helpdesk
staff, tech staff and management.”
- pob posted on solarwinds.com
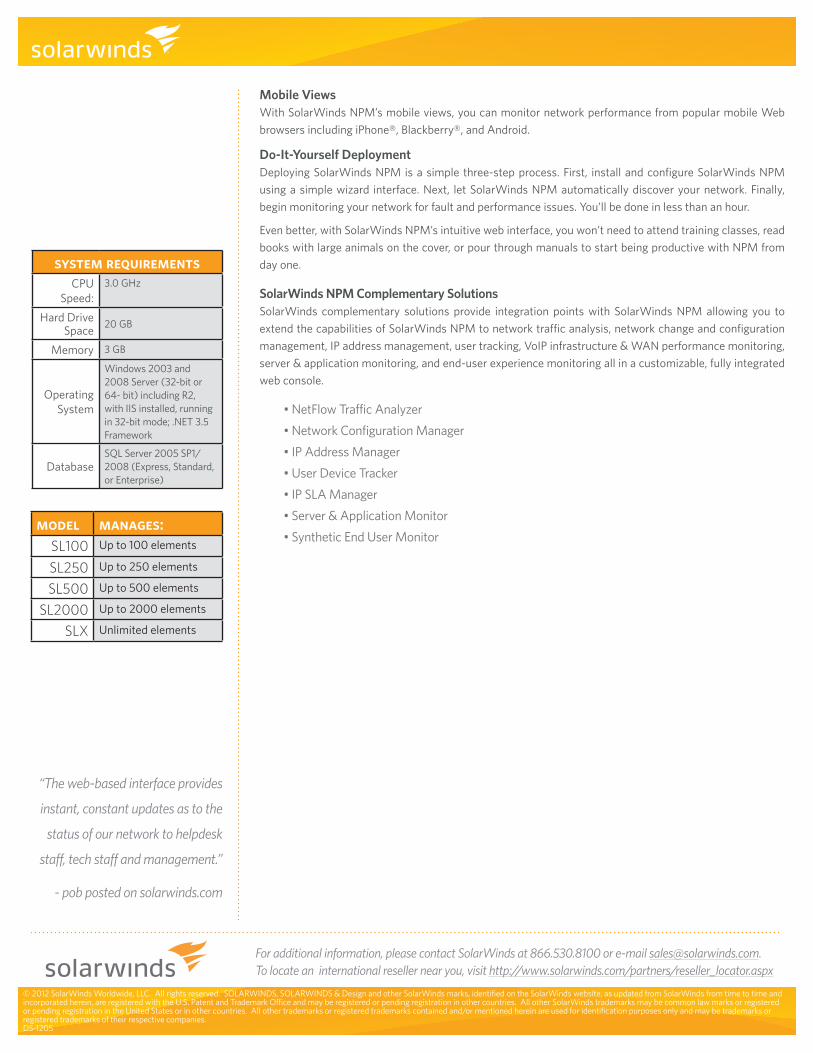
model manages:SL100 Up to 100 elements
SL250 Up to 250 elements
SL500 Up to 500 elements
SL2000 Up to 2000 elements
SLX Unlimited elements
system requirementsCPU
Speed:3.0 GHz
Hard Drive Space
20 GB
Memory 3 GB
Operating System
Windows 2003 and 2008 Server (32-bit or 64- bit) including R2, with IIS installed, running in 32-bit mode; .NET 3.5 Framework
DatabaseSQL Server 2005 SP1/ 2008 (Express, Standard, or Enterprise)
Mobile ViewsWith SolarWinds NPM’s mobile views, you can monitor network performance from popular mobile Web
browsers including iPhone®, Blackberry®, and Android.
Do-It-Yourself DeploymentDeploying SolarWinds NPM is a simple three-step process. First, install and configure SolarWinds NPM
using a simple wizard interface. Next, let SolarWinds NPM automatically discover your network. Finally,
begin monitoring your network for fault and performance issues. You’ll be done in less than an hour.
Even better, with SolarWinds NPM’s intuitive web interface, you won’t need to attend training classes, read
books with large animals on the cover, or pour through manuals to start being productive with NPM from
day one.
SolarWinds NPM Complementary SolutionsSolarWinds complementary solutions provide integration points with SolarWinds NPM allowing you to
extend the capabilities of SolarWinds NPM to network traffic analysis, network change and configuration
management, IP address management, user tracking, VoIP infrastructure & WAN performance monitoring,
server & application monitoring, and end-user experience monitoring all in a customizable, fully integrated
web console.
• NetFlow Traffic Analyzer
• Network Configuration Manager
• IP Address Manager
• User Device Tracker
• IP SLA Manager
• Server & Application Monitor
• Synthetic End User Monitor