Embed Size (px)
Citation preview
ADMINISTRATOR GUIDE
Network PerformanceMonitorVersion 2020.2
Last Updated: June 10, 2020

© 2020 SolarWinds Worldwide, LLC. All rights reserved.
This document may not be reproduced by any means nor modified, decompiled, disassembled, published or distributed, in whole or in part, or translated to any electronic medium or other means without the prior written consent of SolarWinds. All right, title, and interest in and to the software, services, and documentation are and shall remain the exclusive property of SolarWinds, its affiliates, and/or its respective licensors.
SOLARWINDS DISCLAIMS ALL WARRANTIES, CONDITIONS, OR OTHER TERMS, EXPRESS OR IMPLIED, STATUTORY OR OTHERWISE, ON THE DOCUMENTATION, INCLUDING WITHOUT LIMITATION NONINFRINGEMENT, ACCURACY, COMPLETENESS, OR USEFULNESS OF ANY INFORMATION CONTAINED HEREIN. IN NO EVENT SHALL SOLARWINDS, ITS SUPPLIERS, NOR ITS LICENSORS BE LIABLE FOR ANY DAMAGES, WHETHER ARISING IN TORT, CONTRACT OR ANY OTHER LEGAL THEORY, EVEN IF SOLARWINDS HAS BEEN ADVISED OF THE POSSIBILITY OF SUCH DAMAGES.
The SolarWinds, SolarWinds & Design, Orion, and THWACK trademarks are the exclusive property of SolarWinds Worldwide, LLC or its affiliates, are registered with the U.S. Patent and Trademark Office, and may be registered or pending registration in other countries. All other SolarWinds trademarks, service marks, and logos may be common law marks or are registered or pending registration. All other trademarks mentioned herein are used for identification purposes only and are trademarks of (and may be registered trademarks) of their respective companies.
page 2
Table of ContentsNetwork Performance Monitor Administrator Guide 7
Orion Platform features in NPM 7
NPM licensing model 9
Uninstall SolarWinds NPM 11
Manage interfaces in NPM 14
View interface status, interface health, and details about downtime in NPM 14
Display physical layout of interfaces on graphical stencils (Device View) 17
Detect and predict duplex mismatches in NPM 21
Edit interface properties in NPM 22
Suspend collecting data for interfaces in NPM 23
Delete interfaces in NPM 25
Remotely manage monitored interfaces in NPM 27
Troubleshoot nodes and interfaces that are Unknown 28
Observe real-time data for nodes and interfaces on charts 31
Monitor capacity usage trends on the network and forecast capacity issues in NPM 33
Forecast capacity for nodes, interfaces, or volumes in NPM 34
Change capacity forecasting settings globally in NPM 35
Customize capacity forecasting settings for single nodes, interfaces, or volumes in NPM 36
Discover your network paths in NPM 39
Key features of NetPath™ 39
How does NetPath™ work? 39
NetPath requirements for NPM 40
Create a NetPath service in NPM 44
Create a NetPath probe in NPM 46
View a network path in NPM 47
ADMINISTRATOR GUIDE: NETWORK PERFORMANCE MONITOR
page 3
Troubleshoot a NetPath service with external path data in NPM 51
Troubleshoot my network with NetPath data in NPM 54
Orion Platform integration with NetPath 56
Monitor Cisco ACI devices in NPM 58
Requirements 58
Add ACI devices and enable ACI polling 59
Enable polling for Cisco ACI on a monitored node 60
View health scores for ACI members 60
View health score and status history in PerfStack 61
View your SDN infrastructure on Orion Maps 62
Create ACI-specific alerts and reports 64
Monitor ASA firewalls with NPM 69
Set up monitoring Cisco ASA firewalls in NPM 69
Understand ASA platform health in NPM 73
Monitor VPN tunnels on ASA firewalls in NPM 79
Review access lists on ASA firewalls in NPM and NCM 81
Monitor Cisco Nexus devices in NPM 82
Set up monitoring for Cisco Nexus devices in NPM 83
Access Nexus-specific information in NPM 88
Monitor Cisco SwitchStack in NPM 90
View stack members and rings 90
View the health of stack members 91
Cisco SwitchStack events 91
Out-of-the-box alerts for SwitchStack 92
Network Insight for F5 BIG-IP load balancers in NPM 94
Set up Network Insight for F5® BIG-IP® load balancers in NPM 94
Monitor services delivered by F5® BIG-IP® load balancers in NPM 96
page 4
Status of F5 devices in NPM 99
F5 high availability in NPM 102
F5 health monitors in NPM 103
Events, alerts, and reports for Network Insight for F5® BIG-IP® load balancers in NPM 104
Take an F5 pool member out of rotation in NPM 105
Network Insight for Palo Alto - monitor Palo Alto firewalls with NPM 107
Requirements 107
How to monitor Palo Alto devices 107
View Site-to-Site tunnels on a Palo Alto firewall 109
View the GlobalProtect VPN subview 110
PerfStack 111
Orion Maps 111
Troubleshooting 112
Monitor wireless networks in NPM 113
Migrate data from the Wireless Networks Module in NPM 113
View wireless data in NPM 113
Monitor Meraki wireless infrastructure in NPM 114
Create wireless heat maps for NPM 120
Display wireless heat maps for NPM in the Orion Web Console 126
Monitor EnergyWise devices in NPM 127
Add the EnergyWise Summary View to the Orion Web Console menu bar in NPM 127
Temporarily reset the current power level of a monitored EnergyWise interface in NPM 127
Monitor Azure V-Nets, V-Net Gateways and Site-to-Site Connections with NPM 129
Add an Azure cloud account for monitoring 129
Display the overview of monitored cloud environment 132
Monitor Virtual Network Gateways on Microsoft Azure clouds 133
Monitor Site-to-Site Connections on Microsoft Azure clouds 134
ADMINISTRATOR GUIDE: NETWORK PERFORMANCE MONITOR
page 5
Configure Azure settings relevant for NPM 135
Set SolarWinds NPM thresholds 136
Create custom monitors in NPM 137
Management Information Base (MIB) in the NPM 138
Monitor custom statistics based on OIDs with Universal Device Pollers in the NPM 138
Manage unique devices on the network with NPM 155
Troubleshoot NPM issues with Performance Analysis dashboards 167
Troubleshoot intermittent network slowdowns with NPM 167
Troubleshoot slow resources in a branch office with NPM 171
page 6
Network Performance Monitor Administrator GuideWelcome to the SolarWinds Network Performance Monitor (NPM) Administrator Guide.
This guide provides an overview of product features and related technologies. In addition, it contains recommendations on best practices, tutorials for getting started with advanced features, and troubleshooting information for common situations.
For information about planning, installing and getting started with NPM, see the NPM Getting Started Guide.
Orion Platform features in NPMThe Orion Platform is the core of the SolarWinds IT Management Portfolio. It provides a stable and scalable architecture that includes data collection, processing, storage, and presentation. The Orion Platform provides common features, such as user accounts and groups, views, dashboards, reporting, alerting, and more that you can use across all Orion Platform products and access from the Orion Web Console.
Pre-installation hintsBefore you install your Orion Platform products, review the following details:
Orion Platform requirements
Hardware, software, and port requirements for the Orion Platform server and SolarWinds Orion database.
Licensing
Licensing differs among Orion Platform products. Activate, add, upgrade or assign licenses with the License Manager in the Orion Web Console.
Installation or upgrade
Use the SolarWinds Orion Installer to easily install or upgrade multiple Orion Platform products simultaneously.
While installing your Orion Platform products, you might need to configure SSL for the Orion Web Console, enable FIPS, or review directories to be excluded from antivirus protection.
ADMINISTRATOR GUIDE: NETWORK PERFORMANCE MONITOR
page 7
Common featuresThe following features are available in Orion Platform products.
Learn Orion Platform basics
Log in to your Orion Platform product in a web browser and meet the Orion Web Console.
Review Events, syslogs, or SNMP traps to know what's going on.
Get alerts about issues in your environment.
Generate reports to present the status of the monitored environment.
Review Performance Analysis dashboards, also known as PerfStack™.
Create, edit, and maintain Orion Web Console user accounts - set user rights, reset passwords, limit access to network segments, and enable authentication with Active Directory.
View monitored objects on maps in the Orion Web Console - view automatically generated Orion Maps as a subview, display objects with their location specified in the OpenStreet format in a widget, or create maps the Network Atlas tool and display them in the Orion Web Console.
Add devices for monitoring and manage monitored devices
Specify which devices to monitor and the information you need, then select the way you get this information. See Discover and add devices.
Add single nodes, use Active Directory domain controllers to add nodes, or discover devices on your network automatically.
Available polling methods include ICMP, WMI, SNMP, or agents deployed on Windows, Linux, and UIX devices.
Manage monitored devices - edit properties, set the polling method for monitored devices, toggle monitoring on and off, or mute alerts for nodes.
Customize your Orion Web Console
Customize Orion Web Console - customize dashboards, colors, logo, views, widgets and charts. Learn how to limit what objects users see on views, or specify what you want to see on views for specific device types.
Create custom properties - create custom fields to associate with monitored network objects and display custom information for monitored devices.
Create groups and dependencies - organize how monitored data is presented in the Orion Web Console. Set up dependencies to better represent the relationships between network objects and account for constraints on the network.
page 8
Set thresholds - specify thresholds for monitored metrics. Customize general thresholds or use baselines.
Monitor additional metrics and devices
Monitor hardware health - get insight into hardware issues on the network. Monitor hardware health based on hardware sensors, such as fan status, power supply status, or temperature.
Monitor virtual environments - monitor your virtual networks (VMware® ESX and ESXi servers, VMware vCenter®) in the Orion Web Console.
Quality of Experience - use packet analysis sensors to see packet-level traffic information about key devices and applications on your network.
Gain view into details provided by Cisco UCS devices.
Expand the Orion Platform functionality or scale your deployment
Use SolarWinds High Availability (HA) to provide failover protection for your Orion server and additional polling engines to reduce data loss.
Integrate an Orion Platform product with the ServiceNow or SolarWinds Service Desk trouble ticketing systems.
Do you need to scale your deployment? See Scalability Engine Guidelines.
Review the tips for optimizing your deployment.
Balance the load on polling engines by specifying nodes to be polled by individual polling engines.
Manage Additional Polling Engines.
Troubleshoot your SolarWinds Orion database.
NPM licensing modelThe SolarWinds NPM license is based on a number of items to monitor. Each license tier number provides the maximum limit of nodes, interfaces, and volumes to manage and monitor.
Orion Platform products support both perpetual licenses and subscription licenses. See License types in the Orion Platform help for details.
NPM is licensed according to the largest number of the following types of monitored network elements:
l Nodes: any devices being monitored, such as routers, switches, virtual and physical servers, access points, and modems.
ADMINISTRATOR GUIDE: NETWORK PERFORMANCE MONITOR
page 9
l Interfaces: any single points of network traffic, such as switch ports, physical interfaces, virtual interfaces, sub-interfaces, and VLANs.
l Volumes: any logical disks being monitored.
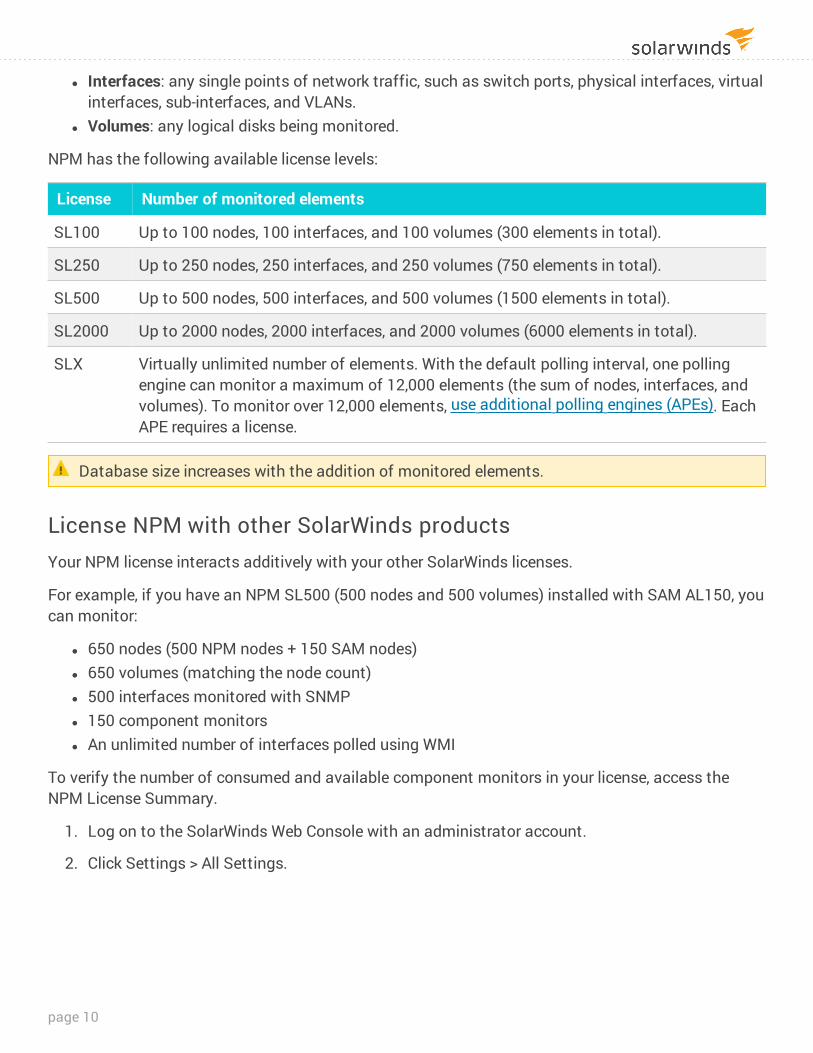
NPM has the following available license levels:
License Number of monitored elements
SL100 Up to 100 nodes, 100 interfaces, and 100 volumes (300 elements in total).
SL250 Up to 250 nodes, 250 interfaces, and 250 volumes (750 elements in total).
SL500 Up to 500 nodes, 500 interfaces, and 500 volumes (1500 elements in total).
SL2000 Up to 2000 nodes, 2000 interfaces, and 2000 volumes (6000 elements in total).
SLX Virtually unlimited number of elements. With the default polling interval, one polling engine can monitor a maximum of 12,000 elements (the sum of nodes, interfaces, and volumes). To monitor over 12,000 elements, use additional polling engines (APEs). Each APE requires a license.
Database size increases with the addition of monitored elements.
License NPM with other SolarWinds productsYour NPM license interacts additively with your other SolarWinds licenses.
For example, if you have an NPM SL500 (500 nodes and 500 volumes) installed with SAM AL150, you can monitor:
l 650 nodes (500 NPM nodes + 150 SAM nodes) l 650 volumes (matching the node count) l 500 interfaces monitored with SNMP l 150 component monitors l An unlimited number of interfaces polled using WMI
To verify the number of consumed and available component monitors in your license, access the NPM License Summary.
1. Log on to the SolarWinds Web Console with an administrator account.
2. Click Settings > All Settings.
page 10
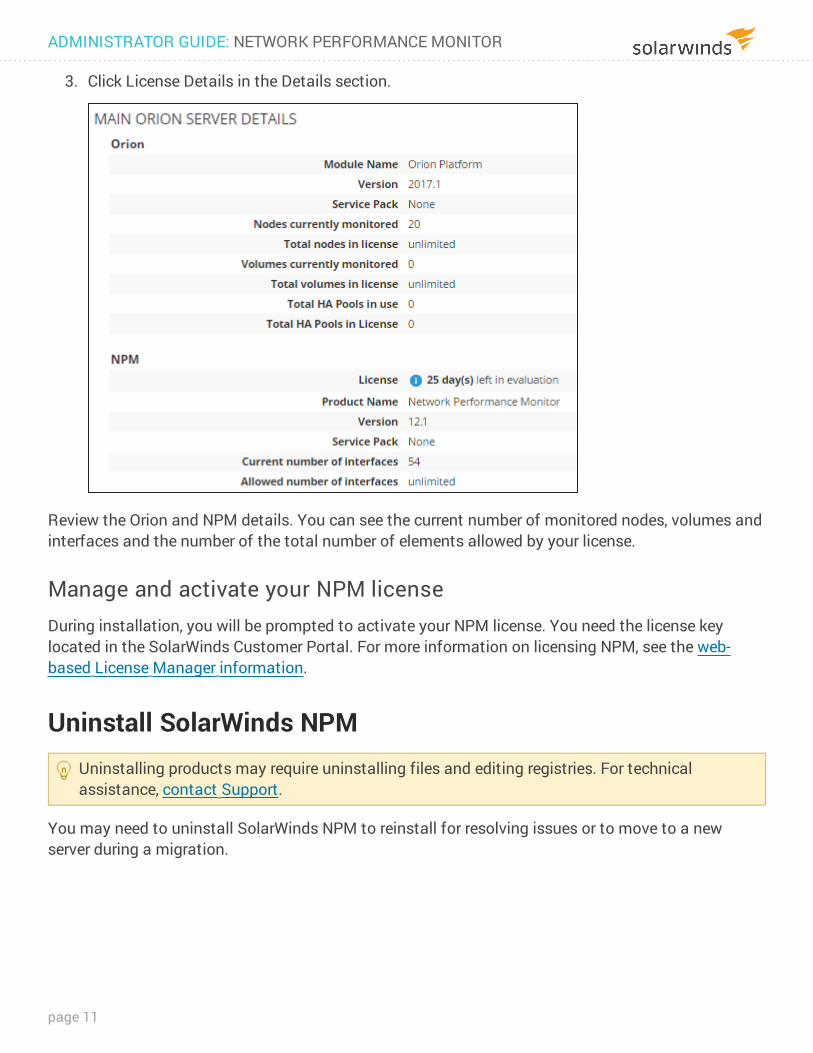
3. Click License Details in the Details section.
Review the Orion and NPM details. You can see the current number of monitored nodes, volumes and interfaces and the number of the total number of elements allowed by your license.
Manage and activate your NPM licenseDuring installation, you will be prompted to activate your NPM license. You need the license key located in the SolarWinds Customer Portal. For more information on licensing NPM, see the web-based License Manager information.
Uninstall SolarWinds NPMUninstalling products may require uninstalling files and editing registries. For technical assistance, contact Support.
You may need to uninstall SolarWinds NPM to reinstall for resolving issues or to move to a new server during a migration.
ADMINISTRATOR GUIDE: NETWORK PERFORMANCE MONITOR
page 11
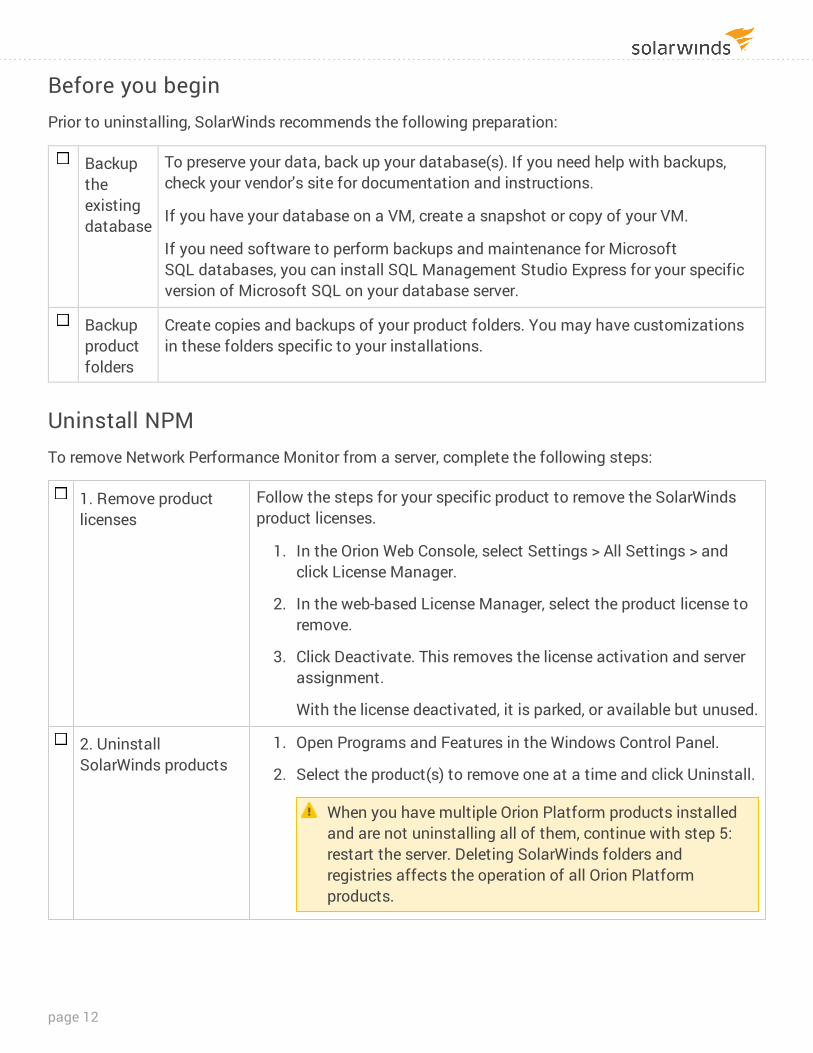
Before you beginPrior to uninstalling, SolarWinds recommends the following preparation:
Backup the existing database
To preserve your data, back up your database(s). If you need help with backups, check your vendor's site for documentation and instructions.
If you have your database on a VM, create a snapshot or copy of your VM.
If you need software to perform backups and maintenance for Microsoft SQL databases, you can install SQL Management Studio Express for your specific version of Microsoft SQL on your database server.
Backup product folders
Create copies and backups of your product folders. You may have customizations in these folders specific to your installations.
Uninstall NPMTo remove Network Performance Monitor from a server, complete the following steps:
1. Remove product licenses
Follow the steps for your specific product to remove the SolarWinds product licenses.
1. In the Orion Web Console, select Settings > All Settings > and click License Manager.
2. In the web-based License Manager, select the product license to remove.
3. Click Deactivate. This removes the license activation and server assignment.
With the license deactivated, it is parked, or available but unused.
2. Uninstall SolarWinds products
1. Open Programs and Features in the Windows Control Panel.
2. Select the product(s) to remove one at a time and click Uninstall.
When you have multiple Orion Platform products installed and are not uninstalling all of them, continue with step 5: restart the server. Deleting SolarWinds folders and registries affects the operation of all Orion Platform products.
page 12
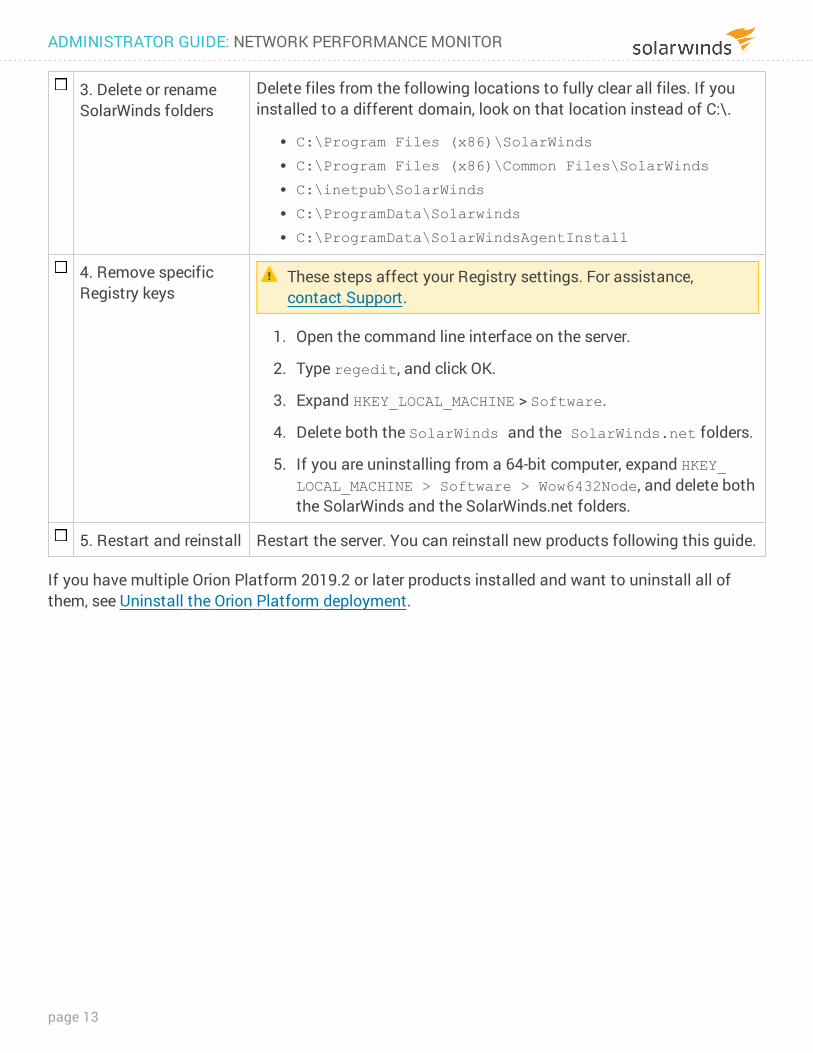
3. Delete or rename SolarWinds folders
Delete files from the following locations to fully clear all files. If you installed to a different domain, look on that location instead of C:\.
l C:\Program Files (x86)\SolarWinds
l C:\Program Files (x86)\Common Files\SolarWinds
l C:\inetpub\SolarWinds
l C:\ProgramData\Solarwinds
l C:\ProgramData\SolarWindsAgentInstall
4. Remove specific Registry keys
These steps affect your Registry settings. For assistance, contact Support.
1. Open the command line interface on the server.
2. Type regedit, and click OK.
3. Expand HKEY_LOCAL_MACHINE > Software.
4. Delete both the SolarWinds and the SolarWinds.net folders.
5. If you are uninstalling from a 64-bit computer, expand HKEY_LOCAL_MACHINE > Software > Wow6432Node, and delete both the SolarWinds and the SolarWinds.net folders.
5. Restart and reinstall Restart the server. You can reinstall new products following this guide.
If you have multiple Orion Platform 2019.2 or later products installed and want to uninstall all of them, see Uninstall the Orion Platform deployment.
ADMINISTRATOR GUIDE: NETWORK PERFORMANCE MONITOR
page 13
Manage interfaces in NPMWith SolarWinds NPM, you can manage your environment up to the interfaces level.
l You specify interfaces to monitor when adding nodes to NPM, either after you have run the Discovery or when adding single nodes.
l If you cannot see an interface on a node, go to the node details view, click List Resources in the Management widget, and ensure that the interface is selected for monitoring.
View interface status, interface health, and details about downtime in NPMThe downtime information is useful, for example, for SLA providers who want to prove specific times of interface or port unavailability.
Starting with NPM 12.3, check the health of interfaces in the Health Summary widget and get more details on the Node Details - Interfaces subview.
In some areas, an interface being down does not directly impact Internet or intranet connectivity.
1. Log in to the Orion Web Console.
2. Navigate to the Node Details view.
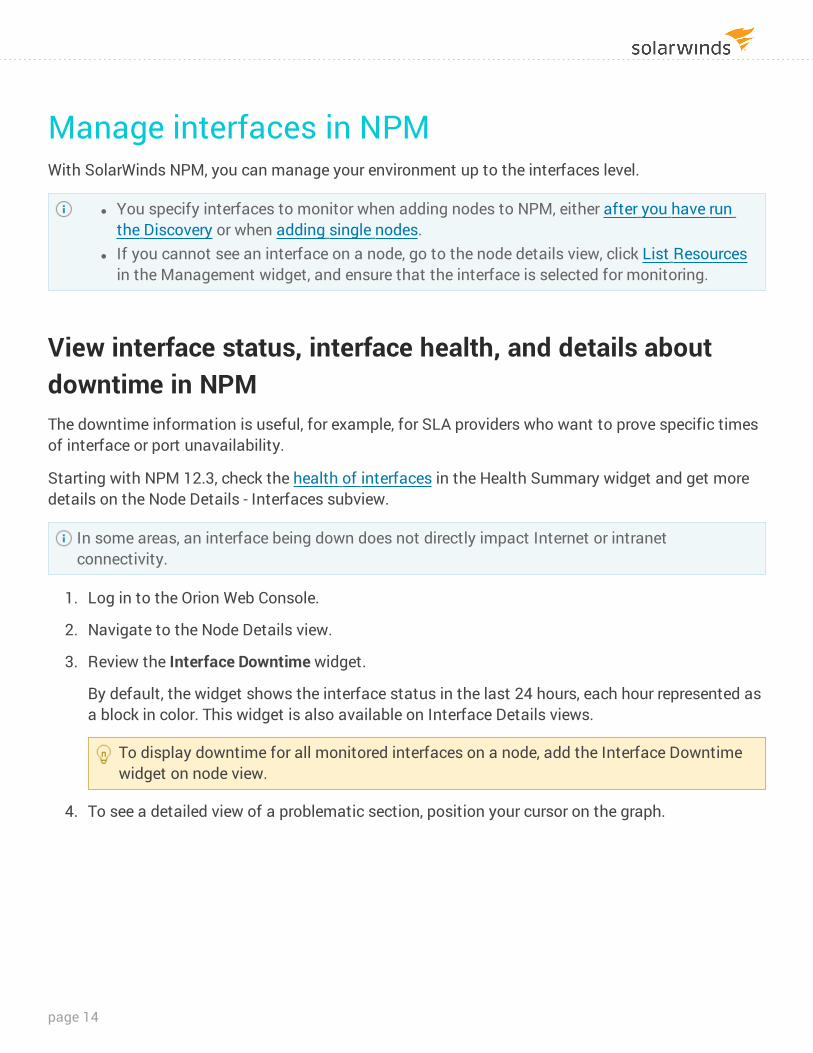
3. Review the Interface Downtime widget.
By default, the widget shows the interface status in the last 24 hours, each hour represented as a block in color. This widget is also available on Interface Details views.
To display downtime for all monitored interfaces on a node, add the Interface Downtime widget on node view.
4. To see a detailed view of a problematic section, position your cursor on the graph.
page 14
Change the time periodBy default, the Interface Downtime widget displays downtime data for the last 24 hours, one block representing 1 hour. You can display any time frame within the stored history.
1. Go to the Interface Downtime widget, and click Edit.
2. Select Custom in the Downtime Period list, and specify the Beginning and End dates and times.
3. When displaying longer time periods, you might need to change the time frame represented by one block. Select Custom in Display Settings, and provide a time period represented by one block.
4. Click Submit.
Set the retention period for interface downtime historyBy default, interface status history is stored in the database for 7 days.
1. Log in to the Orion Web Console as an administrator.
2. Click Settings > All Settings in the menu bar.
3. In the Thresholds & Polling grouping, click Polling Settings.
4. Scroll down to Database Settings, and enter a time to retain interface status history in the database in the Downtime History Retention field. Enter a value in days, from 7 to 60 days.
Disable interface downtime monitoringMonitoring interface downtime can affect the performance of SolarWinds NPM. To decrease the load, disable interface downtime monitoring. For periods where interface downtime was not monitored, the Interface Downtime widget shows gray blocks.
1. Log in to the Orion Web Console as an administrator.
2. Click Settings > All Settings in the menu bar.
3. In the Thresholds & Polling grouping, click Polling Settings.
4. Clear the Enable Downtime Monitoring box in the Network grouping.
5. Click Submit.
SolarWinds NPM does not monitor downtime for the interface any more. The Interface Downtime widget displays the message "Downtime monitoring is disabled. To enable it, go to Polling Settings.
ADMINISTRATOR GUIDE: NETWORK PERFORMANCE MONITOR
page 15
View interface health 1. In the Orion Web Console, go to the Node Details view.
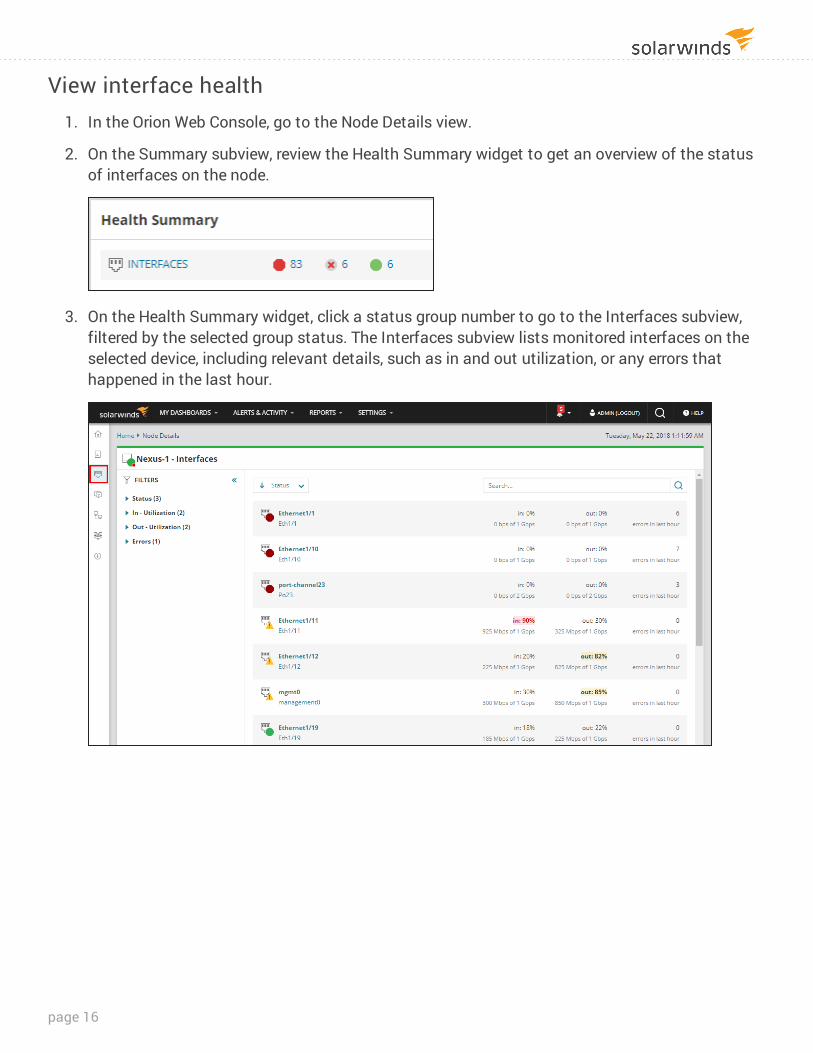
2. On the Summary subview, review the Health Summary widget to get an overview of the status of interfaces on the node.
3. On the Health Summary widget, click a status group number to go to the Interfaces subview, filtered by the selected group status. The Interfaces subview lists monitored interfaces on the selected device, including relevant details, such as in and out utilization, or any errors that happened in the last hour.
page 16
Display physical layout of interfaces on graphical stencils (Device View)Starting with NPM 2019.4, you can visually display interface status and utilization on the device layout for the following rack-mountable devices:
l Cisco Catalyst 2960
l Cisco Catalyst 3750
You need to have hardware health monitoring enabled on the device.
Switch stacks and devices with stackwise images, such as -UNIVERSALK9-M, are not supported in NPM 2019.4.
l EX 2200 Juniper switches
l EX 3300 Juniper switches
The physical layout is available on Node Details views, as the Device View tab.
1. In the Orion Web Console, go to the node details view for a node that is monitored using SNMP.
2. Click the Device View subview. Here, you can:
l See the status of interfaces on the physical layout l Find out more information on individual interfaces l See interfaces on all switches in a stack l Display In- and Out-utilization of individual interfaces l Add unknown interfaces for monitoring
Highlight interfaces with a certain status or interfaces on a VLAN l In the Status filter, select interface statuses to display. Filtered out interfaces become
transparent.
l In the VLAN filter, select one or more VLANs to highlight interfaces that belong to the selection.
The VLAN filter only displays the first 10 options. If there are more options available, click Show all and make your selection in the Options Picker pop-up.
You can combine the filters.
ADMINISTRATOR GUIDE: NETWORK PERFORMANCE MONITOR
page 17
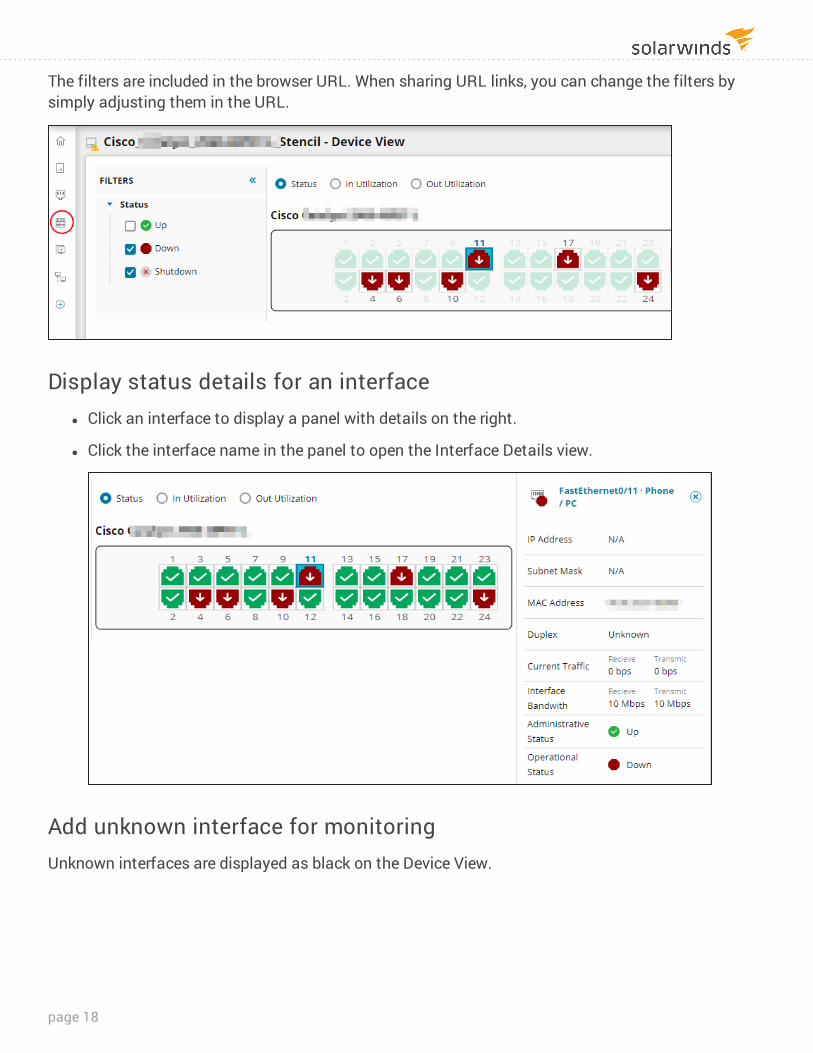
The filters are included in the browser URL. When sharing URL links, you can change the filters by simply adjusting them in the URL.
Display status details for an interface l Click an interface to display a panel with details on the right.
l Click the interface name in the panel to open the Interface Details view.
Add unknown interface for monitoringUnknown interfaces are displayed as black on the Device View.
page 18
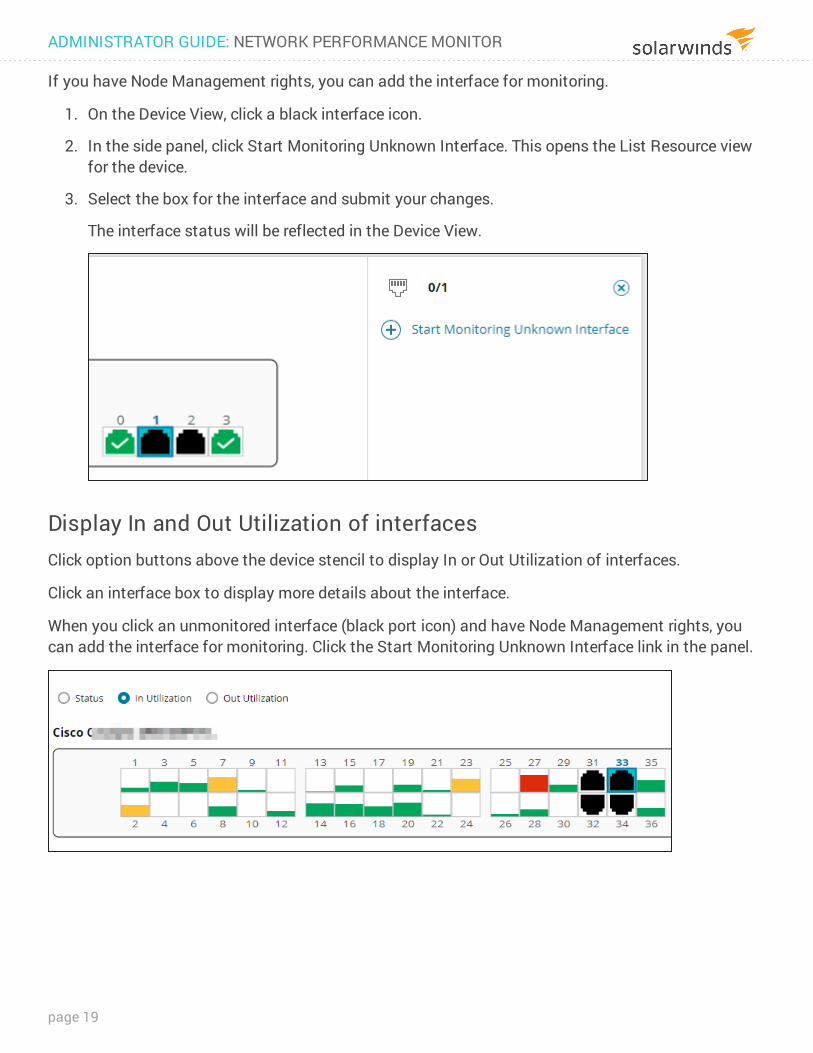
If you have Node Management rights, you can add the interface for monitoring.
1. On the Device View, click a black interface icon.
2. In the side panel, click Start Monitoring Unknown Interface. This opens the List Resource view for the device.
3. Select the box for the interface and submit your changes.
The interface status will be reflected in the Device View.
Display In and Out Utilization of interfacesClick option buttons above the device stencil to display In or Out Utilization of interfaces.
Click an interface box to display more details about the interface.
When you click an unmonitored interface (black port icon) and have Node Management rights, you can add the interface for monitoring. Click the Start Monitoring Unknown Interface link in the panel.
ADMINISTRATOR GUIDE: NETWORK PERFORMANCE MONITOR
page 19
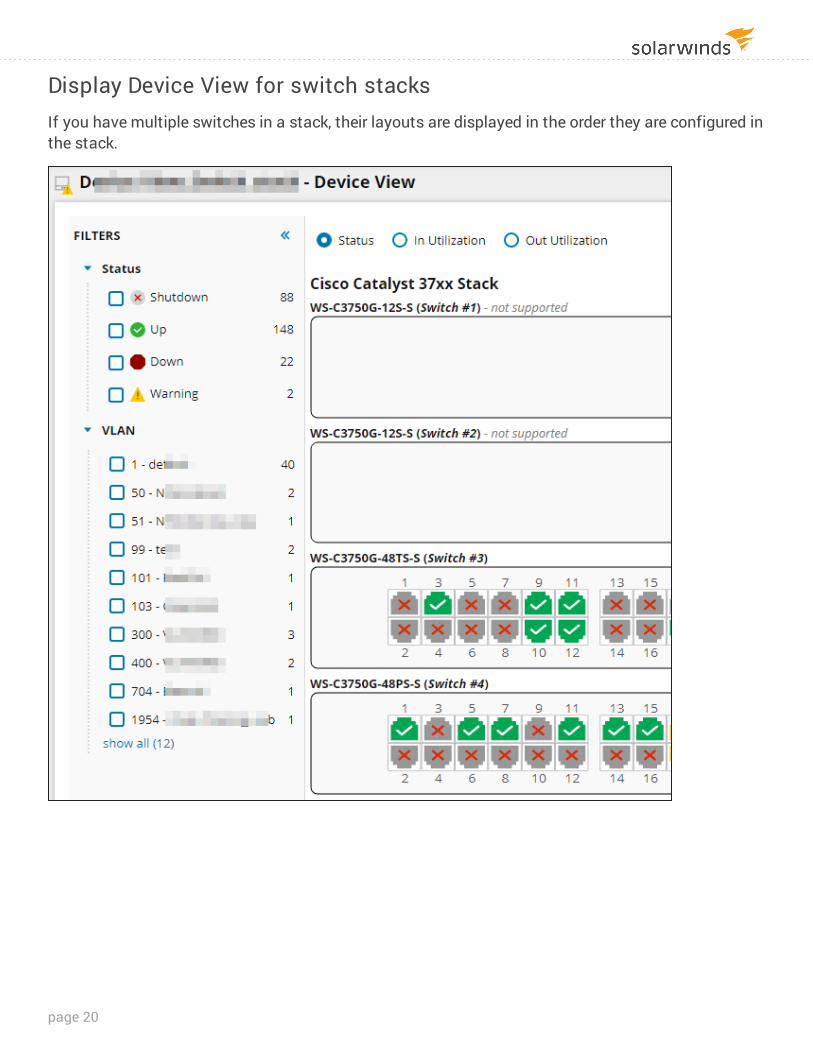
Display Device View for switch stacksIf you have multiple switches in a stack, their layouts are displayed in the order they are configured in the stack.
page 20
Detect and predict duplex mismatches in NPMOne of the most common causes of performance issues on 10/100 or 100/1000 Mbit Ethernet links occurs when one port on the link operates at half-duplex while the other port operates at full-duplex.
1. Log into the Orion Web Console.
2. Go to the node details view for the parent node of the interface you want to check for duplex problems.
3. Consult the Possible Duplex Mismatches widget. If there are no errors, the widget is hidden.
The widget lists all duplex interfaces on the node, the percentage of transmit and receive errors, and the neighboring node and interface. If the neighboring interface or node is not monitored, the appropriate columns are empty.The last column displays the duplex mode issue - Mismatch, or Unknown.
Duplex Mismatch
To be able to detect duplex mismatches, your nodes need to meet the following requirements:
l The nodes must be monitored. l The nodes must be in the up state during the discovery. l The nodes must support topology and be interconnected. l Duplex of both devices must be identified as full or half.
The widget shows all duplex mismatches, not only 100% duplex mismatches. These are reported on by the Duplex Mismatch alert.
Possible Duplex Mismatch
If at least one of the link interfaces has the duplex mode defined as half or full, the widget helps you identify possible mismatches.
Possible duplex mismatches are visible in the duplex mode column as the Unknown duplex mode. They are identified in the following cases:
l If the switch port reports more than 0.5% receive or transmit errors. l If the switch port reports CRC errors. l If the switch port reports Late Collision errors.
How do I resolve mismatches?To resolve a duplex mismatch, make sure your hardware is working, and unify the duplex mode configuration on neighboring interfaces.
ADMINISTRATOR GUIDE: NETWORK PERFORMANCE MONITOR
page 21
Troubleshoot duplex mismatchesThe Possible Duplex Mismatches does not display on Node Details view
If the widget does not display on the node details view, there might be a performance issue due to the amount of interfaces and topology connections. Check the following logs for mismatch information:
C:\ProgramData\SolarWinds\Logs\Orion\OrionWeb.log
C:\ProgramData\SolarWinds\InformationService\v3.0\Orion.InformationService.log
The Possible Duplex Mismatches widget does not display percentage of errors
Possible causes:
l No statistical data for these interfaces. l A performance issue connected with getting statistic information for the widget.
Edit interface properties in NPM 1. Log in to the Orion Web Console as an administrator.
2. Click Settings > Manage Nodes.
3. Locate the parent node of the interface you want to manage, and expand the parent node.
4. Select the interface, and click Edit Properties.
5. Make your changes:
Edit the interface name
Adjust the interface name.
l In interface names, aliases, or descriptions, use only the following recommended characters:
a-z A-Z 0-9 space , . - _ ( ) /
l Do not use \ | : * ?, or angle brackets (< or >). Angle brackets and any strings contained within angle brackets are removed during polling, as bracketed text may be incorrectly parsed as web markup tags.
To display the interface as unplugged rather than down, select Display Interface as Unplugged.
page 22
Designate bandwidth for the interface
Default transmit and receive bandwidths are 1000 Mb/s. If a device does not report its bandwidth, or the interface bandwidth is constrained by other network devices, specify a custom bandwidth that reflects the performance of the interface.
Select Custom Bandwidth, and provide values for Transmit and Receive Bandwidth, in Mb/s.
Change polling interval
Edit how often SolarWinds NPM polls the interface status and performance data.
Interface Status Polling is the interval in seconds between the status checks on the selected interface. By default, interface status is checked every 120 seconds.
Collect Statistics is the interval in minutes on which performance statistics for the interface are determined. By default, it is every 9 minutes.
Custom properties and dependencies
Provide values for custom properties for the interface, and edit dependencies. See Creating Custom Properties and Network object dependencies.
Customize alerting thresholds for the interface
You can customize thresholds whose reaching triggers alerts for individual interfaces. You can change alerting thresholds for the following metrics on the interface:
l Received /Transmit Interface Errors and Discards l Receive/Transmit Interface Utilization
To customize a threshold, select Override Orion General Thresholds next to the metric, and provide values for Warning and Critical Thresholds.
6. Click Submit.
The interface properties in SolarWinds NPM change according to your updates.
Suspend collecting data for interfaces in NPMMonitored interfaces are regularly polled for operational status, and collected statistics are displayed in the Orion Web Console.
ADMINISTRATOR GUIDE: NETWORK PERFORMANCE MONITOR
page 23
Maintenance modeTo temporarily stop collecting data or triggering alerts for interfaces, put the interface or the parent node into a maintenance mode.
1. Go to Manage Nodes, and navigate to the interfaces.
2. Select the interfaces, and select a maintenance mode option:
l Mute alerts: data for the interface is collected, but alerts do not trigger. l Stop collecting data: data for the interface is not collected and alerts do not trigger. l Schedule a maintenance period: specify a period of time to stop collecting data or mute
alerts for the interface.
The maintenance mode settings change according to your settings. For information about resuming alerts, starting collecting statistics, or editing the scheduled maintenance, see the section on Maintenance Mode for nodes.
Set the interface status as UnpluggableIf you do not want to be notified when an interface is down, you can specify that the interface is Unpluggable. The interface status is reflected in the status of the parent node and in alerts.
1. On the Node Management view, select the interface, and click Edit Properties.
2. Select Display Interface as Unplugged Rather Than Down, and click Submit.
The interface status does not influence the status of the parent node.
Unmanage an interfaceIf you do not want to poll any data for an interface, unmanage it.
1. Click Settings > Manage Nodes.
2. Ensure that the Show drop-down list is set to Interfaces.
3. Select Interfaces to unmanage.
page 24
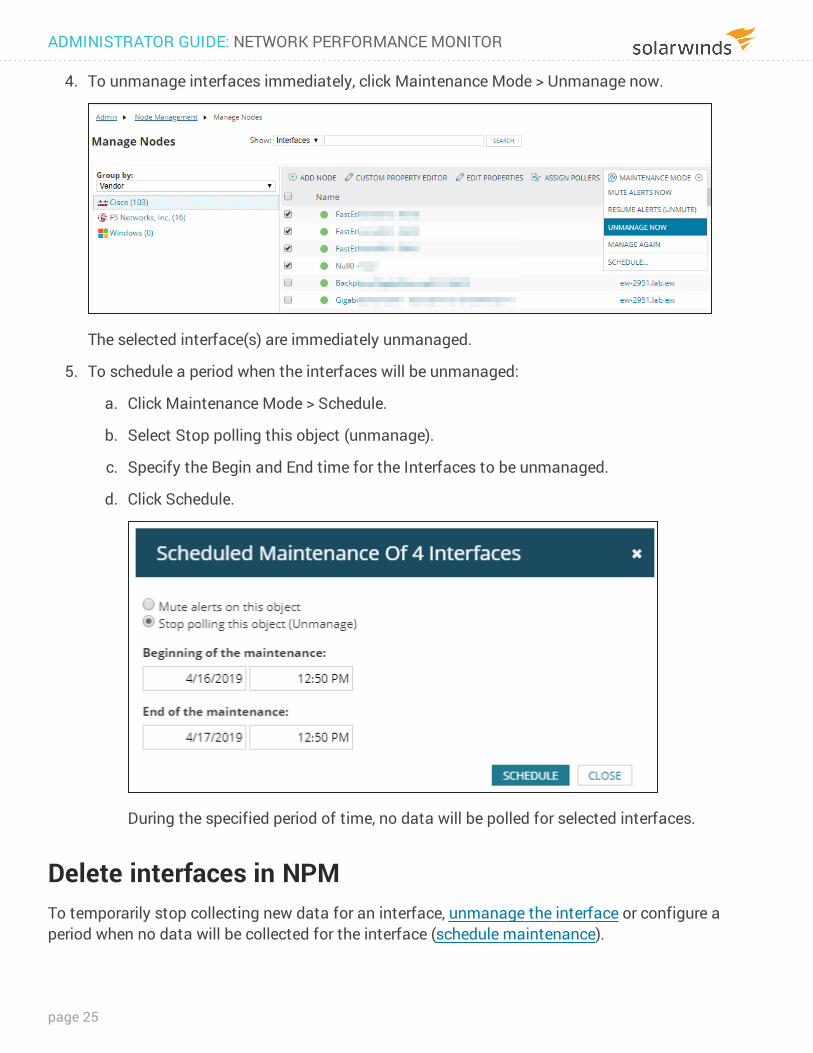
4. To unmanage interfaces immediately, click Maintenance Mode > Unmanage now.
The selected interface(s) are immediately unmanaged.
5. To schedule a period when the interfaces will be unmanaged:
a. Click Maintenance Mode > Schedule.
b. Select Stop polling this object (unmanage).
c. Specify the Begin and End time for the Interfaces to be unmanaged.
d. Click Schedule.
During the specified period of time, no data will be polled for selected interfaces.
Delete interfaces in NPMTo temporarily stop collecting new data for an interface, unmanage the interface or configure a period when no data will be collected for the interface (schedule maintenance).
ADMINISTRATOR GUIDE: NETWORK PERFORMANCE MONITOR
page 25
To stop monitoring an interface with NPM, remove the interface from monitored resources on the node or delete the interface:
l Remove the interface from resources monitored on the parent node: On the node details view, click List Resources in the Management widget, and clear the interface box.
l If you cannot find the interface in resources monitored on the node, you have probably changed its details and NPM is having issues with mapping the interface. In this case, delete and re-add the interface.
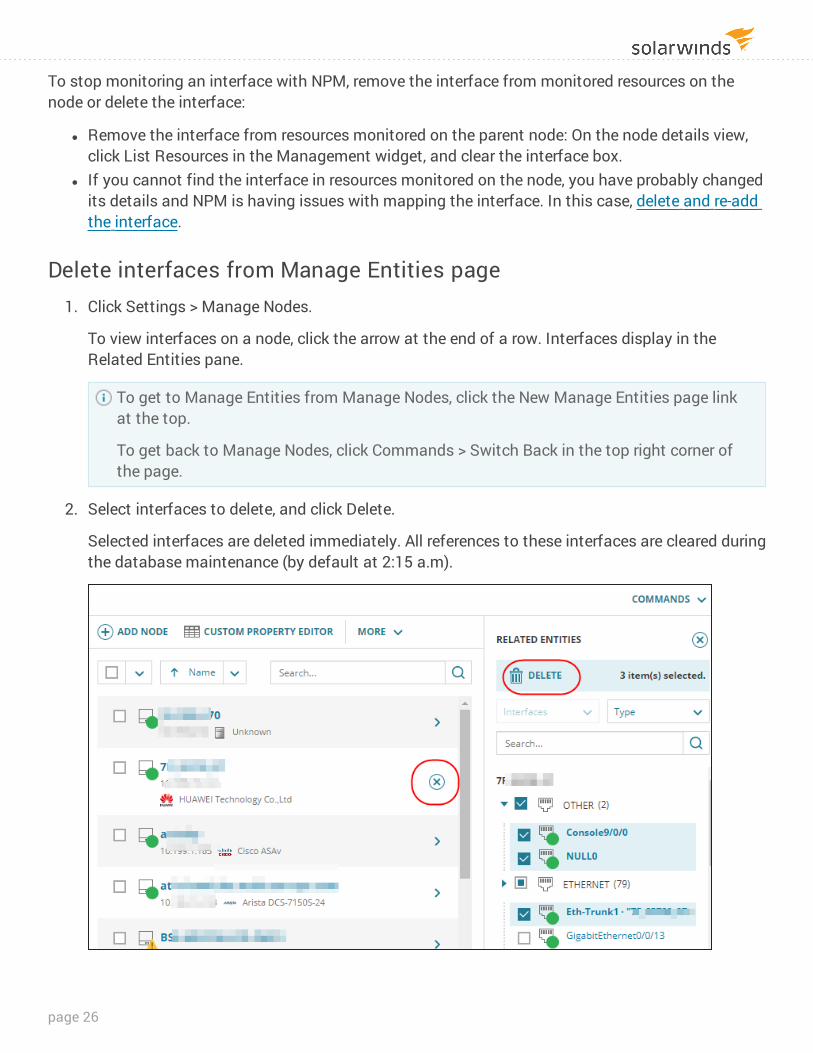
Delete interfaces from Manage Entities page 1. Click Settings > Manage Nodes.
To view interfaces on a node, click the arrow at the end of a row. Interfaces display in the Related Entities pane.
To get to Manage Entities from Manage Nodes, click the New Manage Entities page link at the top.
To get back to Manage Nodes, click Commands > Switch Back in the top right corner of the page.
2. Select interfaces to delete, and click Delete.
Selected interfaces are deleted immediately. All references to these interfaces are cleared during the database maintenance (by default at 2:15 a.m).
page 26
Delete interfaces from Manage Nodes 1. Log in to the Orion Web Console, and click Settings > Manage Nodes.
2. In the Show drop-down, select Interfaces.
3. Use the options in the Group by list or the Search field to locate interfaces to delete.
4. Select the interfaces and click Delete in the menu bar.
Selected interfaces are deleted immediately. All references to these interfaces are cleared during the database maintenance (by default at 2:15 a.m).
Remotely manage monitored interfaces in NPMUsing the Node Management utility, you can shut down or enable interfaces, and remotely override configured EnergyWise power settings.
To manage interfaces remotely, the parent node must have not only a Community String, but also the Read/Write Community String set correctly. See Edit polling settings.
1. Log in to the Orion Web Console as an administrator.
2. Click Settings > Manage Nodes.
3. Expand the parent node of the interface.
To find the node, use the filter and search tools above the nodes list.
4. Select the interfaces to manage.
5. To shut down the interfaces, click More Actions > Shut Down, and click OK to confirm.
6. To enable the interfaces, click More Actions > Enable.
7. If the selected interface is EnergyWise-enabled, you can override the current power level setting. Click More Actions > Override Power Level, set the power level, and click OK.
Remote overrides are temporary and reset in accordance with your configured EnergyWise policy for the selected interface. See Temporarily reset the current power level of a monitored EnergyWise interface in NPM.
ADMINISTRATOR GUIDE: NETWORK PERFORMANCE MONITOR
page 27
Troubleshoot nodes and interfaces that are UnknownThis article provides information about the device status in Orion Platform products (adjusted for NPM), how it is polled, and what you can do if your nodes or interfaces have the Unknown status.
l Device status l Unknown status l No data even though the node is Up
Device statusBy default, node status is detected using ICMP. The Orion Platform sends a ping request and if the response is not returned, it places the node into the Warning state and fast-polls the device for 120 seconds. If the node still does not respond, the Orion Platform notifies you that the node is Down.
ICMP only tells you the Orion Platform did not receive a response for the ping request. The device could be down, but there might also be a routing problem, an intermediary device could be down, or something could have blocked the packet on its way to or from the device. See Get more details about the node in the NPM Getting Started Guide for more details.
Status of sub-elements, such as interfaces and volumes, is detected using SNMP. This is more accurate, because the device tells you that the sub-element is Down.
Unknown status
Unknown status tells you that the node, or the sub-element (interface or volume) cannot be polled for response time and status.
When you add a node to the Orion Platform or remanage a node, its status is Unknown until the data is polled. By default, the interval for polling status is two minutes.
If a node stays in the Unknown status longer than the polling interval, perform the following:
l Ping the device from the polling engine the device is assigned to using the command line. If you are able to reach the device, status and response time data should also be available for the Orion Platform.
l Verify that the status and response time are polled through ICMP (ping). l If you are polling the node through SNMP, verify that the polling method is set correctly. l Make sure the status poller is enabled. l For Unknown interfaces, re-add the interface to NPM.
page 28
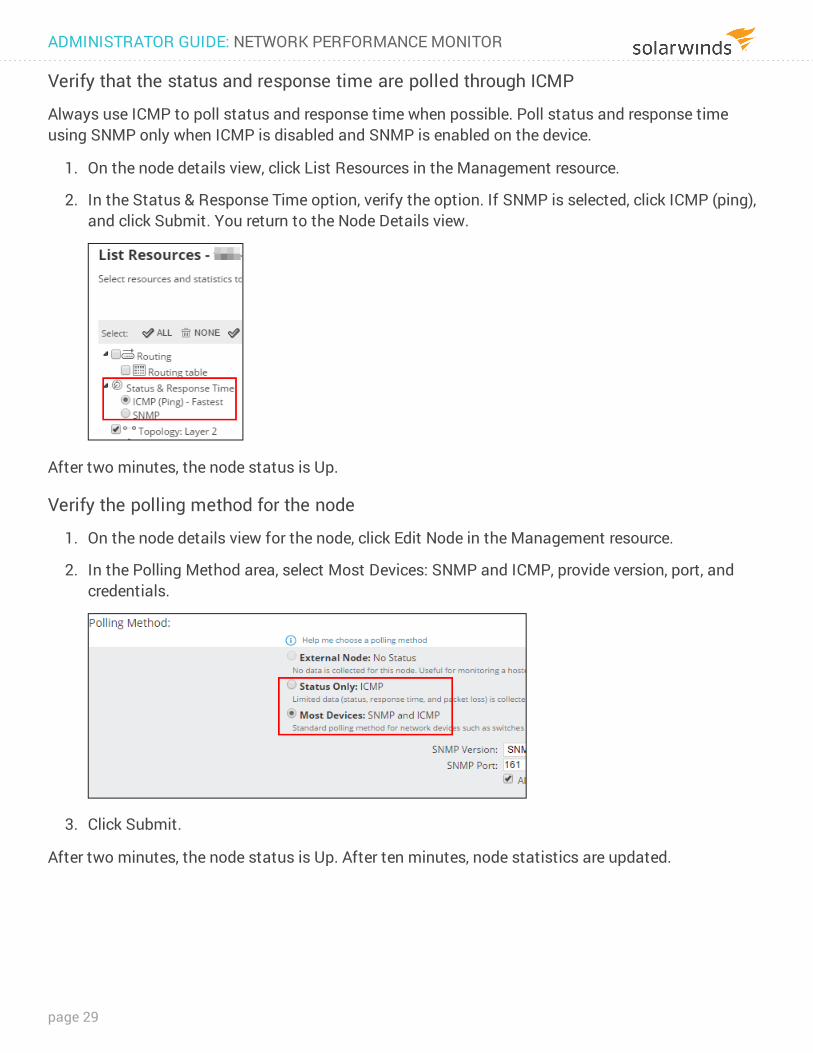
Verify that the status and response time are polled through ICMP
Always use ICMP to poll status and response time when possible. Poll status and response time using SNMP only when ICMP is disabled and SNMP is enabled on the device.
1. On the node details view, click List Resources in the Management resource.
2. In the Status & Response Time option, verify the option. If SNMP is selected, click ICMP (ping), and click Submit. You return to the Node Details view.
After two minutes, the node status is Up.
Verify the polling method for the node
1. On the node details view for the node, click Edit Node in the Management resource.
2. In the Polling Method area, select Most Devices: SNMP and ICMP, provide version, port, and credentials.
3. Click Submit.
After two minutes, the node status is Up. After ten minutes, node statistics are updated.
ADMINISTRATOR GUIDE: NETWORK PERFORMANCE MONITOR
page 29
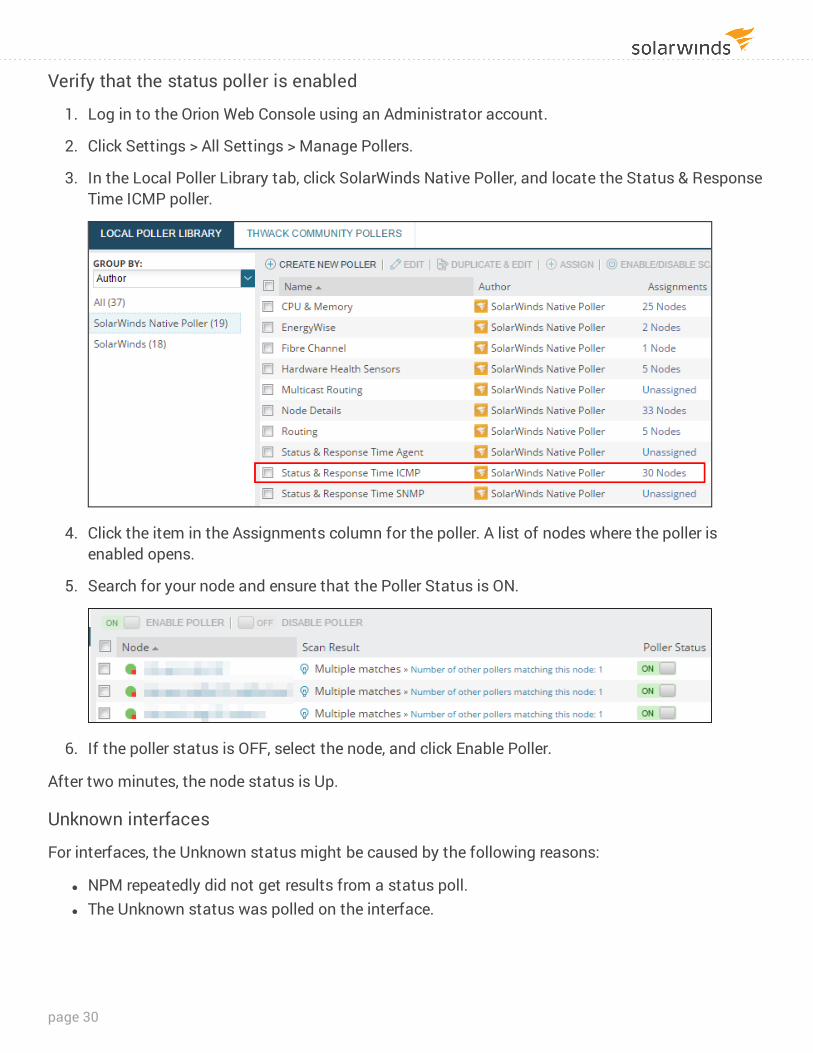
Verify that the status poller is enabled
1. Log in to the Orion Web Console using an Administrator account.
2. Click Settings > All Settings > Manage Pollers.
3. In the Local Poller Library tab, click SolarWinds Native Poller, and locate the Status & Response Time ICMP poller.
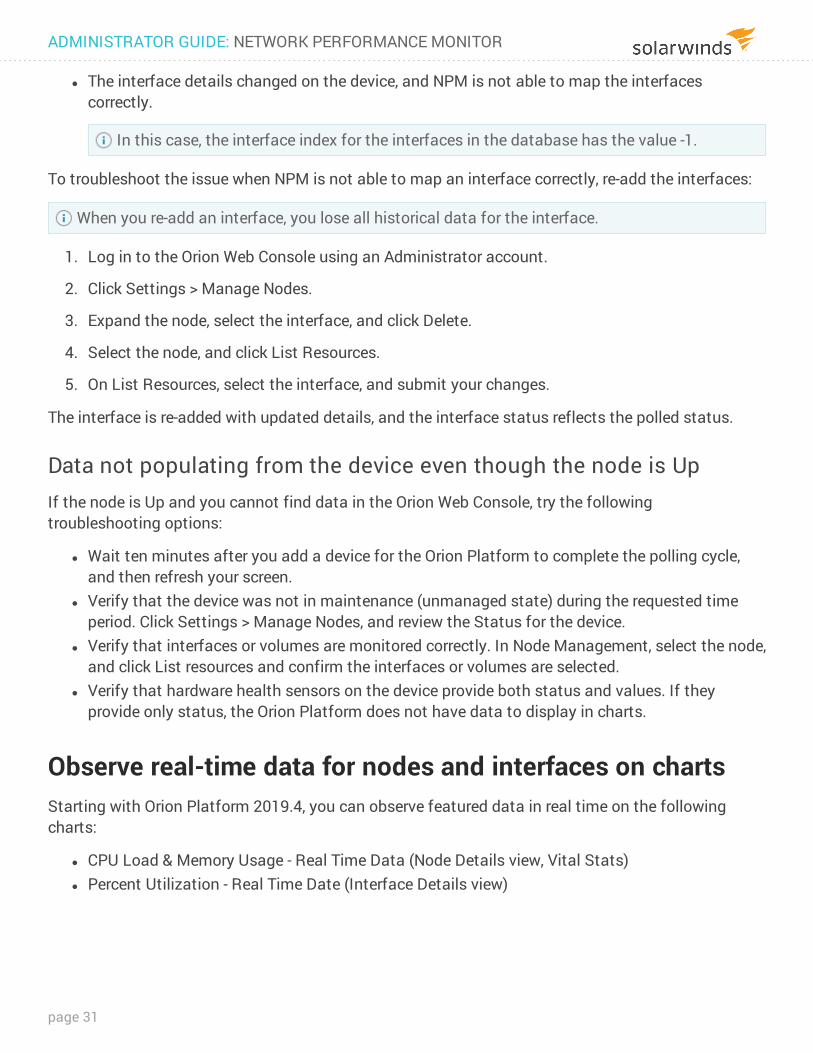
4. Click the item in the Assignments column for the poller. A list of nodes where the poller is enabled opens.
5. Search for your node and ensure that the Poller Status is ON.
6. If the poller status is OFF, select the node, and click Enable Poller.
After two minutes, the node status is Up.
Unknown interfaces
For interfaces, the Unknown status might be caused by the following reasons:
l NPM repeatedly did not get results from a status poll. l The Unknown status was polled on the interface.
page 30
l The interface details changed on the device, and NPM is not able to map the interfaces correctly.
In this case, the interface index for the interfaces in the database has the value -1.
To troubleshoot the issue when NPM is not able to map an interface correctly, re-add the interfaces:
When you re-add an interface, you lose all historical data for the interface.
1. Log in to the Orion Web Console using an Administrator account.
2. Click Settings > Manage Nodes.
3. Expand the node, select the interface, and click Delete.
4. Select the node, and click List Resources.
5. On List Resources, select the interface, and submit your changes.
The interface is re-added with updated details, and the interface status reflects the polled status.
Data not populating from the device even though the node is UpIf the node is Up and you cannot find data in the Orion Web Console, try the following troubleshooting options:
l Wait ten minutes after you add a device for the Orion Platform to complete the polling cycle, and then refresh your screen.
l Verify that the device was not in maintenance (unmanaged state) during the requested time period. Click Settings > Manage Nodes, and review the Status for the device.
l Verify that interfaces or volumes are monitored correctly. In Node Management, select the node, and click List resources and confirm the interfaces or volumes are selected.
l Verify that hardware health sensors on the device provide both status and values. If they provide only status, the Orion Platform does not have data to display in charts.
Observe real-time data for nodes and interfaces on chartsStarting with Orion Platform 2019.4, you can observe featured data in real time on the following charts:
l CPU Load & Memory Usage - Real Time Data (Node Details view, Vital Stats) l Percent Utilization - Real Time Date (Interface Details view)
ADMINISTRATOR GUIDE: NETWORK PERFORMANCE MONITOR
page 31
Observe real-time data on charts
l To see CPU Load & Memory Usage, go to a node details view and click the Vital Stats subview. l To see Percent Utilization, open an interface details view.
When you open a page with a real-time chart, real-time polling starts automatically. By default, the data is updated every two seconds.
When you leave the page, real-time polling stops in 120 seconds.
Real-time charts show data for a constant time frame of ten minutes. You cannot change the time frame.
I cannot see the real-time chart on my node/interface details page
If there is no data to display, real-time charts are not displayed.
l Open the node in PerfStack. If you can see real-time data there, you should be able to see real-time data on the real-time chart.
l Make sure the node/interface is monitored by the Orion Platform for a few minutes.
Real-Time Data charts do not display immediately when you add the node/interface because the identification of real-time polling capabilities takes some time, usually it is around 5-10 minutes.
If there is data to display, an administrator might have removed the chart from the view. You can add the widget.
I cannot see both metrics on the real-time chart
If your devices do not support both charted metrics, real-time charts only display the data for the supported metric.
I want the charts to update less frequently.
Change the refresh time:
1. Click Settings > All Settings, and then click Web Console Settings.
2. Scroll down to Modern Chart Settings, and adjust the Real time charts refresh time.
page 32
Monitor capacity usage trends on the network and forecast capacity issues in NPMCapacity forecasting is available for the following metrics of nodes, interfaces, and volumes monitored by SolarWinds NPM:
l CPU utilization on nodes l Memory usage on nodes l Space usage on volumes l Receive (in) utilization on interfaces l Transmit (out) utilization on interfaces
Capacity usage trends are calculated based on historical data. By default, the longest time period taken into account for calculating the capacity forecast is 180 days.
The more historical data up to 180 days are available, the more precise is the calculated forecast.
Forecast calculation methods
l Peak calculation forecasts trends using daily maximum values. This method is suitable for important devices and connections where it is important to completely avoid reaching a certain usage level (threshold).
l Average calculation forecasts trends using daily average values. This method is suitable for non-critical network devices or connections where short periods exceeding the threshold level are acceptable.
By default, the forecast calculation method is set globally for all monitored objects. You can also customize the method for individual objects (nodes, interfaces, or volumes).
Requirements
Capacity forecasting is available for nodes, interfaces, and volumes that meet the following requirements:
l The nodes, interfaces, and volumes must be managed in SolarWinds NPM. l You need to have enough historical data in the database. By default, 7 days of data are
required.
ADMINISTRATOR GUIDE: NETWORK PERFORMANCE MONITOR
page 33
Forecast capacity for nodes, interfaces, or volumes in NPMConsult graphs or tables to see usage trends of devices on your network, and find out when the capacity of the devices will be fully used.
Locate pending capacity problemsConsult the Top XX Capacity Problems widget to see a list of objects whose usage trend is rising.
If the widget is not in a view, add it.
View capacity usage trends and forecast in graphsTo see a graphical display of capacity usage trends, go to the details view for the node, volume, or interface, and consult the forecast chart:
l CPU Capacity Forecast Chart l Memory Capacity Forecast Chart l Storage Capacity Forecast Chart l Interface Utilization Receive Forecast Chart l Interface Utilization Transmit Forecast Chart
View capacity usage trends and forecast in tablesFor a brief overview of usage trends for a node, volume, or interface, go to the details view for the object, and consult the widget:
l Node Capacity provides an overview of both CPU load and percent memory usage in the past 6 months, a forecast when the warning and critical thresholds will be exceeded, and when the resource will be fully used.
l Volume Capacity provides an overview of volumes capacity usage in the past 6 months, a forecast when the warning and critical thresholds will be exceeded, and when the volume capacity will be fully used.
Forecasts in this widget are calculated using the default method (peak or average) specified for the widget.
page 34
Add capacity forecasting widgets
Capacity forecasting widgets display only on views for which they are relevant. For example, interface utilization widgets can only be added on interface detail views.
1. Log in to the Orion Web Console and go to the view where you want to add the widget.
2. Click the pencil icon on the upper left.
3. Click Add widgets on the upper right.
4. Type "forecast" or "capacity" into the Search field.
5. Drag and drop the widget on the page where you want it to be, including in a new column.
6. When complete, click Done Adding Widgets, and then Done Editing. The view is now populate with the widgets you selected.
Change capacity forecasting settings globally in NPMCapacity forecasting settings include the forecast calculation method and thresholds for the metrics. By default, the settings are set globally.
See Customize capacity forecasting settings for single nodes, interfaces, or volumes in NPM.
Change calculation method and thresholds for nodes or volumes 1. Click Settings > All Settings, and select Orion Thresholds in the Thresholds & Polling section.
If you are in a capacity forecasting widget, click Edit, and click Orion General Thresholds.
2. Specify values for Critical Level and Warning for the metrics:
l AVG CPU Load for CPU usage on nodes l Disk Usage for volume capacity usage l Percent Memory Used for memory usage on nodes
3. For each metric, select the calculation method.
l Calculate exhaustion using average daily values l Calculate exhaustion using peak daily values
4. Click Submit.
You have changed the method and thresholds for calculating capacity forecast for monitored nodes and volumes.
ADMINISTRATOR GUIDE: NETWORK PERFORMANCE MONITOR
page 35
Change calculation method and thresholds for interfaces 1. Click Settings > All Settings, and select NPM Thresholds in the Thresholds & Polling section.
2. Go to the Interface Percent Utilization section, define the Critical and Warning threshold values for the metric.
3. Select the calculation method:
l Calculate exhaustion using average daily values l Calculate exhaustion using peak daily values
4. Click Submit.
You have changed the method and thresholds for calculating capacity forecast for monitored interfaces.
Customize capacity forecasting settings for single nodes, interfaces, or volumes in NPMYou can set different forecast calculation methods and thresholds for individual nodes and volumes.
For interfaces, the calculation method is set globally, and you can customize only the thresholds.
Set warning and critical thresholds for critical nodes, interfaces, or volumes to lower percentages, so that you have enough time to take measures before capacity issues occur.
Customize capacity forecasting thresholds and calculation methods for nodes:
1. Log in to the Orion Web Console as an administrator.
2. Open the Edit Properties page for the node.
Go to Settings > Manage Nodes, select the node, and click Edit Properties.
If you are in a capacity forecasting resource, click Edit, and click the link to the node's Edit Properties page.
3. On the Edit Properties page, scroll down to Alerting Thresholds.
4. Select Override Orion General Thresholds for CPU Load or Memory Usage, and define the Warning and Critical threshold levels.
page 36
5. Select the method for calculating trends:
l Calculate exhaustion using average daily values l Calculate exhaustion using peak daily values
If you want to use baseline thresholds, click Use Dynamic Baseline Thresholds. See Orion baseline data calculation.
6. Click Submit.
You have changed the method and thresholds for calculating capacity forecast for the node.
Customize capacity forecasting settings for interfaces: 1. Log in to the Orion Web Console as an administrator.
2. Open the Edit Properties page for the interface.
Go to Settings > Manage Nodes. Expand the parent node, select the interface, and click Edit Properties.
If you are in an interface capacity forecasting resource, click Edit, and click the link to the interface's Edit Properties page.
3. On the Edit Properties page, scroll down to Alerting Thresholds.
4. Select Override Orion General Thresholds for Receive Interface Utilization or Transmit Interface Utilization, and customize the Warning and Critical threshold levels.
If you want to use baseline thresholds, click Use Dynamic Baseline Thresholds. See Orion baseline data calculation.
5. Click Submit.
You have changed the thresholds for calculating capacity forecast for the interface.
Customize capacity forecasting settings for volumes: 1. Log in to the Orion Web Console as an administrator.
2. Go to Settings > Manage Nodes.
3. Select the volume, and click Edit Properties.
To find the volume, locate the node, and click the + sign to display interfaces and volumes on the node.
ADMINISTRATOR GUIDE: NETWORK PERFORMANCE MONITOR
page 37
4. Select Override Orion Capacity Thresholds for Percent Disk Usage.
5. Customize the Warning and Critical threshold levels.
6. Select the appropriate method for calculating trends:
l Use Average values l Use Peak values
7. Click Submit.
You have changed the method and thresholds for calculating capacity forecast for the volume.
page 38
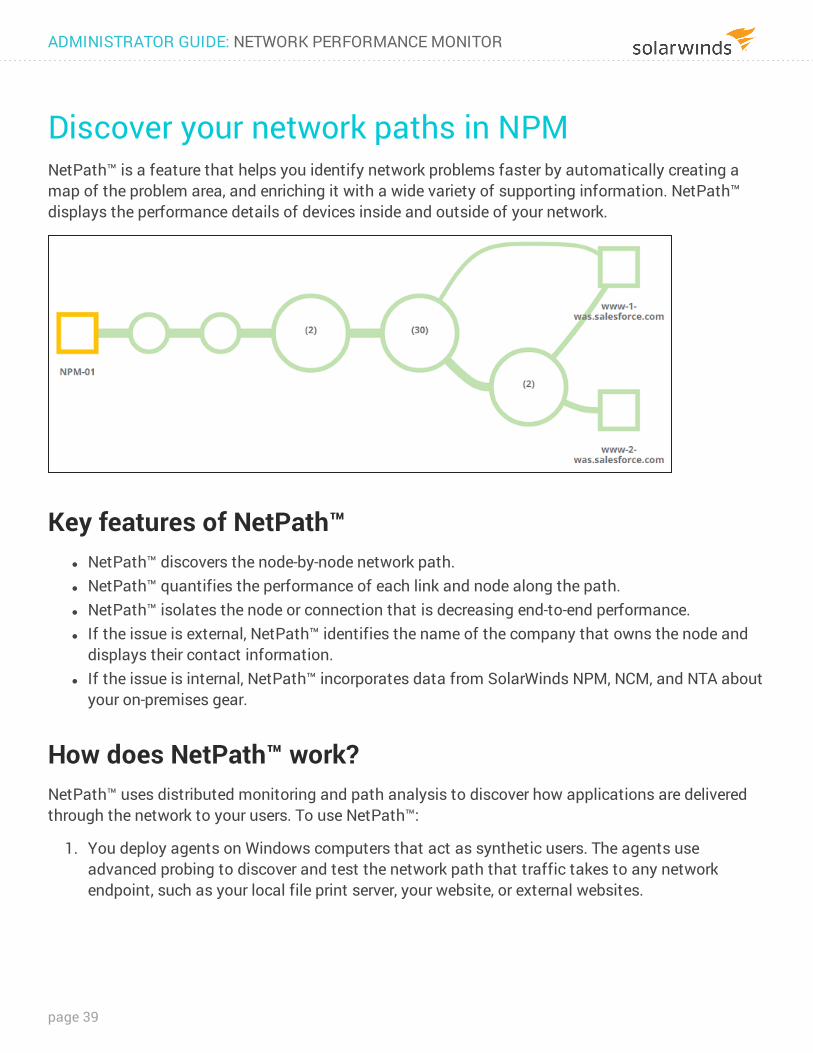
Discover your network paths in NPMNetPath™ is a feature that helps you identify network problems faster by automatically creating a map of the problem area, and enriching it with a wide variety of supporting information. NetPath™ displays the performance details of devices inside and outside of your network.
Key features of NetPath™ l NetPath™ discovers the node-by-node network path. l NetPath™ quantifies the performance of each link and node along the path. l NetPath™ isolates the node or connection that is decreasing end-to-end performance. l If the issue is external, NetPath™ identifies the name of the company that owns the node and
displays their contact information. l If the issue is internal, NetPath™ incorporates data from SolarWinds NPM, NCM, and NTA about
your on-premises gear.
How does NetPath™ work?NetPath™ uses distributed monitoring and path analysis to discover how applications are delivered through the network to your users. To use NetPath™:
1. You deploy agents on Windows computers that act as synthetic users. The agents use advanced probing to discover and test the network path that traffic takes to any network endpoint, such as your local file print server, your website, or external websites.
ADMINISTRATOR GUIDE: NETWORK PERFORMANCE MONITOR
page 39
2. After discovering the path and quantifying the performance of each node and connection, NetPath enriches the picture with additional data about Internet nodes. If you are monitoring non-Internet nodes with Orion, NetPath™ incorporates that data too.
3. The result is a clear end-to-end map of how applications are delivered to your users, including your network, the network of your provider, and any other networks you depend on.
NetPath™ answers the following questions:
l How well is my network delivering applications to my users? l Are the paths to key applications or users down? l Where is the network problem and who is responsible for it?
NetPath requirements for NPM
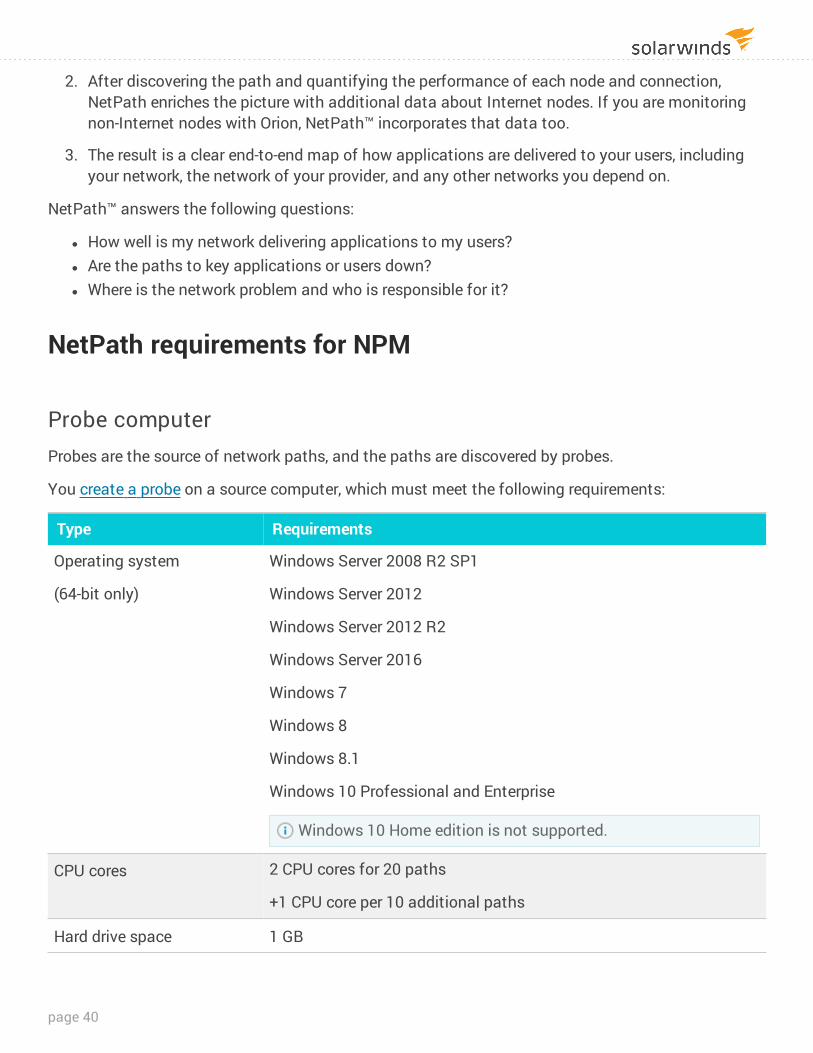
Probe computerProbes are the source of network paths, and the paths are discovered by probes.
You create a probe on a source computer, which must meet the following requirements:
Type Requirements
Operating system
(64-bit only)
Windows Server 2008 R2 SP1
Windows Server 2012
Windows Server 2012 R2
Windows Server 2016
Windows 7
Windows 8
Windows 8.1
Windows 10 Professional and Enterprise
Windows 10 Home edition is not supported.
CPU cores 2 CPU cores for 20 paths
+1 CPU core per 10 additional paths
Hard drive space 1 GB
page 40
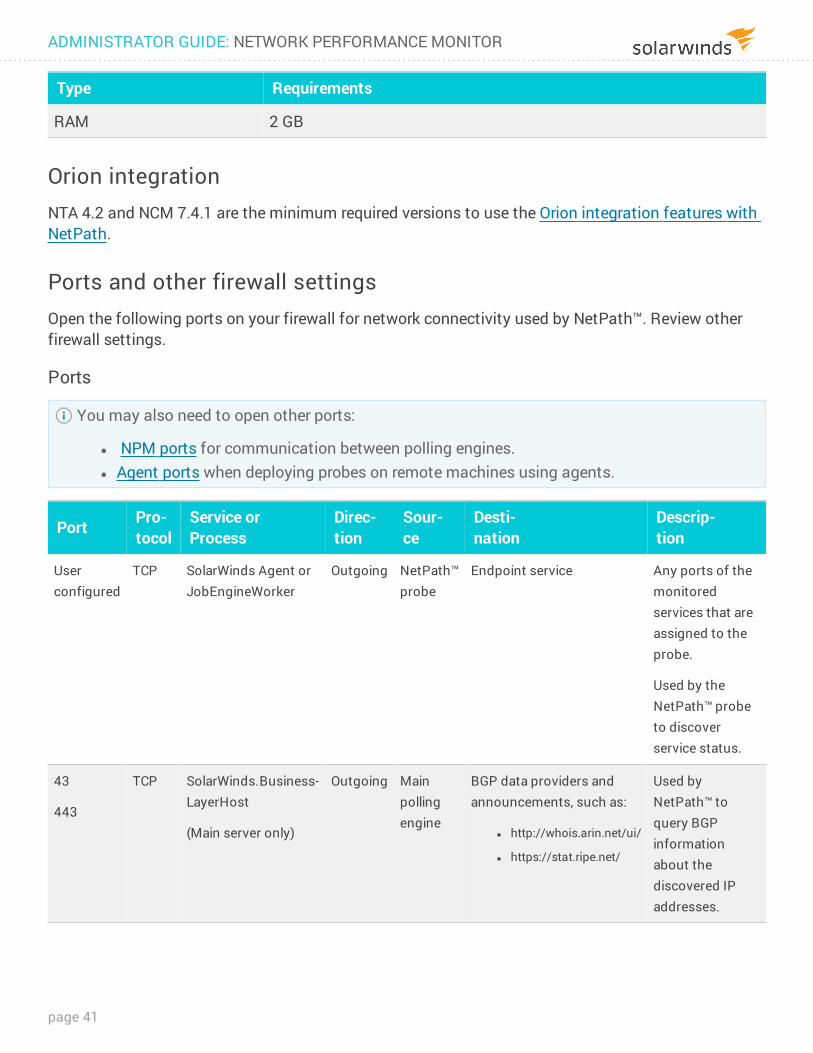
Type Requirements
RAM 2 GB
Orion integrationNTA 4.2 and NCM 7.4.1 are the minimum required versions to use the Orion integration features with NetPath.
Ports and other firewall settingsOpen the following ports on your firewall for network connectivity used by NetPath™. Review other firewall settings.
Ports
You may also need to open other ports:
l NPM ports for communication between polling engines. l Agent ports when deploying probes on remote machines using agents.
Port Pro-tocol
Service orProcess
Direc-tion
Sour-ce
Desti-nation
Descrip-tion
User configured
TCP SolarWinds Agent or JobEngineWorker
Outgoing NetPath™ probe
Endpoint service Any ports of the monitored services that are assigned to the probe.
Used by the NetPath™ probe to discover service status.
43
443
TCP SolarWinds.Business-LayerHost
(Main server only)
Outgoing Main polling engine
BGP data providers and announcements, such as:
l http://whois.arin.net/ui/
l https://stat.ripe.net/
Used by NetPath™ to query BGP information about the discovered IP addresses.
ADMINISTRATOR GUIDE: NETWORK PERFORMANCE MONITOR
page 41
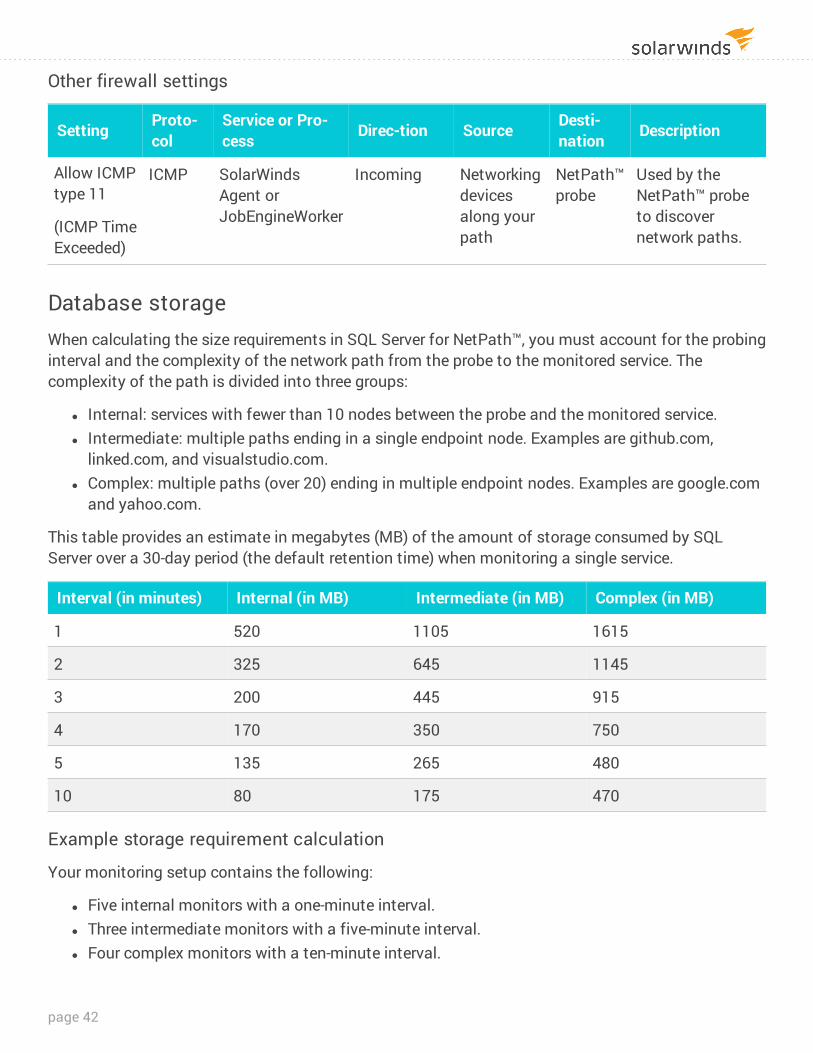
Other firewall settings
Setting Proto-col
Service or Pro-cess Direc-tion Source Desti-
nation Description
Allow ICMP type 11
(ICMP Time Exceeded)
ICMP SolarWinds Agent or JobEngineWorker
Incoming Networking devices along your path
NetPath™ probe
Used by the NetPath™ probe to discover network paths.
Database storageWhen calculating the size requirements in SQL Server for NetPath™, you must account for the probing interval and the complexity of the network path from the probe to the monitored service. The complexity of the path is divided into three groups:
l Internal: services with fewer than 10 nodes between the probe and the monitored service. l Intermediate: multiple paths ending in a single endpoint node. Examples are github.com,
linked.com, and visualstudio.com. l Complex: multiple paths (over 20) ending in multiple endpoint nodes. Examples are google.com
and yahoo.com.
This table provides an estimate in megabytes (MB) of the amount of storage consumed by SQL Server over a 30-day period (the default retention time) when monitoring a single service.
Interval (in minutes) Internal (in MB) Intermediate (in MB) Complex (in MB)
1 520 1105 1615
2 325 645 1145
3 200 445 915
4 170 350 750
5 135 265 480
10 80 175 470
Example storage requirement calculation
Your monitoring setup contains the following:
l Five internal monitors with a one-minute interval. l Three intermediate monitors with a five-minute interval. l Four complex monitors with a ten-minute interval.
page 42
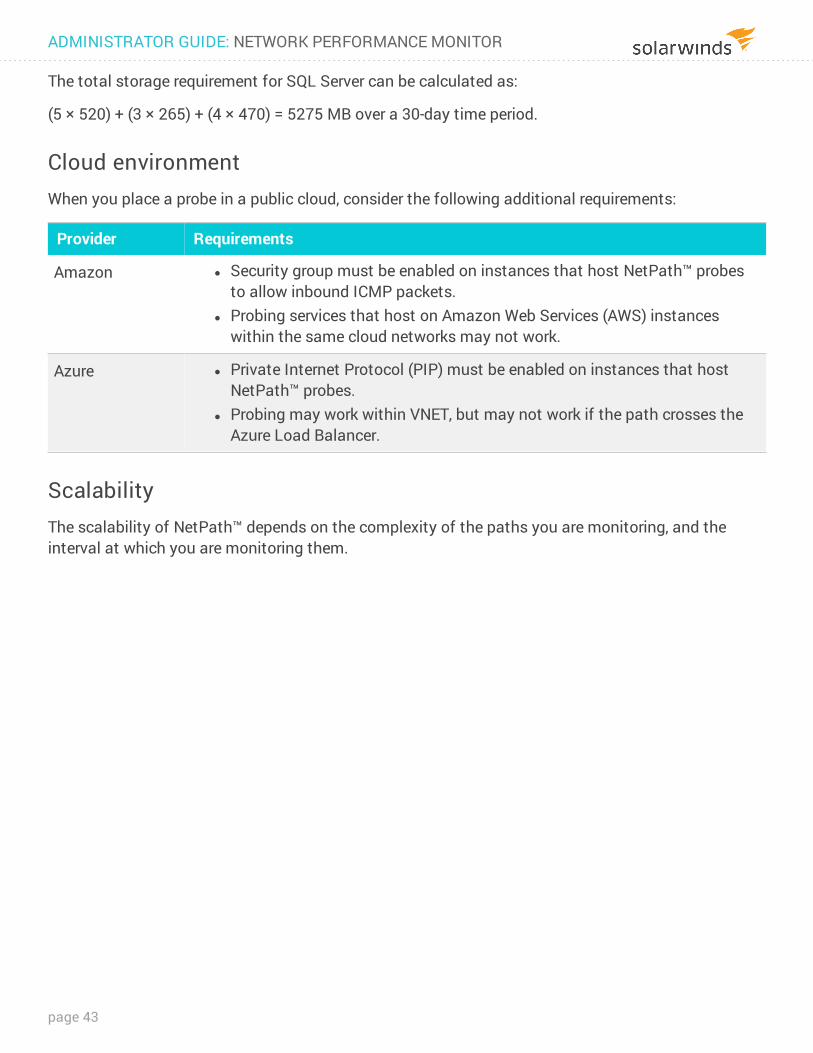
The total storage requirement for SQL Server can be calculated as:
(5 × 520) + (3 × 265) + (4 × 470) = 5275 MB over a 30-day time period.
Cloud environmentWhen you place a probe in a public cloud, consider the following additional requirements:
Provider Requirements
Amazon l Security group must be enabled on instances that host NetPath™ probes to allow inbound ICMP packets.
l Probing services that host on Amazon Web Services (AWS) instances within the same cloud networks may not work.
Azure l Private Internet Protocol (PIP) must be enabled on instances that host NetPath™ probes.
l Probing may work within VNET, but may not work if the path crosses the Azure Load Balancer.
ScalabilityThe scalability of NetPath™ depends on the complexity of the paths you are monitoring, and the interval at which you are monitoring them.
ADMINISTRATOR GUIDE: NETWORK PERFORMANCE MONITOR
page 43
In most network environments:
l You can add up to 100 paths per polling engine. l You can add 10 - 20 paths per probe.
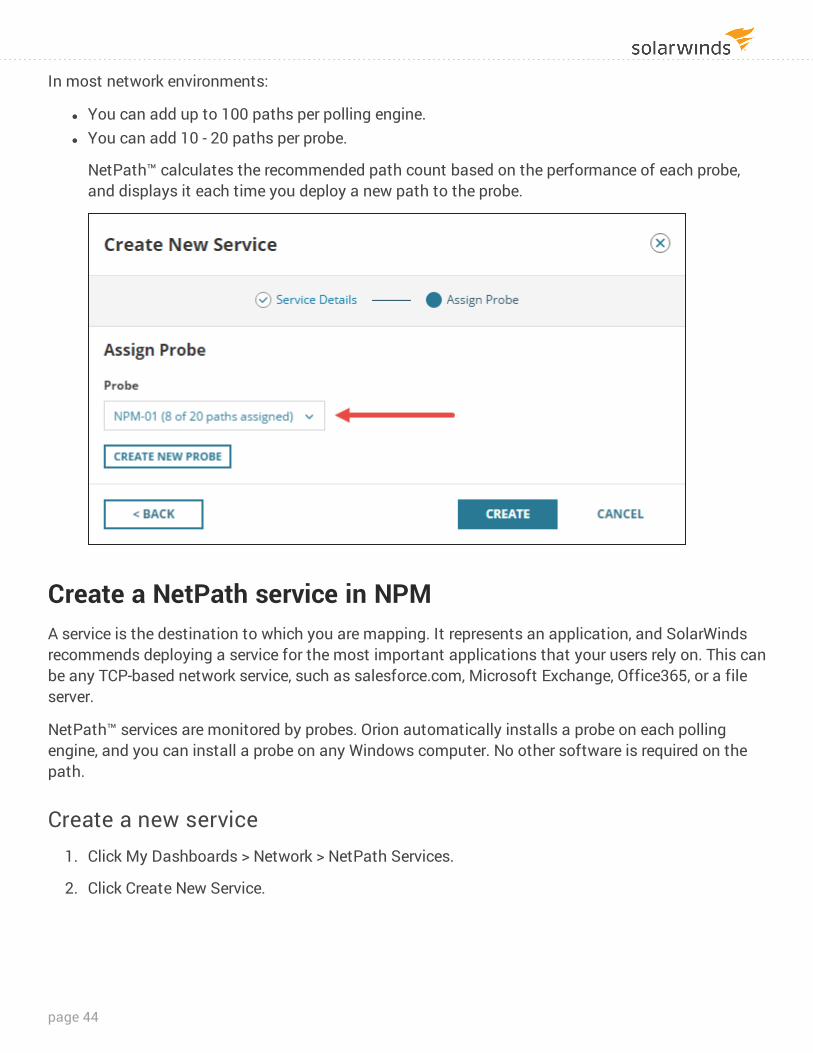
NetPath™ calculates the recommended path count based on the performance of each probe, and displays it each time you deploy a new path to the probe.
Create a NetPath service in NPMA service is the destination to which you are mapping. It represents an application, and SolarWinds recommends deploying a service for the most important applications that your users rely on. This can be any TCP-based network service, such as salesforce.com, Microsoft Exchange, Office365, or a file server.
NetPath™ services are monitored by probes. Orion automatically installs a probe on each polling engine, and you can install a probe on any Windows computer. No other software is required on the path.
Create a new service 1. Click My Dashboards > Network > NetPath Services.
2. Click Create New Service.
page 44
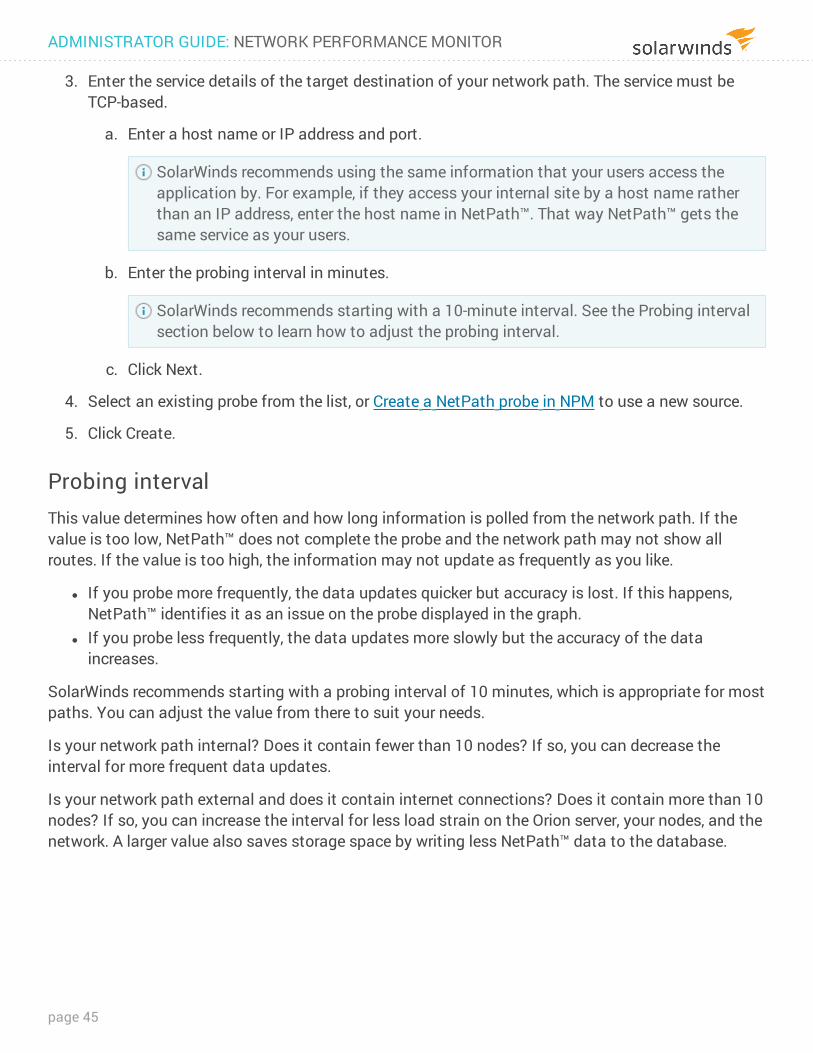
3. Enter the service details of the target destination of your network path. The service must be TCP-based.
a. Enter a host name or IP address and port.
SolarWinds recommends using the same information that your users access the application by. For example, if they access your internal site by a host name rather than an IP address, enter the host name in NetPath™. That way NetPath™ gets the same service as your users.
b. Enter the probing interval in minutes.
SolarWinds recommends starting with a 10-minute interval. See the Probing interval section below to learn how to adjust the probing interval.
c. Click Next.
4. Select an existing probe from the list, or Create a NetPath probe in NPM to use a new source.
5. Click Create.
Probing intervalThis value determines how often and how long information is polled from the network path. If the value is too low, NetPath™ does not complete the probe and the network path may not show all routes. If the value is too high, the information may not update as frequently as you like.
l If you probe more frequently, the data updates quicker but accuracy is lost. If this happens, NetPath™ identifies it as an issue on the probe displayed in the graph.
l If you probe less frequently, the data updates more slowly but the accuracy of the data increases.
SolarWinds recommends starting with a probing interval of 10 minutes, which is appropriate for most paths. You can adjust the value from there to suit your needs.
Is your network path internal? Does it contain fewer than 10 nodes? If so, you can decrease the interval for more frequent data updates.
Is your network path external and does it contain internet connections? Does it contain more than 10 nodes? If so, you can increase the interval for less load strain on the Orion server, your nodes, and the network. A larger value also saves storage space by writing less NetPath™ data to the database.
ADMINISTRATOR GUIDE: NETWORK PERFORMANCE MONITOR
page 45
Create a NetPath probe in NPMNetPath™ services are monitored by probes. Orion automatically installs a probe on each polling engine, and you can install a probe on any Windows computer. No other software is required on the path.
A probe is the source you are testing from. It is always the start of the path. Think of a probe as a representative of a user. SolarWinds recommends deploying probes where you have users, for example at each of your office locations.
The probe must be a Windows computer.
Create a probeYou can create a probe when you create a service, or while assigning an additional probe after you create the service:
1. Click My Dashboards > Network > NetPath Services.
2. Click next to an entry in the NetPath Services list.
3. Click Create New Probe.
4. Enter the required information on the Create New Probe window.
Enter the credentials that can be used to log in to the computer and install the software.
5. Click Create.
6. Select the probe from the list.
7. Click Assign.
Assign additional probes
Click next to an entry in the NetPath™ Services list to assign another probe to the service.
Probe troubleshootingIf you are creating a probe on an existing Orion Agent, you must enter the primary polling IP address used by Orion for that device.
Check the probe status
If you have other issues with probe deployment, you can check the probe status.
page 46
Probes are listed in the Manage Agents section of Agent Management. The NetPath™ probe relies on the Agent infrastructure built into Orion and used for things like QoE and SAM Agents. NetPath™ is an additional plugin in this agent framework.
1. Click Settings > All Settings.
2. Under Node & Group Management, click Manage Agents.
3. Locate the probe in the Agent/Node list by its host name, and select it.
4. Verify the Agent Status is Running, and that the Connection Status is Connected.
5. Click More Actions > View installed agent plugins.
6. Verify the NetPath™ Agent Plugin is installed.
You can also click Edit Settings to change the configuration of the probe, or Delete to remove it.
View a network path in NPM
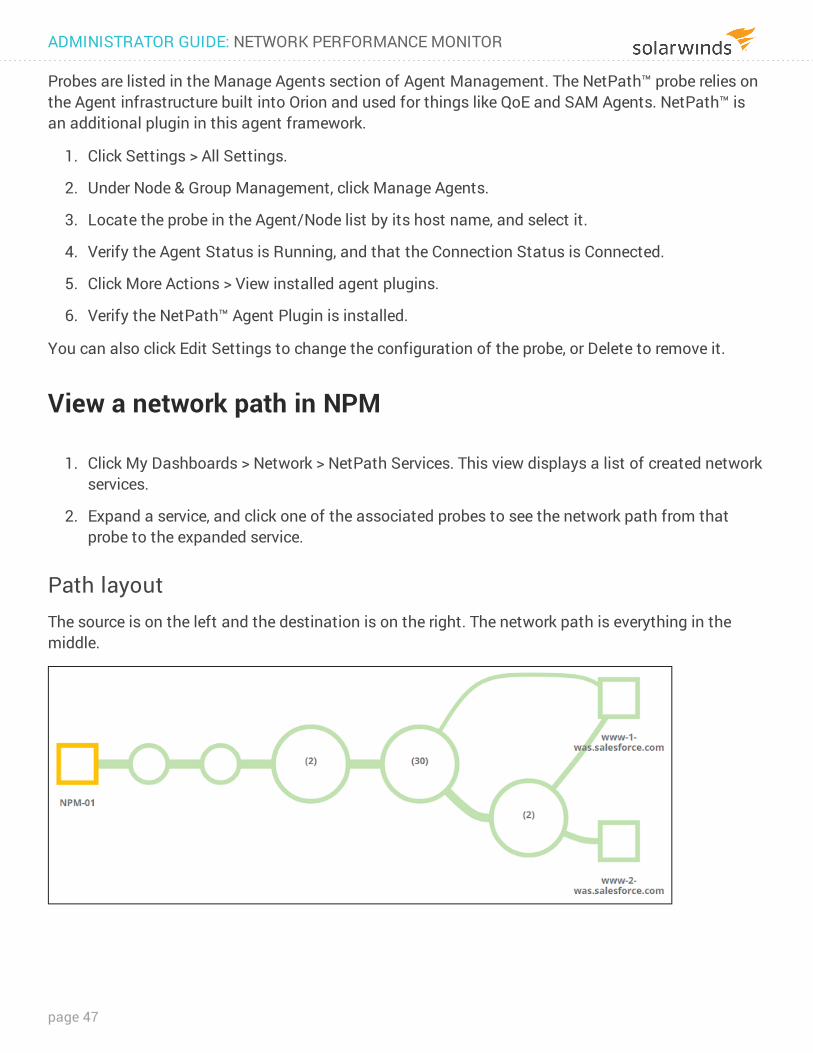
1. Click My Dashboards > Network > NetPath Services. This view displays a list of created network services.
2. Expand a service, and click one of the associated probes to see the network path from that probe to the expanded service.
Path layoutThe source is on the left and the destination is on the right. The network path is everything in the middle.
ADMINISTRATOR GUIDE: NETWORK PERFORMANCE MONITOR
page 47
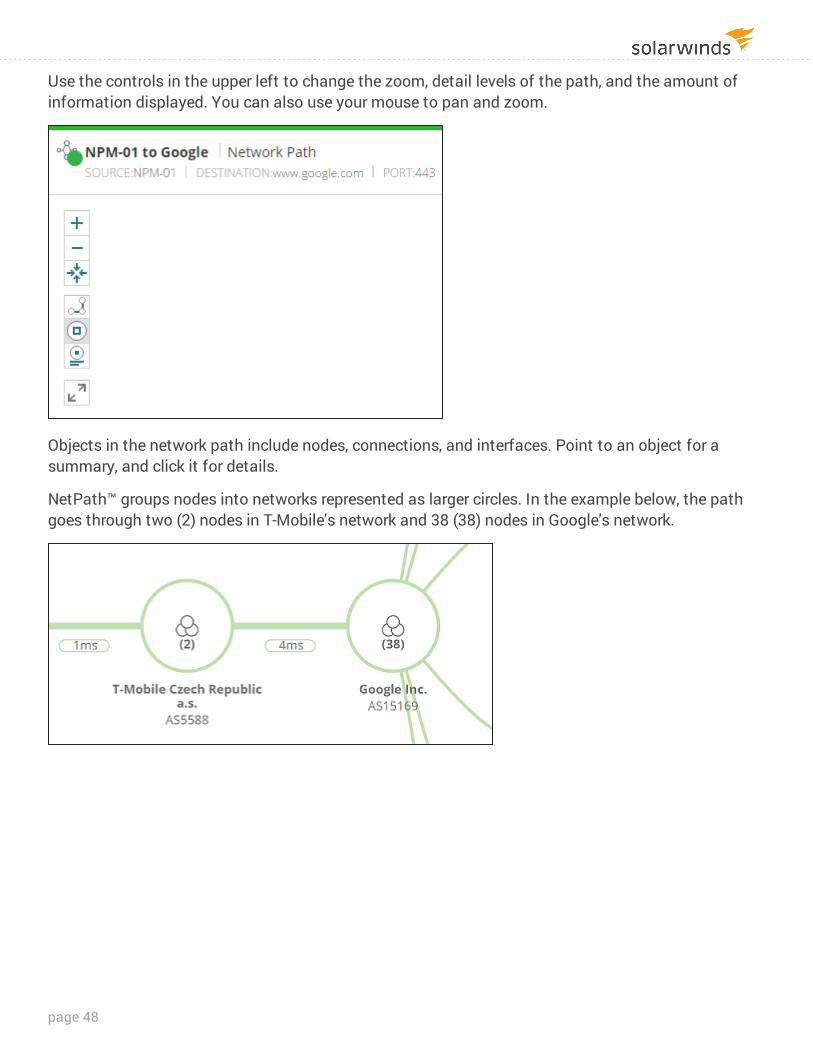
Use the controls in the upper left to change the zoom, detail levels of the path, and the amount of information displayed. You can also use your mouse to pan and zoom.
Objects in the network path include nodes, connections, and interfaces. Point to an object for a summary, and click it for details.
NetPath™ groups nodes into networks represented as larger circles. In the example below, the path goes through two (2) nodes in T-Mobile's network and 38 (38) nodes in Google’s network.
page 48
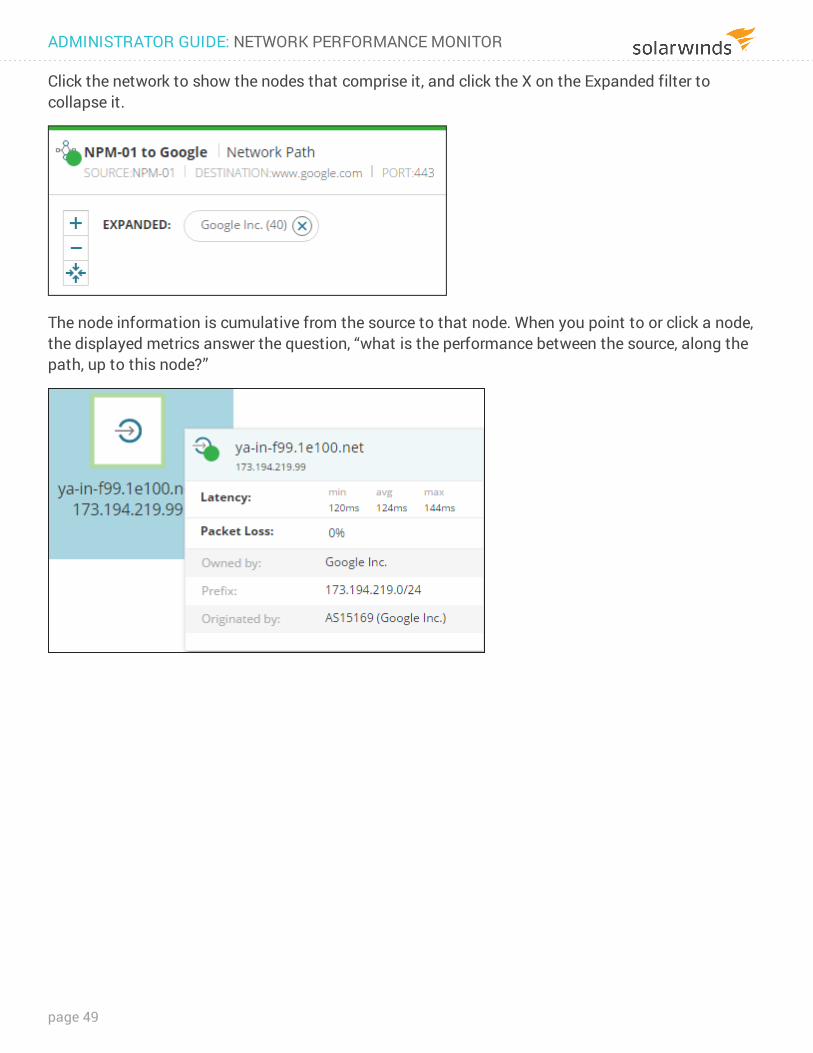
Click the network to show the nodes that comprise it, and click the X on the Expanded filter to collapse it.
The node information is cumulative from the source to that node. When you point to or click a node, the displayed metrics answer the question, “what is the performance between the source, along the path, up to this node?”
ADMINISTRATOR GUIDE: NETWORK PERFORMANCE MONITOR
page 49
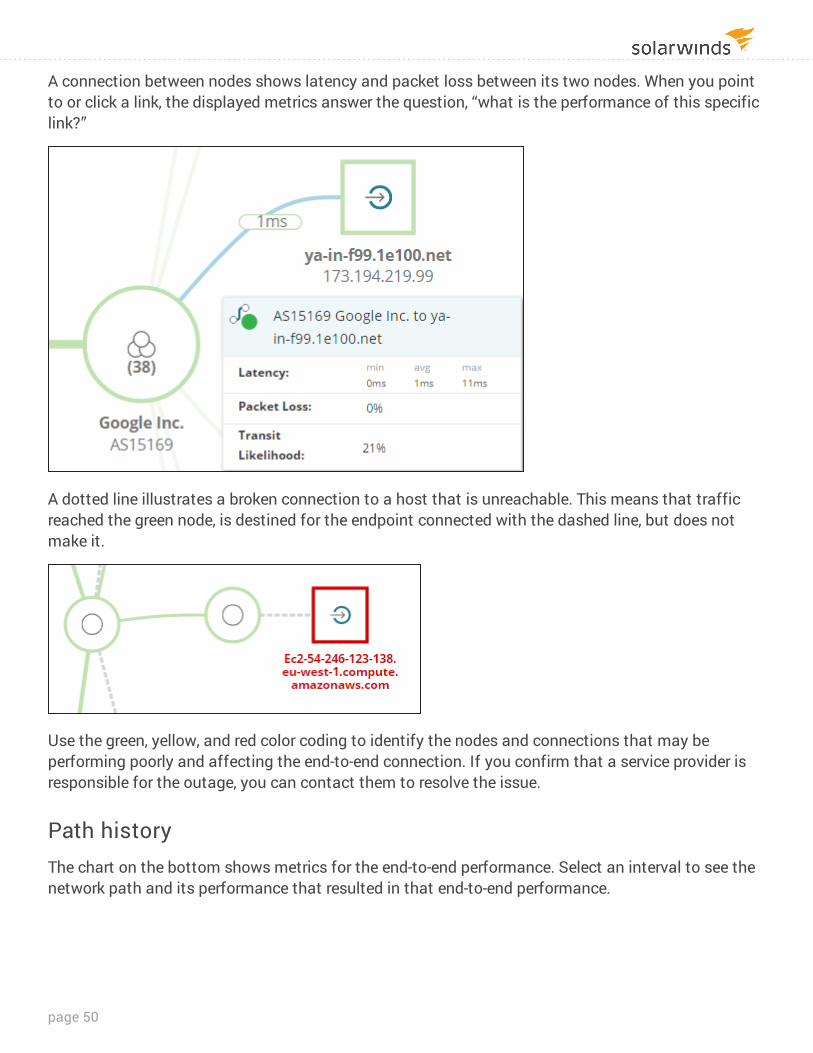
A connection between nodes shows latency and packet loss between its two nodes. When you point to or click a link, the displayed metrics answer the question, “what is the performance of this specific link?”
A dotted line illustrates a broken connection to a host that is unreachable. This means that traffic reached the green node, is destined for the endpoint connected with the dashed line, but does not make it.
Use the green, yellow, and red color coding to identify the nodes and connections that may be performing poorly and affecting the end-to-end connection. If you confirm that a service provider is responsible for the outage, you can contact them to resolve the issue.
Path historyThe chart on the bottom shows metrics for the end-to-end performance. Select an interval to see the network path and its performance that resulted in that end-to-end performance.
page 50
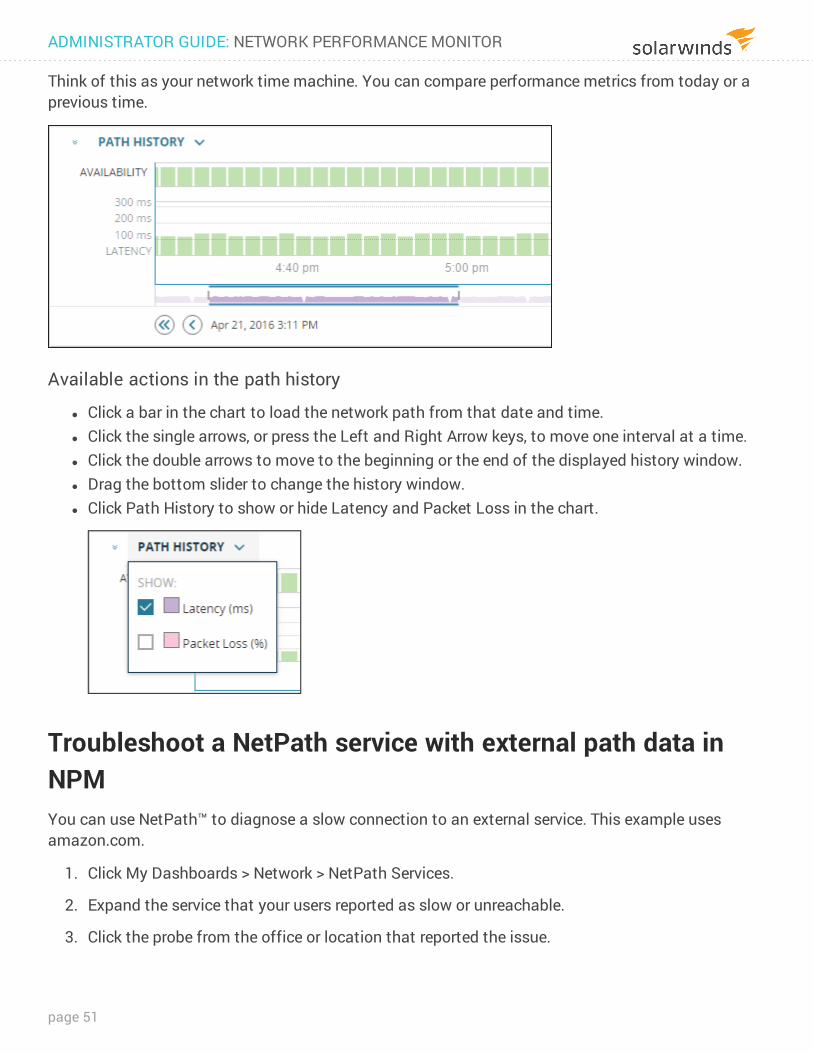
Think of this as your network time machine. You can compare performance metrics from today or a previous time.
Available actions in the path history
l Click a bar in the chart to load the network path from that date and time. l Click the single arrows, or press the Left and Right Arrow keys, to move one interval at a time. l Click the double arrows to move to the beginning or the end of the displayed history window. l Drag the bottom slider to change the history window. l Click Path History to show or hide Latency and Packet Loss in the chart.
Troubleshoot a NetPath service with external path data in NPMYou can use NetPath™ to diagnose a slow connection to an external service. This example uses amazon.com.
1. Click My Dashboards > Network > NetPath Services.
2. Expand the service that your users reported as slow or unreachable.
3. Click the probe from the office or location that reported the issue.
ADMINISTRATOR GUIDE: NETWORK PERFORMANCE MONITOR
page 51
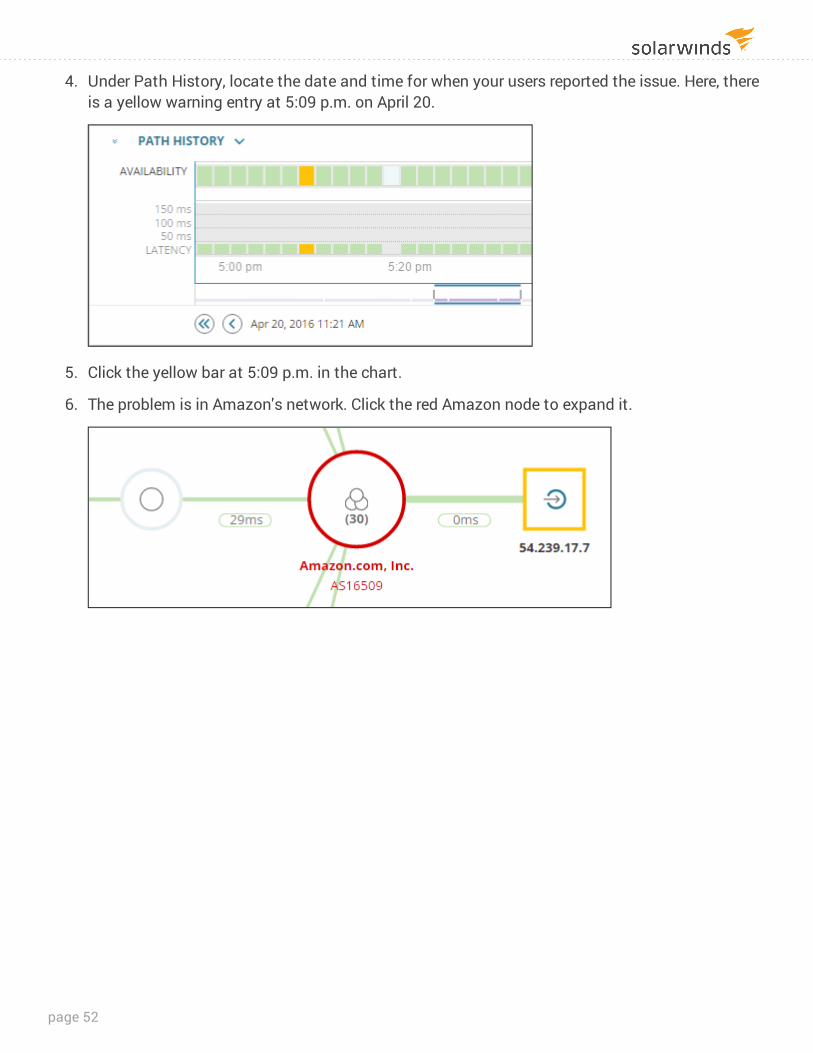
4. Under Path History, locate the date and time for when your users reported the issue. Here, there is a yellow warning entry at 5:09 p.m. on April 20.
5. Click the yellow bar at 5:09 p.m. in the chart.
6. The problem is in Amazon's network. Click the red Amazon node to expand it.
page 52
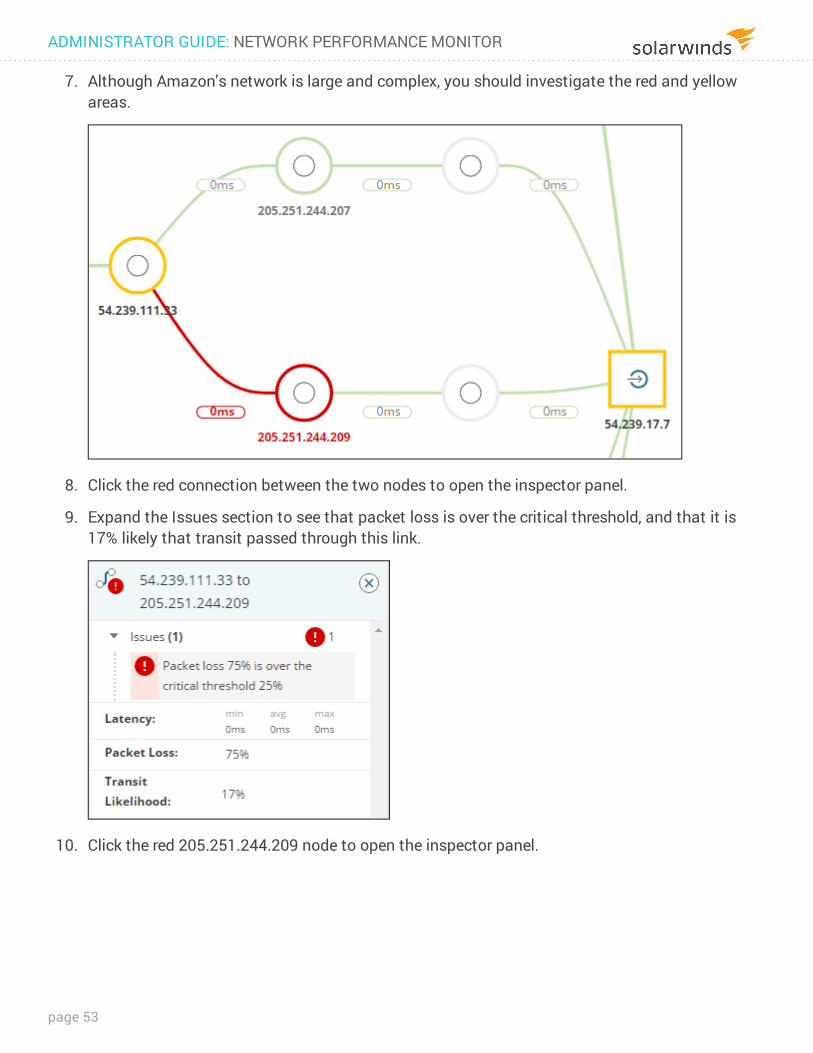
7. Although Amazon's network is large and complex, you should investigate the red and yellow areas.
8. Click the red connection between the two nodes to open the inspector panel.
9. Expand the Issues section to see that packet loss is over the critical threshold, and that it is 17% likely that transit passed through this link.
10. Click the red 205.251.244.209 node to open the inspector panel.
ADMINISTRATOR GUIDE: NETWORK PERFORMANCE MONITOR
page 53
11. Use the phone number or email address to contact the service provider and report the issue. Present the following information to resolve the issue:
l IP addresses of the nodes in question (54.239.111.33 and 205.251.244.209 in this case) l Date, time, and duration of the performance issue l Latency and packet loss information
Troubleshoot my network with NetPath data in NPMYou can use NetPath™ to diagnose a slow connection caused by your internal network. This example shows a node that stopped working properly after a change to its config file.
1. Click My Dashboards > Network > NetPath Services.
2. Expand the service that your users reported as slow or unreachable.
3. Click the probe from the office or location that reported the issue.
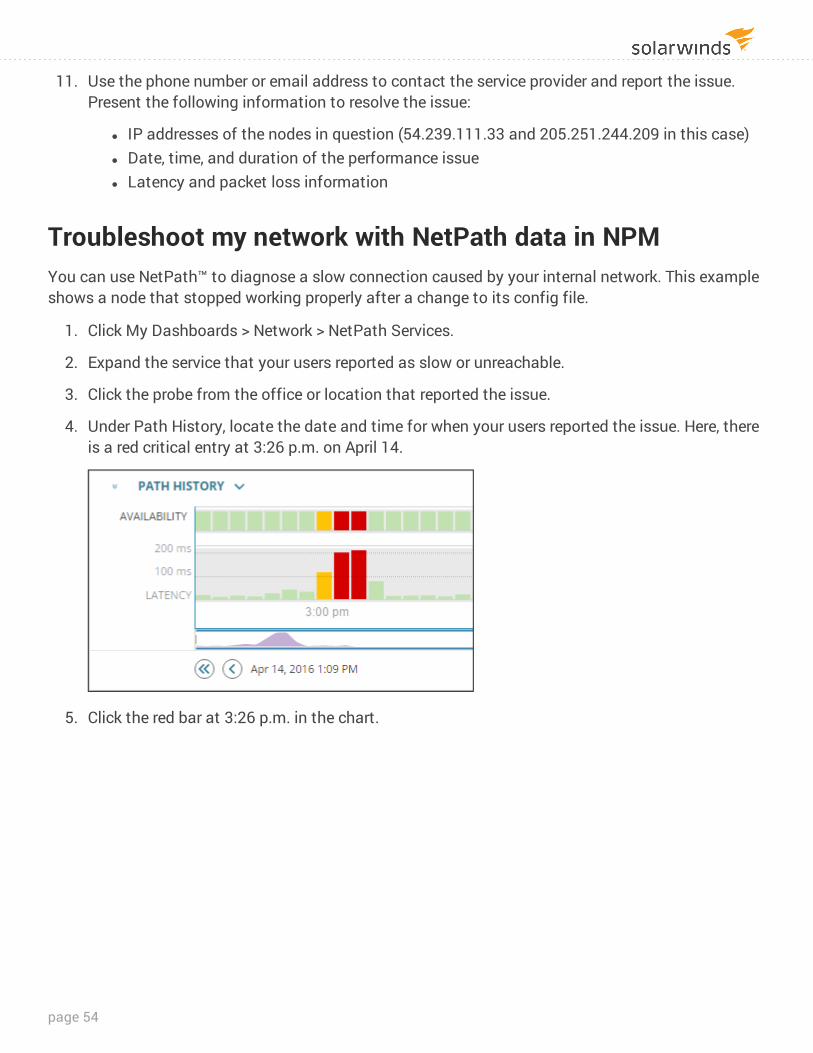
4. Under Path History, locate the date and time for when your users reported the issue. Here, there is a red critical entry at 3:26 p.m. on April 14.
5. Click the red bar at 3:26 p.m. in the chart.
page 54
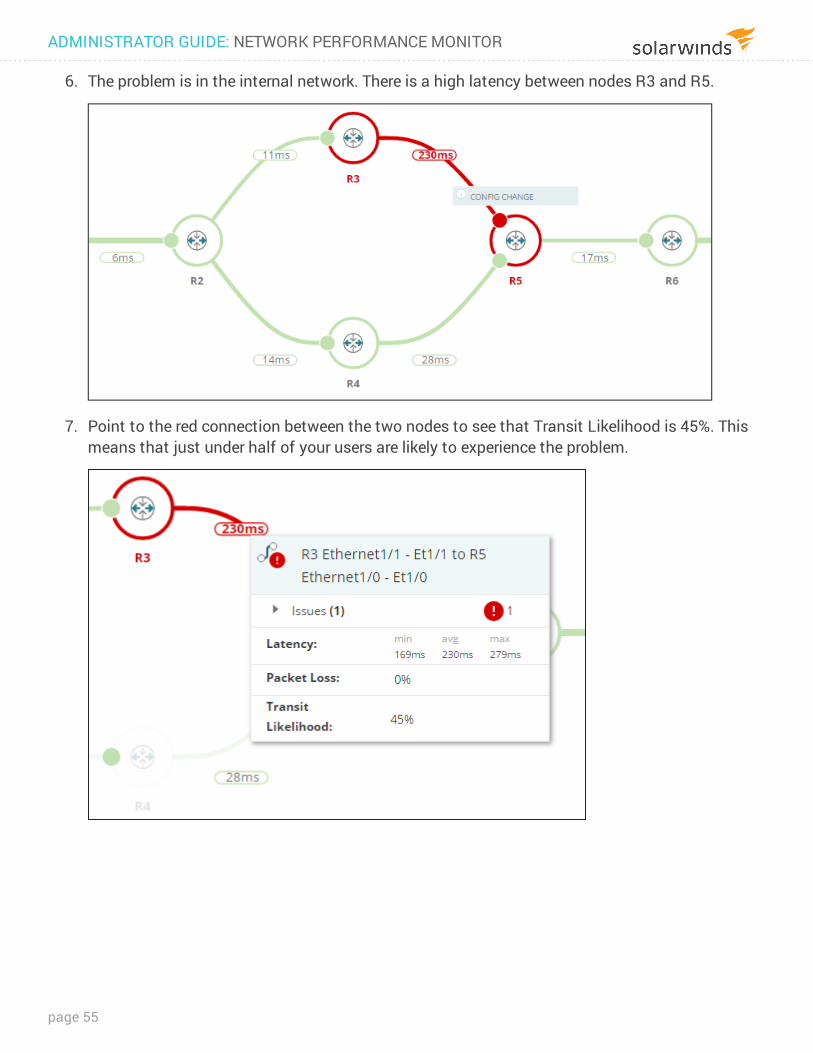
6. The problem is in the internal network. There is a high latency between nodes R3 and R5.
7. Point to the red connection between the two nodes to see that Transit Likelihood is 45%. This means that just under half of your users are likely to experience the problem.
ADMINISTRATOR GUIDE: NETWORK PERFORMANCE MONITOR
page 55
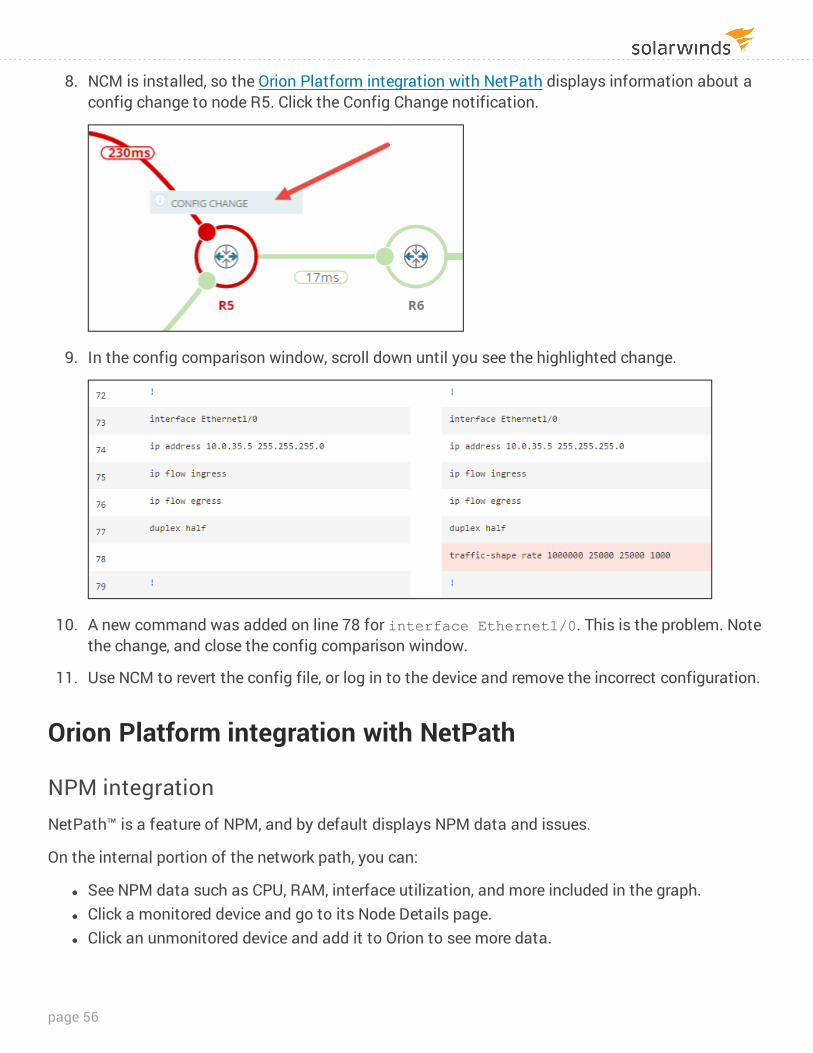
8. NCM is installed, so the Orion Platform integration with NetPath displays information about a config change to node R5. Click the Config Change notification.
9. In the config comparison window, scroll down until you see the highlighted change.
10. A new command was added on line 78 for interface Ethernet1/0. This is the problem. Note the change, and close the config comparison window.
11. Use NCM to revert the config file, or log in to the device and remove the incorrect configuration.
Orion Platform integration with NetPath
NPM integrationNetPath™ is a feature of NPM, and by default displays NPM data and issues.
On the internal portion of the network path, you can:
l See NPM data such as CPU, RAM, interface utilization, and more included in the graph. l Click a monitored device and go to its Node Details page. l Click an unmonitored device and add it to Orion to see more data.
page 56
NTA integrationNetPath™ uses data from NPM to display information about your internal nodes on the network path, such as bandwidth used for the interface. But what is using that bandwidth?
NetPath™ and NTA integration requires NTA 4.2 or later.
If you are exporting flow data from those nodes and monitoring it with NTA, NetPath™ displays additional information to identify what is using the most ingress and egress bandwidth.
Click the node or interface in the network path to open the inspector panel, where you can:
l View the top three conversations. l Select ingress or egress. l Click a conversation name to view details about that conversation.
NCM integrationNetPath™ displays additional information about NCM nodes with backed-up config files. If traffic through an NCM node was affected after a config change, NetPath™ notifies you that the two events may be correlated.
NetPath™ and NCM integration requires NCM 7.4.1 or later.
NetPath™ highlights config-related issues on the path, and provides quick access to the configuration data for nodes on the path.
Click the node in the network path to open the inspector panel, where you can:
l Click Commands > View Current to see the config for the device. l Click Commands > Compare to see two configs side by side for comparison.
ADMINISTRATOR GUIDE: NETWORK PERFORMANCE MONITOR
page 57
Monitor Cisco ACI devices in NPMThanks to the broad coverage of Cisco OIDs, you can poll many statistics for hardware components that make up ACI, such as Nexus leaf and spine switches, already with NPM 12.3.
Starting with NPM 12.4, you can enable API polling on ACI devices to monitor the following components of your SDN environment:
l Tenants l Application profiles l Endpoint groups l Spine and leaf switches
To get the best coverage of your ACI environment, enable the API polling on one of your APICs and add leaf and spine switches to NPM as SNMP nodes. To find out how to configure SNMP in APICs, see the Cisco document Configuring SNMP in APIC (© 2020 Cisco and/or its affiliates, obtained from https://www.cisco.com/c/en/us/td/docs/switches/datacenter/aci/apic/sw/all/mib/guide/b_Cisco_ACI_MIB_Quick_Reference/b_Cisco_ACI_MIB_Quick_Reference_chapter_01.html on February 26, 2020).
To monitor ACI-specific information, complete the following steps:
l Add an APIC node to NPM for monitoring, or enable ACI monitoring on an APIC node that is already monitored with NPM.
To add more ACI devices at the same time, see Discover your network with the Discovery Wizard, and then enable polling for Cisco ACI on one of the APICs.
l View members and their health scores on the device. l View health score history in PerfStack l View ACI environment on Orion Maps
RequirementsRequirement Details
NPM 12.4
ACI credentials Cisco API Rest credentials for collecting health scores on ACI entities. REST API must be accessible from the main or additional polling engine server (depending on the polling engine used to poll the node)
page 58
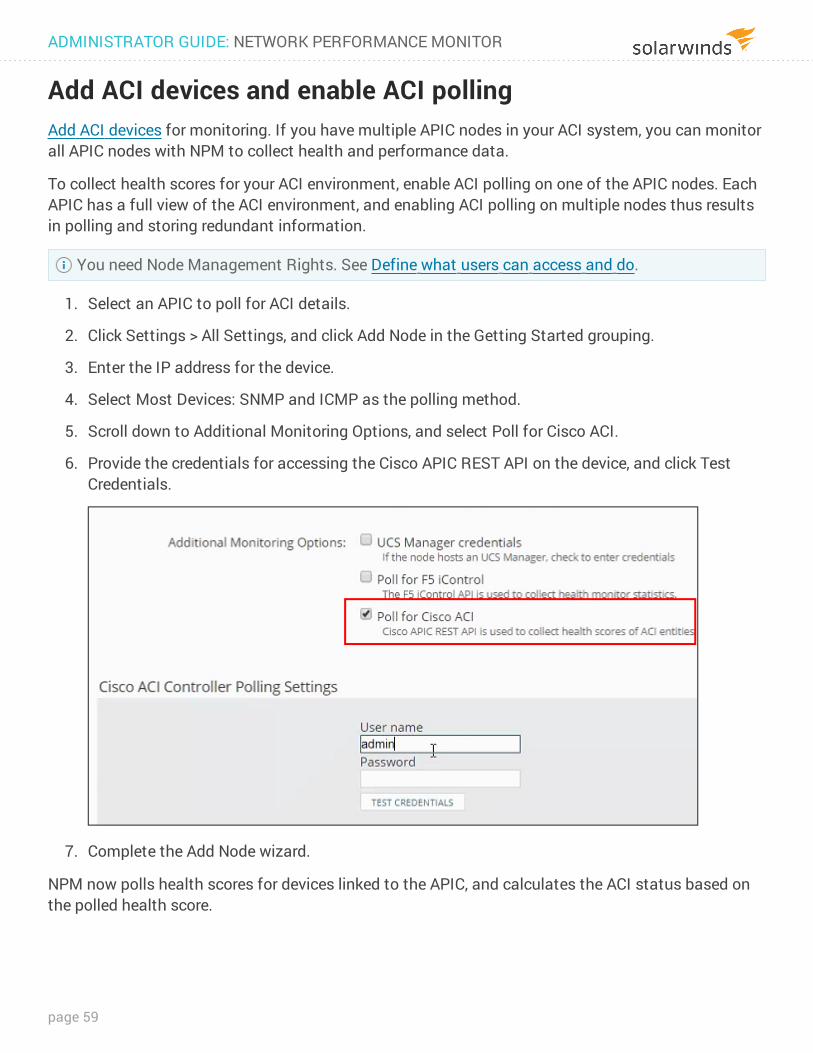
Add ACI devices and enable ACI pollingAdd ACI devices for monitoring. If you have multiple APIC nodes in your ACI system, you can monitor all APIC nodes with NPM to collect health and performance data.
To collect health scores for your ACI environment, enable ACI polling on one of the APIC nodes. Each APIC has a full view of the ACI environment, and enabling ACI polling on multiple nodes thus results in polling and storing redundant information.
You need Node Management Rights. See Define what users can access and do.
1. Select an APIC to poll for ACI details.
2. Click Settings > All Settings, and click Add Node in the Getting Started grouping.
3. Enter the IP address for the device.
4. Select Most Devices: SNMP and ICMP as the polling method.
5. Scroll down to Additional Monitoring Options, and select Poll for Cisco ACI.
6. Provide the credentials for accessing the Cisco APIC REST API on the device, and click Test Credentials.
7. Complete the Add Node wizard.
NPM now polls health scores for devices linked to the APIC, and calculates the ACI status based on the polled health score.
ADMINISTRATOR GUIDE: NETWORK PERFORMANCE MONITOR
page 59
Enable polling for Cisco ACI on a monitored node When the Cisco ACI devices are already monitored in SolarWinds NPM, make sure polling for ACI is enabled only on one of the APICs. Consider enabling ACI polling on the node with the least load or with the shortest response time.
Polling for Cisco ACI is used to collect health scores for ACI entities.
1. Click Settings > Manage Nodes.
2. Select the node, and click Edit Properties.
3. Enable Cisco ACI polling.
4. Click Submit.
Now you can see the Members subview with health score information for tenants and blades on the monitored device.
View health scores for ACI members 1. In the Orion Web Console, go to the ACI node details view.
2. Click the Members subview.
The Members subview displays the following items:
l Name l Distinguished name l Member type together with the type-specific icon l Health score
ACI status uses thresholds defined on the APIC. The following table lists the default thresholds.
0-50 critical status
51-90 warning status
91-100 up
You can automatically display APIC members on the node on Orion Maps. Click the Map icon below in the navigation bar below the Members subview.
page 60
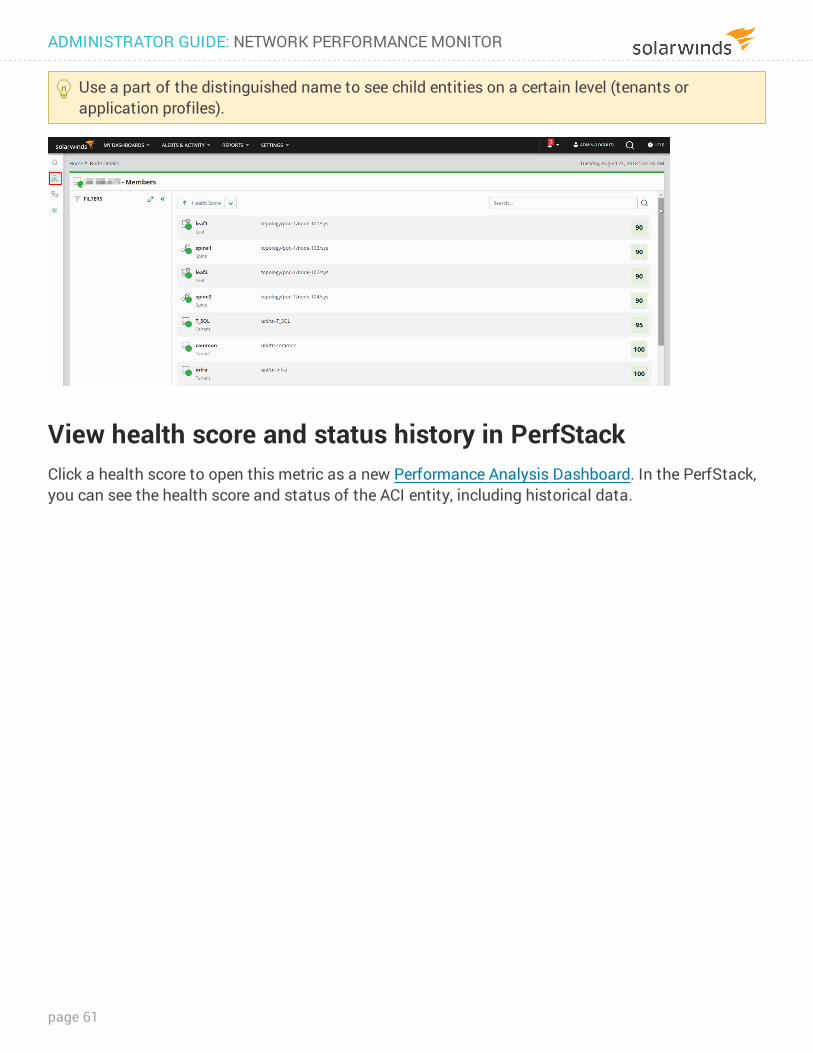
Use a part of the distinguished name to see child entities on a certain level (tenants or application profiles).
View health score and status history in PerfStackClick a health score to open this metric as a new Performance Analysis Dashboard. In the PerfStack, you can see the health score and status of the ACI entity, including historical data.
ADMINISTRATOR GUIDE: NETWORK PERFORMANCE MONITOR
page 61
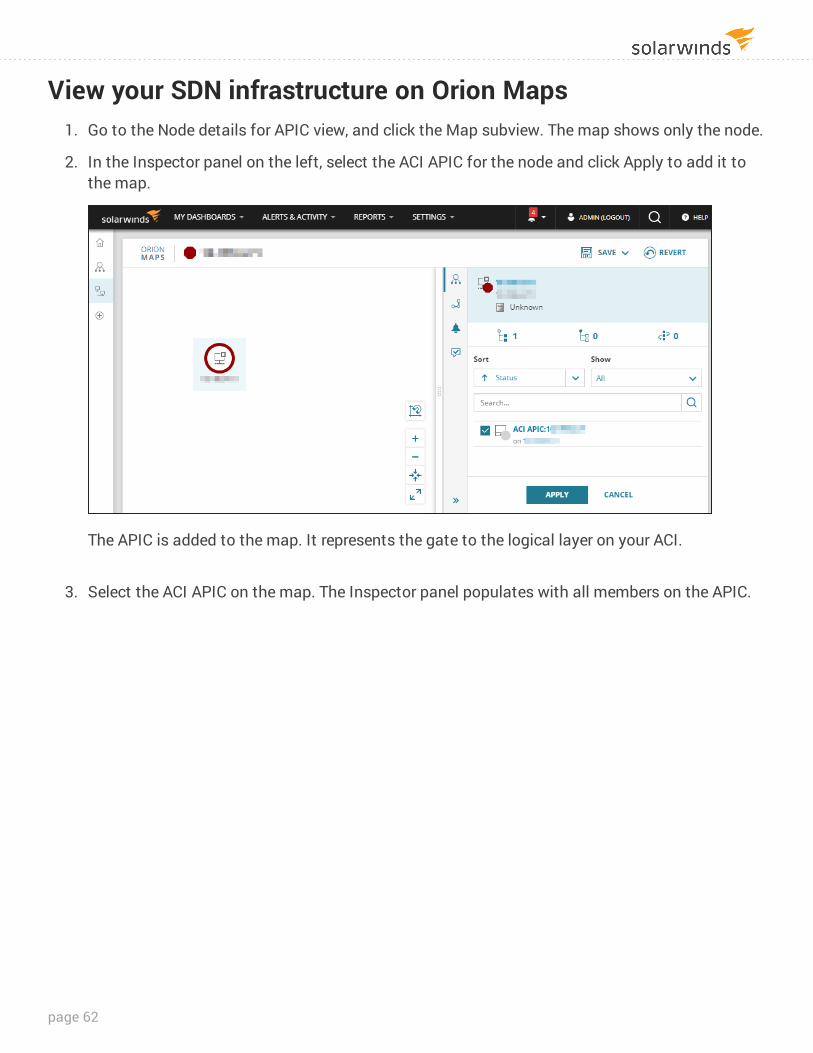
View your SDN infrastructure on Orion Maps 1. Go to the Node details for APIC view, and click the Map subview. The map shows only the node.
2. In the Inspector panel on the left, select the ACI APIC for the node and click Apply to add it to the map.
The APIC is added to the map. It represents the gate to the logical layer on your ACI.
3. Select the ACI APIC on the map. The Inspector panel populates with all members on the APIC.
page 62
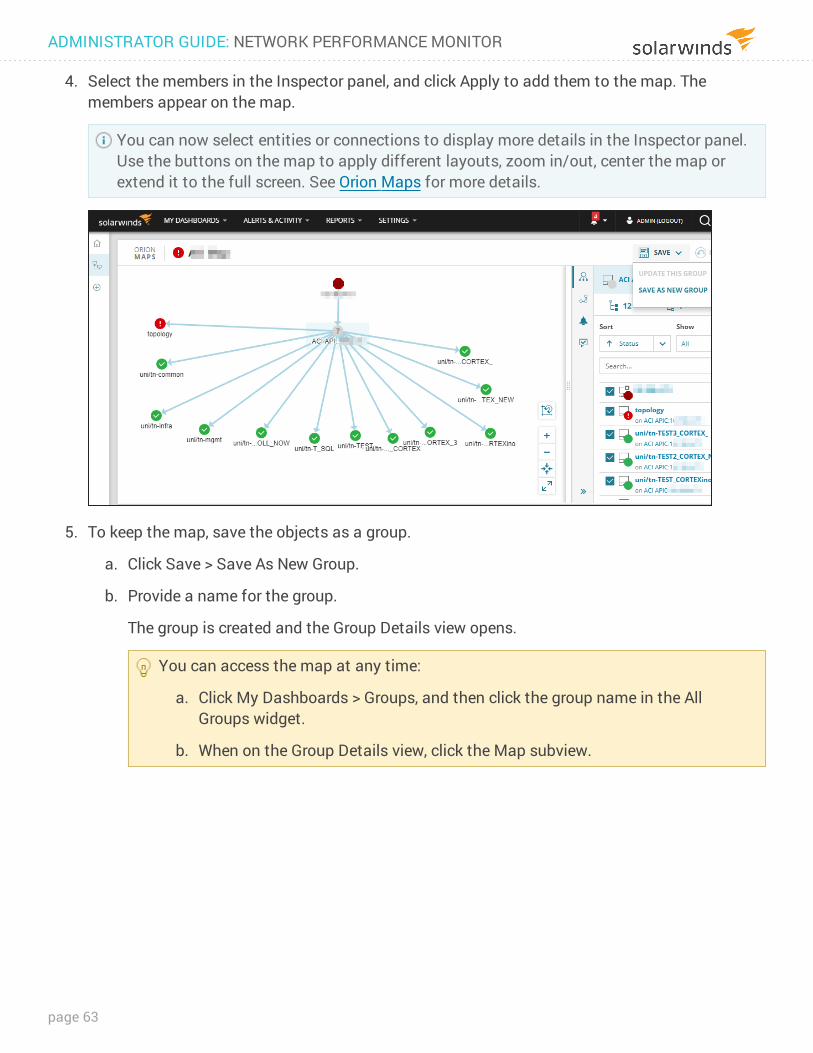
4. Select the members in the Inspector panel, and click Apply to add them to the map. The members appear on the map.
You can now select entities or connections to display more details in the Inspector panel. Use the buttons on the map to apply different layouts, zoom in/out, center the map or extend it to the full screen. See Orion Maps for more details.
5. To keep the map, save the objects as a group.
a. Click Save > Save As New Group.
b. Provide a name for the group.
The group is created and the Group Details view opens.
You can access the map at any time:
a. Click My Dashboards > Groups, and then click the group name in the All Groups widget.
b. When on the Group Details view, click the Map subview.
ADMINISTRATOR GUIDE: NETWORK PERFORMANCE MONITOR
page 63
Create ACI-specific alerts and reportsThere are no out-of-the-box alerts and reports specific for ACI. You can configure custom notifications based on ACI events and custom reports showing ACI-relevant statistics.
Review the following customization examples:
l Create an alert to be notified when the health score on an ACI tenant is less than 90% l Copy and adjust an alert to be notified when there are polling issues on an APIC l Create a report listing ACI tenants with health scores less than or equal to 90%
Alert on health score values lower than 90% on an ACI tenantCreate a new alert to notify you when the health score on an ACI tenant drops below 90%.
1. Select Alerts & Activity > Alerts, and click Manage Alerts.
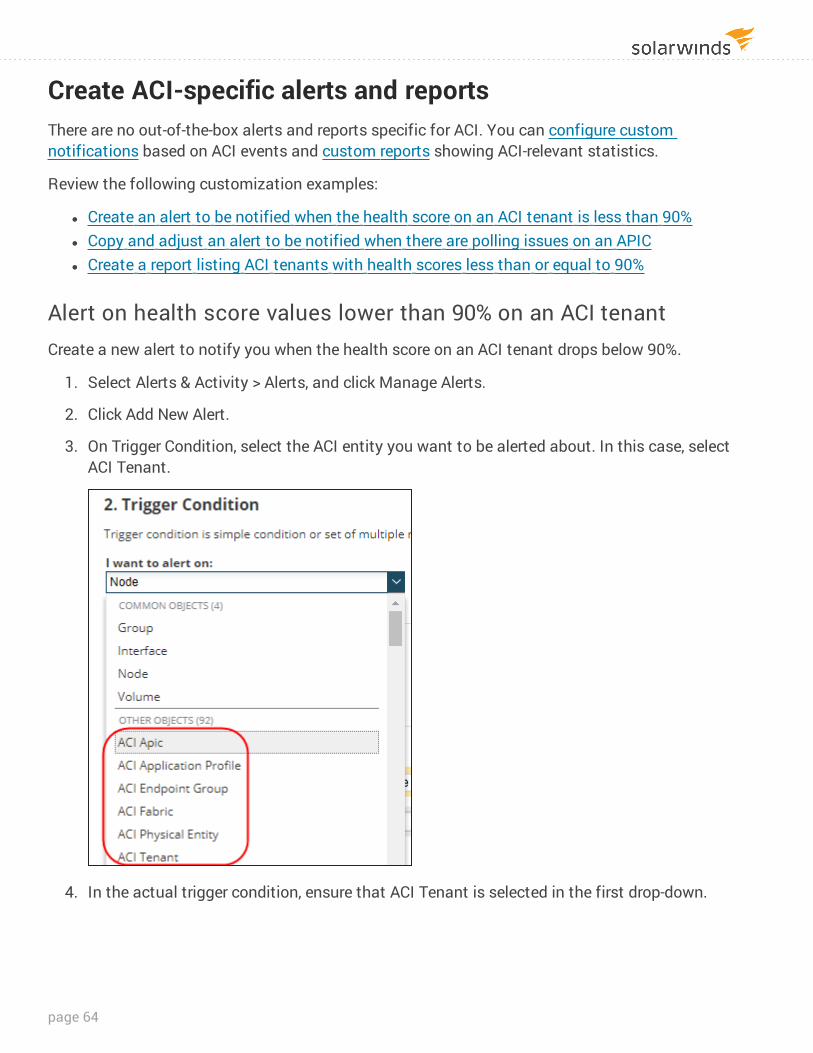
2. Click Add New Alert.
3. On Trigger Condition, select the ACI entity you want to be alerted about. In this case, select ACI Tenant.
4. In the actual trigger condition, ensure that ACI Tenant is selected in the first drop-down.
page 64
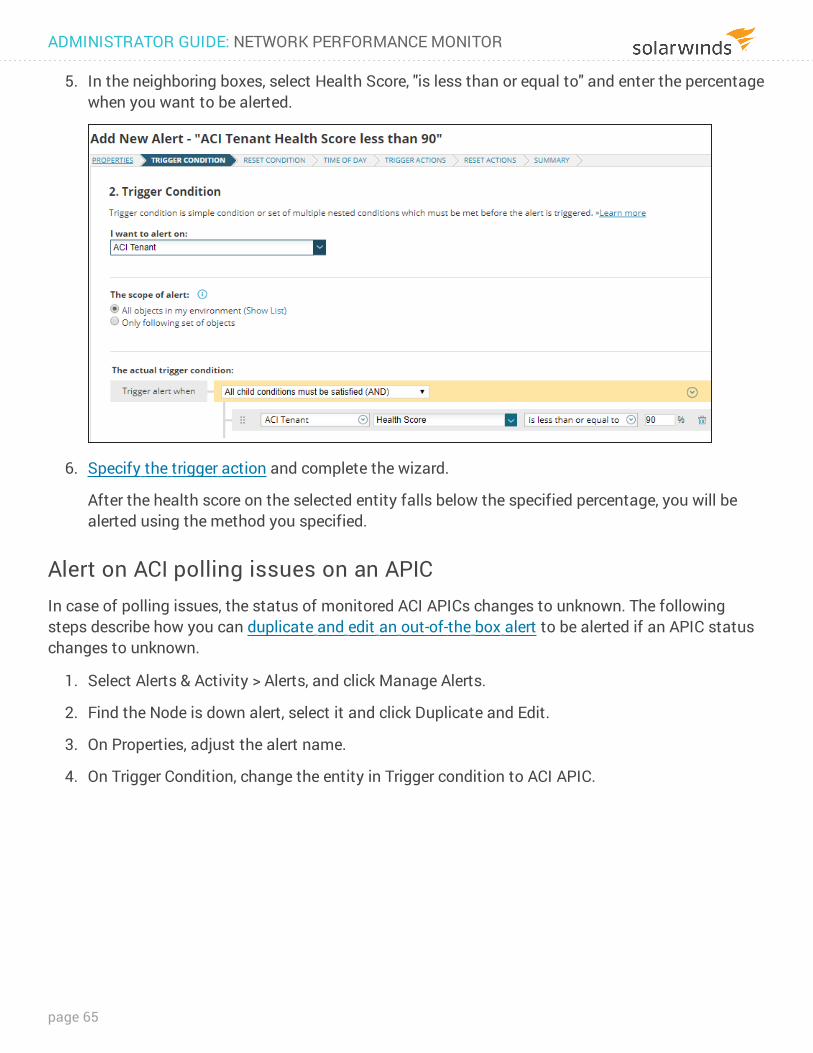
5. In the neighboring boxes, select Health Score, "is less than or equal to" and enter the percentage when you want to be alerted.
6. Specify the trigger action and complete the wizard.
After the health score on the selected entity falls below the specified percentage, you will be alerted using the method you specified.
Alert on ACI polling issues on an APICIn case of polling issues, the status of monitored ACI APICs changes to unknown. The following steps describe how you can duplicate and edit an out-of-the box alert to be alerted if an APIC status changes to unknown.
1. Select Alerts & Activity > Alerts, and click Manage Alerts.
2. Find the Node is down alert, select it and click Duplicate and Edit.
3. On Properties, adjust the alert name.
4. On Trigger Condition, change the entity in Trigger condition to ACI APIC.
ADMINISTRATOR GUIDE: NETWORK PERFORMANCE MONITOR
page 65
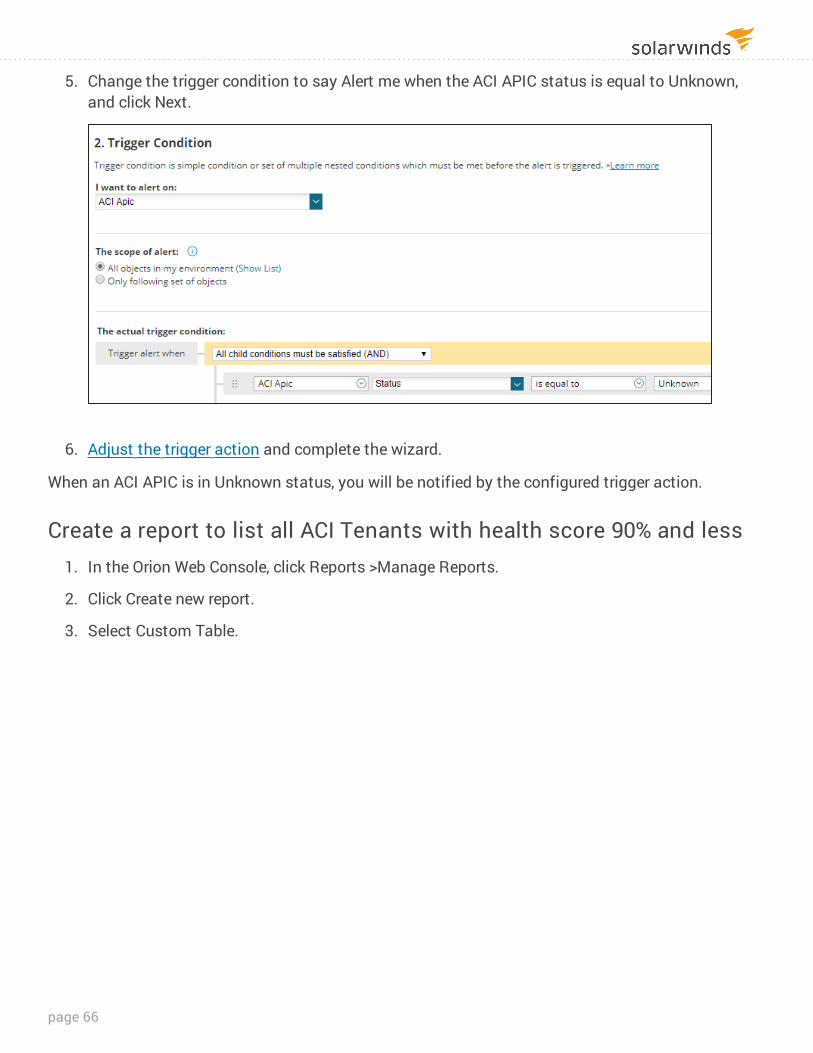
5. Change the trigger condition to say Alert me when the ACI APIC status is equal to Unknown, and click Next.
6. Adjust the trigger action and complete the wizard.
When an ACI APIC is in Unknown status, you will be notified by the configured trigger action.
Create a report to list all ACI Tenants with health score 90% and less 1. In the Orion Web Console, click Reports >Manage Reports.
2. Click Create new report.
3. Select Custom Table.
page 66
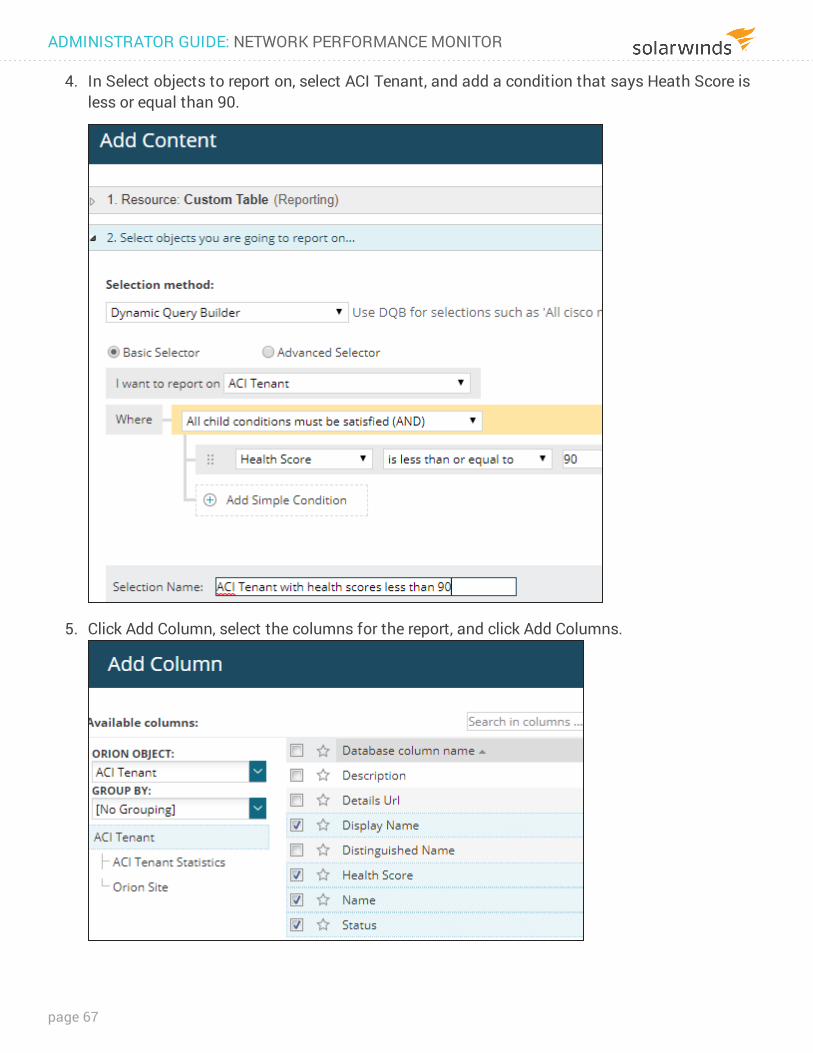
4. In Select objects to report on, select ACI Tenant, and add a condition that says Heath Score is less or equal than 90.
5. Click Add Column, select the columns for the report, and click Add Columns.
ADMINISTRATOR GUIDE: NETWORK PERFORMANCE MONITOR
page 67
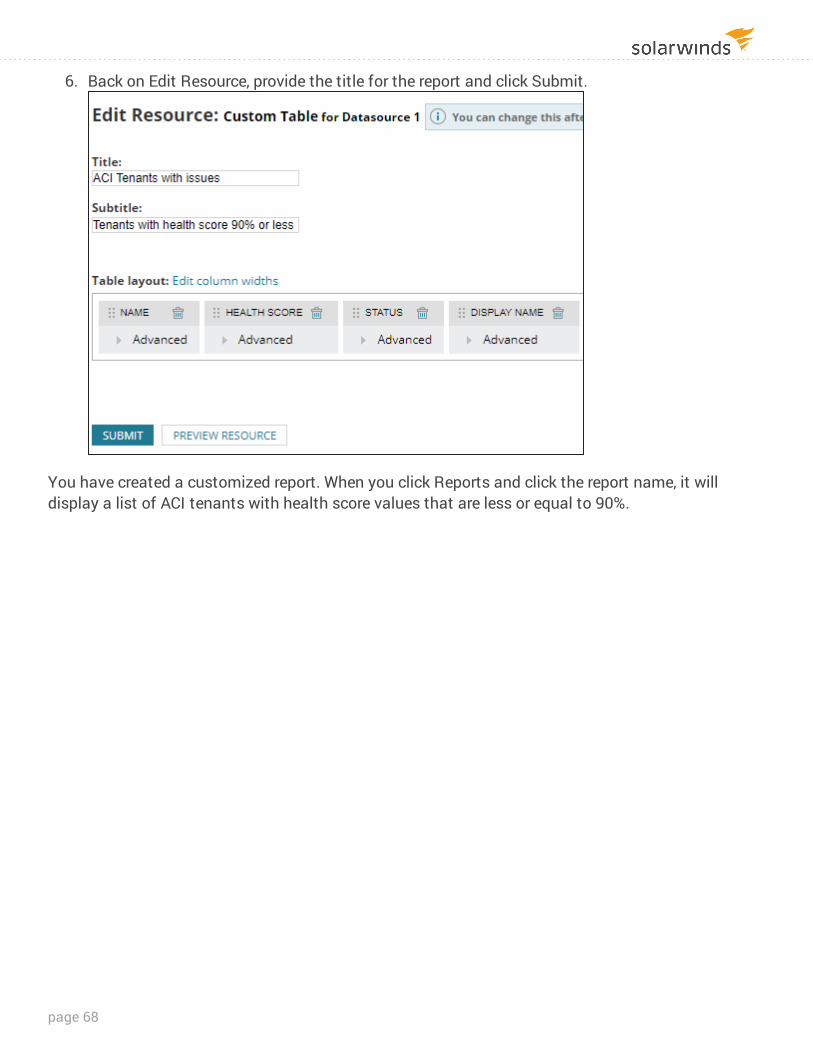
6. Back on Edit Resource, provide the title for the report and click Submit.
You have created a customized report. When you click Reports and click the report name, it will display a list of ACI tenants with health score values that are less or equal to 90%.
page 68
Monitor ASA firewalls with NPMNetwork Insight for Cisco® ASA automates the monitoring and management of your Cisco ASA infrastructure to provide visibility and help ensure service availability.
Ensure that services dependent on your firewall are available:
l Monitor VPN tunnels: to guarantee the connectivity between sites. Monitor the tunnel status, bandwidth usage, and information about completed phases. View user sessions on remote access tunnels.
l Monitor firewall high availability health and readiness: detect failovers, and keep track of ASA high availability status.
To have the complete visibility into the health and performance of your firewall infrastructure, and to automate operational activities, such as optimizing your Access lists (ACL), install Network Configuration Manager version 7.7.
Out-of-the-box alerts
l Failover on ASA node l High Availability on ASA Node is not up l VPN Site-to-Site tunnel down l Connections in use exceeding threshold on ASA node
Out-of-the-box reports
l VPN Site-to-Site Tunnel History - Last 30 Days l VPN Remote Access Tunnel History - Last 30 Days
Next steps
l Set up monitoring Cisco ASA firewalls in NPM
Set up monitoring Cisco ASA firewalls in NPMData for monitoring Cisco® ASA firewalls is polled by a combination of SNMP and CLI polling. To get accurate ASA-specific information, add the firewall device to NPM as a node, and provide CLI credentials.
ADMINISTRATOR GUIDE: NETWORK PERFORMANCE MONITOR
page 69
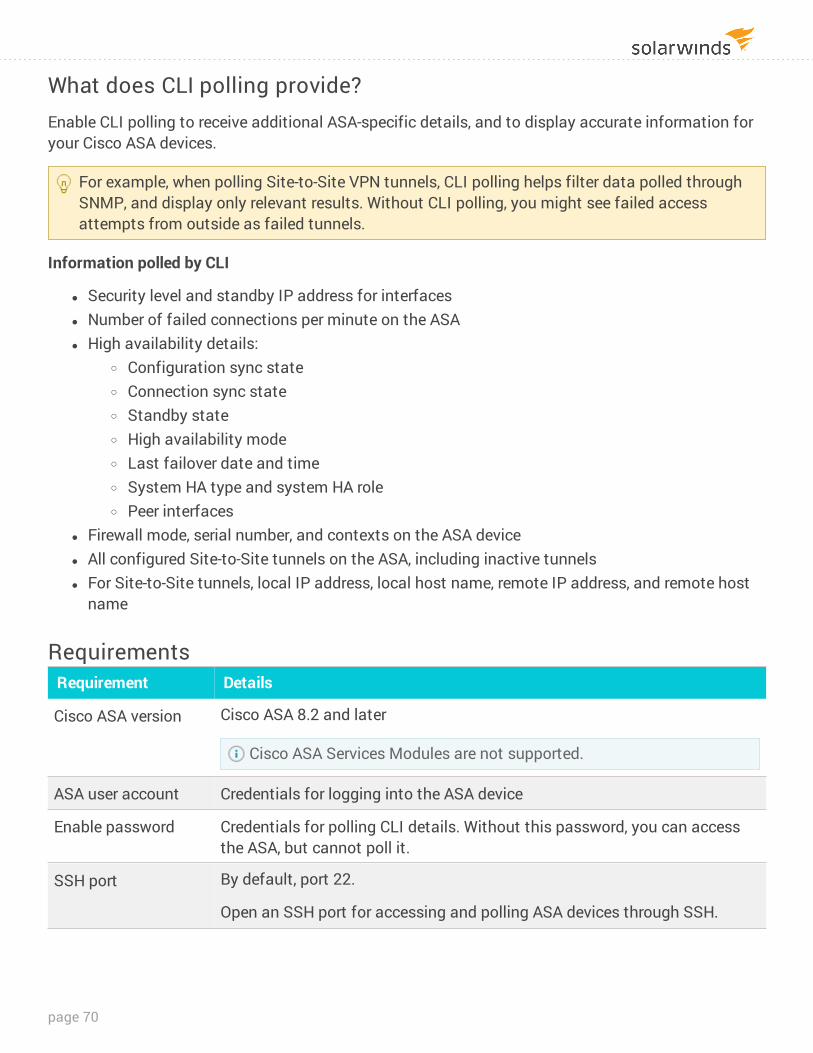
What does CLI polling provide?Enable CLI polling to receive additional ASA-specific details, and to display accurate information for your Cisco ASA devices.
For example, when polling Site-to-Site VPN tunnels, CLI polling helps filter data polled through SNMP, and display only relevant results. Without CLI polling, you might see failed access attempts from outside as failed tunnels.
Information polled by CLI
l Security level and standby IP address for interfaces l Number of failed connections per minute on the ASA l High availability details:
o Configuration sync state o Connection sync state o Standby state o High availability mode o Last failover date and time o System HA type and system HA role o Peer interfaces
l Firewall mode, serial number, and contexts on the ASA device l All configured Site-to-Site tunnels on the ASA, including inactive tunnels l For Site-to-Site tunnels, local IP address, local host name, remote IP address, and remote host
name
RequirementsRequirement Details
Cisco ASA version Cisco ASA 8.2 and later
Cisco ASA Services Modules are not supported.
ASA user account Credentials for logging into the ASA device
Enable password Credentials for polling CLI details. Without this password, you can access the ASA, but cannot poll it.
SSH port By default, port 22.
Open an SSH port for accessing and polling ASA devices through SSH.
page 70
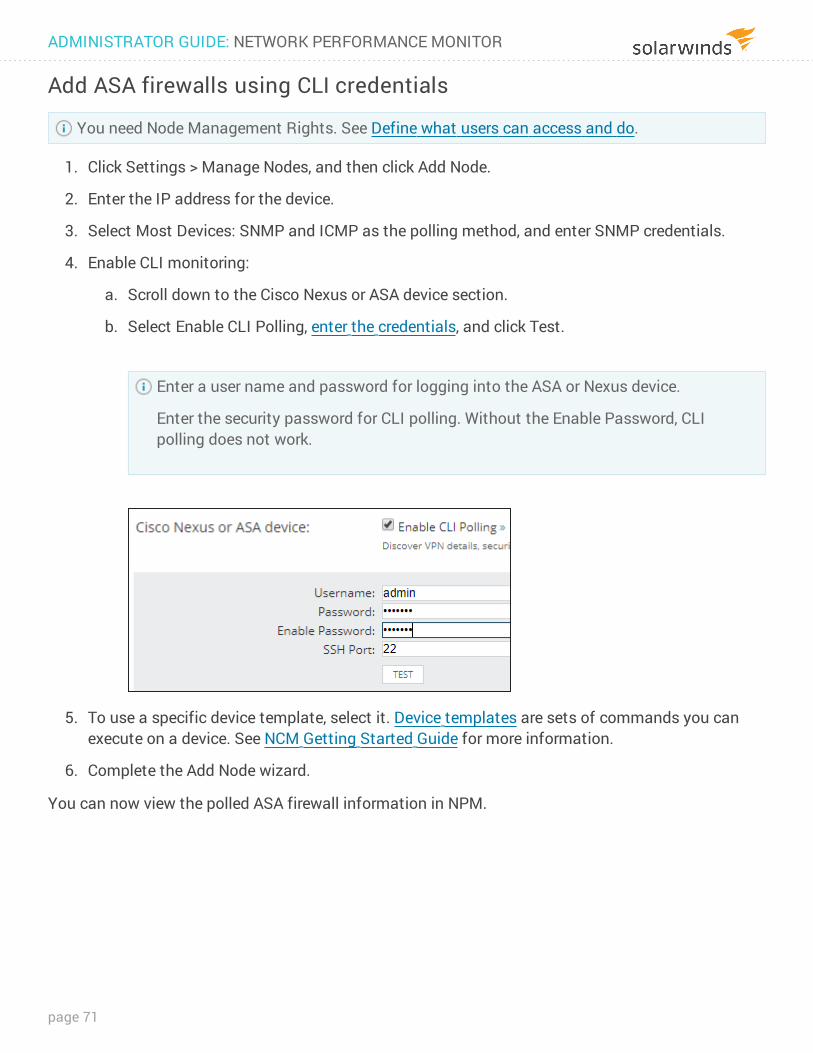
Add ASA firewalls using CLI credentials
You need Node Management Rights. See Define what users can access and do.
1. Click Settings > Manage Nodes, and then click Add Node.
2. Enter the IP address for the device.
3. Select Most Devices: SNMP and ICMP as the polling method, and enter SNMP credentials.
4. Enable CLI monitoring:
a. Scroll down to the Cisco Nexus or ASA device section.
b. Select Enable CLI Polling, enter the credentials, and click Test.
Enter a user name and password for logging into the ASA or Nexus device.
Enter the security password for CLI polling. Without the Enable Password, CLI polling does not work.
5. To use a specific device template, select it. Device templates are sets of commands you can execute on a device. See NCM Getting Started Guide for more information.
6. Complete the Add Node wizard.
You can now view the polled ASA firewall information in NPM.
ADMINISTRATOR GUIDE: NETWORK PERFORMANCE MONITOR
page 71
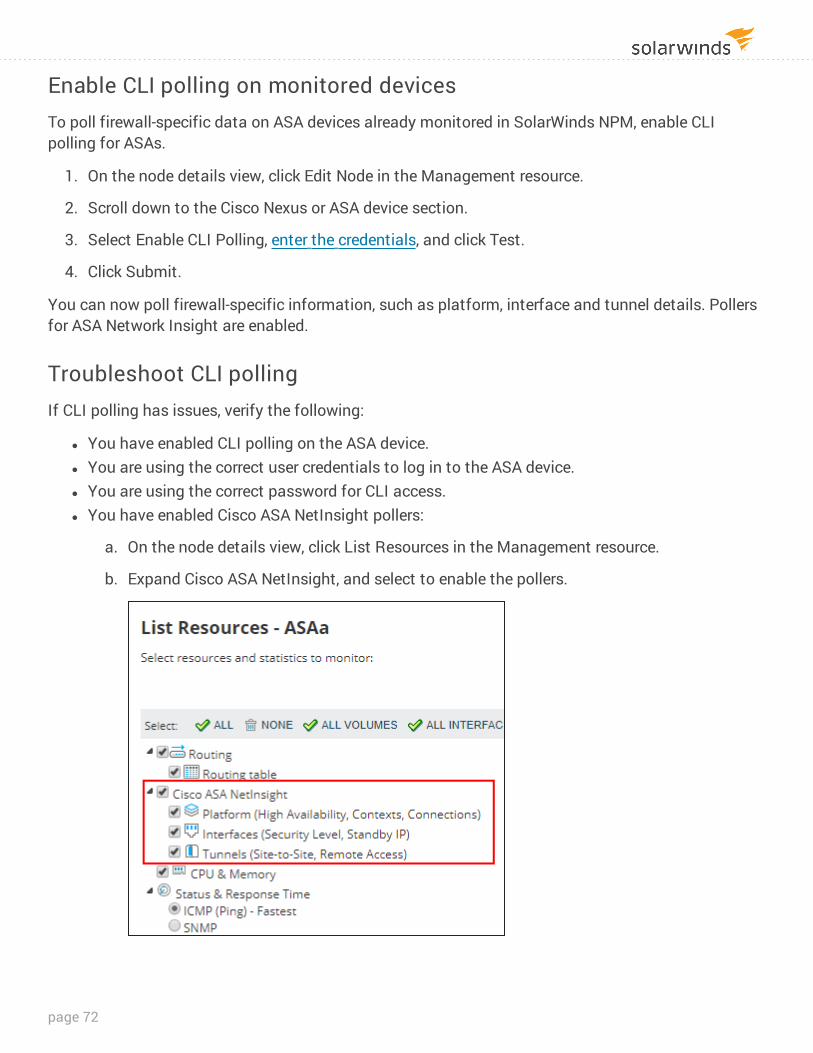
Enable CLI polling on monitored devicesTo poll firewall-specific data on ASA devices already monitored in SolarWinds NPM, enable CLI polling for ASAs.
1. On the node details view, click Edit Node in the Management resource.
2. Scroll down to the Cisco Nexus or ASA device section.
3. Select Enable CLI Polling, enter the credentials, and click Test.
4. Click Submit.
You can now poll firewall-specific information, such as platform, interface and tunnel details. Pollers for ASA Network Insight are enabled.
Troubleshoot CLI pollingIf CLI polling has issues, verify the following:
l You have enabled CLI polling on the ASA device. l You are using the correct user credentials to log in to the ASA device. l You are using the correct password for CLI access. l You have enabled Cisco ASA NetInsight pollers:
a. On the node details view, click List Resources in the Management resource.
b. Expand Cisco ASA NetInsight, and select to enable the pollers.
page 72
l Enable the CLI session trace to extend logging:
a. Click Settings > All Settings > CLI Settings in the Product Specific grouping.
b. Click Enable Session Tracing, and click Submit.
Review the session trace files located at:
%ALLUSERSPROFILE%\Application Data\SolarWinds\Logs\Orion\CLI\Session-Trace
Understand ASA platform health in NPMUnderstand the health of the Cisco® ASA platform, for example power supplies, ASA high availability status, and other platform-wide health attributes.
1. Log in to the Orion Web Console.
2. On the Summary view, locate your ASA firewall node, and click it to go to the Node Details view.
3. Review the Node Details for ASA - Summary subview.
ADMINISTRATOR GUIDE: NETWORK PERFORMANCE MONITOR
page 73
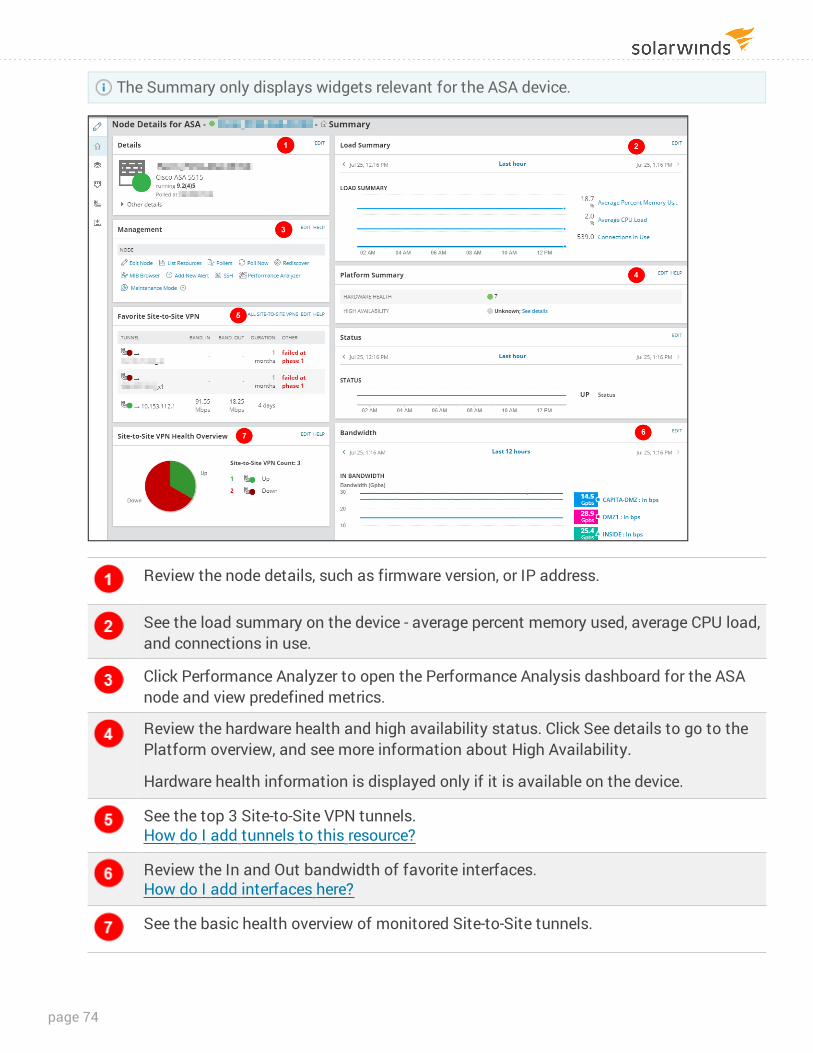
The Summary only displays widgets relevant for the ASA device.
Review the node details, such as firmware version, or IP address.
See the load summary on the device - average percent memory used, average CPU load, and connections in use.
Click Performance Analyzer to open the Performance Analysis dashboard for the ASA node and view predefined metrics.
Review the hardware health and high availability status. Click See details to go to the Platform overview, and see more information about High Availability.
Hardware health information is displayed only if it is available on the device.
See the top 3 Site-to-Site VPN tunnels. How do I add tunnels to this resource?
Review the In and Out bandwidth of favorite interfaces. How do I add interfaces here?
See the basic health overview of monitored Site-to-Site tunnels.
page 74
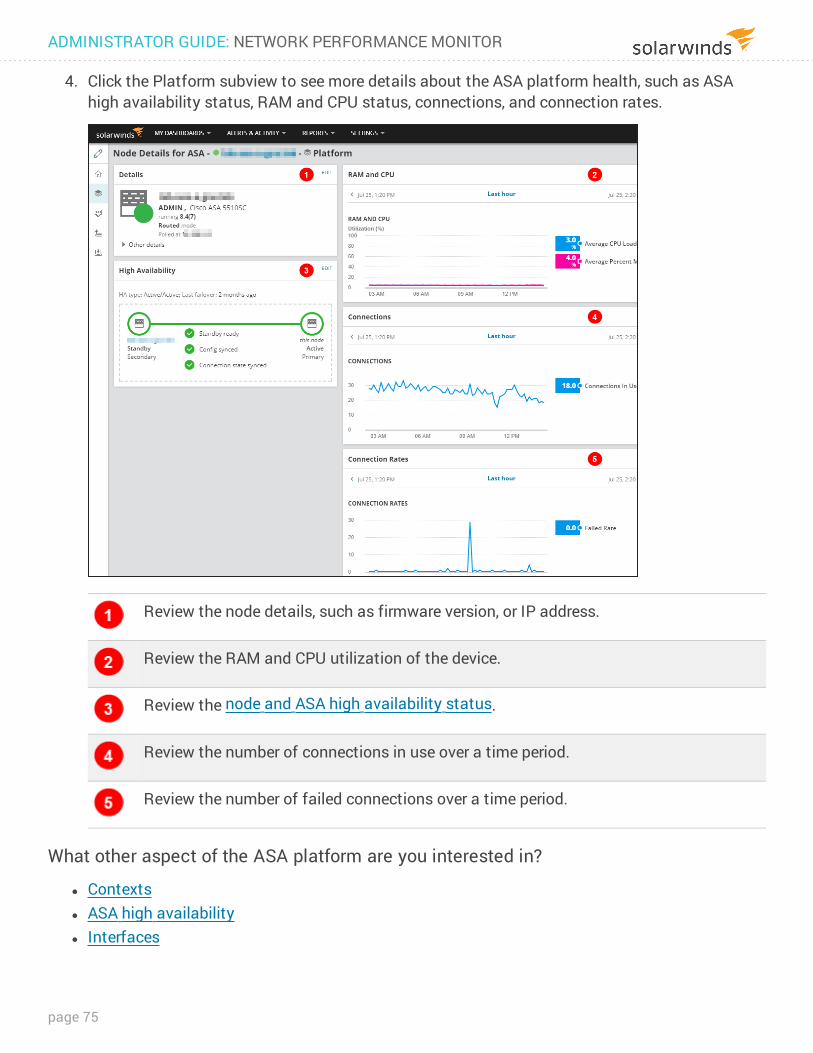
4. Click the Platform subview to see more details about the ASA platform health, such as ASA high availability status, RAM and CPU status, connections, and connection rates.
Review the node details, such as firmware version, or IP address.
Review the RAM and CPU utilization of the device.
Review the node and ASA high availability status.
Review the number of connections in use over a time period.
Review the number of failed connections over a time period.
What other aspect of the ASA platform are you interested in?
l Contexts l ASA high availability l Interfaces
ADMINISTRATOR GUIDE: NETWORK PERFORMANCE MONITOR
page 75
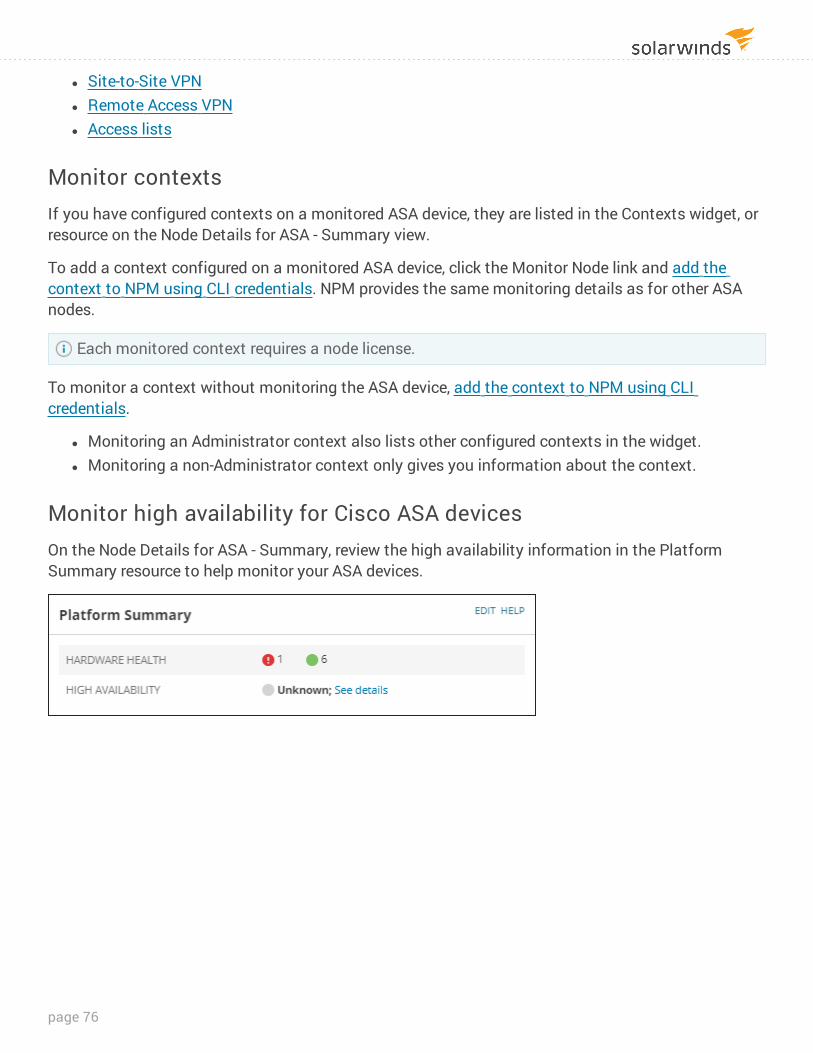
l Site-to-Site VPN l Remote Access VPN l Access lists
Monitor contextsIf you have configured contexts on a monitored ASA device, they are listed in the Contexts widget, or resource on the Node Details for ASA - Summary view.
To add a context configured on a monitored ASA device, click the Monitor Node link and add the context to NPM using CLI credentials. NPM provides the same monitoring details as for other ASA nodes.
Each monitored context requires a node license.
To monitor a context without monitoring the ASA device, add the context to NPM using CLI credentials.
l Monitoring an Administrator context also lists other configured contexts in the widget. l Monitoring a non-Administrator context only gives you information about the context.
Monitor high availability for Cisco ASA devicesOn the Node Details for ASA - Summary, review the high availability information in the Platform Summary resource to help monitor your ASA devices.
page 76
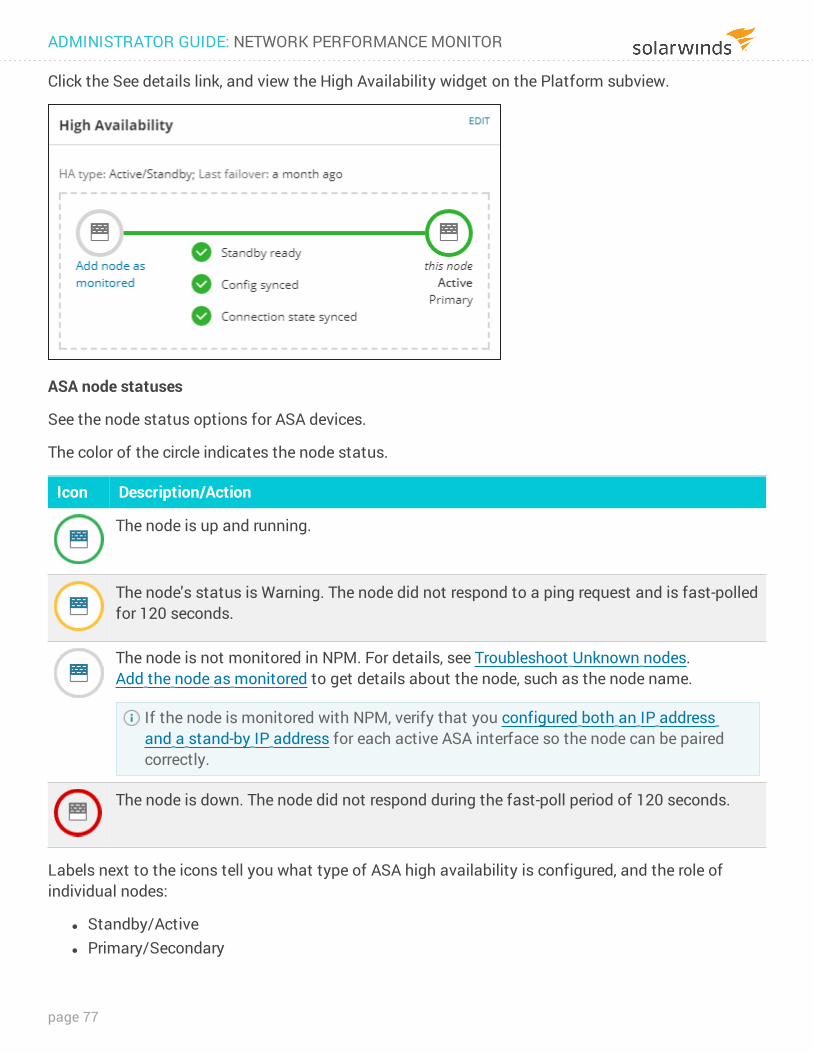
Click the See details link, and view the High Availability widget on the Platform subview.
ASA node statuses
See the node status options for ASA devices.
The color of the circle indicates the node status.
Icon Description/Action
The node is up and running.
The node's status is Warning. The node did not respond to a ping request and is fast-polled for 120 seconds.
The node is not monitored in NPM. For details, see Troubleshoot Unknown nodes. Add the node as monitored to get details about the node, such as the node name.
If the node is monitored with NPM, verify that you configured both an IP address and a stand-by IP address for each active ASA interface so the node can be paired correctly.
The node is down. The node did not respond during the fast-poll period of 120 seconds.
Labels next to the icons tell you what type of ASA high availability is configured, and the role of individual nodes:
l Standby/Active l Primary/Secondary
ADMINISTRATOR GUIDE: NETWORK PERFORMANCE MONITOR
page 77
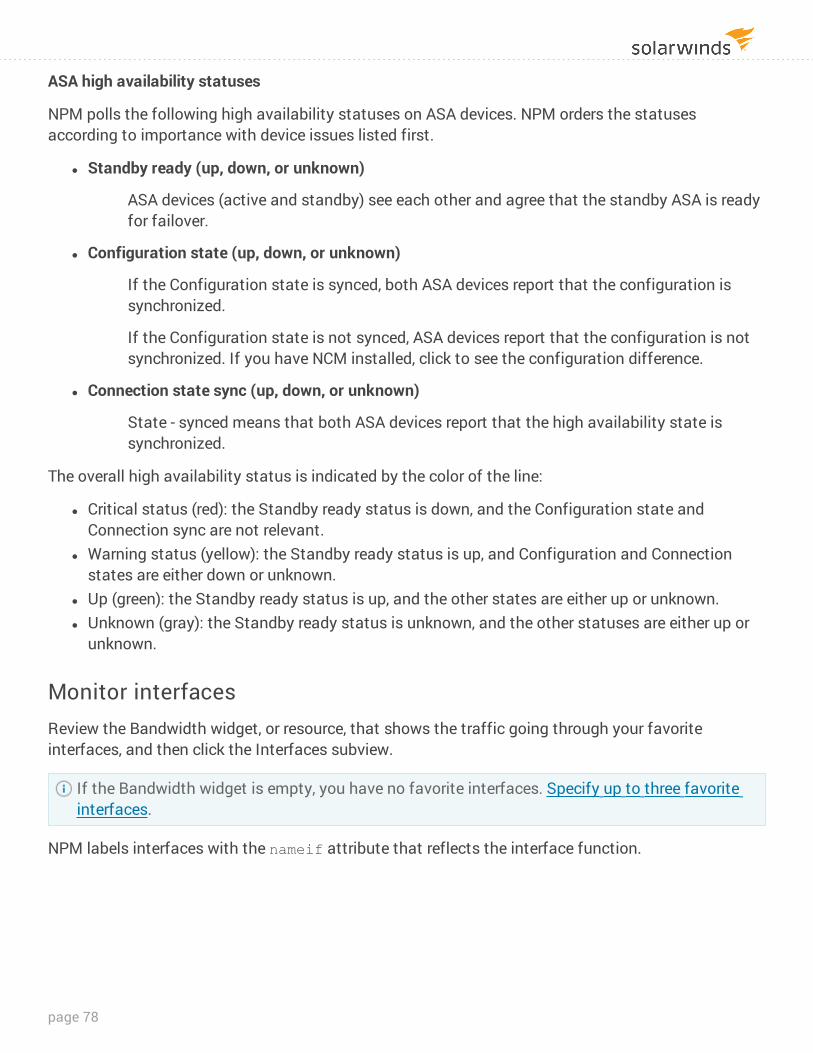
ASA high availability statuses
NPM polls the following high availability statuses on ASA devices. NPM orders the statuses according to importance with device issues listed first.
l Standby ready (up, down, or unknown)
ASA devices (active and standby) see each other and agree that the standby ASA is ready for failover.
l Configuration state (up, down, or unknown)
If the Configuration state is synced, both ASA devices report that the configuration is synchronized.
If the Configuration state is not synced, ASA devices report that the configuration is not synchronized. If you have NCM installed, click to see the configuration difference.
l Connection state sync (up, down, or unknown)
State - synced means that both ASA devices report that the high availability state is synchronized.
The overall high availability status is indicated by the color of the line:
l Critical status (red): the Standby ready status is down, and the Configuration state and Connection sync are not relevant.
l Warning status (yellow): the Standby ready status is up, and Configuration and Connection states are either down or unknown.
l Up (green): the Standby ready status is up, and the other states are either up or unknown. l Unknown (gray): the Standby ready status is unknown, and the other statuses are either up or
unknown.
Monitor interfacesReview the Bandwidth widget, or resource, that shows the traffic going through your favorite interfaces, and then click the Interfaces subview.
If the Bandwidth widget is empty, you have no favorite interfaces. Specify up to three favorite interfaces.
NPM labels interfaces with the nameif attribute that reflects the interface function.
page 78
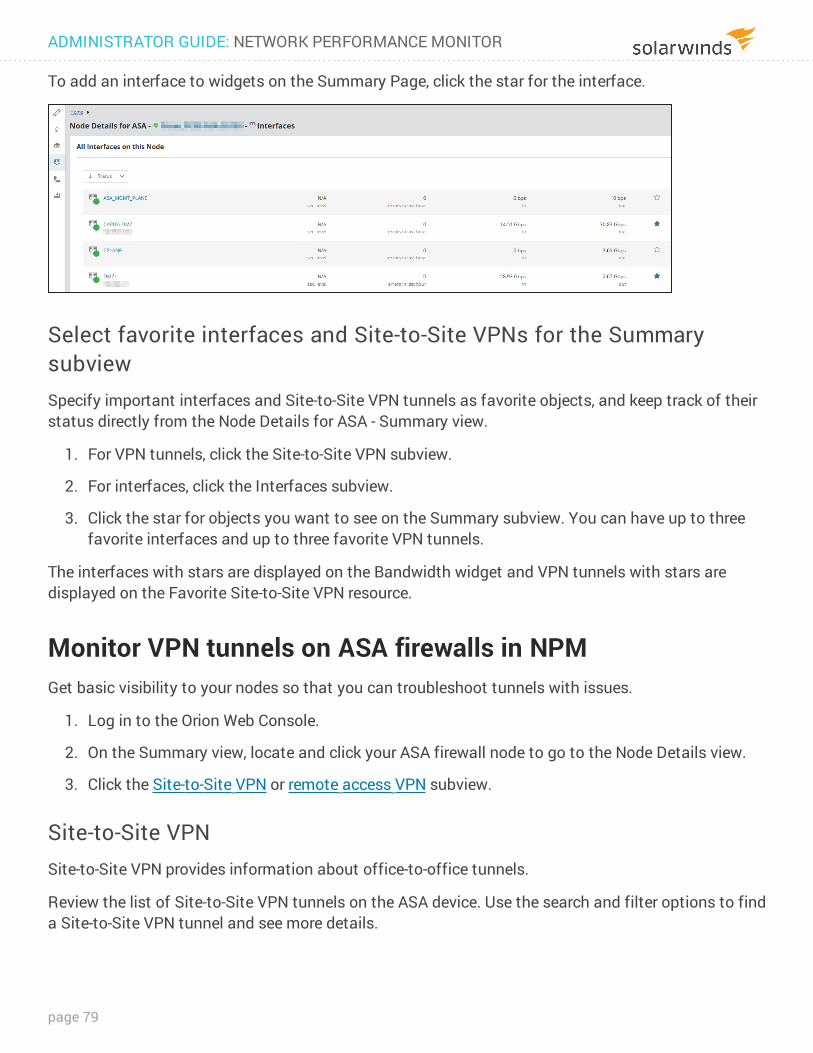
To add an interface to widgets on the Summary Page, click the star for the interface.
Select favorite interfaces and Site-to-Site VPNs for the Summary subviewSpecify important interfaces and Site-to-Site VPN tunnels as favorite objects, and keep track of their status directly from the Node Details for ASA - Summary view.
1. For VPN tunnels, click the Site-to-Site VPN subview.
2. For interfaces, click the Interfaces subview.
3. Click the star for objects you want to see on the Summary subview. You can have up to three favorite interfaces and up to three favorite VPN tunnels.
The interfaces with stars are displayed on the Bandwidth widget and VPN tunnels with stars are displayed on the Favorite Site-to-Site VPN resource.
Monitor VPN tunnels on ASA firewalls in NPMGet basic visibility to your nodes so that you can troubleshoot tunnels with issues.
1. Log in to the Orion Web Console.
2. On the Summary view, locate and click your ASA firewall node to go to the Node Details view.
3. Click the Site-to-Site VPN or remote access VPN subview.
Site-to-Site VPNSite-to-Site VPN provides information about office-to-office tunnels.
Review the list of Site-to-Site VPN tunnels on the ASA device. Use the search and filter options to find a Site-to-Site VPN tunnel and see more details.
ADMINISTRATOR GUIDE: NETWORK PERFORMANCE MONITOR
page 79
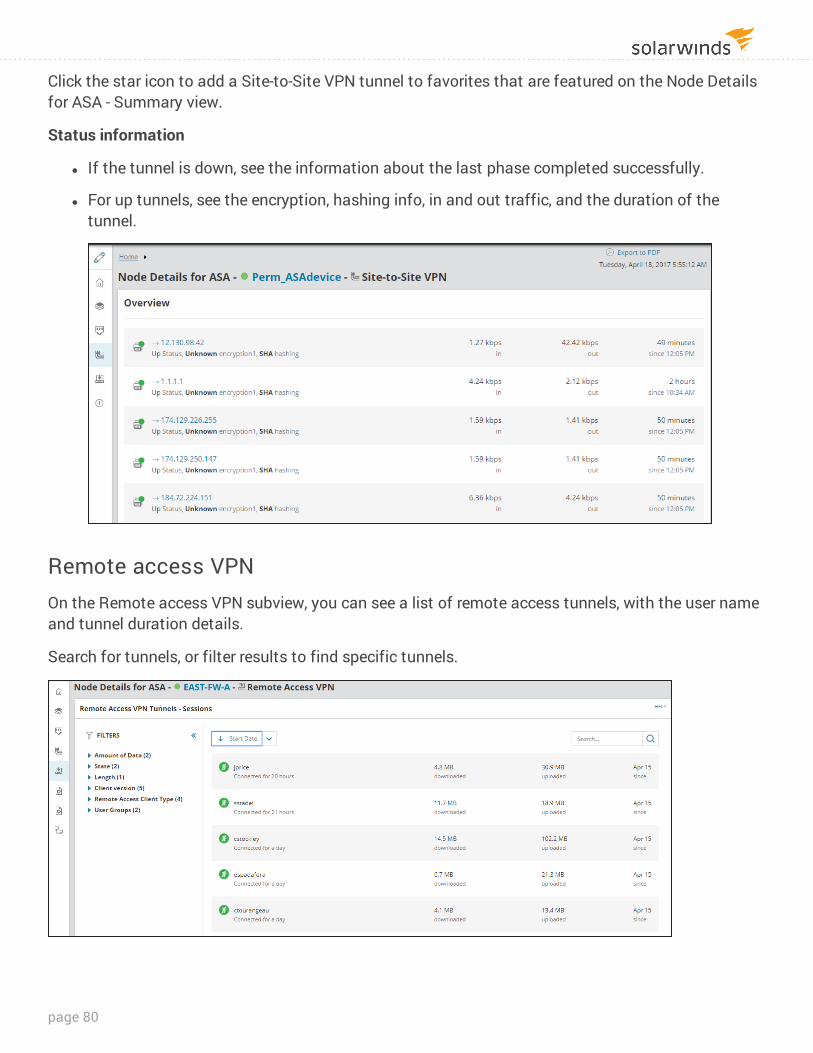
Click the star icon to add a Site-to-Site VPN tunnel to favorites that are featured on the Node Details for ASA - Summary view.
Status information
l If the tunnel is down, see the information about the last phase completed successfully.
l For up tunnels, see the encryption, hashing info, in and out traffic, and the duration of the tunnel.
Remote access VPNOn the Remote access VPN subview, you can see a list of remote access tunnels, with the user name and tunnel duration details.
Search for tunnels, or filter results to find specific tunnels.
page 80
Review access lists on ASA firewalls in NPM and NCMTo monitor access lists and access the ACL subview, you need NCM 7.7 or later installed.
See what ACLs are applied to what interfaces and review those ACLs.
1. Log in to the Orion Web Console.
2. On the Summary view, locate and click your ASA firewall node to go to the Node Details view.
3. Click the Access Lists tab.
If you have NCM installed, you can compare the configuration of access lists. Click Compare ACL to go to the NCM widget.
For more details, see Manage ACLs on Cisco ASA and Nexus devices in NCM documentation.
ADMINISTRATOR GUIDE: NETWORK PERFORMANCE MONITOR
page 81
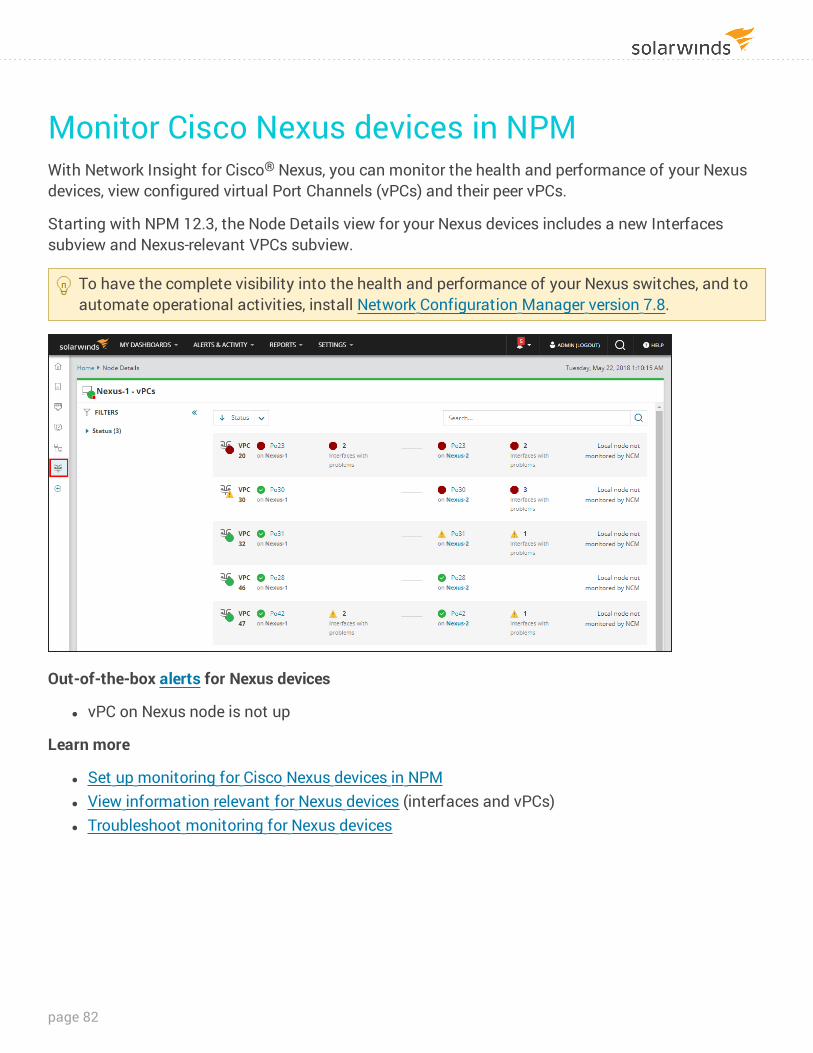
Monitor Cisco Nexus devices in NPMWith Network Insight for Cisco® Nexus, you can monitor the health and performance of your Nexus devices, view configured virtual Port Channels (vPCs) and their peer vPCs.
Starting with NPM 12.3, the Node Details view for your Nexus devices includes a new Interfaces subview and Nexus-relevant VPCs subview.
To have the complete visibility into the health and performance of your Nexus switches, and to automate operational activities, install Network Configuration Manager version 7.8.
Out-of-the-box alerts for Nexus devices
l vPC on Nexus node is not up
Learn more
l Set up monitoring for Cisco Nexus devices in NPM l View information relevant for Nexus devices (interfaces and vPCs) l Troubleshoot monitoring for Nexus devices
page 82
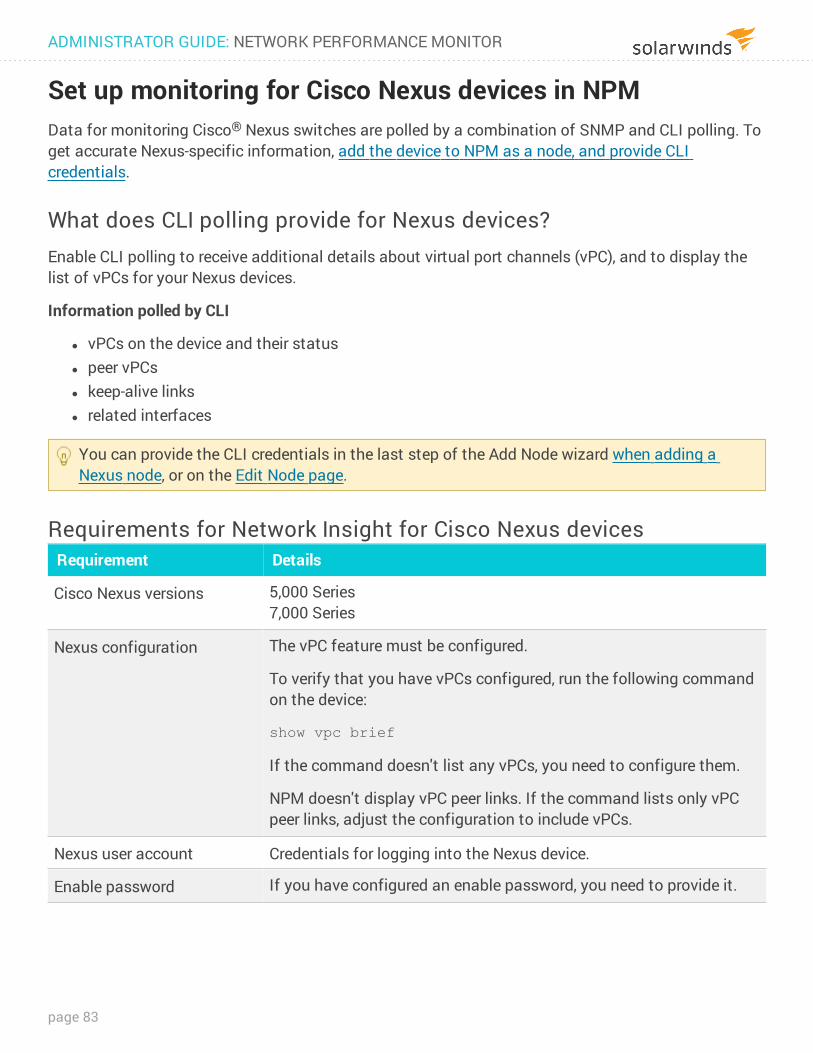
Set up monitoring for Cisco Nexus devices in NPMData for monitoring Cisco® Nexus switches are polled by a combination of SNMP and CLI polling. To get accurate Nexus-specific information, add the device to NPM as a node, and provide CLI credentials.
What does CLI polling provide for Nexus devices?Enable CLI polling to receive additional details about virtual port channels (vPC), and to display the list of vPCs for your Nexus devices.
Information polled by CLI
l vPCs on the device and their status l peer vPCs l keep-alive links l related interfaces
You can provide the CLI credentials in the last step of the Add Node wizard when adding a Nexus node, or on the Edit Node page.
Requirements for Network Insight for Cisco Nexus devicesRequirement Details
Cisco Nexus versions 5,000 Series7,000 Series
Nexus configuration The vPC feature must be configured.
To verify that you have vPCs configured, run the following command on the device:
show vpc brief
If the command doesn't list any vPCs, you need to configure them.
NPM doesn't display vPC peer links. If the command lists only vPC peer links, adjust the configuration to include vPCs.
Nexus user account Credentials for logging into the Nexus device.
Enable password If you have configured an enable password, you need to provide it.
ADMINISTRATOR GUIDE: NETWORK PERFORMANCE MONITOR
page 83
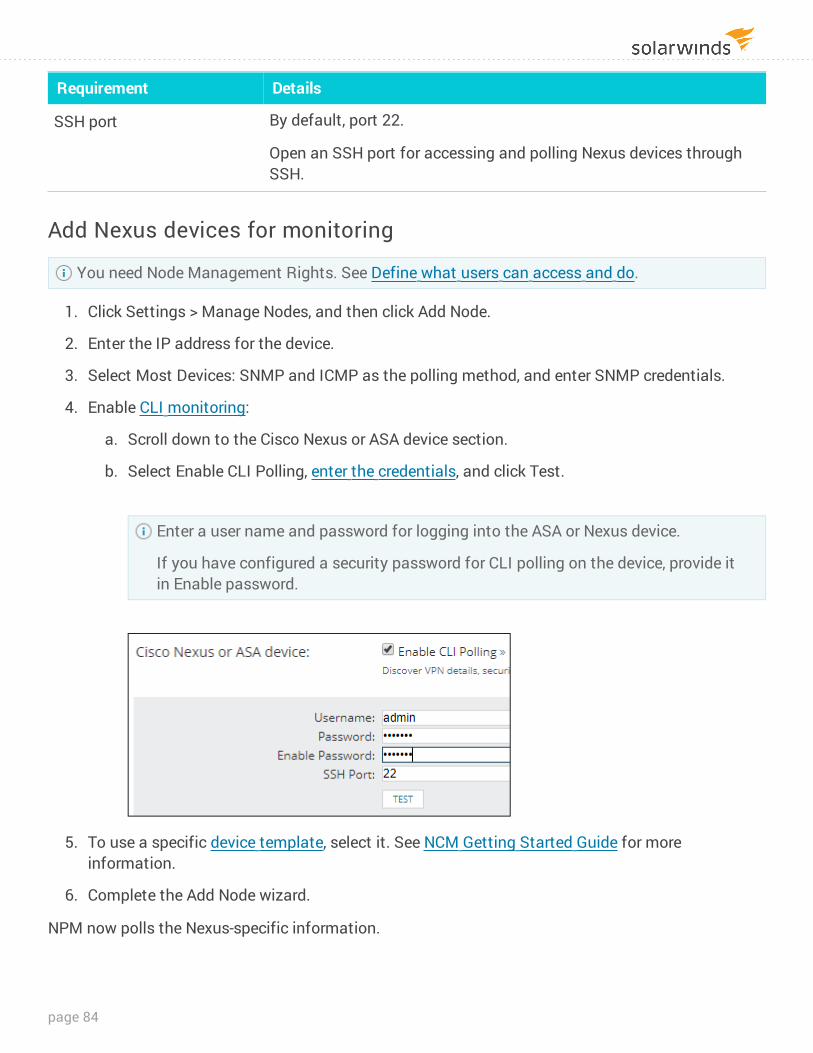
Requirement Details
SSH port By default, port 22.
Open an SSH port for accessing and polling Nexus devices through SSH.
Add Nexus devices for monitoring
You need Node Management Rights. See Define what users can access and do.
1. Click Settings > Manage Nodes, and then click Add Node.
2. Enter the IP address for the device.
3. Select Most Devices: SNMP and ICMP as the polling method, and enter SNMP credentials.
4. Enable CLI monitoring:
a. Scroll down to the Cisco Nexus or ASA device section.
b. Select Enable CLI Polling, enter the credentials, and click Test.
Enter a user name and password for logging into the ASA or Nexus device.
If you have configured a security password for CLI polling on the device, provide it in Enable password.
5. To use a specific device template, select it. See NCM Getting Started Guide for more information.
6. Complete the Add Node wizard.
NPM now polls the Nexus-specific information.
page 84
Enable CLI polling on monitored devicesTo poll vPC data on Nexus devices already monitored in SolarWinds NPM, enable CLI polling.
1. On the node details view, click Edit Node in the Management resource.
2. Scroll down to the Cisco Nexus or ASA device section.
3. Select Enable CLI Polling, enter the credentials, and click Test.
4. Click Submit.
You can now poll device-specific information, such as vPCs. The node details view for your Nexus devices includes the vPC subview listing all vPCs with their member ports.
Troubleshoot monitoring Cisco Nexus devicesVerify the following:
l The node or interface is monitored in NPM. If your vPC is configured, NPM can see that it has a peer. There are no details about the peer node. To see the details, add the node to NPM for monitoring and enable CLI polling.
If you only have NCM installed and cannot see any vPCs, download the running config to get a list of vPCs configured on the device. To get more information about vPCs, install NPM.
l You have enabled CLI polling on the device. l You are using the correct user credentials to log in to the device. l You are using the correct password for CLI access.
ADMINISTRATOR GUIDE: NETWORK PERFORMANCE MONITOR
page 85
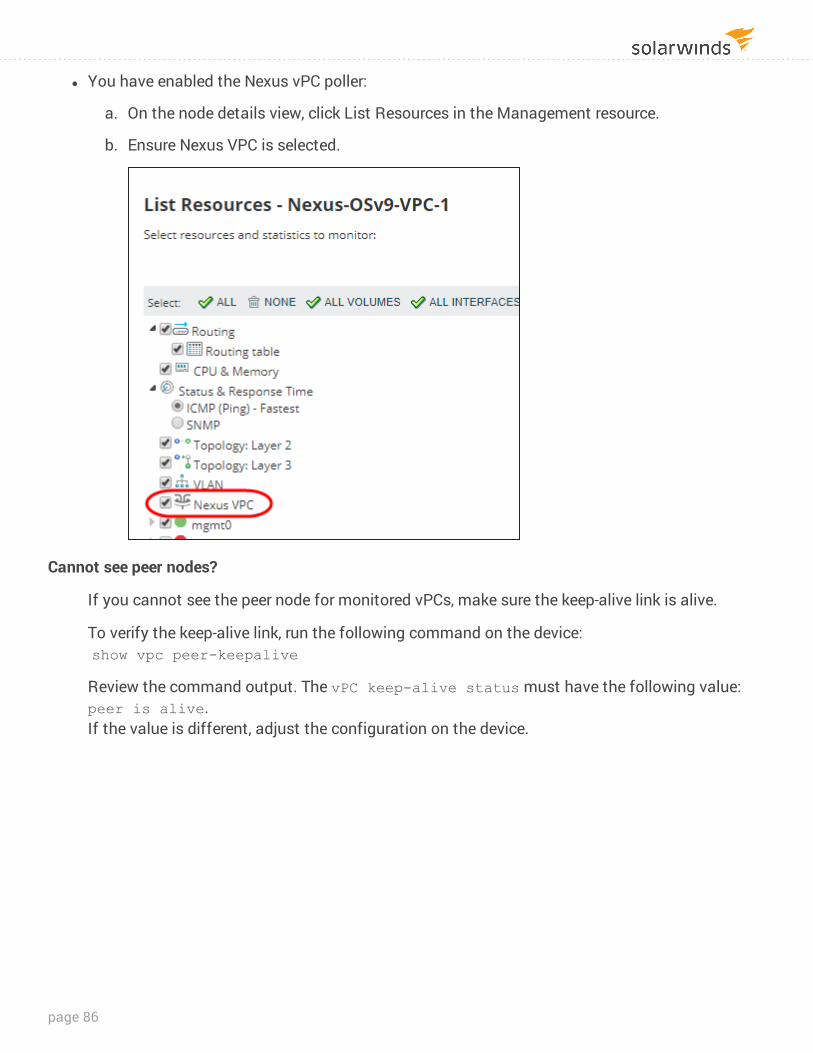
l You have enabled the Nexus vPC poller:
a. On the node details view, click List Resources in the Management resource.
b. Ensure Nexus VPC is selected.
Cannot see peer nodes?
If you cannot see the peer node for monitored vPCs, make sure the keep-alive link is alive.
To verify the keep-alive link, run the following command on the device: show vpc peer-keepalive
Review the command output. The vPC keep-alive status must have the following value:peer is alive. If the value is different, adjust the configuration on the device.
page 86
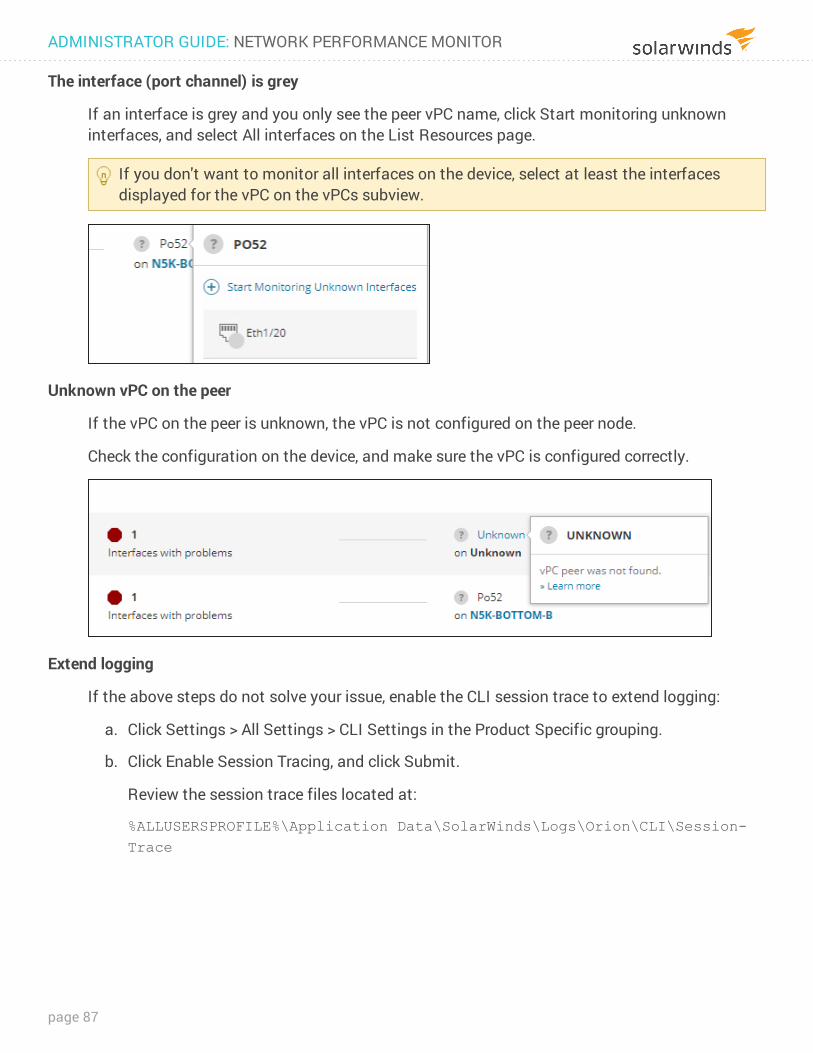
The interface (port channel) is grey
If an interface is grey and you only see the peer vPC name, click Start monitoring unknown interfaces, and select All interfaces on the List Resources page.
If you don't want to monitor all interfaces on the device, select at least the interfaces displayed for the vPC on the vPCs subview.
Unknown vPC on the peer
If the vPC on the peer is unknown, the vPC is not configured on the peer node.
Check the configuration on the device, and make sure the vPC is configured correctly.
Extend logging
If the above steps do not solve your issue, enable the CLI session trace to extend logging:
a. Click Settings > All Settings > CLI Settings in the Product Specific grouping.
b. Click Enable Session Tracing, and click Submit.
Review the session trace files located at:
%ALLUSERSPROFILE%\Application Data\SolarWinds\Logs\Orion\CLI\Session-Trace
ADMINISTRATOR GUIDE: NETWORK PERFORMANCE MONITOR
page 87
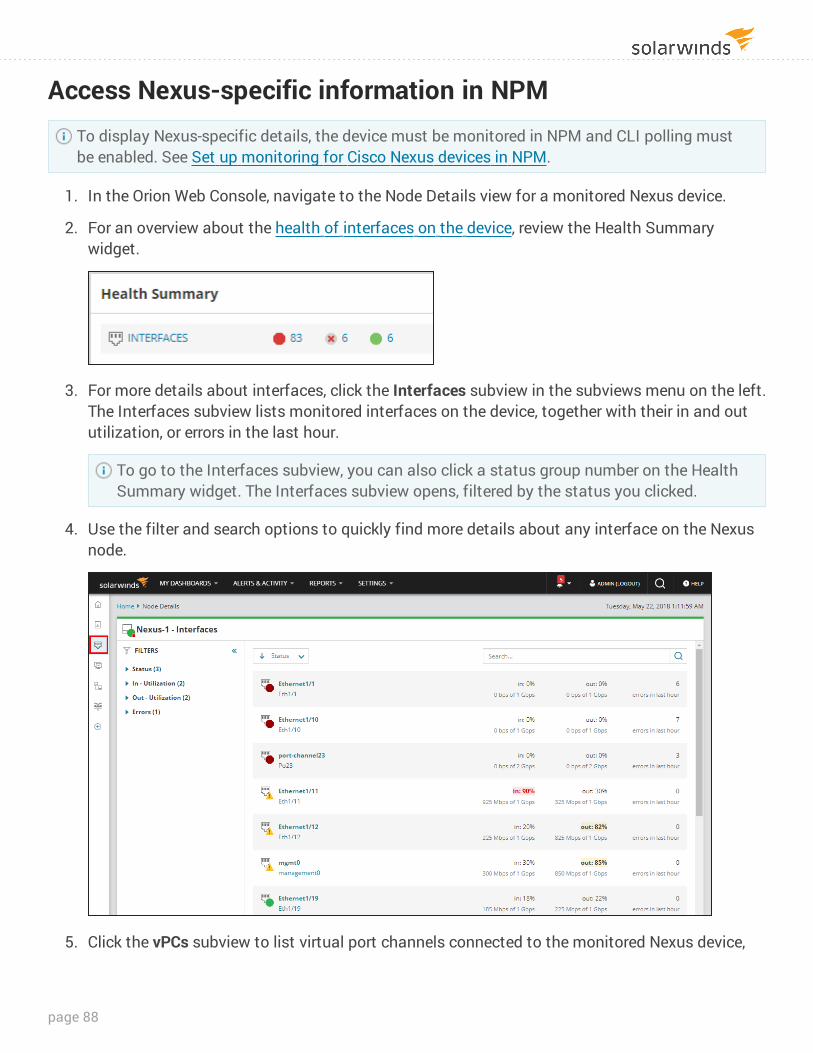
Access Nexus-specific information in NPMTo display Nexus-specific details, the device must be monitored in NPM and CLI polling must be enabled. See Set up monitoring for Cisco Nexus devices in NPM.
1. In the Orion Web Console, navigate to the Node Details view for a monitored Nexus device.
2. For an overview about the health of interfaces on the device, review the Health Summary widget.
3. For more details about interfaces, click the Interfaces subview in the subviews menu on the left. The Interfaces subview lists monitored interfaces on the device, together with their in and out utilization, or errors in the last hour.
To go to the Interfaces subview, you can also click a status group number on the Health Summary widget. The Interfaces subview opens, filtered by the status you clicked.
4. Use the filter and search options to quickly find more details about any interface on the Nexus node.
5. Click the vPCs subview to list virtual port channels connected to the monitored Nexus device,
page 88
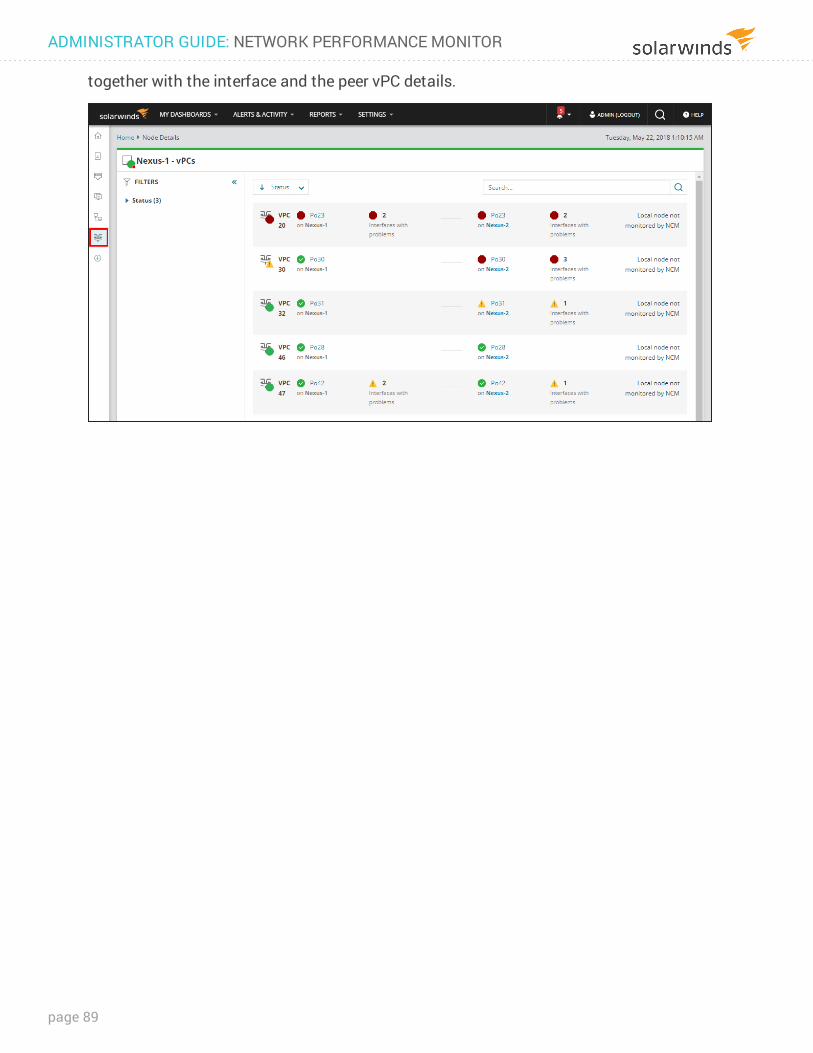
together with the interface and the peer vPC details.
ADMINISTRATOR GUIDE: NETWORK PERFORMANCE MONITOR
page 89
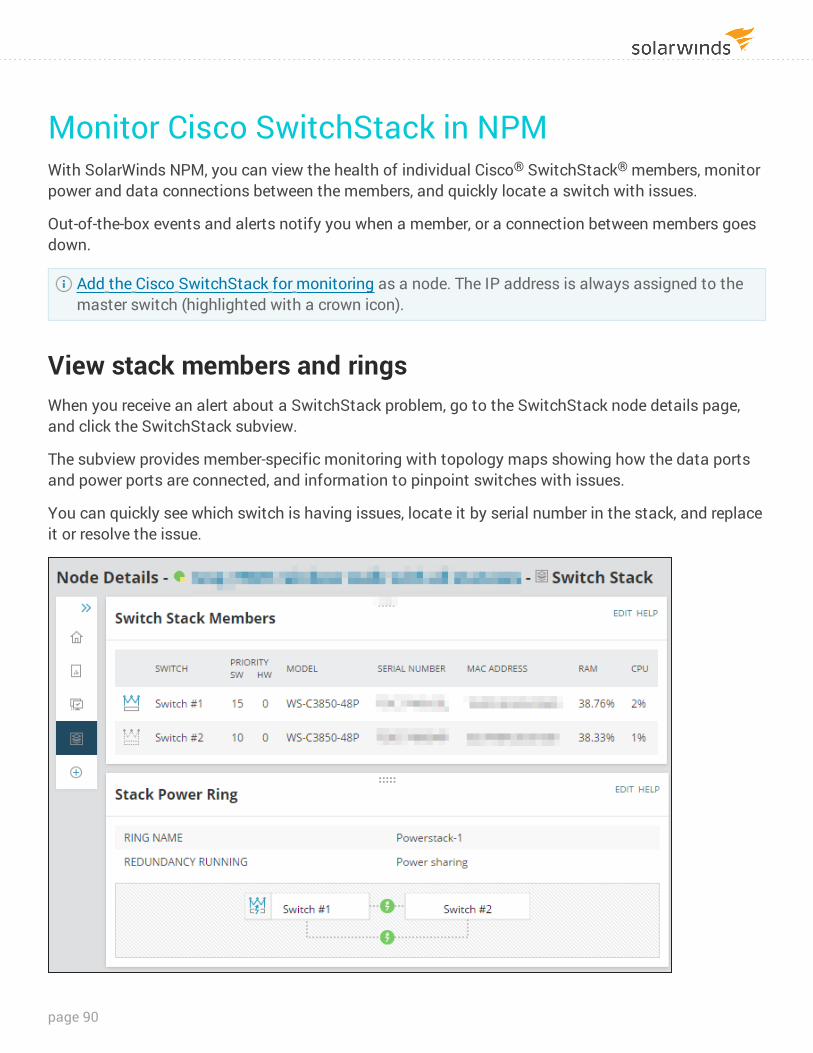
Monitor Cisco SwitchStack in NPMWith SolarWinds NPM, you can view the health of individual Cisco® SwitchStack® members, monitor power and data connections between the members, and quickly locate a switch with issues.
Out-of-the-box events and alerts notify you when a member, or a connection between members goes down.
Add the Cisco SwitchStack for monitoring as a node. The IP address is always assigned to the master switch (highlighted with a crown icon).
View stack members and ringsWhen you receive an alert about a SwitchStack problem, go to the SwitchStack node details page, and click the SwitchStack subview.
The subview provides member-specific monitoring with topology maps showing how the data ports and power ports are connected, and information to pinpoint switches with issues.
You can quickly see which switch is having issues, locate it by serial number in the stack, and replace it or resolve the issue.
page 90
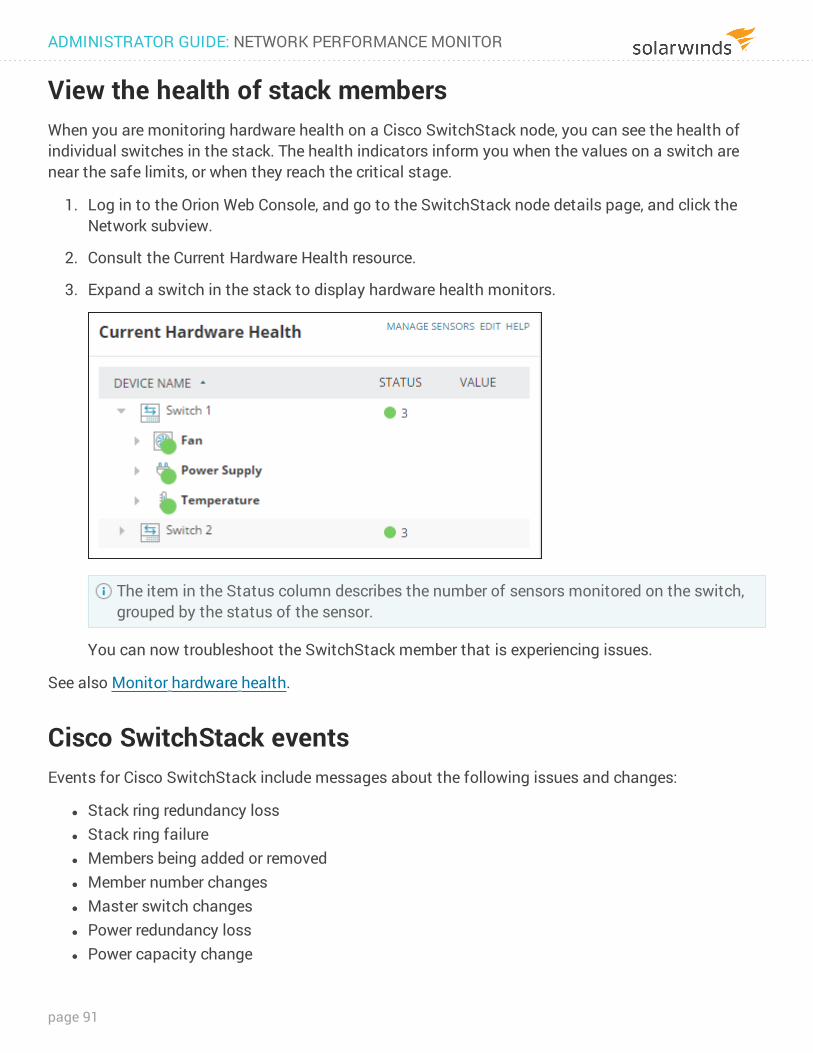
View the health of stack members When you are monitoring hardware health on a Cisco SwitchStack node, you can see the health of individual switches in the stack. The health indicators inform you when the values on a switch are near the safe limits, or when they reach the critical stage.
1. Log in to the Orion Web Console, and go to the SwitchStack node details page, and click the Network subview.
2. Consult the Current Hardware Health resource.
3. Expand a switch in the stack to display hardware health monitors.
The item in the Status column describes the number of sensors monitored on the switch, grouped by the status of the sensor.
You can now troubleshoot the SwitchStack member that is experiencing issues.
See also Monitor hardware health.
Cisco SwitchStack eventsEvents for Cisco SwitchStack include messages about the following issues and changes:
l Stack ring redundancy loss l Stack ring failure l Members being added or removed l Member number changes l Master switch changes l Power redundancy loss l Power capacity change
ADMINISTRATOR GUIDE: NETWORK PERFORMANCE MONITOR
page 91
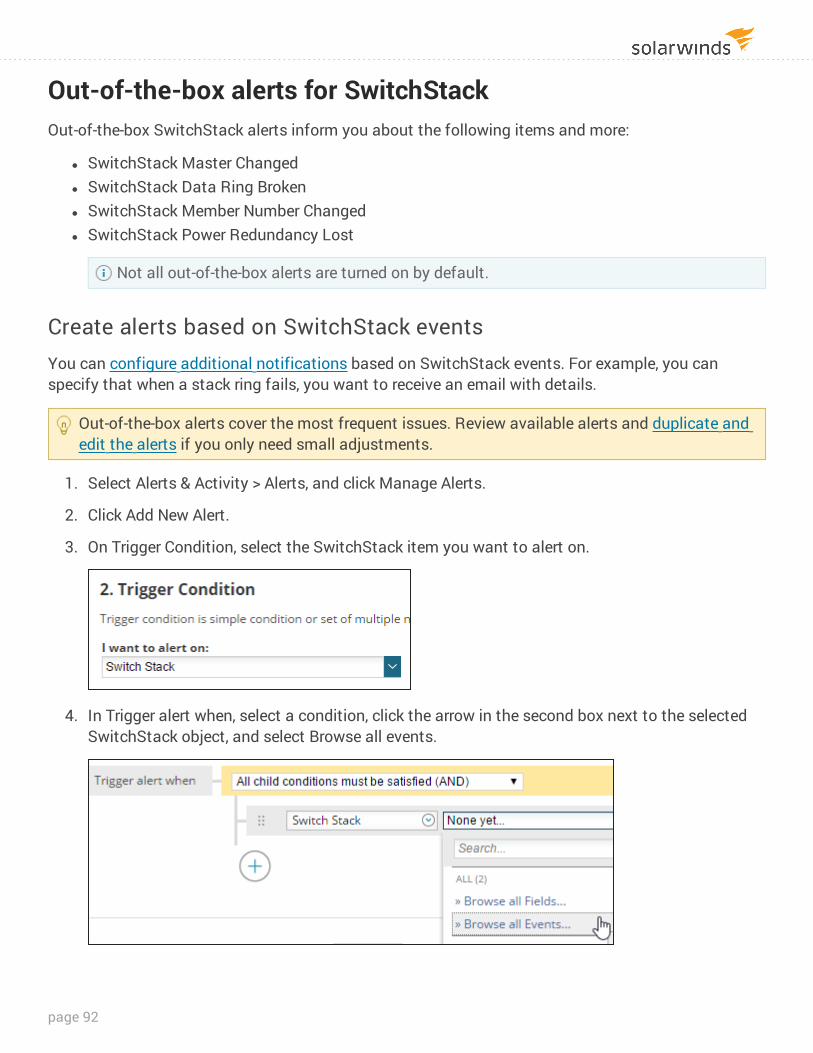
Out-of-the-box alerts for SwitchStackOut-of-the-box SwitchStack alerts inform you about the following items and more:
l SwitchStack Master Changed l SwitchStack Data Ring Broken l SwitchStack Member Number Changed l SwitchStack Power Redundancy Lost
Not all out-of-the-box alerts are turned on by default.
Create alerts based on SwitchStack eventsYou can configure additional notifications based on SwitchStack events. For example, you can specify that when a stack ring fails, you want to receive an email with details.
Out-of-the-box alerts cover the most frequent issues. Review available alerts and duplicate and edit the alerts if you only need small adjustments.
1. Select Alerts & Activity > Alerts, and click Manage Alerts.
2. Click Add New Alert.
3. On Trigger Condition, select the SwitchStack item you want to alert on.
4. In Trigger alert when, select a condition, click the arrow in the second box next to the selected SwitchStack object, and select Browse all events.
page 92
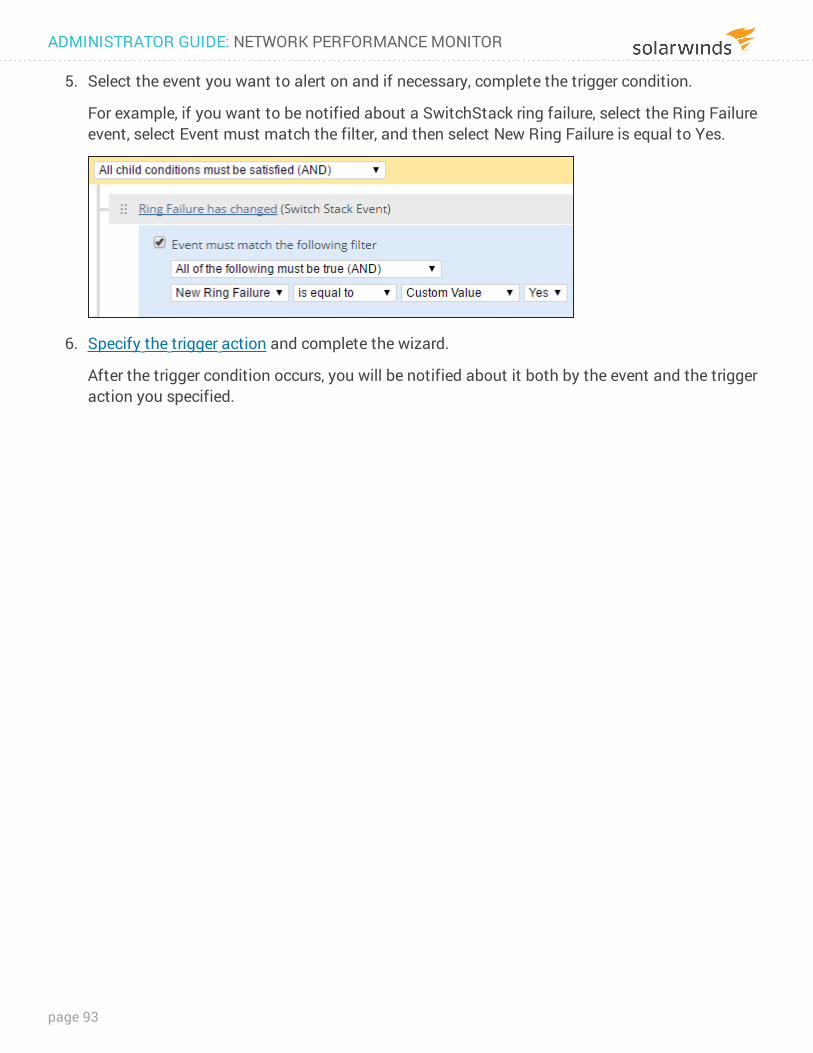
5. Select the event you want to alert on and if necessary, complete the trigger condition.
For example, if you want to be notified about a SwitchStack ring failure, select the Ring Failure event, select Event must match the filter, and then select New Ring Failure is equal to Yes.
6. Specify the trigger action and complete the wizard.
After the trigger condition occurs, you will be notified about it both by the event and the trigger action you specified.
ADMINISTRATOR GUIDE: NETWORK PERFORMANCE MONITOR
page 93
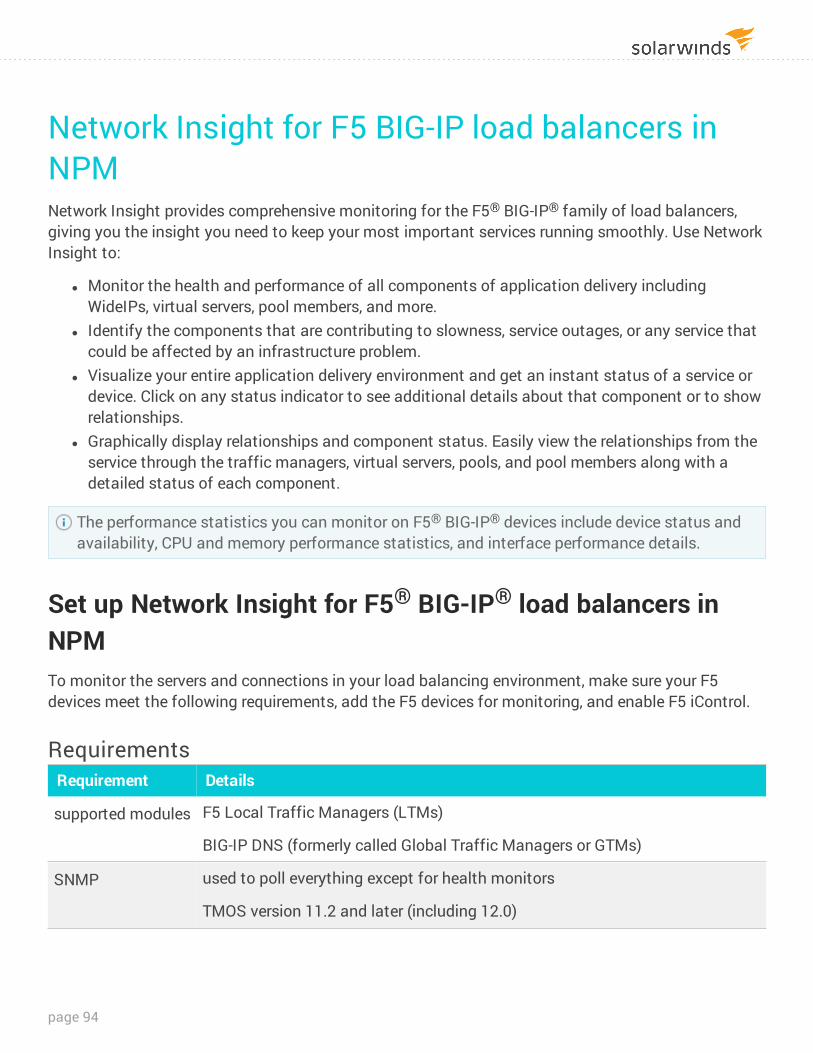
Network Insight for F5 BIG-IP load balancers in NPMNetwork Insight provides comprehensive monitoring for the F5® BIG-IP® family of load balancers, giving you the insight you need to keep your most important services running smoothly. Use Network Insight to:
l Monitor the health and performance of all components of application delivery including WideIPs, virtual servers, pool members, and more.
l Identify the components that are contributing to slowness, service outages, or any service that could be affected by an infrastructure problem.
l Visualize your entire application delivery environment and get an instant status of a service or device. Click on any status indicator to see additional details about that component or to show relationships.
l Graphically display relationships and component status. Easily view the relationships from the service through the traffic managers, virtual servers, pools, and pool members along with a detailed status of each component.
The performance statistics you can monitor on F5® BIG-IP® devices include device status and availability, CPU and memory performance statistics, and interface performance details.
Set up Network Insight for F5® BIG-IP® load balancers in NPMTo monitor the servers and connections in your load balancing environment, make sure your F5 devices meet the following requirements, add the F5 devices for monitoring, and enable F5 iControl.
RequirementsRequirement Details
supported modules F5 Local Traffic Managers (LTMs)
BIG-IP DNS (formerly called Global Traffic Managers or GTMs)
SNMP used to poll everything except for health monitors
TMOS version 11.2 and later (including 12.0)
page 94
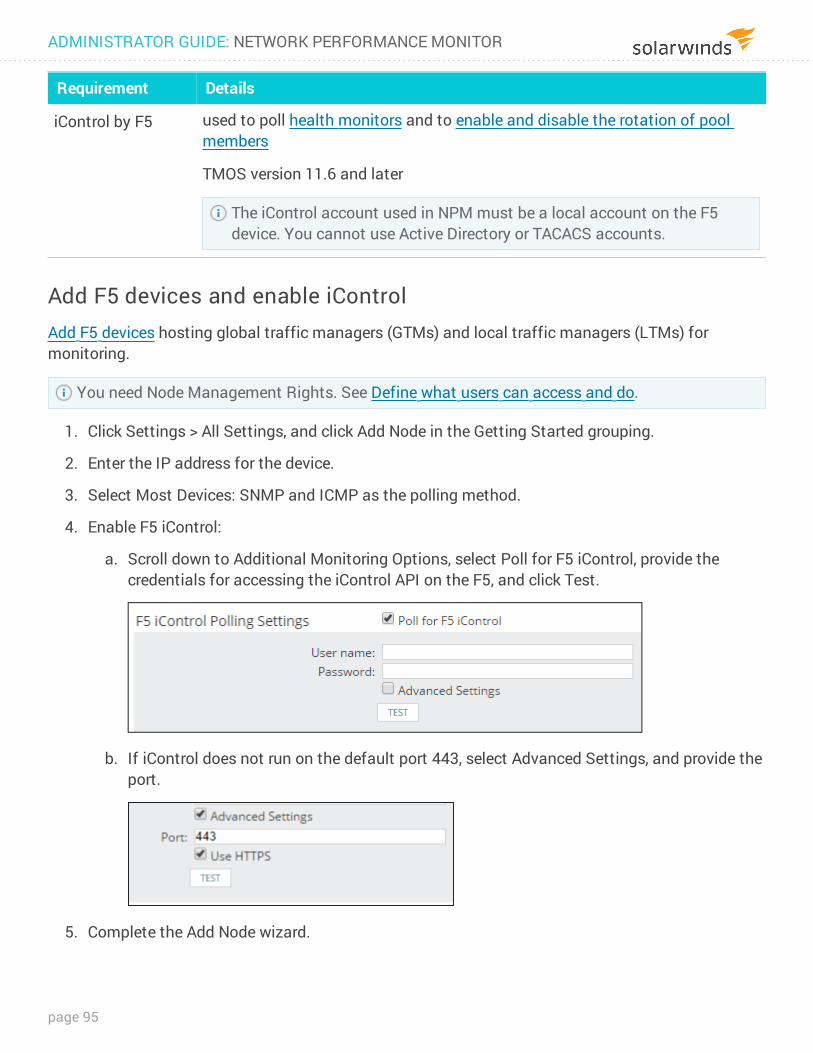
Requirement Details
iControl by F5 used to poll health monitors and to enable and disable the rotation of pool members
TMOS version 11.6 and later
The iControl account used in NPM must be a local account on the F5 device. You cannot use Active Directory or TACACS accounts.
Add F5 devices and enable iControlAdd F5 devices hosting global traffic managers (GTMs) and local traffic managers (LTMs) for monitoring.
You need Node Management Rights. See Define what users can access and do.
1. Click Settings > All Settings, and click Add Node in the Getting Started grouping.
2. Enter the IP address for the device.
3. Select Most Devices: SNMP and ICMP as the polling method.
4. Enable F5 iControl:
a. Scroll down to Additional Monitoring Options, select Poll for F5 iControl, provide the credentials for accessing the iControl API on the F5, and click Test.
b. If iControl does not run on the default port 443, select Advanced Settings, and provide the port.
5. Complete the Add Node wizard.
ADMINISTRATOR GUIDE: NETWORK PERFORMANCE MONITOR
page 95
Both status information and health statistics will be collected on the F5 device, and you can now monitor your load balancing environment:
l Monitor services delivered by F5® BIG-IP® load balancers in NPM l Take an F5 pool member out of rotation in NPM
See Discover your network with the Discovery Wizard to add more F5 devices at the same time.
Enable iControl on F5 load balancers When your F5 devices are already monitored in SolarWinds NPM, make sure iControl is enabled. F5 iControl API is used for collecting health monitor statistics from load balancers, and for enabling and disabling the rotation of pool members.
1. Click Settings > Manage Nodes.
2. Select the node, and click Edit Properties.
3. Enable F5 iControl.
4. Click Submit.
Now you can enable and disable the rotation of pool members and see the health monitors polled on the node.
Monitor services delivered by F5® BIG-IP® load balancers in NPMA load-balanced service is comprised of many components that work together. In the Balancing Environment widget, you can browse all of these components and their relationships and status.
1. Go to My Dashboards > Network > Load Balancing.
The page shows an overview of your load balancing environment.
page 96
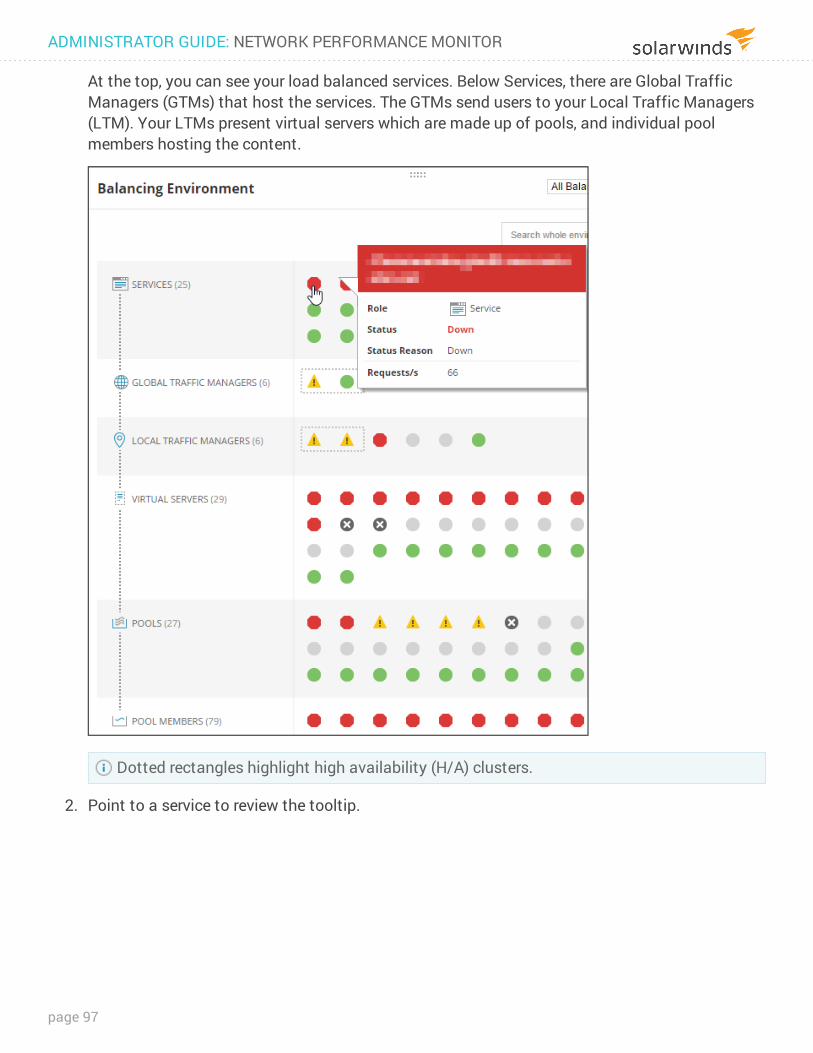
At the top, you can see your load balanced services. Below Services, there are Global Traffic Managers (GTMs) that host the services. The GTMs send users to your Local Traffic Managers (LTM). Your LTMs present virtual servers which are made up of pools, and individual pool members hosting the content.
Dotted rectangles highlight high availability (H/A) clusters.
2. Point to a service to review the tooltip.
ADMINISTRATOR GUIDE: NETWORK PERFORMANCE MONITOR
page 97
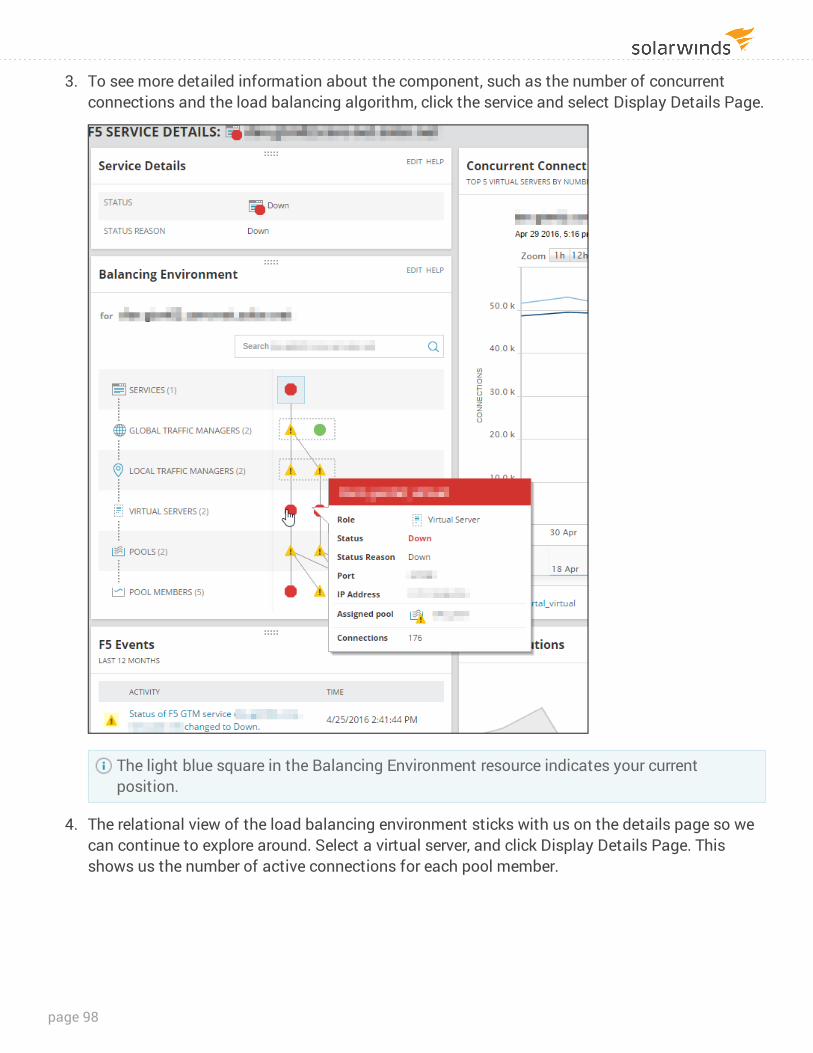
3. To see more detailed information about the component, such as the number of concurrent connections and the load balancing algorithm, click the service and select Display Details Page.
The light blue square in the Balancing Environment resource indicates your current position.
4. The relational view of the load balancing environment sticks with us on the details page so we can continue to explore around. Select a virtual server, and click Display Details Page. This shows us the number of active connections for each pool member.
page 98
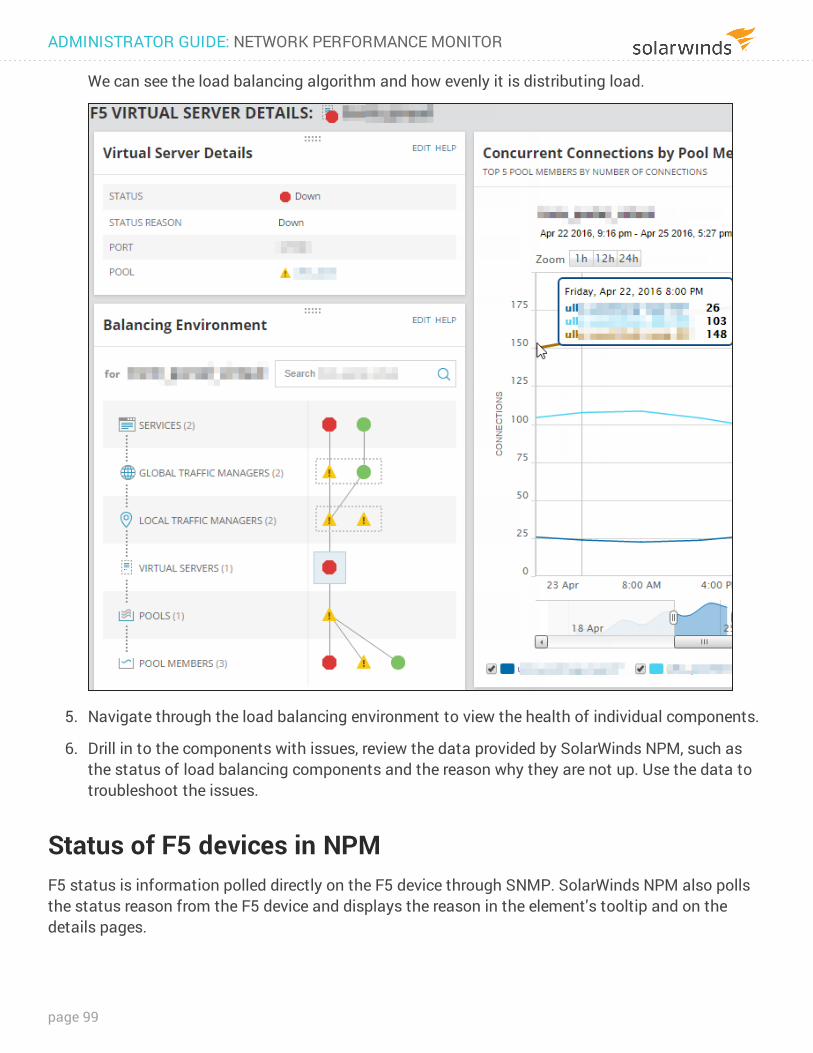
We can see the load balancing algorithm and how evenly it is distributing load.
5. Navigate through the load balancing environment to view the health of individual components.
6. Drill in to the components with issues, review the data provided by SolarWinds NPM, such as the status of load balancing components and the reason why they are not up. Use the data to troubleshoot the issues.
Status of F5 devices in NPMF5 status is information polled directly on the F5 device through SNMP. SolarWinds NPM also polls the status reason from the F5 device and displays the reason in the element's tooltip and on the details pages.
ADMINISTRATOR GUIDE: NETWORK PERFORMANCE MONITOR
page 99
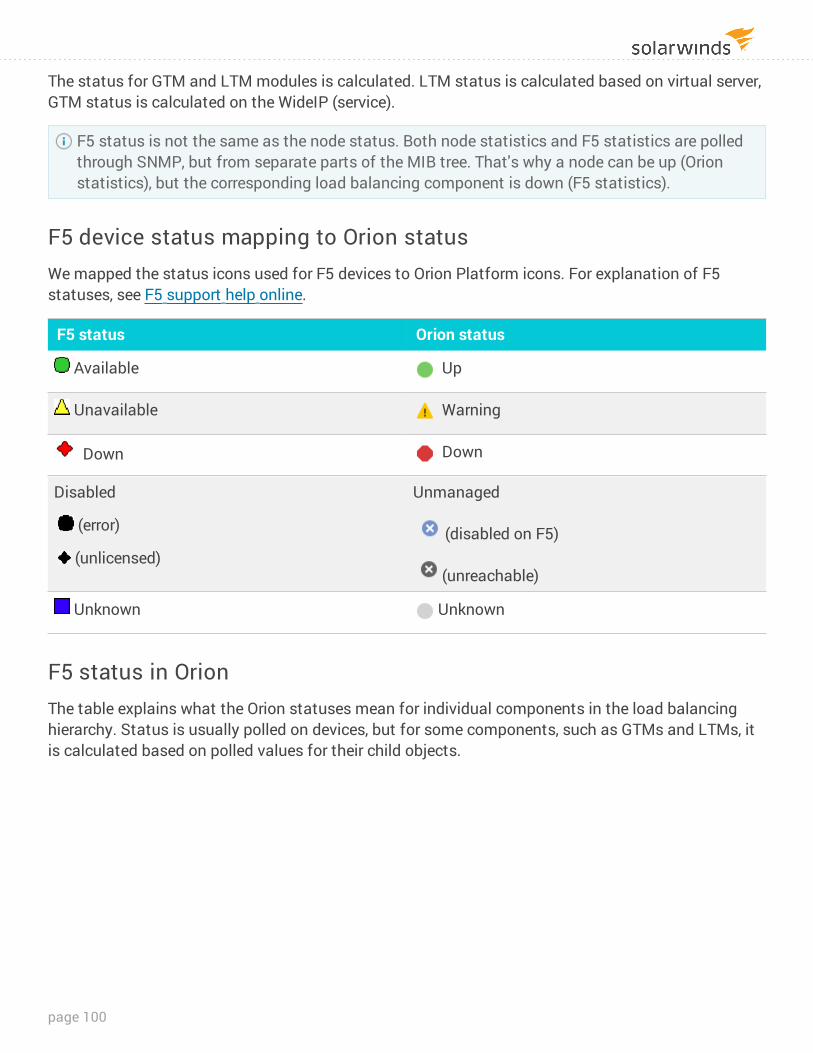
The status for GTM and LTM modules is calculated. LTM status is calculated based on virtual server, GTM status is calculated on the WideIP (service).
F5 status is not the same as the node status. Both node statistics and F5 statistics are polled through SNMP, but from separate parts of the MIB tree. That's why a node can be up (Orion statistics), but the corresponding load balancing component is down (F5 statistics).
F5 device status mapping to Orion statusWe mapped the status icons used for F5 devices to Orion Platform icons. For explanation of F5 statuses, see F5 support help online.
F5 status Orion status
Available Up
Unavailable Warning
Down Down
Disabled
(error)
(unlicensed)
Unmanaged
(disabled on F5)
(unreachable)
Unknown Unknown
F5 status in OrionThe table explains what the Orion statuses mean for individual components in the load balancing hierarchy. Status is usually polled on devices, but for some components, such as GTMs and LTMs, it is calculated based on polled values for their child objects.
page 100
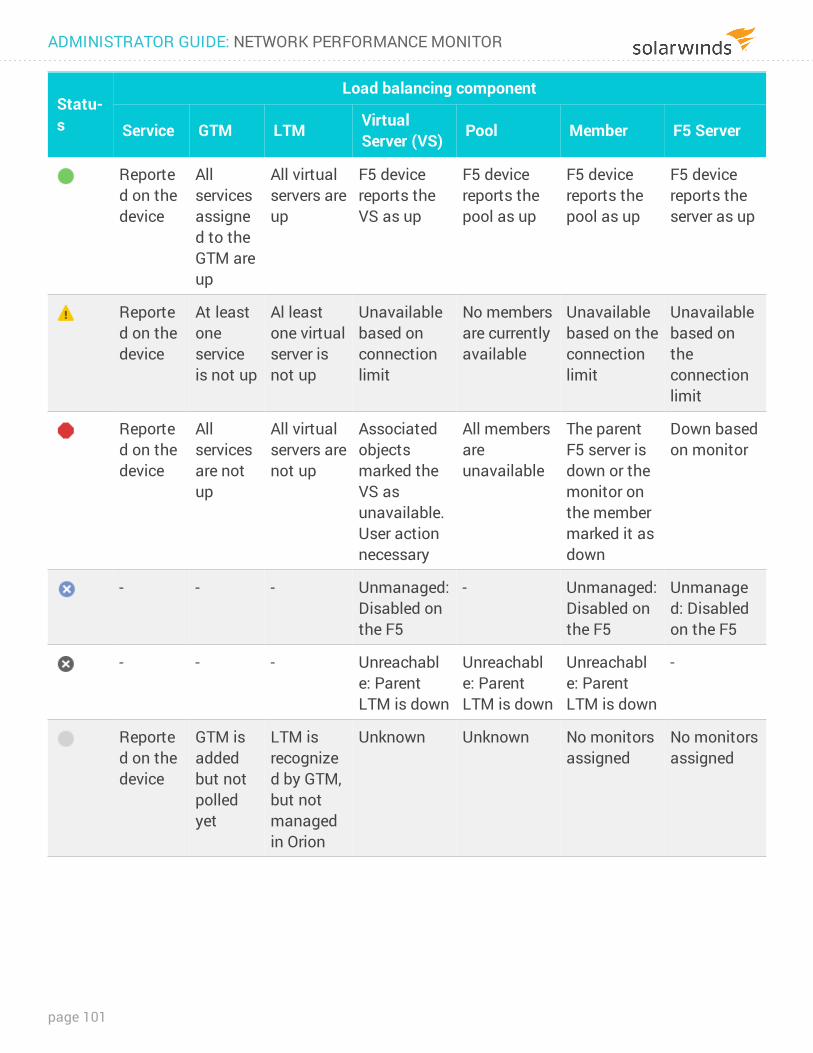
Statu-s
Load balancing component
Service GTM LTM Virtual Server (VS) Pool Member F5 Server
Reported on the device
All services assigned to the GTM are up
All virtual servers are up
F5 device reports the VS as up
F5 device reports the pool as up
F5 device reports the pool as up
F5 device reports the server as up
Reported on the device
At least one service is not up
Al least one virtual server is not up
Unavailable based on connection limit
No members are currently available
Unavailable based on the connection limit
Unavailable based on the connection limit
Reported on the device
All services are not up
All virtual servers are not up
Associated objects marked the VS as unavailable. User action necessary
All members are unavailable
The parent F5 server is down or the monitor on the member marked it as down
Down based on monitor
- - - Unmanaged: Disabled on the F5
- Unmanaged: Disabled on the F5
Unmanaged: Disabled on the F5
- - - Unreachable: Parent LTM is down
Unreachable: Parent LTM is down
Unreachable: Parent LTM is down
-
Reported on the device
GTM is added but not polled yet
LTM is recognized by GTM, but not managed in Orion
Unknown Unknown No monitors assigned
No monitors assigned
ADMINISTRATOR GUIDE: NETWORK PERFORMANCE MONITOR
page 101
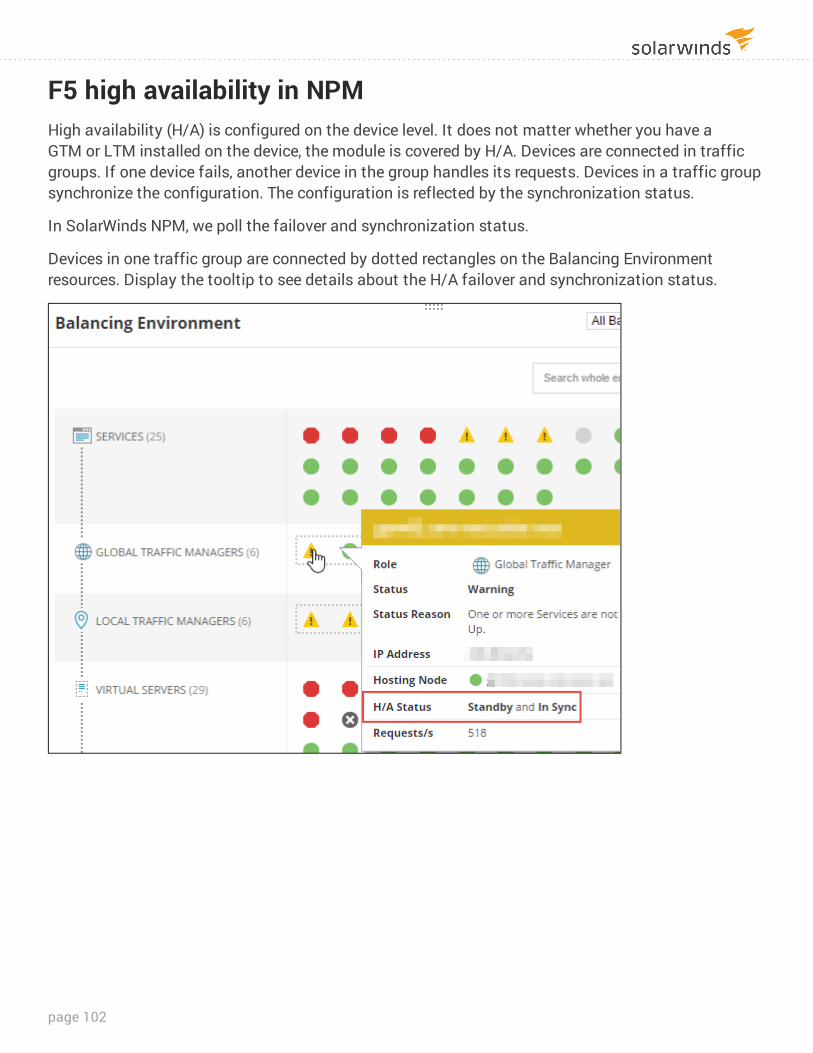
F5 high availability in NPMHigh availability (H/A) is configured on the device level. It does not matter whether you have a GTM or LTM installed on the device, the module is covered by H/A. Devices are connected in traffic groups. If one device fails, another device in the group handles its requests. Devices in a traffic group synchronize the configuration. The configuration is reflected by the synchronization status.
In SolarWinds NPM, we poll the failover and synchronization status.
Devices in one traffic group are connected by dotted rectangles on the Balancing Environment resources. Display the tooltip to see details about the H/A failover and synchronization status.
page 102
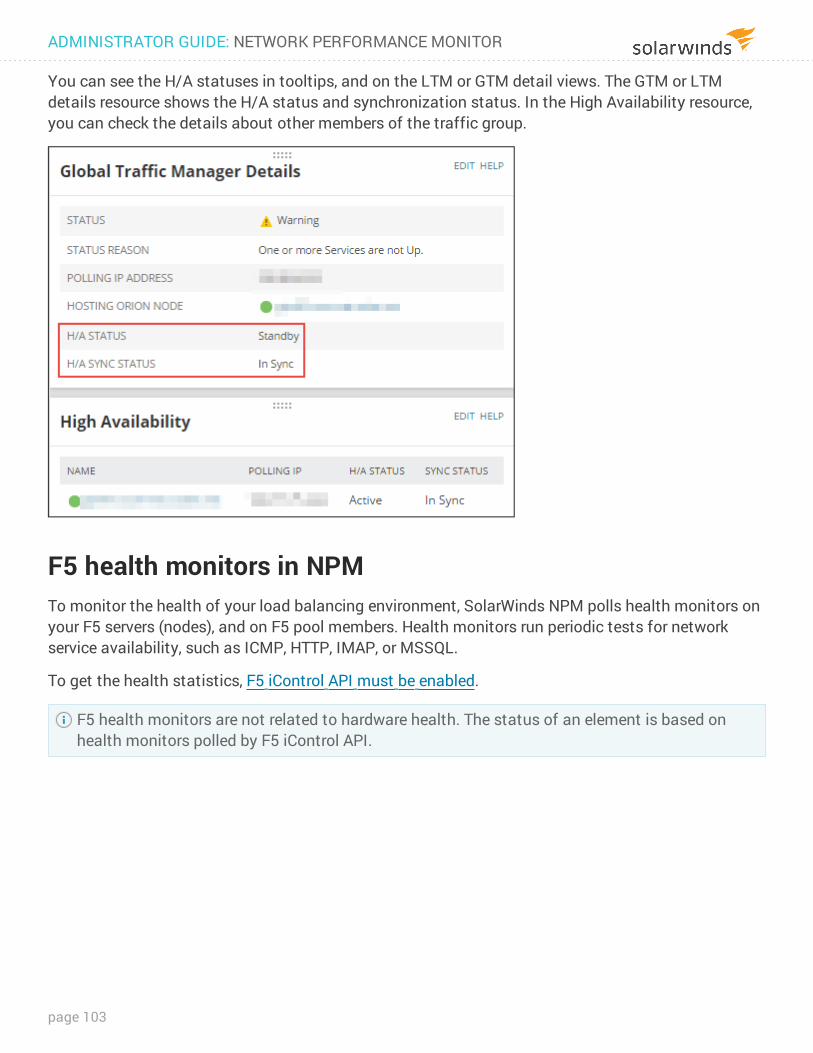
You can see the H/A statuses in tooltips, and on the LTM or GTM detail views. The GTM or LTM details resource shows the H/A status and synchronization status. In the High Availability resource, you can check the details about other members of the traffic group.
F5 health monitors in NPMTo monitor the health of your load balancing environment, SolarWinds NPM polls health monitors on your F5 servers (nodes), and on F5 pool members. Health monitors run periodic tests for network service availability, such as ICMP, HTTP, IMAP, or MSSQL.
To get the health statistics, F5 iControl API must be enabled.
F5 health monitors are not related to hardware health. The status of an element is based on health monitors polled by F5 iControl API.
ADMINISTRATOR GUIDE: NETWORK PERFORMANCE MONITOR
page 103
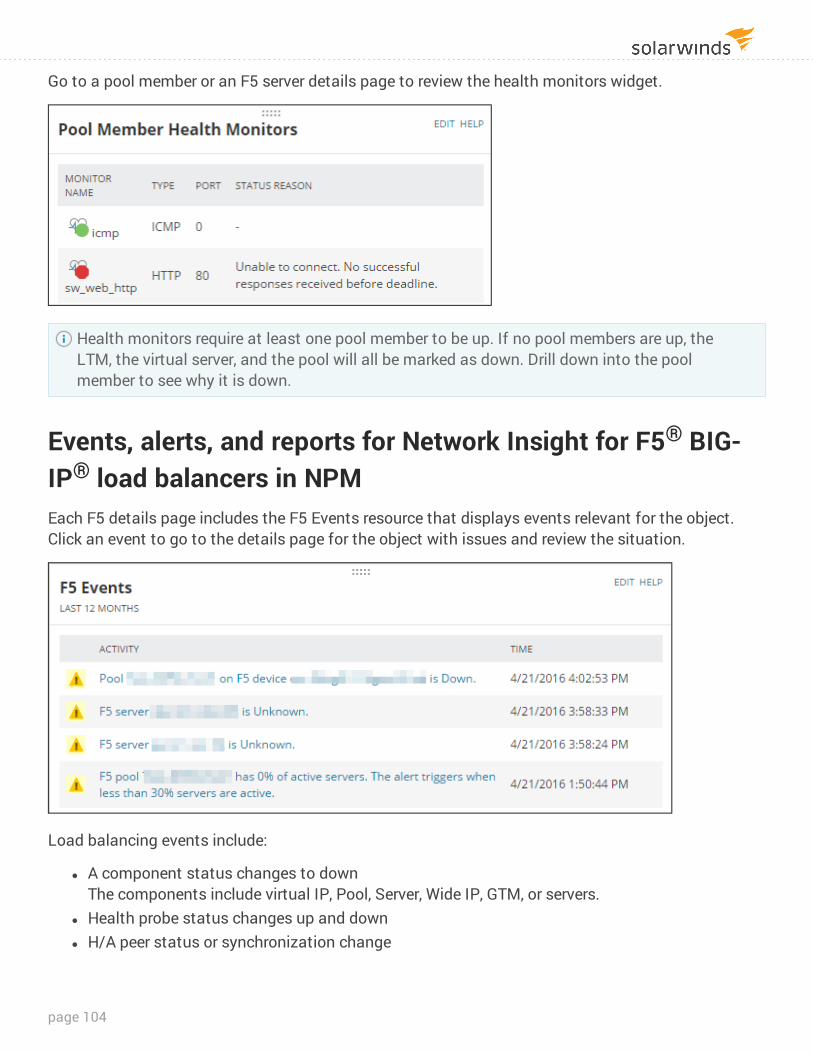
Go to a pool member or an F5 server details page to review the health monitors widget.
Health monitors require at least one pool member to be up. If no pool members are up, the LTM, the virtual server, and the pool will all be marked as down. Drill down into the pool member to see why it is down.
Events, alerts, and reports for Network Insight for F5® BIG-IP® load balancers in NPMEach F5 details page includes the F5 Events resource that displays events relevant for the object. Click an event to go to the details page for the object with issues and review the situation.
Load balancing events include:
l A component status changes to down The components include virtual IP, Pool, Server, Wide IP, GTM, or servers.
l Health probe status changes up and down l H/A peer status or synchronization change
page 104
l Server is taken out and placed in rotation l Concurrent connections per pool member exceed a threshold
Out-of-the-box alerts for F5 load balancersOut-of-the-box alerts cover the most critical issues in your F5 load balancing environment. For example, alerts warn you if the status of your F5 service changes or if a server goes down.
Out-of-the-box reportsSolarWinds NPM includes several out-of-the-box reports for F5 that you can use to view trends, establish baselines, or identify potential issues, such as:
l Average LTM Connections over the last 30 days l Average service availability over the last 30 days l Average service resolutions per second over the last 30 days
Take an F5 pool member out of rotation in NPMWhen you need to perform maintenance on one of the pool members providing a service, take the server out of rotation so that you can perform maintenance without impacting end users.
Taking server out of rotation means you put the pool member in maintenance mode.
F5 devices support Disabled and Forced Offline modes. SolarWinds NPM uses the Disabled maintenance mode.
Taking a pool member out of rotation requires that you have enabled F5 iControl on the device.
Why shouldn't I start maintenance immediately after I take a pool member out of rotation?When you put a pool in maintenance mode, there are still users connected to the server. Disabling the server only disables brand new connections.
The maintenance mode only changes how the LTM handles incoming requests.
l New users are not sent to the server while the servers is in maintenance mode. l In the Disabled mode, new connections with existing sessions are not affected. Users who open
a new TCP session but were previously using the server, will continue to be sent to this server. l Existing connections are not affected. Users with an open TCP session with the server will
continue to use it.
ADMINISTRATOR GUIDE: NETWORK PERFORMANCE MONITOR
page 105
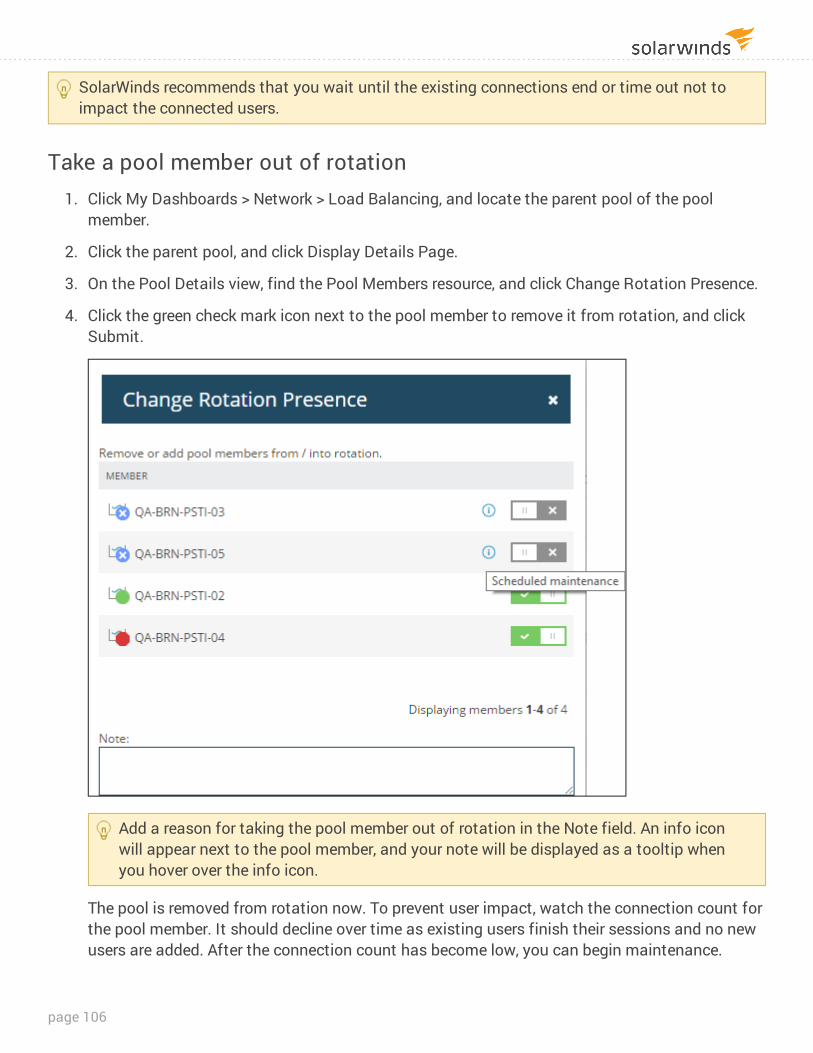
SolarWinds recommends that you wait until the existing connections end or time out not to impact the connected users.
Take a pool member out of rotation 1. Click My Dashboards > Network > Load Balancing, and locate the parent pool of the pool
member.
2. Click the parent pool, and click Display Details Page.
3. On the Pool Details view, find the Pool Members resource, and click Change Rotation Presence.
4. Click the green check mark icon next to the pool member to remove it from rotation, and click Submit.
Add a reason for taking the pool member out of rotation in the Note field. An info icon will appear next to the pool member, and your note will be displayed as a tooltip when you hover over the info icon.
The pool is removed from rotation now. To prevent user impact, watch the connection count for the pool member. It should decline over time as existing users finish their sessions and no new users are added. After the connection count has become low, you can begin maintenance.
page 106
Network Insight for Palo Alto - monitor Palo Alto firewalls with NPMNetwork Insight for Palo Alto firewalls automates the monitoring and management of your Palo Alto infrastructure to provide visibility and help ensure service availability.
For Palo Alto firewalls, you'll find the following subviews:
l Site-to-Site VPNs: Review names of tunnels, status, failure reason message, IN/OUT transferred data, encryption, hashing, virtual system, security zone, and local and peer IP addresses
l GlobalProtect VPNs: Review username, public IP, virtual IP, time of the connection, status, and transferred data
If you also have installed NCM 8.0 or NTA 4.6, review the feature overview to find out what additional details about Palo Alto firewalls you can gain.
RequirementsRequirement Detail
NPM 12.5
REST API access You need valid credentials to poll Palo Alto devices through REST API.
Log at Session End To poll Global Protect throughput data, Log Settings in the Action tab for Security Policy Rule must be configured to Log at Session End.
Palo Alto account permissions
To access the statistics, you need an account with the administrator role and the following permissions set for the XML API:
l Log l Operational Requests
How to monitor Palo Alto devicesTo access the Site-to-Site VPNs and Global Protect VPN subviews, add the device to NPM for monitoring or enable polling for Palo Alto data on devices already monitored in NPM.
To access the device, NPM calls the device and requests a REST API key, also known as "session key". NPM then accesses the device through the key, not through the credentials directly.
ADMINISTRATOR GUIDE: NETWORK PERFORMANCE MONITOR
page 107
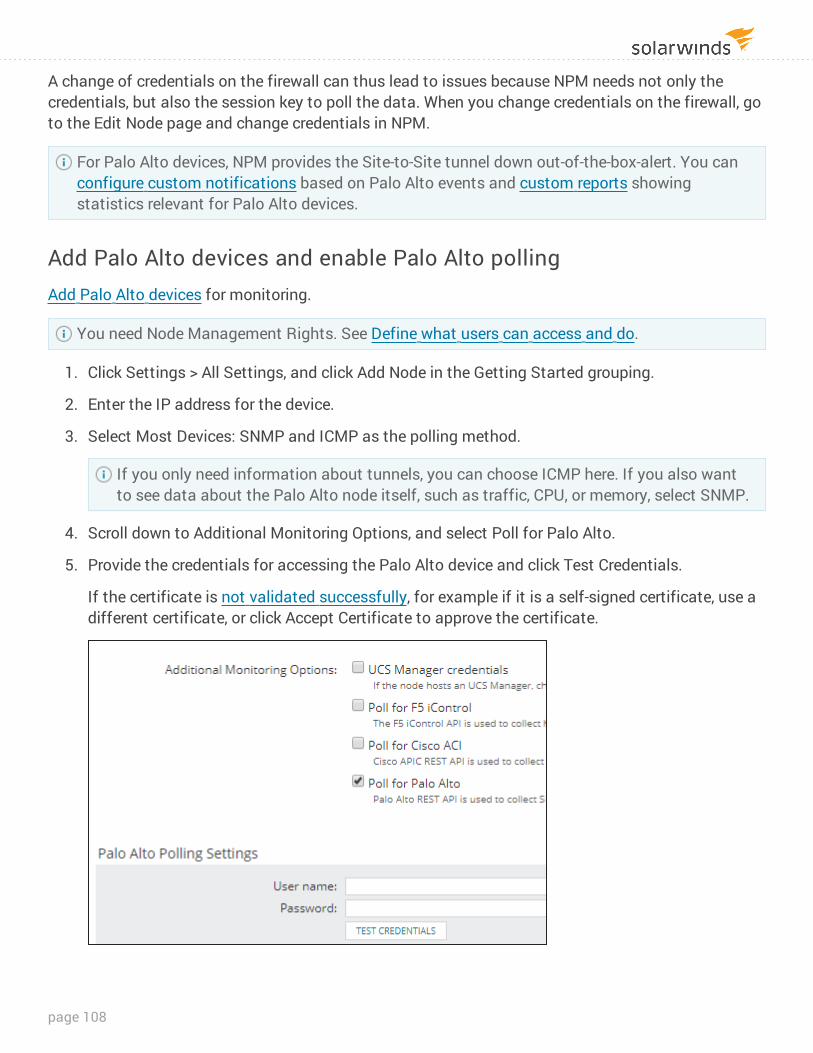
A change of credentials on the firewall can thus lead to issues because NPM needs not only the credentials, but also the session key to poll the data. When you change credentials on the firewall, go to the Edit Node page and change credentials in NPM.
For Palo Alto devices, NPM provides the Site-to-Site tunnel down out-of-the-box-alert. You can configure custom notifications based on Palo Alto events and custom reports showing statistics relevant for Palo Alto devices.
Add Palo Alto devices and enable Palo Alto pollingAdd Palo Alto devices for monitoring.
You need Node Management Rights. See Define what users can access and do.
1. Click Settings > All Settings, and click Add Node in the Getting Started grouping.
2. Enter the IP address for the device.
3. Select Most Devices: SNMP and ICMP as the polling method.
If you only need information about tunnels, you can choose ICMP here. If you also want to see data about the Palo Alto node itself, such as traffic, CPU, or memory, select SNMP.
4. Scroll down to Additional Monitoring Options, and select Poll for Palo Alto.
5. Provide the credentials for accessing the Palo Alto device and click Test Credentials.
If the certificate is not validated successfully, for example if it is a self-signed certificate, use a different certificate, or click Accept Certificate to approve the certificate.
page 108
6. Complete the Add Node wizard.
NPM now polls Palo Alto details, and you can access the Palo Alto subviews for the device. The polling frequency is the Default Node Statistics Poll Interval and is 10 minutes by default.
Enable polling for Palo Alto on a monitored node Palo Alto firewalls are polled using REST API to collect Site-to-Site and GlobalProtect VPN information.
1. Click Settings > Manage Nodes.
2. Select the node, and click Edit Properties.
3. Enable Palo Alto polling:
a. Scroll down to Additional Monitoring Options, and select Poll for Palo Alto.
b. Provide the credentials for accessing the Palo Alto device and click Test Credentials.
4. Click Submit.
NPM now polls Palo Alto details, and you can access the Palo Alto subviews for the device.
View Site-to-Site tunnels on a Palo Alto firewallBy default, NPM polls data every ten minutes using several different polls. At first, NPM polls a list of all entities, and then NPM polls additional data for each entity.
NPM polls static properties, and calculates bandwidth consumption based on the total amount of bytes coming through the firewall.
If connectivity issues happen during polling, partial details can be displayed.
The following table captures how statuses polled on Palo Alto devices are displayed in Orion:
Palo Alto status Orion status Value
Active Up 1
Inactive Down If the tunnel is down in NPM, it's inactive in Palo Alto.
2
Init Inactive 24
Other statuses Unknown 0
ADMINISTRATOR GUIDE: NETWORK PERFORMANCE MONITOR
page 109
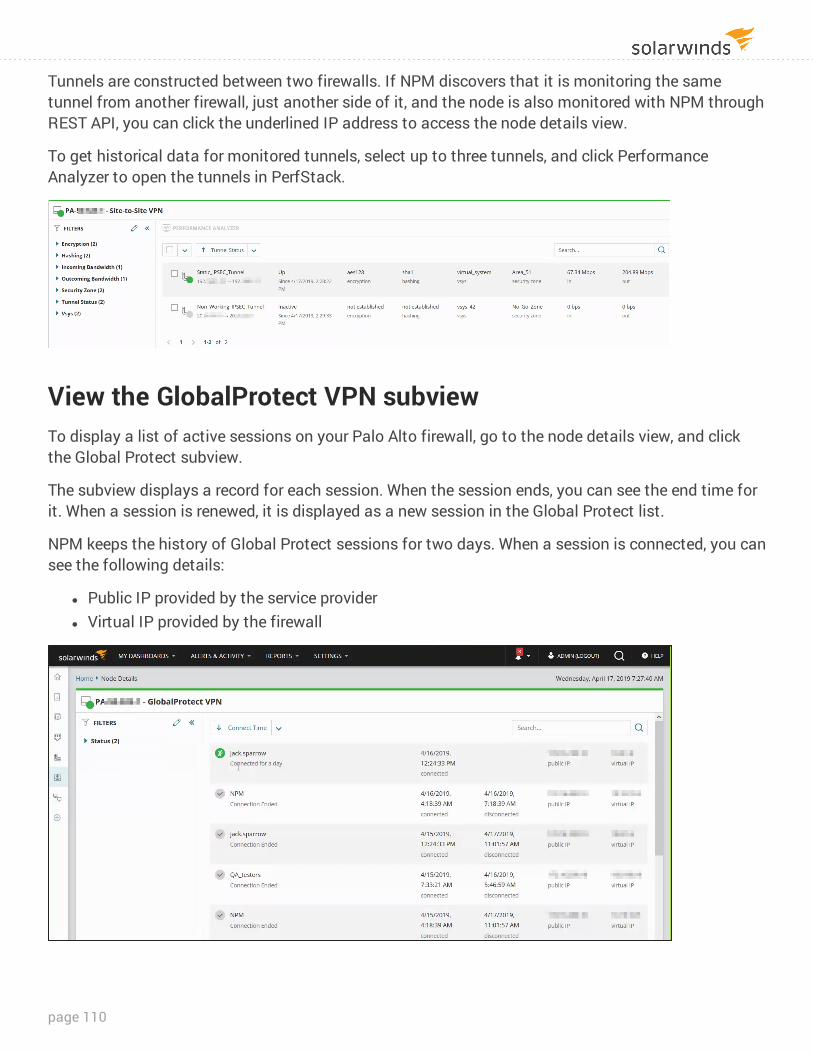
Tunnels are constructed between two firewalls. If NPM discovers that it is monitoring the same tunnel from another firewall, just another side of it, and the node is also monitored with NPM through REST API, you can click the underlined IP address to access the node details view.
To get historical data for monitored tunnels, select up to three tunnels, and click Performance Analyzer to open the tunnels in PerfStack.
View the GlobalProtect VPN subviewTo display a list of active sessions on your Palo Alto firewall, go to the node details view, and click the Global Protect subview.
The subview displays a record for each session. When the session ends, you can see the end time for it. When a session is renewed, it is displayed as a new session in the Global Protect list.
NPM keeps the history of Global Protect sessions for two days. When a session is connected, you can see the following details:
l Public IP provided by the service provider l Virtual IP provided by the firewall
page 110
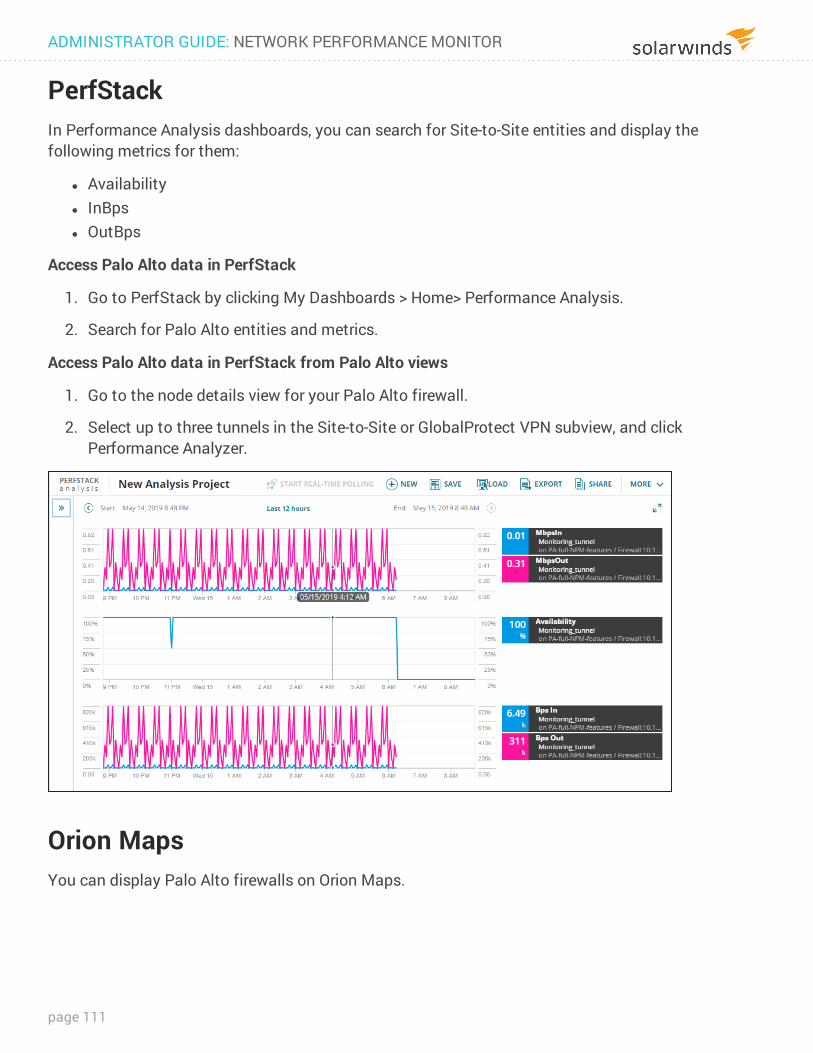
PerfStackIn Performance Analysis dashboards, you can search for Site-to-Site entities and display the following metrics for them:
l Availability l InBps l OutBps
Access Palo Alto data in PerfStack
1. Go to PerfStack by clicking My Dashboards > Home> Performance Analysis.
2. Search for Palo Alto entities and metrics.
Access Palo Alto data in PerfStack from Palo Alto views
1. Go to the node details view for your Palo Alto firewall.
2. Select up to three tunnels in the Site-to-Site or GlobalProtect VPN subview, and click Performance Analyzer.
Orion MapsYou can display Palo Alto firewalls on Orion Maps.
ADMINISTRATOR GUIDE: NETWORK PERFORMANCE MONITOR
page 111
TroubleshootingFailure reason is not accurate
When a Site-to-Site tunnel is down, you can see the reason. This information is polled from traffic logs, based on the last message indicating failure. Whereas this can help you understand your issue, there might be issues. These issues might be caused by the asynchronous nature of polling, NPM might get various information, not related to the current issue.
My Global Protect session is displayed as "ended" although it is active
When a session connecting remotely to the office fails, NPM informs you that it ended and records the end time. If you renew the session, it appears in the Global Protect VPNs subview as a new session.
page 112
Monitor wireless networks in NPMSolarWinds Network Performance Monitor can monitor any 802.11 IEEE-compliant autonomous access point (AP) or wireless controller, and provide details about access points (AP), wireless clients, wireless controllers, thin APs, and rogue APs.
SolarWinds NPM automatically recognizes your wireless APs and controllers as wireless devices when they are added to the SolarWinds Orion database. See Discover and add network devices.
The wireless interfaces are not found during discovery process. When a wireless device is added, an automatic inventory search is performed. Each wireless interface found is added to the database and the polling begins.
Migrate data from the Wireless Networks Module in NPMIf you have already used an earlier version of the Wireless Network module to poll your wireless devices, historical data will automatically be migrated to the new format.
l The wireless migration is performed in batches during scheduled database maintenance. l The migration will notify users when a node is migrated and when all nodes have been migrated
in the event log. l You will not see historical data immediately because this process is throttled.
View wireless data in NPMThe Wireless Summary view displays a list of all wireless access points (APs) and clients connected to each AP.
You can display the coverage of your wireless access points or the location of connected clients in a map. See Creating Wireless Heat Maps and Viewing the location of clients in wireless heat maps.
Access point details include the AP name, IP address, device type, SSID, channels used, and the number of clients currently connected.
Client details include client name, SSID, IP Address, MAC Address, Received Signal Strength Indication (RSSI), time connected, data rate, bytes received and bytes transmitted.
ADMINISTRATOR GUIDE: NETWORK PERFORMANCE MONITOR
page 113
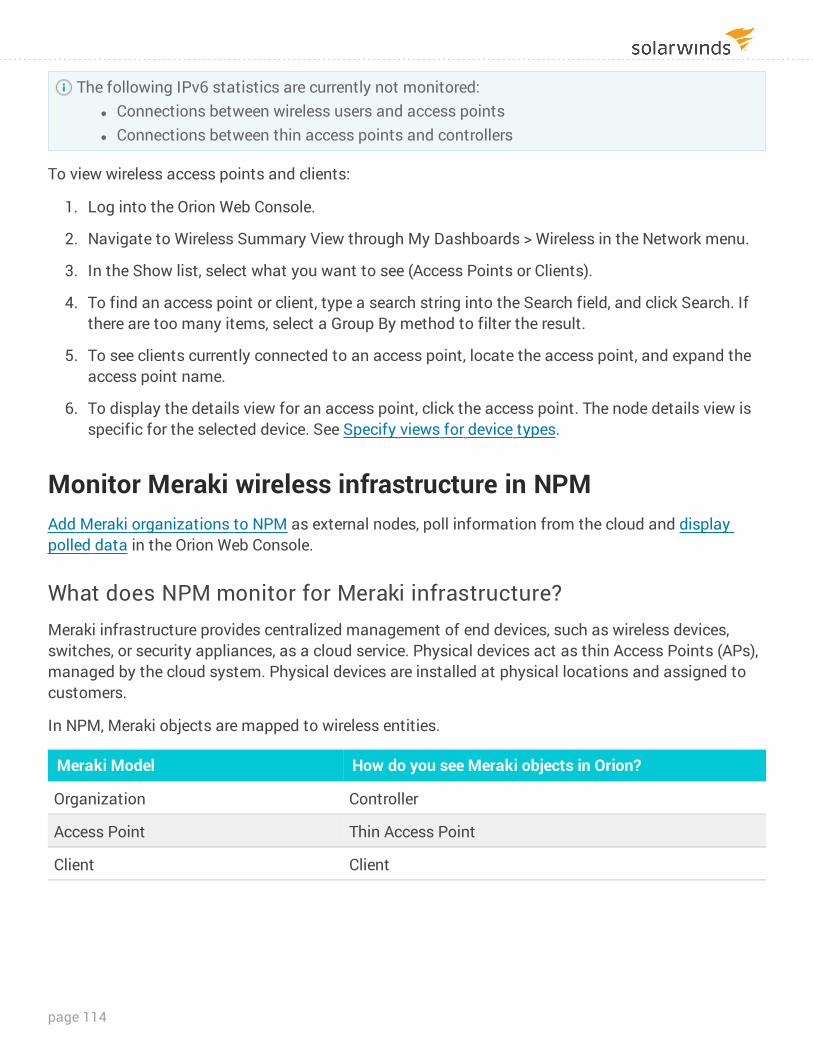
The following IPv6 statistics are currently not monitored: l Connections between wireless users and access points l Connections between thin access points and controllers
To view wireless access points and clients:
1. Log into the Orion Web Console.
2. Navigate to Wireless Summary View through My Dashboards > Wireless in the Network menu.
3. In the Show list, select what you want to see (Access Points or Clients).
4. To find an access point or client, type a search string into the Search field, and click Search. If there are too many items, select a Group By method to filter the result.
5. To see clients currently connected to an access point, locate the access point, and expand the access point name.
6. To display the details view for an access point, click the access point. The node details view is specific for the selected device. See Specify views for device types.
Monitor Meraki wireless infrastructure in NPMAdd Meraki organizations to NPM as external nodes, poll information from the cloud and display polled data in the Orion Web Console.
What does NPM monitor for Meraki infrastructure?Meraki infrastructure provides centralized management of end devices, such as wireless devices, switches, or security appliances, as a cloud service. Physical devices act as thin Access Points (APs), managed by the cloud system. Physical devices are installed at physical locations and assigned to customers.
In NPM, Meraki objects are mapped to wireless entities.
Meraki Model How do you see Meraki objects in Orion?
Organization Controller
Access Point Thin Access Point
Client Client
page 114
Unsupported metrics
l SSID information: NPM does not support displaying SSID information for Meraki devices. This field is empty in widgets and reports.
l Response time and packet loss: SolarWinds NPM does not poll response time and packet loss for Meraki infrastructure. Any metrics shown for response time and packet loss are polled from the cloud and not from the node. In the cloud, a load balancer selects the node used for the traffic, so the values might be polled on different nodes for each poll.
l Status of access points: Meraki access points are always displayed as Up because the REST API used to poll access points does not support polling the status.
Requirements l NPM 12.1 l Meraki account with administrative privileges l Enabled access to the Cisco Meraki Dashboard API and generated API key. For details, search
for "Cisco Meraki Dashboard API" at https://documentation.meraki.com (© 2015 Cisco Systems, Inc, available at https://documentation.meraki.com, obtained on February 1, 2017.)
Add Meraki organization to NPMTo monitor Meraki infrastructure with NPM, add the Meraki organization to the SolarWinds Orion database as an external node.
Each Meraki organization monitored with NPM uses a node license.
1. Log in to the Orion Web Console as an administrator.
2. Click Settings > Manage Nodes, and click Add a Node.
3. In Polling Method, select Meraki Wireless: API.
The Polling Hostname or IP Address is disabled and dashboard.meraki.com is used as the default host name for Meraki networks.
4. Provide the API Key you generated in the Cisco Meraki Dashboard.
ADMINISTRATOR GUIDE: NETWORK PERFORMANCE MONITOR
page 115
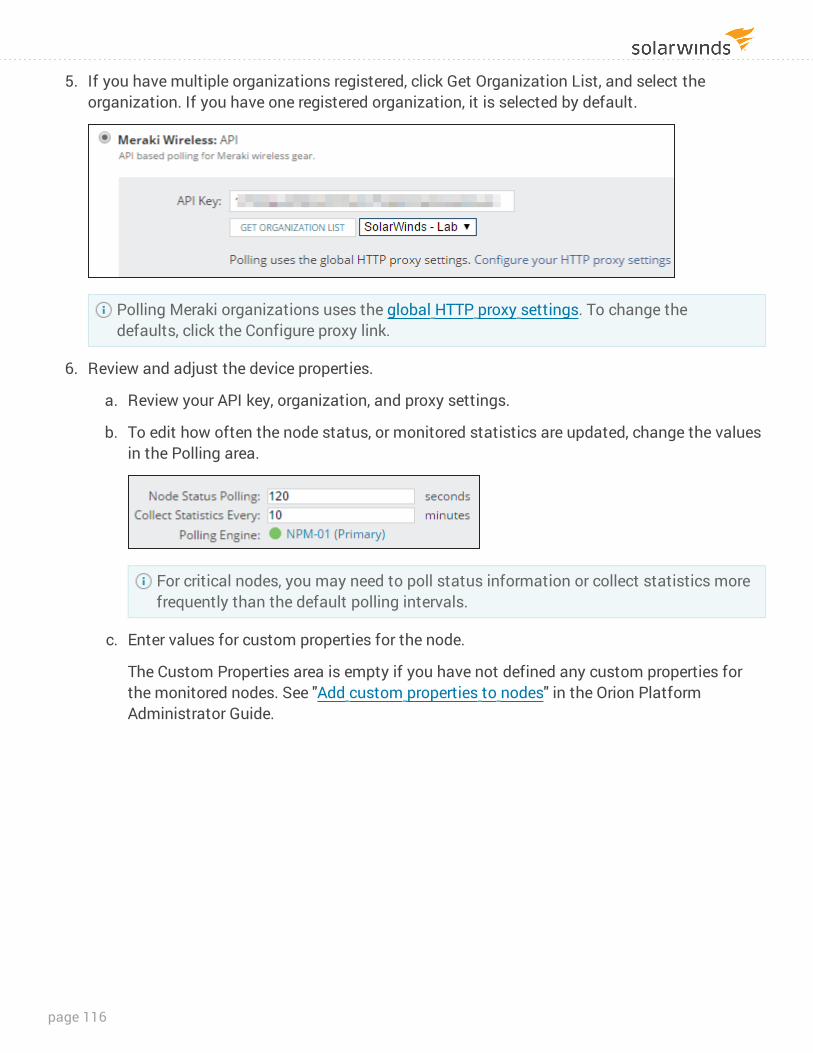
5. If you have multiple organizations registered, click Get Organization List, and select the organization. If you have one registered organization, it is selected by default.
Polling Meraki organizations uses the global HTTP proxy settings. To change the defaults, click the Configure proxy link.
6. Review and adjust the device properties.
a. Review your API key, organization, and proxy settings.
b. To edit how often the node status, or monitored statistics are updated, change the values in the Polling area.
For critical nodes, you may need to poll status information or collect statistics more frequently than the default polling intervals.
c. Enter values for custom properties for the node.
The Custom Properties area is empty if you have not defined any custom properties for the monitored nodes. See "Add custom properties to nodes" in the Orion Platform Administrator Guide.
page 116
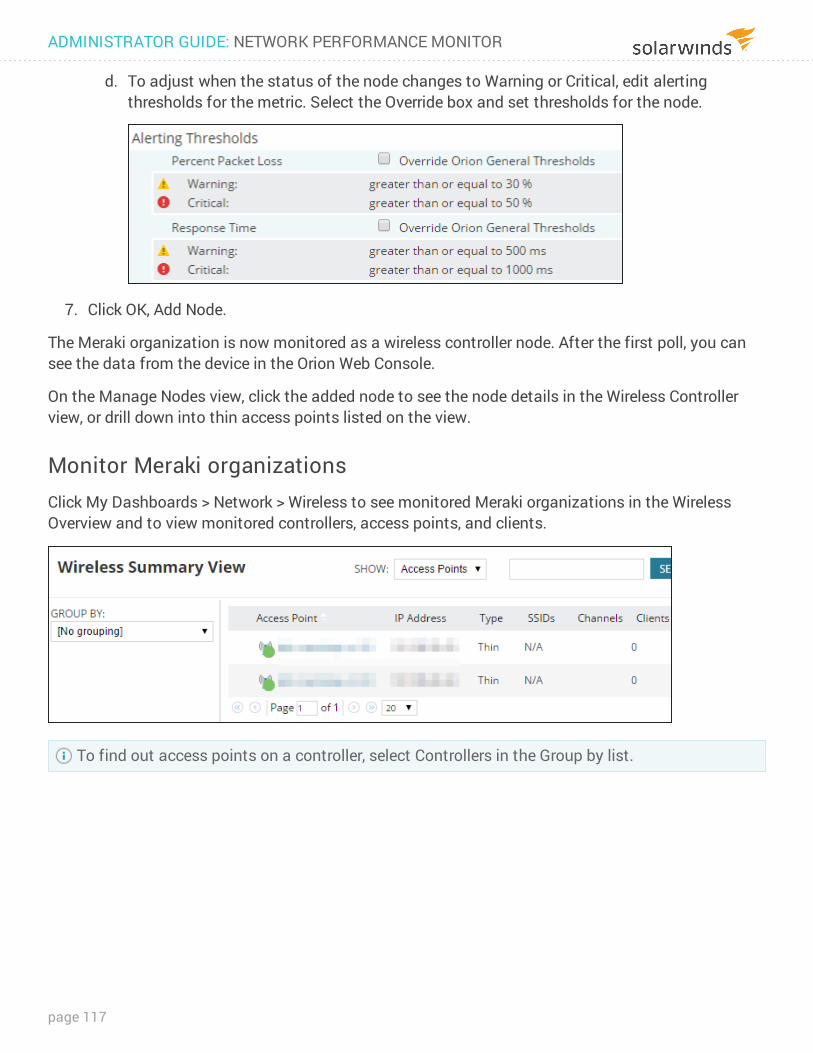
d. To adjust when the status of the node changes to Warning or Critical, edit alerting thresholds for the metric. Select the Override box and set thresholds for the node.
7. Click OK, Add Node.
The Meraki organization is now monitored as a wireless controller node. After the first poll, you can see the data from the device in the Orion Web Console.
On the Manage Nodes view, click the added node to see the node details in the Wireless Controller view, or drill down into thin access points listed on the view.
Monitor Meraki organizationsClick My Dashboards > Network > Wireless to see monitored Meraki organizations in the Wireless Overview and to view monitored controllers, access points, and clients.
To find out access points on a controller, select Controllers in the Group by list.
ADMINISTRATOR GUIDE: NETWORK PERFORMANCE MONITOR
page 117
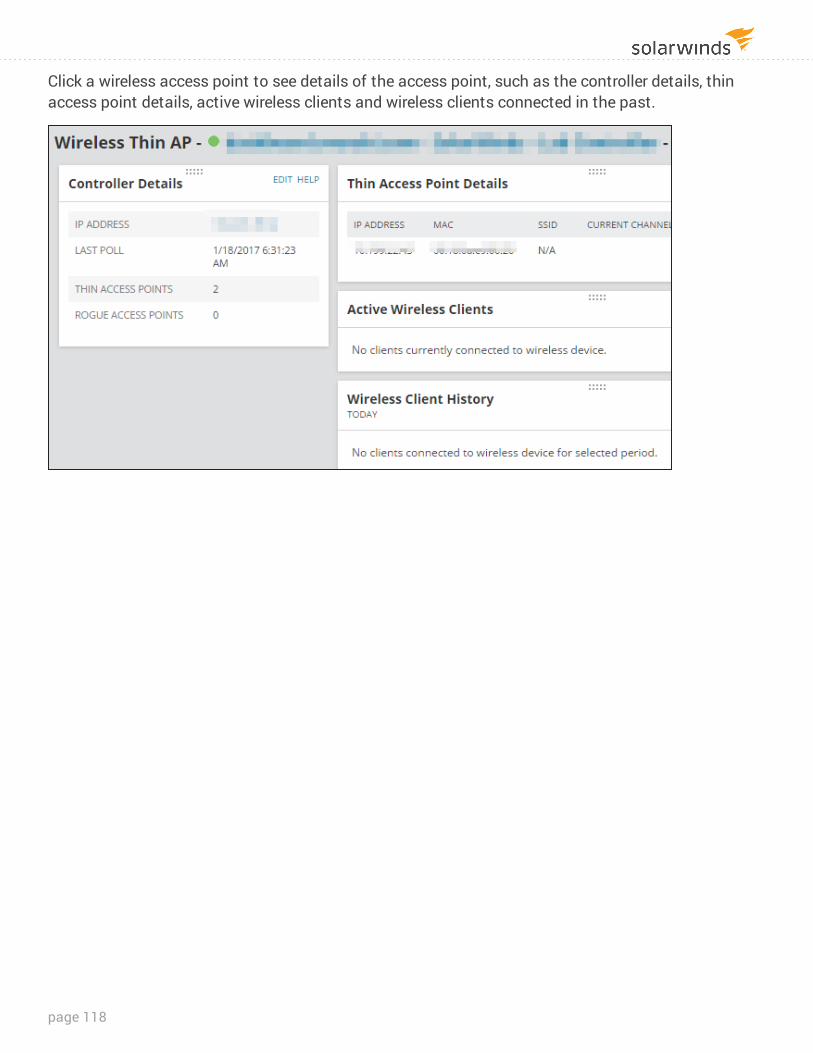
Click a wireless access point to see details of the access point, such as the controller details, thin access point details, active wireless clients and wireless clients connected in the past.
page 118
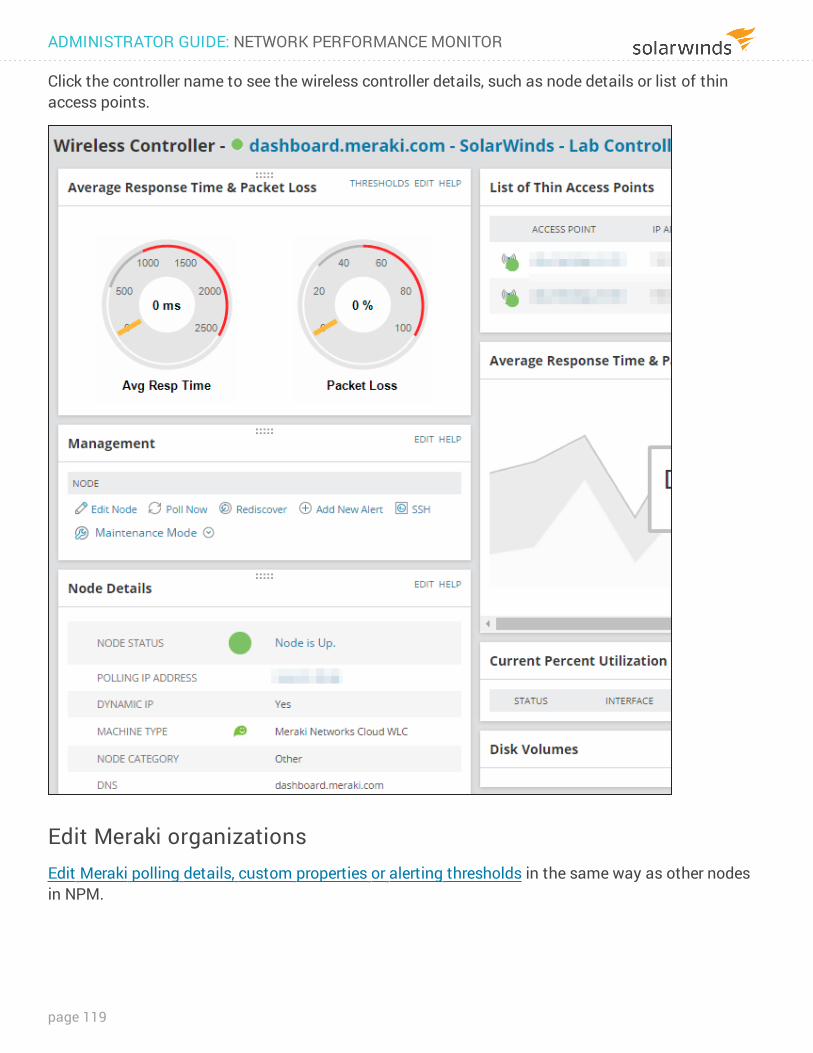
Click the controller name to see the wireless controller details, such as node details or list of thin access points.
Edit Meraki organizationsEdit Meraki polling details, custom properties or alerting thresholds in the same way as other nodes in NPM.
ADMINISTRATOR GUIDE: NETWORK PERFORMANCE MONITOR
page 119
When you add a Meraki organization to NPM, you can no longer change the polling method from the UI.
Create wireless heat maps for NPMWireless heat maps help you visualize wireless signal coverage on a building floor plan.
Wireless heat maps are only supported for Cisco wireless controllers. The wireless controllers you want to see on wireless heat maps must be managed in SolarWinds NPM.
Before you begin
l Obtain an image of the wireless coverage area, such as a floor plan. l Find at least one measurement of the distance between two points on the image, such as the
length of a conference room. l Choose the physical location of access points to accurately place them on the map.
To create wireless heat maps:
1. Start Network Atlas in your SolarWinds program folder. See Start the Network Atlas.
2. On the Welcome to Orion Network Atlas page, click Wireless Heat Map in the Create New section.
3. Enter a name for the new map.
4. Set a floor plan as the background for visualizing wireless coverage in NPM.
5. Set the wireless heat map scale in NPM.
6. Add wireless access points for NPM wireless heat maps.To display connected wireless clients on the heat map, you need to add at least four access points, or three access points and a signal sample.
7. Optional: Improve the accuracy of NPM wireless heat maps by taking samples of the signal strength on real devices.
8. Click Generate to display wireless signal coverage.
See also Display wireless heat maps for NPM in the Orion Web Console.
Disable the wireless heat map poller in NPMThe wireless heat map poller collects information about the signal strength on monitored access points. By default, this poller is disabled on your devices because of performance issues.
page 120
Network Atlas enables the wireless heat map poller on wireless controllers used in wireless maps because the information collected by the poller is required for including access points into wireless heat maps.
When do I need to disable the wireless heat map poller?
If you experience performance issues when working with wireless heat maps, disable the wireless heat map poller on the devices.
Disabling the poller resolves performance issues, but your wireless heat maps will no longer be updated. The Orion Web Console resources and the Network Atlas will both display the last status generated before you disabled the wireless heat map poller.
1. Log in to the Orion Web Console as an administrator.
2. Click Settings > All Settings in the menu bar.
3. In the Node & Group Management grouping, click Manage Pollers.
4. Locate the wireless heat map poller in the pollers table, and click the item in the Assignments column, such as 1 Node. Clicking the assignments link opens the Assign Wireless Heat Map to Nodes view.
5. Select all nodes for which you want to disable the poller, and then click Off: Disable Poller in the table title.
Clicking the grey Off icon for the nodes in the Poller Status column disables the poller for the nodes. The icon will turn to green On, and the poller will be disabled.
Set a floor plan as the background for visualizing wireless coverage in NPMThe floor plan should reflect the real dispositions of the office or buildings on the map, so that you can correctly position the wireless access points and reflect the wireless signal coverage on your map.
ADMINISTRATOR GUIDE: NETWORK PERFORMANCE MONITOR
page 121
Requirements:
The floor plan must be a graphic file in one of the following graphics formats:
l Graphics Interchange Format (.gif, non-animated) l Tagged Image File Format (.tiff) l Joint Photographic Experts Group (.jpg) l Microsoft Windows Bitmap (.bmp) l Portable Network Graphics (.png)
To ensure the readability of wireless heat maps, use black and white images.
To set a background for wireless heat maps:
1. Create the wireless heat map in the Network Atlas.
2. Click Background Image on the Home ribbon.
3. Navigate to the floor plan image, select the image, and click Open.
The floor plan will appear as the background for your heat map.
Set the wireless heat map scale in NPMThe correct scale is necessary for an accurate display of the wireless coverage provided by your wireless access point.
You can use online maps, such as the full version of Google Maps, to measure your office building. Locate the building on Google Maps, right-click one wall, and measure the distance to the other wall of the building.
Requirements
l You have already inserted a background image for your wireless heat map (a floor plan). l You know the distance of two objects displayed on the background image.
To minimize error, set the scale for the longest distance possible, such as the building or floor length.
To set the map scale:
1. Create the wireless heat map in the Network Atlas.
2. Click Set Scale in the Home ribbon. A blue line segment with squares as end points will appear in the plan.
page 122
3. Drag endpoints of the segment to the objects on the map whose distance you know.
4. Fill in the distance between the endpoints into the appropriate field, and select the units (feet or meters).
Example: In floor plans, you usually know the dimensions of individual rooms. Drag and drop the line segment endpoints so that the endpoints are located on the opposite walls, and fill in the width of the room.
5. Click Set Scale to apply the scale to the wireless heat map.
Add wireless access points for NPM wireless heat mapsTo generate a wireless heat map, add wireless access points used by client devices into the map.
Requirements
l The wireless LAN controllers must already be managed in your Orion Platform product. l Only Cisco controllers are supported. l The wireless heat map poller must be enabled on the wireless LAN controllers that you use in
the map. l To display connected wireless clients on a heat map, add at least four access points, or three
access points and a signal sample on the map.
To add wireless access points:
1. Create a wireless heat map in the Network Atlas.
2. Go to the navigation tree on the left of the Network Atlas main screen.
3. Locate the wireless access points that you want to add to the map.
To find access points on a node, navigate to Orion Objects > vendor name, such as Cisco > appropriate node > Wireless Access Points.
4. Drag the access points to their location on the map.
The selected access points will appear on the map. You can now generate the map.
To make the map more accurate, take signal samples.
ADMINISTRATOR GUIDE: NETWORK PERFORMANCE MONITOR
page 123
Improve the accuracy of NPM wireless heat maps by taking samples of the signal strength on real devicesWireless heat maps display the ideal wireless signal coverage, they do not count with physical obstacles, such as office walls. To make wireless heat maps more real, measure the signal strength on real devices, such as cell phones, laptops, or tablets connected to your wireless network. The measured values are stored as signal samples and used for calculating the signal coverage on wireless heat maps.
Signal samples represent the signal strength measured in a specified location.
Take signal samples in places where you expect the signal to be blocked by walls or other obstacles, or in places where the signal strength does not correspond with your heat map.
Take signal samples with cell phones, because polling the signal is usually faster for them.
Simple signal samples
Take a wireless device, walk it to a certain location, and take a signal sample there. Then, walk the device to another location, and take another signal sample. This procedure is called "walking edition" because it requires you to walk through the office.
Multiple signal samples
If you have multiple devices connected to your wireless access points, take multiple signal samples at once (called "sitting edition" because you can do it sitting at your desk).
Signal samples stay in the map and influence the calculation of wireless heat maps even after the client moves from its position. When you move access points in a map, the signal samples might not be accurate any more. Delete obsolete signal samples, and add new ones.
Requirements
l You need to have a wireless heat map created and open in the Network Atlas. l You need to have wireless access points added into the map. l You need to have clients, such as cellular phones, tablets, laptops, connected to the access
points positioned in your wireless heat maps.
Take simple signal samples
1. Click Take Signal Sample in the Home ribbon. The Signal Sample wizard will display on the right side of the Network Atlas screen as a tab.
page 124
2. Walk your device to the location where you want to measure the wireless signal strength and click Next.
3. Select the wireless client (cellular phone, laptop, or tablet) in the drop-down list, and click Next.
4. Drag the client into its current location on the map, and click Next. Network Atlas will start measuring the wireless signal strength in the spot. It can take a few minutes, depending on the device.
5. To add another signal sample, click Repeat, walk the device to a new location, and repeat steps 3 - 4.
6. To apply the measured signal strength to the heat map, click Generate Map.
7. Network Atlas will regenerate the map. Click Close to hide the Signal Sample wizard tab.
Take multiple signal samples at the same time
1. Click Take Signal Sample in the Home ribbon. The Signal Sample wizard will display on the right side of the Network Atlas screen as a tab.
2. Click Use Multiple Devices to Take Signal Samples.
3. Drag the clients to their positions on the wireless heat map, and click Next.
l If there are too many devices, use the search box to find the devices you want to use for creating signal samples.
l Measuring the wireless signal strength can take a few minutes. l If the signal measuring fails, you can either repeat the measurement for the device,
or restart the wizard.
4. Network Atlas will automatically regenerate the map according to the defined signal samples. Click Close to hide the Signal Sample wizard tab.
Troubleshoot NPM wireless heat maps If your wireless signal coverage on your wireless heat maps is not as expected, you can take the following troubleshooting measures.
l Make sure that the map scale you have entered is precise. l Make sure that your access points are located correctly. l Verify that signal samples are up-to-date. l The signal samples stay in the map even after the device you measured the signal strength on
moves away. If you change the position of your access points, or the dispositions of your office, the signal samples might not be accurate and could affect the calculated wireless heat map.
ADMINISTRATOR GUIDE: NETWORK PERFORMANCE MONITOR
page 125
l Delete obsolete signal samples.
To delete a signal sample, open the wireless heat map in the Network Atlas, select the signal sample, and press the Delete key.
l Add new signal samples. See Improve the accuracy of NPM wireless heat maps by taking samples of the signal strength on real devices.
Display wireless heat maps for NPM in the Orion Web Console
1. Create the wireless heat map in the Network Atlas.
2. Log in to the Orion Web Console.
3. To open a wireless heat map, use one of the following options:
l Go to the All Wireless Heat Maps resource, and click the thumbnail for the map. The map will open in the Wireless Heat Map view that includes all resources specific for wireless heat maps.
By default, the All Wireless Heat Maps resource is available on the NPM Summary view.
l Add the Map resource on the view, click Edit, select the map in the list, and click Submit.
Change the time and frequency for regenerating the mapBy default, the wireless heat map is regenerated once a day, and the information about clients connected to wireless access points is collected every 5 minutes.
1. Click Settings > All Settings.
2. In the Thresholds & Polling grouping, click Polling Settings.
3. Scroll down to the Wireless Heat Map.
4. Adjust the time when wireless heat maps should be regenerated in Map Generation Start Time.
5. Specify how often the information about clients connected to wireless access points should be collected in Default Client Signal Strength Poll Interval.
6. Click Submit.
page 126
Monitor EnergyWise devices in NPMEnergyWise is a Cisco technology developed to help you cut enterprise energy costs, address environmental concerns, and adhere to government directives around green technologies. By enabling the energy-saving features of EnergyWise-capable devices, you can run business-critical systems in a fully powered state while allowing less critical devices on Power over Ethernet (PoE) ports to power down or drop into standby during off-peak hours.
In the Orion Web Console, you can consult the EnergyWise Summary view and related widgets to help you monitor the energy expended on your network and the energy savings provided by EnergyWise-enabled devices.
l Fully upgrade the IOS of all EnergyWise-enabled devices on your network. For more information, consult your device documentation or www.cisco.com.
l If the EnergyWise Summary view does not display in the Orion Web Console menu bar, see Add the EnergyWise Summary View to the Orion Web Console menu bar in NPM.
Add the EnergyWise Summary View to the Orion Web Console menu bar in NPM
1. Log in to the Orion Web Console as an administrator.
2. Click My Dashboards > Configure.
3. Click Edit beneath the menu bar to which you want to add the EnergyWise Summary view.
4. Drag the EnergyWise button from the Available items list on the left to the correct location in the Selected items list on the right.
Selected items display from left to right in the selected menu bar as they are listed from top to bottom.
5. Click Submit.
Temporarily reset the current power level of a monitored EnergyWise interface in NPM
Any change made to the power level of a monitored EnergyWise entity is only effective until the next scheduled application of a defined recurrence policy.
ADMINISTRATOR GUIDE: NETWORK PERFORMANCE MONITOR
page 127
To remotely reset the current power level of an interface, the parent node must have not only Community String, but also Read/Write Community String set correctly. See Edit polling settings.
Policies are configured either manually on the monitored device itself or with a configuration management utility, such as SolarWinds NCM. See www.solarwinds.com.
Some Cisco IOS versions report EnergyWise levels as values 1-11 instead of 0-10. In SolarWinds NPM 10.1.2 and later versions, the levels are automatically corrected. IOS's on some devices are not affected by this issue.
1. Log in to the Orion Web Console as an administrator.
2. Click Settings > Manage Nodes.
3. Locate the device to edit:
l Use the search tool above the node list to search your database for the parent node of the EnergyWise interface entity you want to reset.
l Select a Group By option, and click the group including the parent node of the EnergyWise interface entity you want to reset.
4. Expand the parent node, and select the interface entity.
5. Click More Actions > Override Power Level.
6. Select a power level, and click OK.
To reset the current power level, you can also go to the Interface Details view, and click Set Power Level in the EnergyWise Interface Details resource.
page 128
Monitor Azure V-Nets, V-Net Gateways and Site-to-Site Connections with NPMStarting with NPM 2020.2, you can monitor traffic on Azure Network Gateways and Site-to-Site Connections on monitored Microsoft Azure cloud accounts.
l Add an Azure cloud account l Display an overview of monitored cloud environment l Monitor Virtual Network Gateways l Monitor Site-to-Site Connections l Configure Azure settings relevant for NPM
Before you begin
l Ensure that you have configured your Microsoft Azure cloud account to allow integration with the Orion Platform.
l Prepare credentials necessary for configuring the Orion Platform to access your Azure cloud.
l To monitor the Azure cloud, you must use the mail polling engine.For more details, see Monitor cloud instances and VMs in the Orion Platform documentation.
Add an Azure cloud account for monitoringUse the Add Cloud Account to add an Azure account to NPM for monitoring. The wizard displays steps relevant for installed Orion Platform products. See Add the first cloud account for details.
1. In the Orion Web Console, click My Dashboards > Home > Cloud.
2. On the Getting Started widget, click Monitor My Cloud instances and complete the wizard.
ADMINISTRATOR GUIDE: NETWORK PERFORMANCE MONITOR
page 129
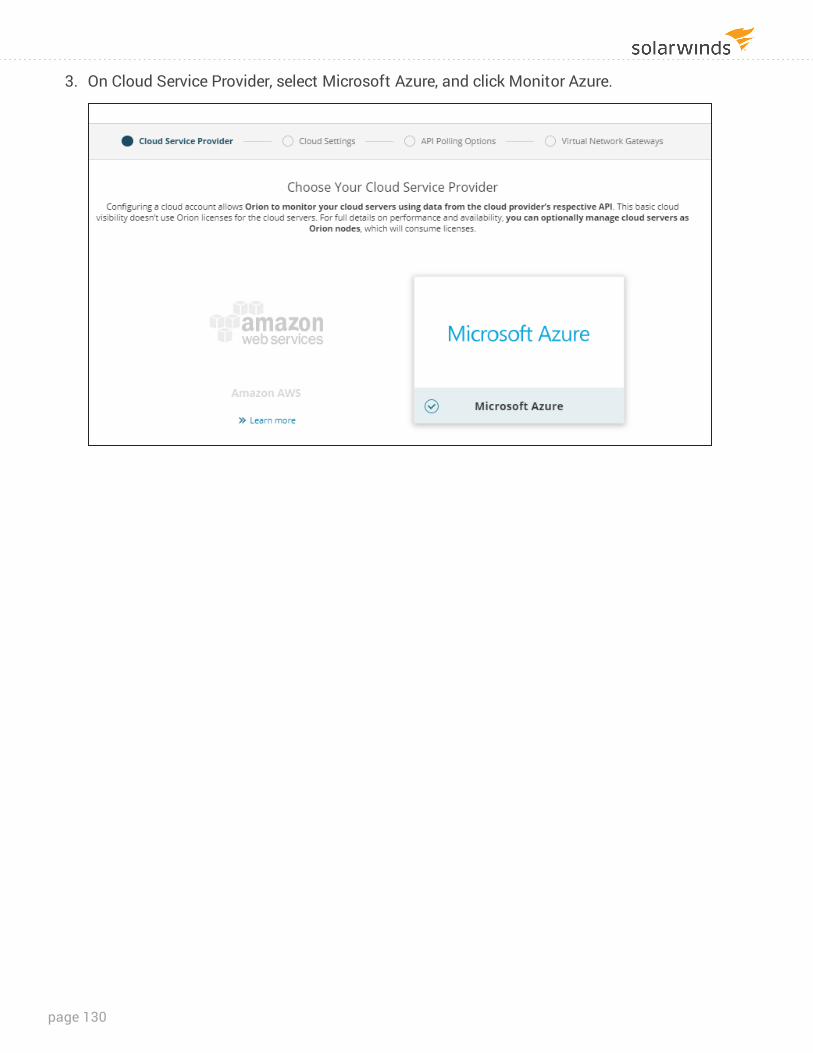
3. On Cloud Service Provider, select Microsoft Azure, and click Monitor Azure.
page 130
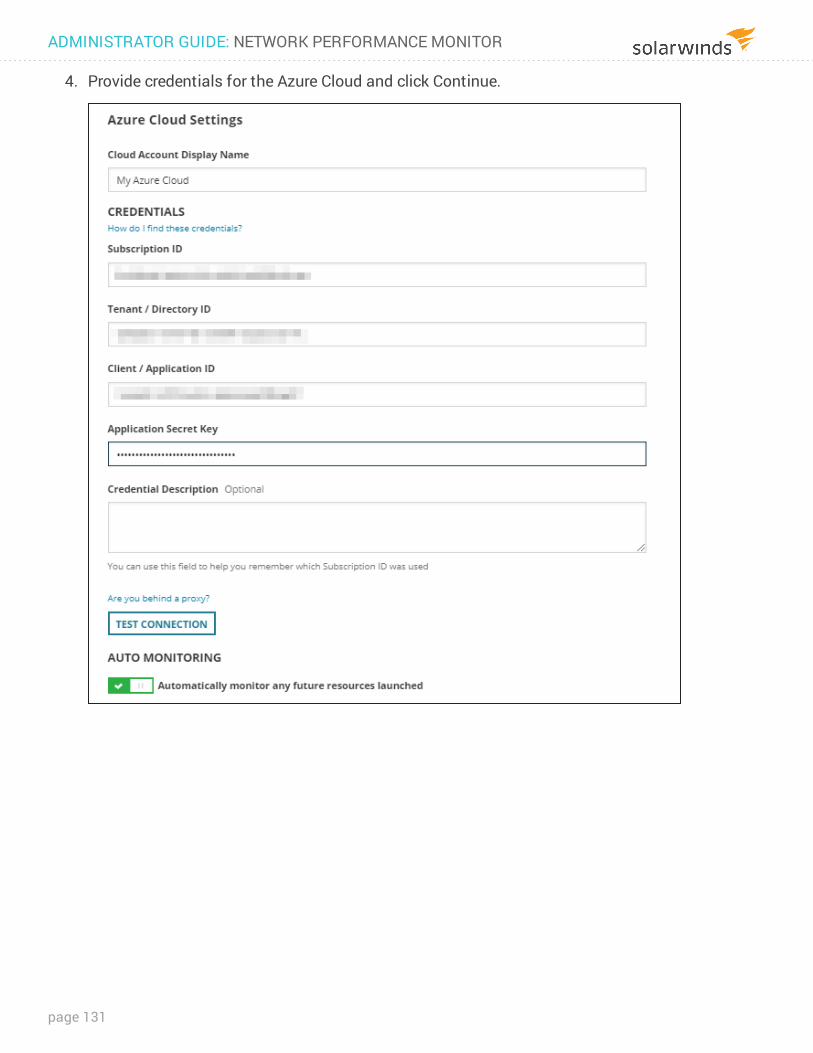
4. Provide credentials for the Azure Cloud and click Continue.
ADMINISTRATOR GUIDE: NETWORK PERFORMANCE MONITOR
page 131
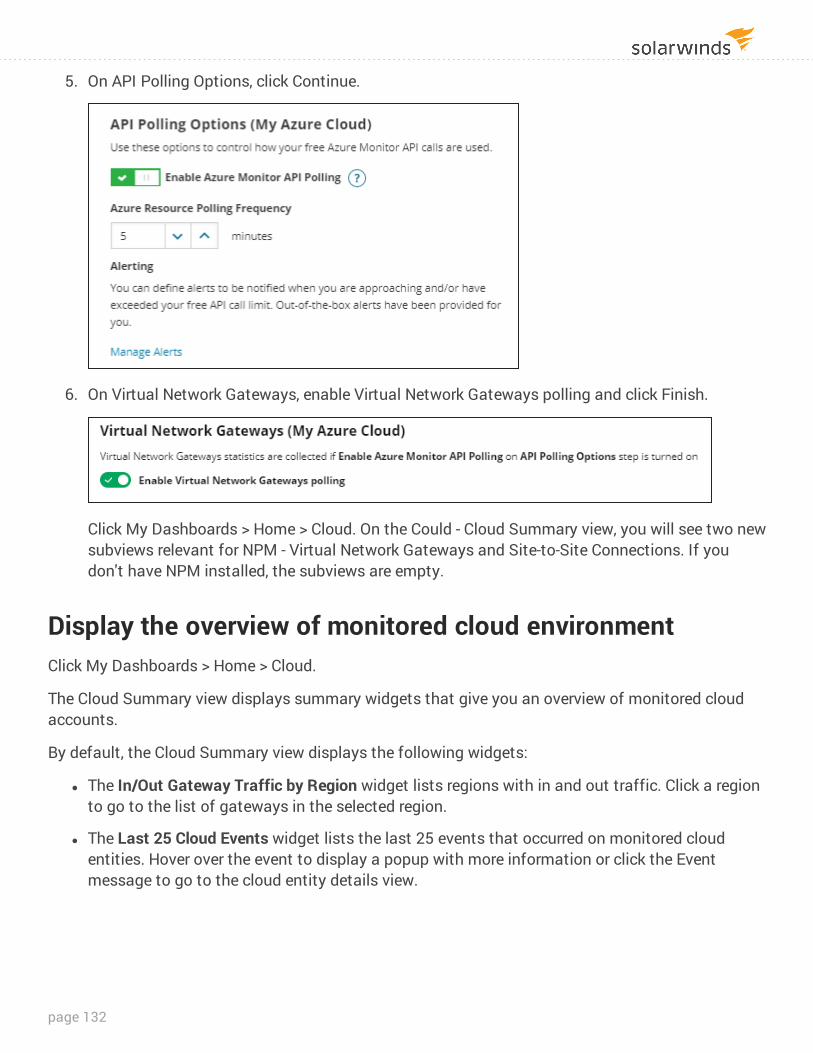
5. On API Polling Options, click Continue.
6. On Virtual Network Gateways, enable Virtual Network Gateways polling and click Finish.
Click My Dashboards > Home > Cloud. On the Could - Cloud Summary view, you will see two new subviews relevant for NPM - Virtual Network Gateways and Site-to-Site Connections. If you don't have NPM installed, the subviews are empty.
Display the overview of monitored cloud environmentClick My Dashboards > Home > Cloud.
The Cloud Summary view displays summary widgets that give you an overview of monitored cloud accounts.
By default, the Cloud Summary view displays the following widgets:
l The In/Out Gateway Traffic by Region widget lists regions with in and out traffic. Click a region to go to the list of gateways in the selected region.
l The Last 25 Cloud Events widget lists the last 25 events that occurred on monitored cloud entities. Hover over the event to display a popup with more information or click the Event message to go to the cloud entity details view.
page 132
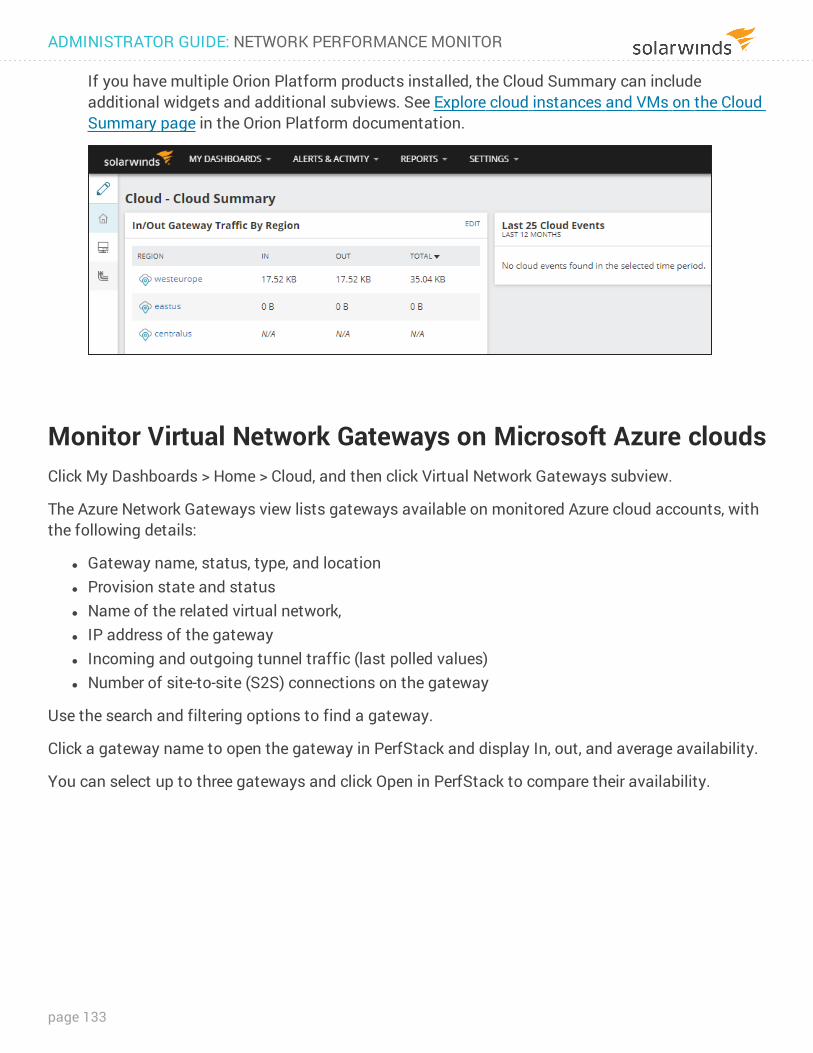
If you have multiple Orion Platform products installed, the Cloud Summary can include additional widgets and additional subviews. See Explore cloud instances and VMs on the Cloud Summary page in the Orion Platform documentation.
Monitor Virtual Network Gateways on Microsoft Azure cloudsClick My Dashboards > Home > Cloud, and then click Virtual Network Gateways subview.
The Azure Network Gateways view lists gateways available on monitored Azure cloud accounts, with the following details:
l Gateway name, status, type, and location l Provision state and status l Name of the related virtual network, l IP address of the gateway l Incoming and outgoing tunnel traffic (last polled values) l Number of site-to-site (S2S) connections on the gateway
Use the search and filtering options to find a gateway.
Click a gateway name to open the gateway in PerfStack and display In, out, and average availability.
You can select up to three gateways and click Open in PerfStack to compare their availability.
ADMINISTRATOR GUIDE: NETWORK PERFORMANCE MONITOR
page 133
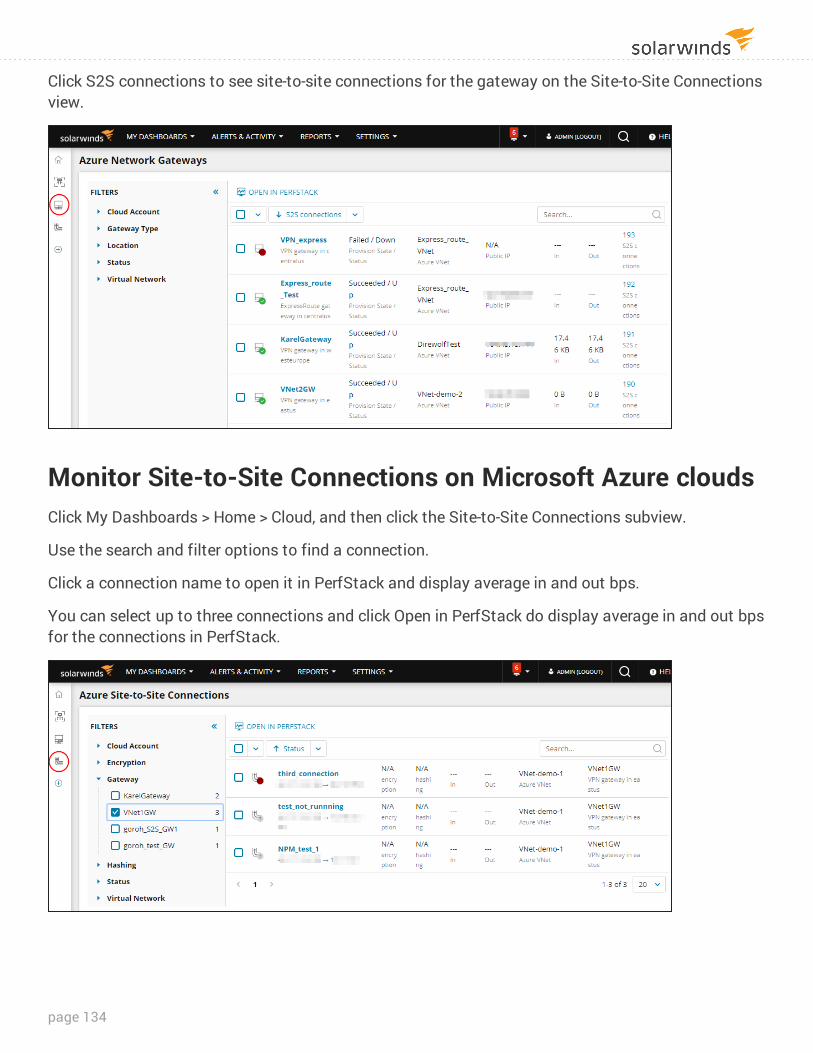
Click S2S connections to see site-to-site connections for the gateway on the Site-to-Site Connections view.
Monitor Site-to-Site Connections on Microsoft Azure cloudsClick My Dashboards > Home > Cloud, and then click the Site-to-Site Connections subview.
Use the search and filter options to find a connection.
Click a connection name to open it in PerfStack and display average in and out bps.
You can select up to three connections and click Open in PerfStack do display average in and out bps for the connections in PerfStack.
page 134
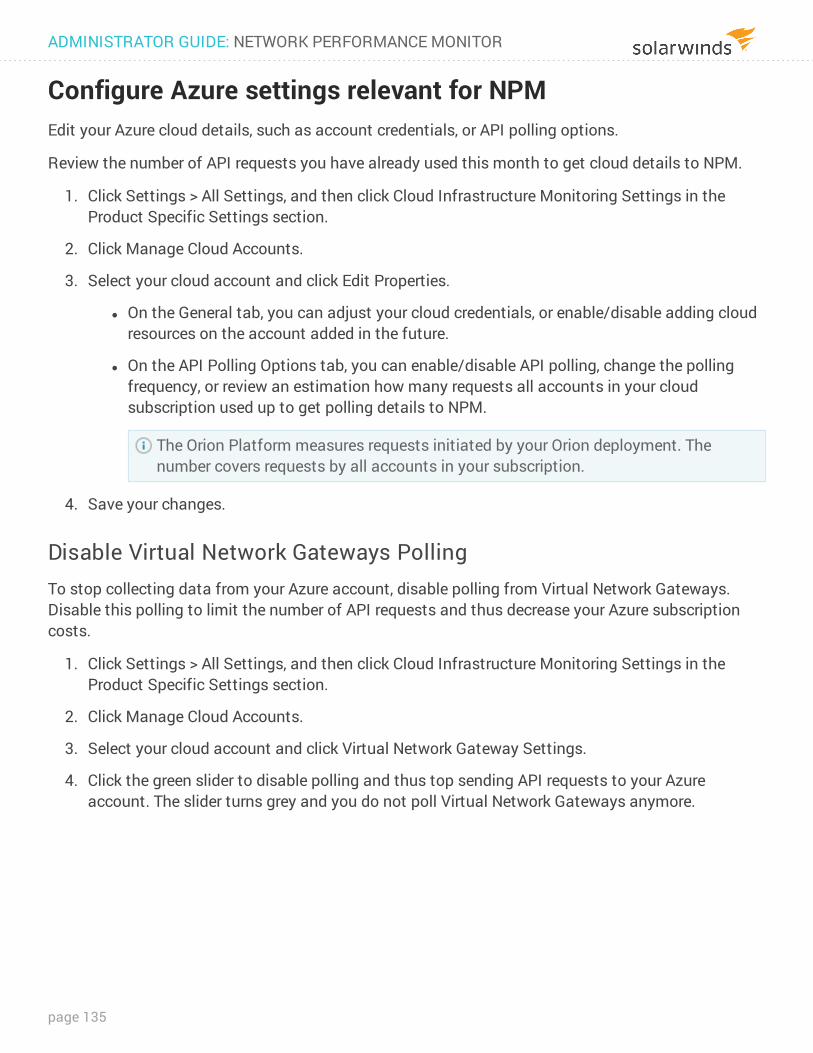
Configure Azure settings relevant for NPMEdit your Azure cloud details, such as account credentials, or API polling options.
Review the number of API requests you have already used this month to get cloud details to NPM.
1. Click Settings > All Settings, and then click Cloud Infrastructure Monitoring Settings in the Product Specific Settings section.
2. Click Manage Cloud Accounts.
3. Select your cloud account and click Edit Properties.
l On the General tab, you can adjust your cloud credentials, or enable/disable adding cloud resources on the account added in the future.
l On the API Polling Options tab, you can enable/disable API polling, change the polling frequency, or review an estimation how many requests all accounts in your cloud subscription used up to get polling details to NPM.
The Orion Platform measures requests initiated by your Orion deployment. The number covers requests by all accounts in your subscription.
4. Save your changes.
Disable Virtual Network Gateways PollingTo stop collecting data from your Azure account, disable polling from Virtual Network Gateways. Disable this polling to limit the number of API requests and thus decrease your Azure subscription costs.
1. Click Settings > All Settings, and then click Cloud Infrastructure Monitoring Settings in the Product Specific Settings section.
2. Click Manage Cloud Accounts.
3. Select your cloud account and click Virtual Network Gateway Settings.
4. Click the green slider to disable polling and thus top sending API requests to your Azure account. The slider turns grey and you do not poll Virtual Network Gateways anymore.
ADMINISTRATOR GUIDE: NETWORK PERFORMANCE MONITOR
page 135
Set SolarWinds NPM thresholdsSolarWinds NPM thresholds are relevant for nodes and interfaces. They include Cisco Buffer Misses, Interface Errors and Discards, Interface Percent Utilization, and Flapping Routes.
l When a metric reaches the specified Critical Level threshold on a node or interface, the node or interface will be displayed as bold red in resources and reports.
l When a metric reaches the specified Warning Level thresholds on a node, the node or interface will be highlighted in red in appropriate resources and reports.
l Flapping Routes use different colors when the thresholds are exceeded: red for the error threshold and yellow for the warning threshold.
1. Log in to the Orion Web Console using an account with Administrator Rights.
2. Click Settings > All Settings in the menu bar.
3. In the Thresholds & Polling grouping, click NPM Thresholds.
4. Provide the values for Critical Level and Warning Level for the selected metrics.
5. For the Interface Percent Utilization metric, specify if you want to use average or peak daily values in calculations for capacity forecasting.
6. Click Submit.
Monitored thresholds are changed on a global level for NPM.
See also Define UnDP Warning and Critical thresholds in NPM.
page 136
Create custom monitors in NPMWith SolarWinds NPM, you can extend monitoring to non-standard devices, using object identifiers (OIDs) organized in management information bases (MIBs).
SolarWinds NPM provides the following advanced monitoring options:
l Device Studio pollers: Create pollers for certain technologies directly in the Orion Web Console.
What is a poller?
Statistics monitored on your devices are specified by pollers. Pollers hold information about a monitored property, how to get the current value for the property, and where and how to display the retrieved data.
What do you need custom pollers for?
o To monitor a specific metric which is not monitored out-of-the box. o To monitor special equipment. o To monitor objects although the number of monitored objects exceeds a poller's
capacity limitation.
l Universal Device Pollers: If there is a specific metric that is not monitored out-of-the box, or if you have special equipment you need to monitor, create a custom poller based on a specific object identifier (OID) and transform polled results into a resource in the Orion Web Console.
Review the comparison of UnDP and Device Studio pollers to determine which poller to use.
undp device studio poller
Can poll only one OID. Can poll multiple OIDs for a given technology.
Cannot perform logical operations or transformations on the polled data.
Can perform logical operations or transformations on the polled data.
Polled vallues are displayed in dedicated resources.
Polled values are displayed in existing resources.
ADMINISTRATOR GUIDE: NETWORK PERFORMANCE MONITOR
page 137
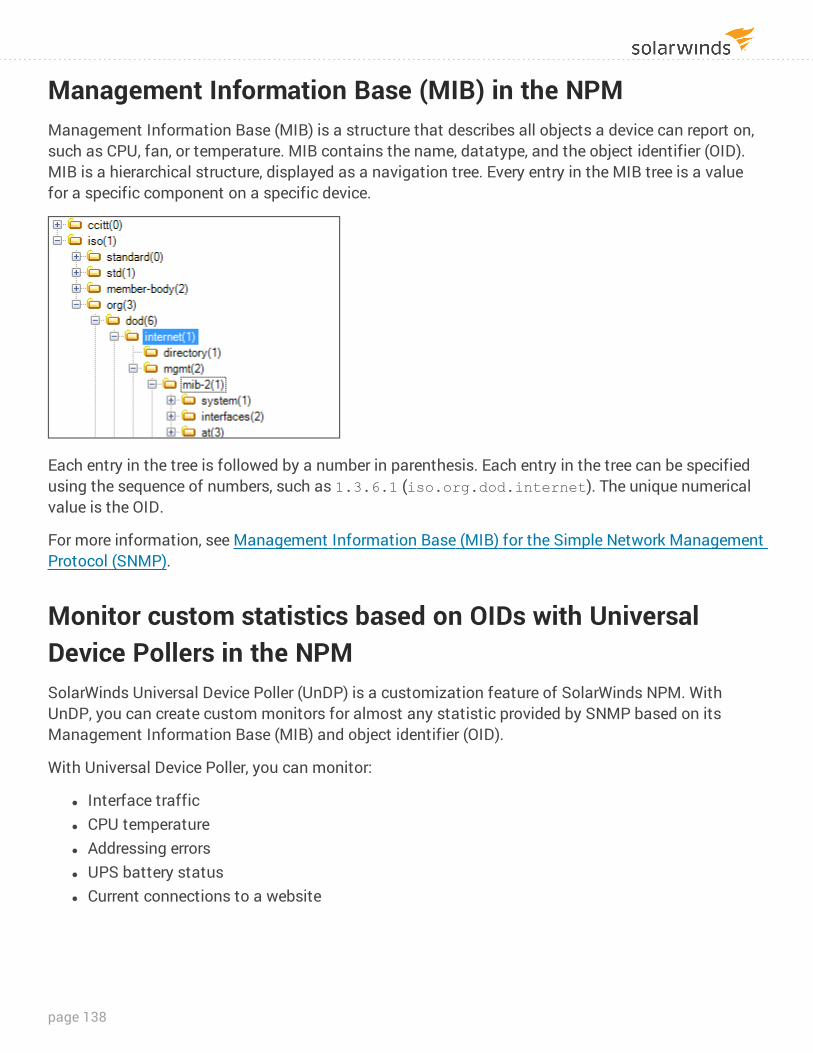
Management Information Base (MIB) in the NPMManagement Information Base (MIB) is a structure that describes all objects a device can report on, such as CPU, fan, or temperature. MIB contains the name, datatype, and the object identifier (OID). MIB is a hierarchical structure, displayed as a navigation tree. Every entry in the MIB tree is a value for a specific component on a specific device.
Each entry in the tree is followed by a number in parenthesis. Each entry in the tree can be specified using the sequence of numbers, such as 1.3.6.1 (iso.org.dod.internet). The unique numerical value is the OID.
For more information, see Management Information Base (MIB) for the Simple Network Management Protocol (SNMP).
Monitor custom statistics based on OIDs with Universal Device Pollers in the NPMSolarWinds Universal Device Poller (UnDP) is a customization feature of SolarWinds NPM. With UnDP, you can create custom monitors for almost any statistic provided by SNMP based on its Management Information Base (MIB) and object identifier (OID).
With Universal Device Poller, you can monitor:
l Interface traffic l CPU temperature l Addressing errors l UPS battery status l Current connections to a website
page 138
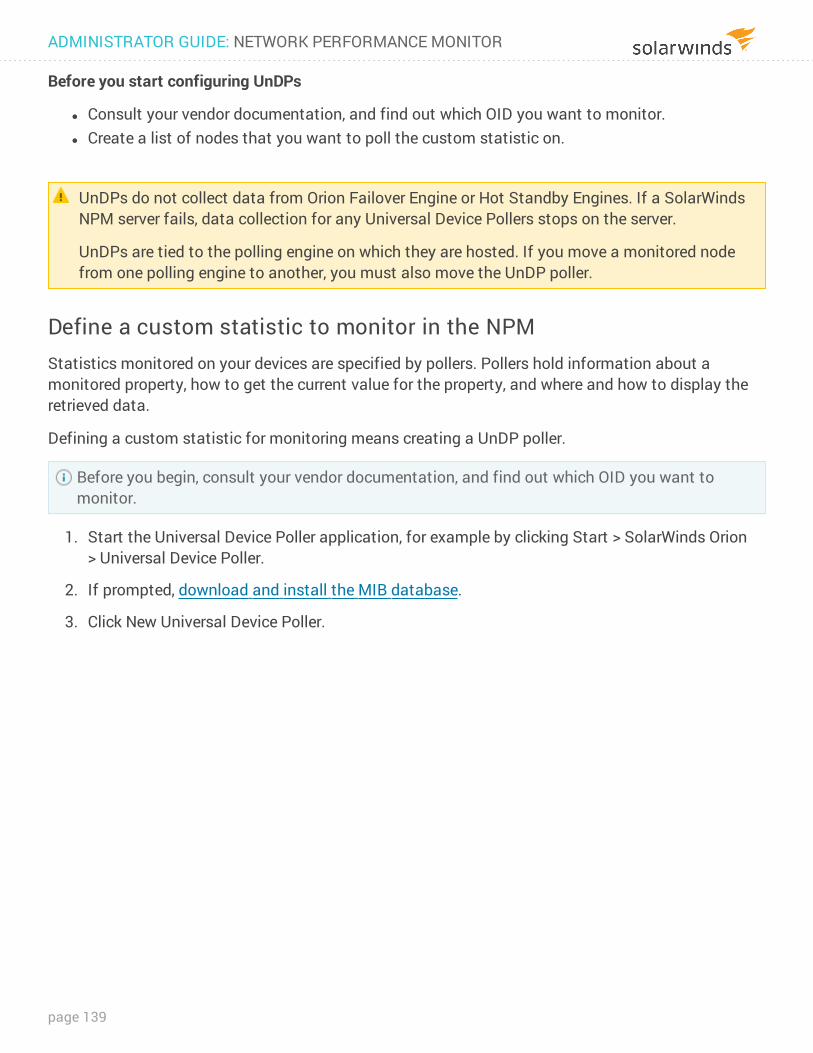
Before you start configuring UnDPs
l Consult your vendor documentation, and find out which OID you want to monitor. l Create a list of nodes that you want to poll the custom statistic on.
UnDPs do not collect data from Orion Failover Engine or Hot Standby Engines. If a SolarWinds NPM server fails, data collection for any Universal Device Pollers stops on the server.
UnDPs are tied to the polling engine on which they are hosted. If you move a monitored node from one polling engine to another, you must also move the UnDP poller.
Define a custom statistic to monitor in the NPMStatistics monitored on your devices are specified by pollers. Pollers hold information about a monitored property, how to get the current value for the property, and where and how to display the retrieved data.
Defining a custom statistic for monitoring means creating a UnDP poller.
Before you begin, consult your vendor documentation, and find out which OID you want to monitor.
1. Start the Universal Device Poller application, for example by clicking Start > SolarWinds Orion > Universal Device Poller.
2. If prompted, download and install the MIB database.
3. Click New Universal Device Poller.
ADMINISTRATOR GUIDE: NETWORK PERFORMANCE MONITOR
page 139
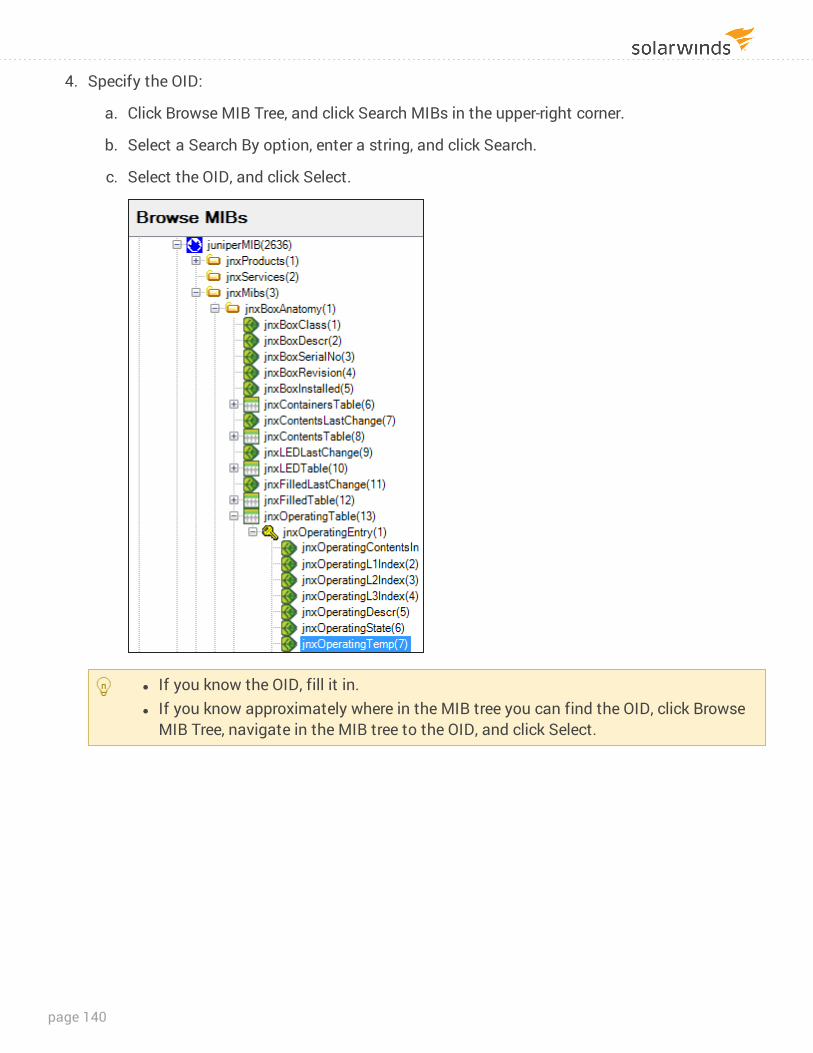
4. Specify the OID:
a. Click Browse MIB Tree, and click Search MIBs in the upper-right corner.
b. Select a Search By option, enter a string, and click Search.
c. Select the OID, and click Select.
l If you know the OID, fill it in. l If you know approximately where in the MIB tree you can find the OID, click Browse
MIB Tree, navigate in the MIB tree to the OID, and click Select.
page 140
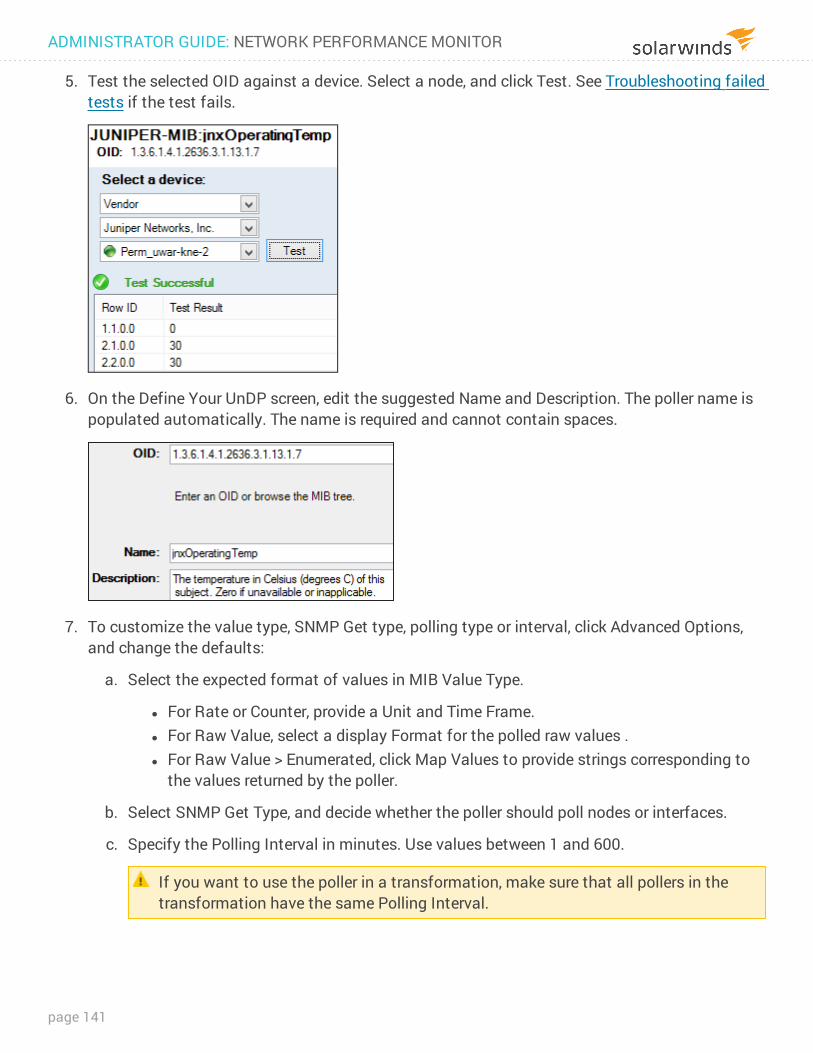
5. Test the selected OID against a device. Select a node, and click Test. See Troubleshooting failed tests if the test fails.
6. On the Define Your UnDP screen, edit the suggested Name and Description. The poller name is populated automatically. The name is required and cannot contain spaces.
7. To customize the value type, SNMP Get type, polling type or interval, click Advanced Options, and change the defaults:
a. Select the expected format of values in MIB Value Type.
l For Rate or Counter, provide a Unit and Time Frame. l For Raw Value, select a display Format for the polled raw values . l For Raw Value > Enumerated, click Map Values to provide strings corresponding to
the values returned by the poller.
b. Select SNMP Get Type, and decide whether the poller should poll nodes or interfaces.
c. Specify the Polling Interval in minutes. Use values between 1 and 600.
If you want to use the poller in a transformation, make sure that all pollers in the transformation have the same Polling Interval.
ADMINISTRATOR GUIDE: NETWORK PERFORMANCE MONITOR
page 141
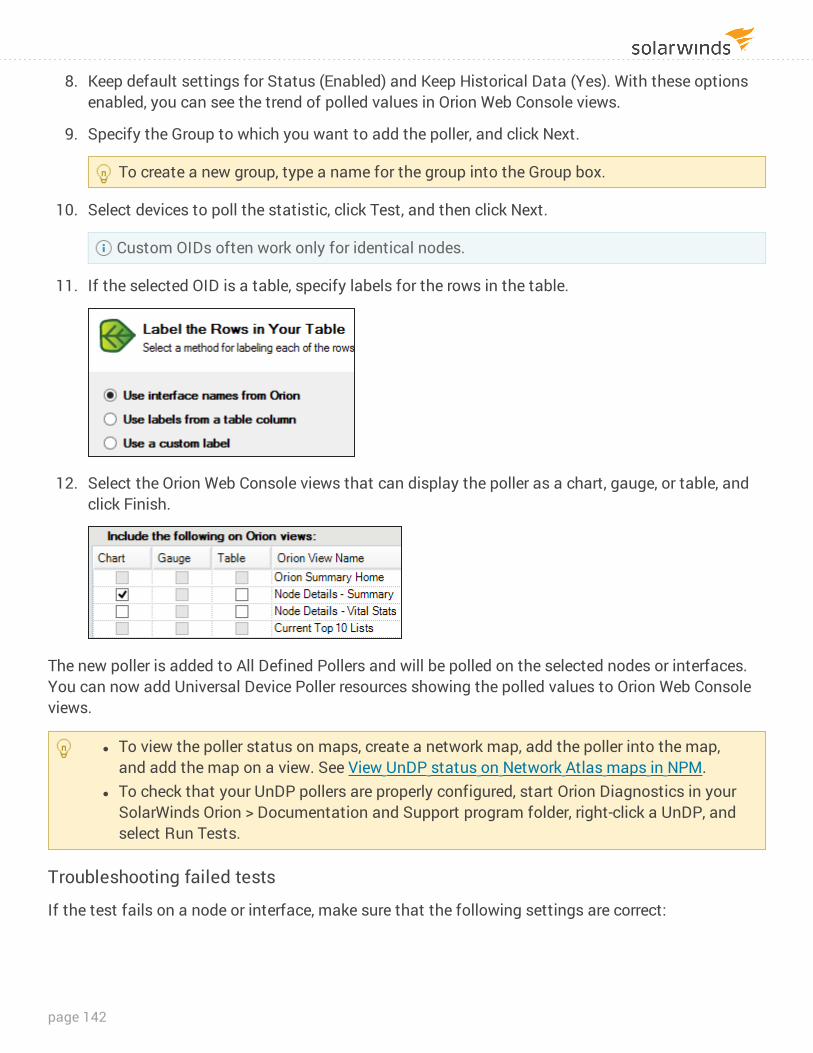
8. Keep default settings for Status (Enabled) and Keep Historical Data (Yes). With these options enabled, you can see the trend of polled values in Orion Web Console views.
9. Specify the Group to which you want to add the poller, and click Next.
To create a new group, type a name for the group into the Group box.
10. Select devices to poll the statistic, click Test, and then click Next.
Custom OIDs often work only for identical nodes.
11. If the selected OID is a table, specify labels for the rows in the table.
12. Select the Orion Web Console views that can display the poller as a chart, gauge, or table, and click Finish.
The new poller is added to All Defined Pollers and will be polled on the selected nodes or interfaces. You can now add Universal Device Poller resources showing the polled values to Orion Web Console views.
l To view the poller status on maps, create a network map, add the poller into the map, and add the map on a view. See View UnDP status on Network Atlas maps in NPM.
l To check that your UnDP pollers are properly configured, start Orion Diagnostics in your SolarWinds Orion > Documentation and Support program folder, right-click a UnDP, and select Run Tests.
Troubleshooting failed tests
If the test fails on a node or interface, make sure that the following settings are correct:
page 142
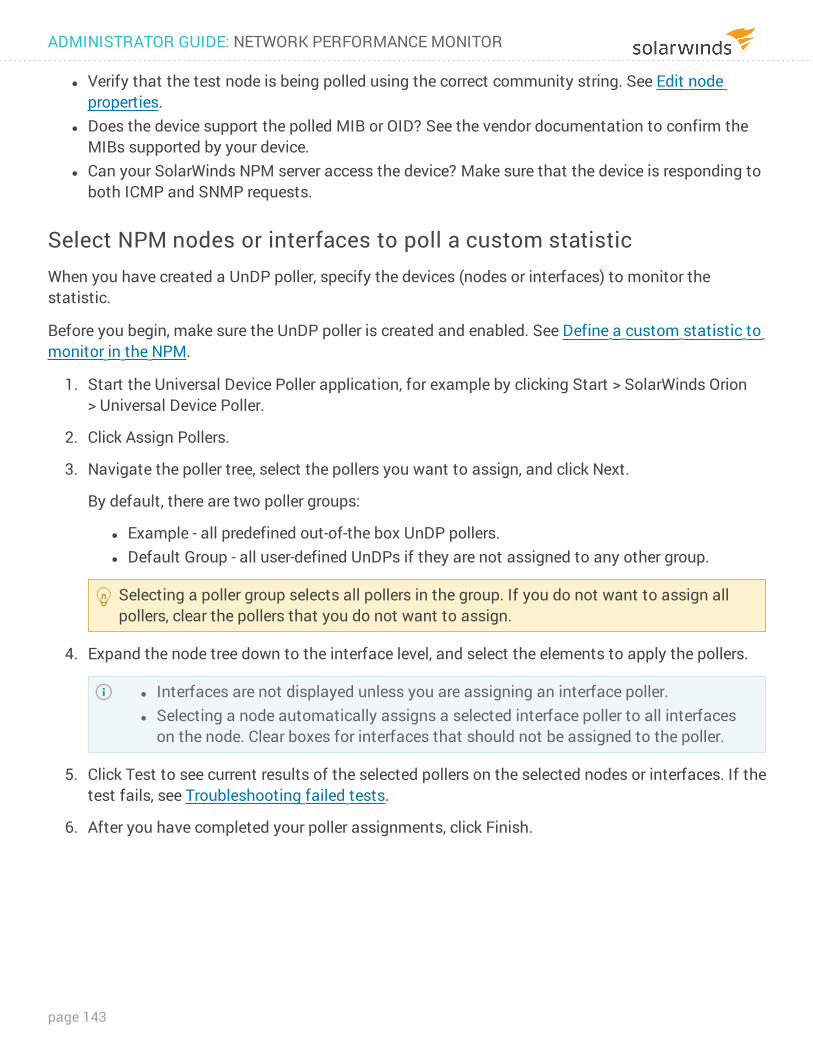
l Verify that the test node is being polled using the correct community string. See Edit node properties.
l Does the device support the polled MIB or OID? See the vendor documentation to confirm the MIBs supported by your device.
l Can your SolarWinds NPM server access the device? Make sure that the device is responding to both ICMP and SNMP requests.
Select NPM nodes or interfaces to poll a custom statistic When you have created a UnDP poller, specify the devices (nodes or interfaces) to monitor the statistic.
Before you begin, make sure the UnDP poller is created and enabled. See Define a custom statistic to monitor in the NPM.
1. Start the Universal Device Poller application, for example by clicking Start > SolarWinds Orion > Universal Device Poller.
2. Click Assign Pollers.
3. Navigate the poller tree, select the pollers you want to assign, and click Next.
By default, there are two poller groups:
l Example - all predefined out-of-the box UnDP pollers. l Default Group - all user-defined UnDPs if they are not assigned to any other group.
Selecting a poller group selects all pollers in the group. If you do not want to assign all pollers, clear the pollers that you do not want to assign.
4. Expand the node tree down to the interface level, and select the elements to apply the pollers.
l Interfaces are not displayed unless you are assigning an interface poller. l Selecting a node automatically assigns a selected interface poller to all interfaces
on the node. Clear boxes for interfaces that should not be assigned to the poller.
5. Click Test to see current results of the selected pollers on the selected nodes or interfaces. If the test fails, see Troubleshooting failed tests.
6. After you have completed your poller assignments, click Finish.
ADMINISTRATOR GUIDE: NETWORK PERFORMANCE MONITOR
page 143
Transform poller results in the Orion PlatformValues polled by a custom poller are often better understood after a calculation transforms the value to a different format.
For example, if a poller returns temperature values in Celsius, you might want to see the values in Fahrenheit.
Pollers that you use in a transformation must be assigned to the nodes to poll for values that will be transformed.
1. Start the Universal Device Poller application, for example by clicking Start > SolarWinds Orion > Universal Device Poller.
2. Click Transform Results, and click Next to acknowledge examples of transformations.
3. Type the name and description for the transformation, and click Next. Names must be unique.
Names are required. Any spaces in the name are removed.
Descriptions are optional but might be helpful in identifying the type of information generated by the transformation.
You can also change other default settings:
a. Select Yes in the Keep Historical Data section. You will be able to view the transformed poller data in charts and gauges in the Orion Web Console.
b. Select Enabled as the Status if you want your transformation to begin calculating results immediately.
If you select Disabled, the transformation will not transform polled data.
c. In the Group field, select a group where you want to add the transformation. To add a group, provide the new group name.
d. Optional: provide a polling interval.
Make sure all pollers in the transformation use the same polling interval.
page 144
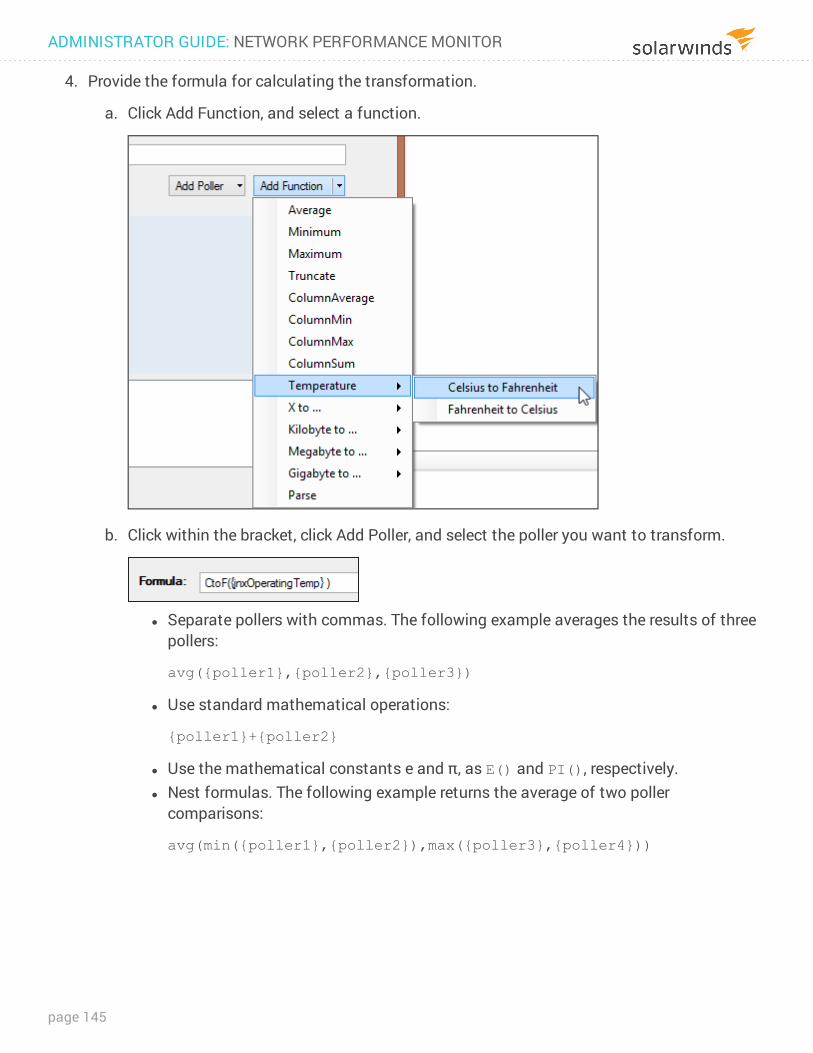
4. Provide the formula for calculating the transformation.
a. Click Add Function, and select a function.
b. Click within the bracket, click Add Poller, and select the poller you want to transform.
l Separate pollers with commas. The following example averages the results of three pollers:
avg({poller1},{poller2},{poller3})
l Use standard mathematical operations:
{poller1}+{poller2}
l Use the mathematical constants e and π, as E() and PI(), respectively. l Nest formulas. The following example returns the average of two poller
comparisons:
avg(min({poller1},{poller2}),max({poller3},{poller4}))
ADMINISTRATOR GUIDE: NETWORK PERFORMANCE MONITOR
page 145
5. Test the transformation on a device, and click Next.
Troubleshooting failed transformation tests
If the test fails, verify the following items:
l Is your formula correct? Ensure that all braces are balanced, that there are no unnecessary spaces, and that all pollers return the same type of values.
l Are you using the correct community string for the node that is being polled for the test? For more information about providing community strings, see Edit node properties.
l Does the device support the polled MIB or OID? See the documentation supplied by the device vendor to confirm supported MIBs for your device.
l Can you access the device from the SolarWinds Network Performance Monitor server? Confirm that the device is responding to both ICMP and SNMP requests.
6. Select nodes for the transformation, and click Test.
l Interfaces are not displayed unless your poller transformation operates on an interface poller.
7. If the transformation output is a table, select labels for the rows in the table, and click Next.
8. Select Orion Web Console views where you want to include the transformed values as a chart or table, and click Finish.
Click Preview to see how your poller resource will display in the selected Orion Web Console view.
The new transformation is added to All Defined Pollers and applied on the selected nodes or interfaces. You can add a Universal Device Poller resource to display transformed values in the Orion Web Console views.
If the transformation combines data from other pollers, make sure that it is assigned to the same node or interface as the pollers used for the transformation and that it has the same polling interval.
Create pollers by duplicating and adjusting pollers in NPMWhen creating similar pollers, consider copying a poller and modifying it.
1. Start the Universal Device Poller application, for example by clicking Start > SolarWinds Orion > Universal Device Poller.
2. In the All Defined Pollers pane, locate the poller that you want to duplicate.
page 146
To confirm that you have selected the appropriate poller, view the poller properties in the main Universal Device Poller window.
3. Right-click the poller, and select Duplicate Poller.
4. Change the Name of the poller.
5. Adjust the poller settings. See Define a custom statistic to monitor in the NPM.
Import UnDP pollers to NPMYou can import custom UnDP pollers exported from UnDPs installed with earlier Orion Platform versions.
You cannot import device-specific MIBs into the SolarWinds MIB Database, but you can import UnDP pollers based on OIDs from device-specific MIBs. Import a poller and assign it to nodes or interfaces in your environment.
1. Start the Universal Device Poller application, for example by clicking Start > SolarWinds Orion > Universal Device Poller.
2. Click File > Import Universal Device Pollers.
3. For each poller you want to import, complete the following steps:
a. Click Open, and locate the poller.
b. Select the poller, and click Open.
4. Select the pollers to import from the list on the left, and click Import. Selected pollers will move to the pane on the right.
l To select multiple pollers, hold down SHIFT or CTRL, and click the pollers you want. l To remove a poller from the Selected Pollers list, select the poller and click Remove. l To collapse all folders and see just the group names, hold down SHIFT, and
then click - next to any of the group names.
5. Click OK.
6. To begin polling, enable the poller.
a. Select the imported poller in the All Defined Pollers pane of the Universal Device Poller window.
b. Click Edit Properties.
ADMINISTRATOR GUIDE: NETWORK PERFORMANCE MONITOR
page 147
c. Confirm that the poller Status is Enabled, and click Finish.
If Disabled, the poller will not collect data until you enable it.
7. Specify nodes or interfaces to be polled by the imported poller. See Select NPM nodes or interfaces to poll a custom statistic .
When the imported poller is enabled and assigned to the devices, the poller begins collecting statistics. To view the statistics, log in to the Orion Web Console, go to a view for the node or interface to which the poller is assigned, and consult the poller resource. See View Universal Device Poller statistics in NPM.
Export UnDP pollers from NPMIf you want to use your custom UnDPs in later SolarWinds NPM versions or on different polling engines, you need to export them first.
1. Start the Universal Device Poller application, for example by clicking Start > SolarWinds Orion > Universal Device Poller.
2. Click File > Export Universal Device Pollers.
3. In the Pollers pane on the left, navigate to the pollers that you want to export.
l To select all pollers in a group, select the group. l To select multiple pollers, hold down SHIFT or CTRL and click the pollers to export.
4. Select the pollers, and click Export. Pollers will move to the Selected Pollers pane.
To remove a poller from the list of pollers for export, select the poller and click Remove.
5. Click Save.
6. Navigate to the location where you want to export the selected pollers, provide a File name, and click Save.
Selected pollers will now be stored as a .UnDP file in the specified location. You can use the .UnDP file to import the pollers on another polling engine.
page 148
Temporarily suspend collecting statistics for pollers in NPMWhen you assign a poller to nodes or interfaces, it starts collecting statistics on the selected elements. If you want to suspend data collection for a poller without deleting it, disable the poller.
1. Start the Universal Device Poller application, for example by clicking Start > SolarWinds Orion > Universal Device Poller.
2. In the All Defined Pollers pane, navigate to the poller you want to disable.
To confirm that you have selected the appropriate poller, view the poller properties in the main Orion Universal Device Poller window.
3. Select the poller, and click Edit Properties.
4. Set Status to Disabled, and click Finish.
The poller will now still be available in the Universal Device Poller application, but will not collect any statistics.
ADMINISTRATOR GUIDE: NETWORK PERFORMANCE MONITOR
page 149
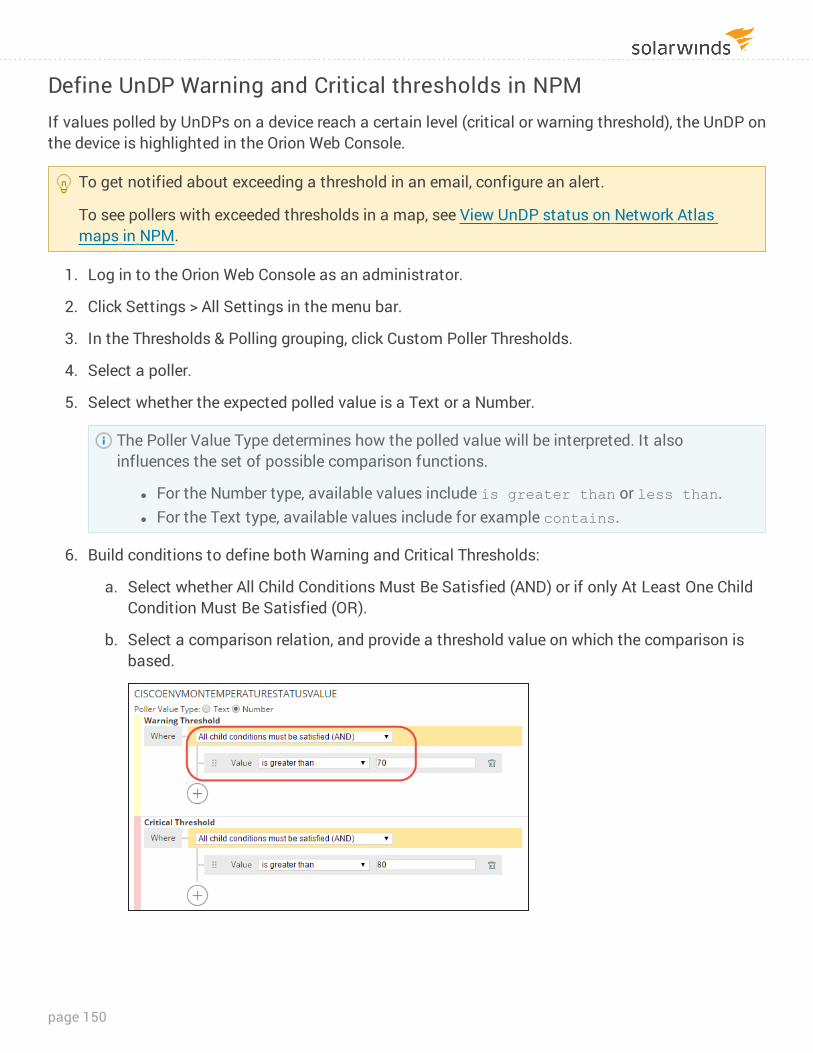
Define UnDP Warning and Critical thresholds in NPMIf values polled by UnDPs on a device reach a certain level (critical or warning threshold), the UnDP on the device is highlighted in the Orion Web Console.
To get notified about exceeding a threshold in an email, configure an alert.
To see pollers with exceeded thresholds in a map, see View UnDP status on Network Atlas maps in NPM.
1. Log in to the Orion Web Console as an administrator.
2. Click Settings > All Settings in the menu bar.
3. In the Thresholds & Polling grouping, click Custom Poller Thresholds.
4. Select a poller.
5. Select whether the expected polled value is a Text or a Number.
The Poller Value Type determines how the polled value will be interpreted. It also influences the set of possible comparison functions.
l For the Number type, available values include is greater than or less than. l For the Text type, available values include for example contains.
6. Build conditions to define both Warning and Critical Thresholds:
a. Select whether All Child Conditions Must Be Satisfied (AND) or if only At Least One Child Condition Must Be Satisfied (OR).
b. Select a comparison relation, and provide a threshold value on which the comparison is based.
page 150
c. Click + to add additional conditions, as required, to define the poller threshold.
7. After configuring all thresholds, click Submit.
If a value reported by the device belongs to the range defined by the Warning Threshold, pollers in maps will be yellow.
If a value reported by the device belongs to the range defined by the Critical Threshold, pollers in maps will be red.
View Universal Device Poller statistics in NPMIf you want to see a poller results in the Orion Web Console, you need to define which widgets, or resources, should be displayed on which views.
Prerequisites
The poller must be enabled, and assigned to the devices.
Set the poller to collect historical statistics. Without historical data, Orion Web Console widgets will only display the last polled value, and you cannot add charts with the poller results to the Orion Web Console.
Define widgets with UnDP results for Orion Web Console views
1. Start the Universal Device Poller application, for example by clicking Start > SolarWinds Orion > Universal Device Poller.
2. In the All Defined Pollers pane, select the poller whose results you want to add as a Orion Web Console resource.
3. Right-click the poller, and click Web Display.
4. Confirm that Yes is selected, and select the types of poller widgets that you want to display on individual Orion Web Console views.
Click Preview to see what the poller widget will look like in the Orion Web Console view.
5. Make sure Do Not Show This Poller If It Is Not Assigned is selected. It ensures that the custom poller widget appears only on views for nodes or interfaces that have the custom poller assigned to them and enabled.
6. Click Finish.
When you log in to the Orion Web Console, the selected widgets with poller data will appear on selected views for nodes or interfaces that have the poller assigned to them and enabled.
See also View UnDP status on Network Atlas maps in NPM.
ADMINISTRATOR GUIDE: NETWORK PERFORMANCE MONITOR
page 151
View UnDP status on Network Atlas maps in NPMIn the Orion Web Console network maps, you can see when a Universal Device Poller on a device returns values that exceed the warning and critical thresholds.
1. Create a Universal Device Poller in the UnDP application.
2. Assign the poller to nodes.
3. Define warning or critical thresholds specifying when you want the pollers to be highlighted.
4. Create a network map in the Network Atlas, drag the UnDPs into it, and save the map.
To add a UnDP on a map, start the Network Atlas, navigate to a node on which the UnDP is enabled (Vendor > Node Name > Custom Node Poller), and drag the poller into the map.
5. Log into the Orion Web Console, go to the map view.
6. Locate the Map resource (or add it if not available), click Edit and select your map.
You can now see UnDPs for your nodes in the Orion Web Console map. When the polled UnDP values exceed the warning threshold, the UnDP icon turns yellow on the map. After reaching the critical threshold, the icon turns red.
Assign Universal Device Pollers to devices monitored in NPMSolarWinds NPM provides both a selection of predefined pollers and the Universal Device Poller (UnDP) utility for defining your own pollers to monitor specific aspects of your network devices.
UnDPs are SNMP-based. You can only assign them to nodes polled through SNMP.
If you do not see a poller that meets your monitoring needs, use the Universal Device Poller to create a poller. See Monitor custom statistics based on OIDs with Universal Device Pollers in the NPM.
1. Log in to the Orion Web Console as an administrator.
2. Click Settings > Manage Nodes.
3. Select the node, interface, or volume you want to assign Universal Device Pollers to.
The list only includes nodes polled through SNMP. If you cannot see a node, check the polling method, and change it to SNMP.See Add a single node for information about adding nodes, interfaces, or volumes for monitoring.
4. Click Assign Pollers in the Node Management toolbar.
page 152
5. Expand the poller group, and select pollers to assign.
6. Click Submit, and click OK to confirm the assignment.
NPM polls data specified by the poller on the node, interface, or volume.
Update the SolarWinds MIB Database for the Orion PlatformSolarWinds maintains a MIB database that serves as a repository for the OIDs used to monitor a wide variety of network devices. The MIB database is updated regularly.
When you are creating a UnDP poller and cannot find an OID in the MIB tree, update the MIB database.
l Download MIB database from the Orion Web Console (Orion Platform 2020.2 and later) l Download MIB database from the Customer Portal l Learn more about MIBs
Download the MIB Database from the Orion Web Console (Orion Platform 2020.2)
Starting with Orion Platform 2020.2, you can check the status of your MIBs database and download the latest MIBs database directly from the Orion Web Console.
1. Log in to your Orion Web Console.
2. Click Settings > All Settings > MIBs Management in the Details section.
The page informs you about the MIBs database installed on your main polling engine and about the latest available version.
3. If an updated version of the MIBs database is available, click Download.
This downloads the latest version of the MIBs database as a MIBs.msi file.
ADMINISTRATOR GUIDE: NETWORK PERFORMANCE MONITOR
page 153
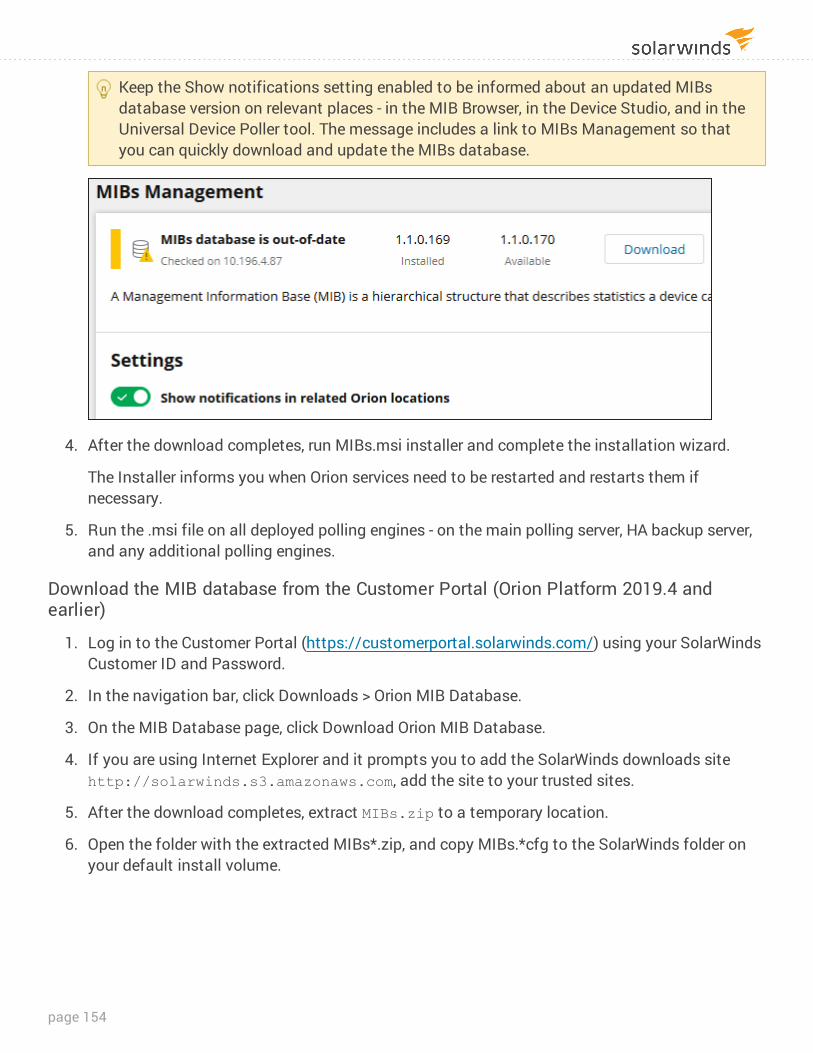
Keep the Show notifications setting enabled to be informed about an updated MIBs database version on relevant places - in the MIB Browser, in the Device Studio, and in the Universal Device Poller tool. The message includes a link to MIBs Management so that you can quickly download and update the MIBs database.
4. After the download completes, run MIBs.msi installer and complete the installation wizard.
The Installer informs you when Orion services need to be restarted and restarts them if necessary.
5. Run the .msi file on all deployed polling engines - on the main polling server, HA backup server, and any additional polling engines.
Download the MIB database from the Customer Portal (Orion Platform 2019.4 and earlier)
1. Log in to the Customer Portal (https://customerportal.solarwinds.com/) using your SolarWinds Customer ID and Password.
2. In the navigation bar, click Downloads > Orion MIB Database.
3. On the MIB Database page, click Download Orion MIB Database.
4. If you are using Internet Explorer and it prompts you to add the SolarWinds downloads site http://solarwinds.s3.amazonaws.com, add the site to your trusted sites.
5. After the download completes, extract MIBs.zip to a temporary location.
6. Open the folder with the extracted MIBs*.zip, and copy MIBs.*cfg to the SolarWinds folder on your default install volume.
page 154
l The default location depends on the operating system. For example, on Windows Server 2012, MIBs*.*cfg is located in C:\ProgramData\Solarwinds.
l If you cannot overwrite MIBs*.*c*fg because it is being used by a service, Shutdown and restart Orion services, overwrite MIBs.*cfg, and restart the service again.
l You may need to restart the Universal Device Poller after installing the MIBs database.
7. Copy the extracted MIBs as described in step 6 to all deployed polling engines - on the main polling server, HA backup server, and any additional polling engines.
You may need to restart the Universal Device Poller application after installing the MIB database, for example by clicking Start > SolarWinds Orion > Universal Device Poller.
Learn more about MIBsWhat is a MIB?
See What is a MIB, OID, and how they are used.
Check an OID in the SolarWinds MIBs database
1. Go to the Details view for a device.
2. In the Management widget, click the MIB Browser button.
The online MIB Browser opens. You can navigate through the SolarWinds MIB database and check whether an OID is available.
Add a device MIB
If you have a specific device MIB, you can have it added to the SolarWinds MIB database. See Add MIBs to the SolarWinds MIB database.
What is a MIB?
See What is a MIB, OID, and how they are used.
Manage unique devices on the network with NPMIf you have devices on your network that SolarWinds does not recognize for polling, you can either edit an existing poller to suit your device needs, or create a poller specifically tailored to your device.
ADMINISTRATOR GUIDE: NETWORK PERFORMANCE MONITOR
page 155
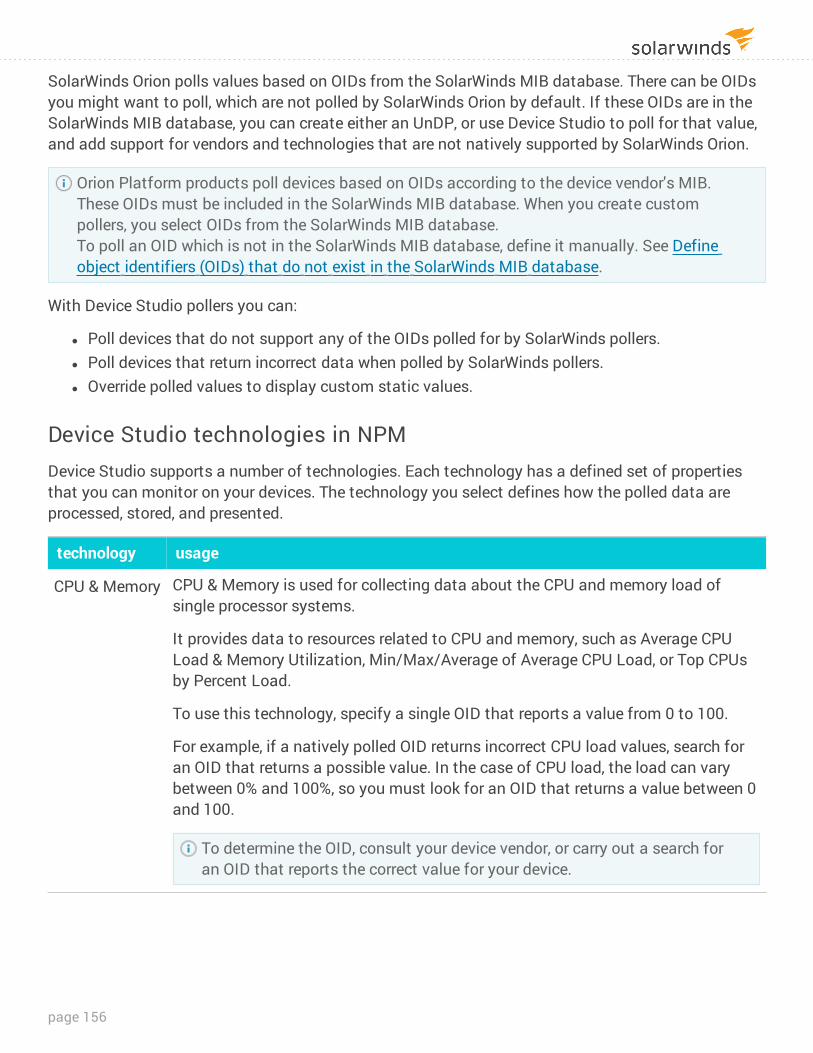
SolarWinds Orion polls values based on OIDs from the SolarWinds MIB database. There can be OIDs you might want to poll, which are not polled by SolarWinds Orion by default. If these OIDs are in the SolarWinds MIB database, you can create either an UnDP, or use Device Studio to poll for that value, and add support for vendors and technologies that are not natively supported by SolarWinds Orion.
Orion Platform products poll devices based on OIDs according to the device vendor's MIB. These OIDs must be included in the SolarWinds MIB database. When you create custom pollers, you select OIDs from the SolarWinds MIB database.To poll an OID which is not in the SolarWinds MIB database, define it manually. See Define object identifiers (OIDs) that do not exist in the SolarWinds MIB database.
With Device Studio pollers you can:
l Poll devices that do not support any of the OIDs polled for by SolarWinds pollers. l Poll devices that return incorrect data when polled by SolarWinds pollers. l Override polled values to display custom static values.
Device Studio technologies in NPMDevice Studio supports a number of technologies. Each technology has a defined set of properties that you can monitor on your devices. The technology you select defines how the polled data are processed, stored, and presented.
technology usage
CPU & Memory CPU & Memory is used for collecting data about the CPU and memory load of single processor systems.
It provides data to resources related to CPU and memory, such as Average CPU Load & Memory Utilization, Min/Max/Average of Average CPU Load, or Top CPUs by Percent Load.
To use this technology, specify a single OID that reports a value from 0 to 100.
For example, if a natively polled OID returns incorrect CPU load values, search for an OID that returns a possible value. In the case of CPU load, the load can vary between 0% and 100%, so you must look for an OID that returns a value between 0 and 100.
To determine the OID, consult your device vendor, or carry out a search for an OID that reports the correct value for your device.
page 156
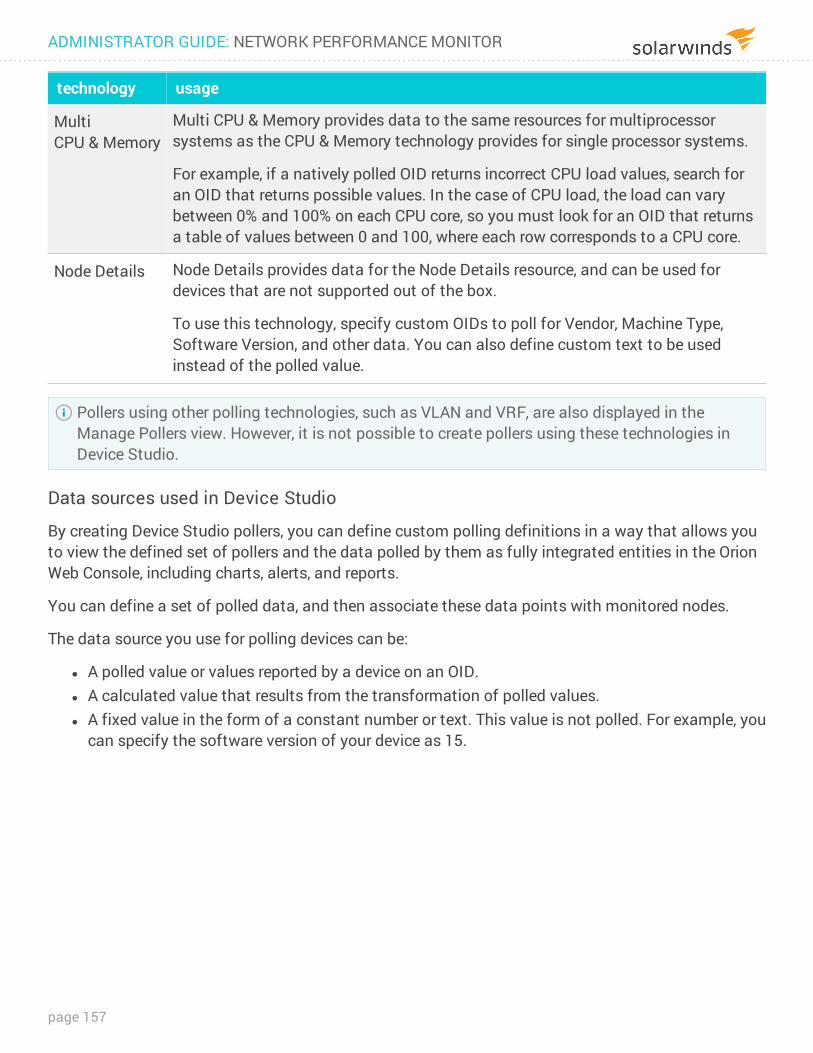
technology usage
Multi CPU & Memory
Multi CPU & Memory provides data to the same resources for multiprocessor systems as the CPU & Memory technology provides for single processor systems.
For example, if a natively polled OID returns incorrect CPU load values, search for an OID that returns possible values. In the case of CPU load, the load can vary between 0% and 100% on each CPU core, so you must look for an OID that returns a table of values between 0 and 100, where each row corresponds to a CPU core.
Node Details Node Details provides data for the Node Details resource, and can be used for devices that are not supported out of the box.
To use this technology, specify custom OIDs to poll for Vendor, Machine Type, Software Version, and other data. You can also define custom text to be used instead of the polled value.
Pollers using other polling technologies, such as VLAN and VRF, are also displayed in the Manage Pollers view. However, it is not possible to create pollers using these technologies in Device Studio.
Data sources used in Device Studio
By creating Device Studio pollers, you can define custom polling definitions in a way that allows you to view the defined set of pollers and the data polled by them as fully integrated entities in the Orion Web Console, including charts, alerts, and reports.
You can define a set of polled data, and then associate these data points with monitored nodes.
The data source you use for polling devices can be:
l A polled value or values reported by a device on an OID. l A calculated value that results from the transformation of polled values. l A fixed value in the form of a constant number or text. This value is not polled. For example, you
can specify the software version of your device as 15.
ADMINISTRATOR GUIDE: NETWORK PERFORMANCE MONITOR
page 157
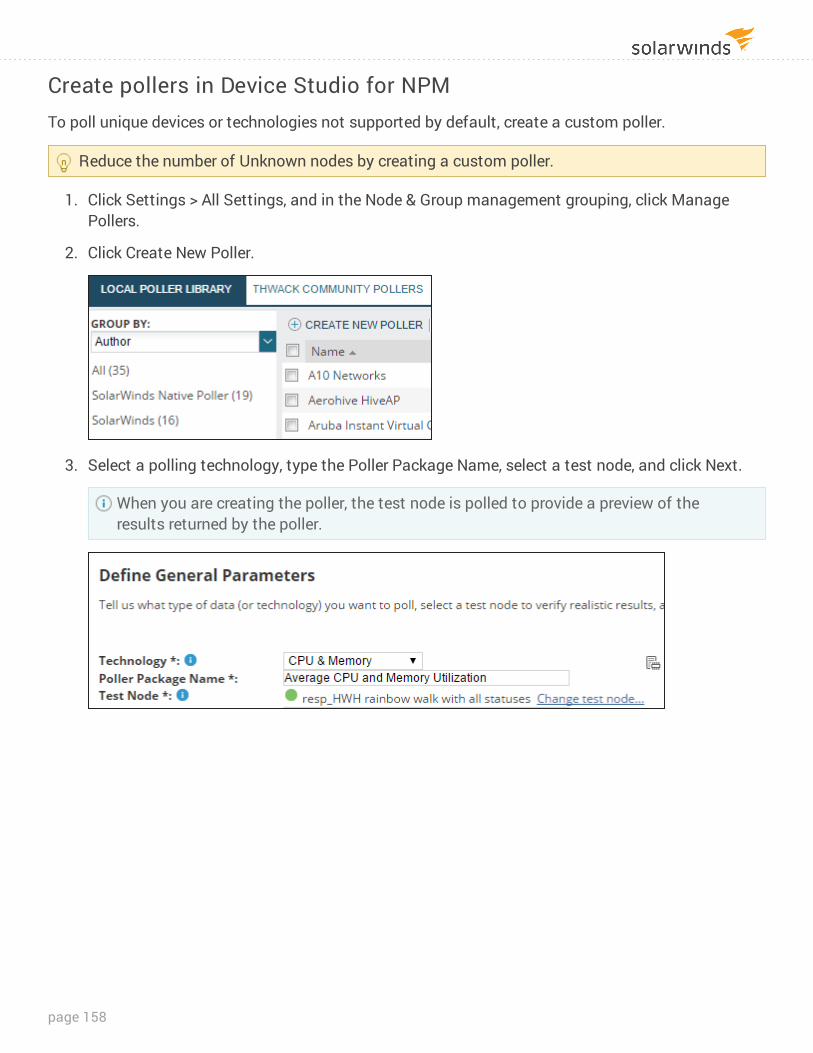
Create pollers in Device Studio for NPMTo poll unique devices or technologies not supported by default, create a custom poller.
Reduce the number of Unknown nodes by creating a custom poller.
1. Click Settings > All Settings, and in the Node & Group management grouping, click Manage Pollers.
2. Click Create New Poller.
3. Select a polling technology, type the Poller Package Name, select a test node, and click Next.
When you are creating the poller, the test node is polled to provide a preview of the results returned by the poller.
page 158
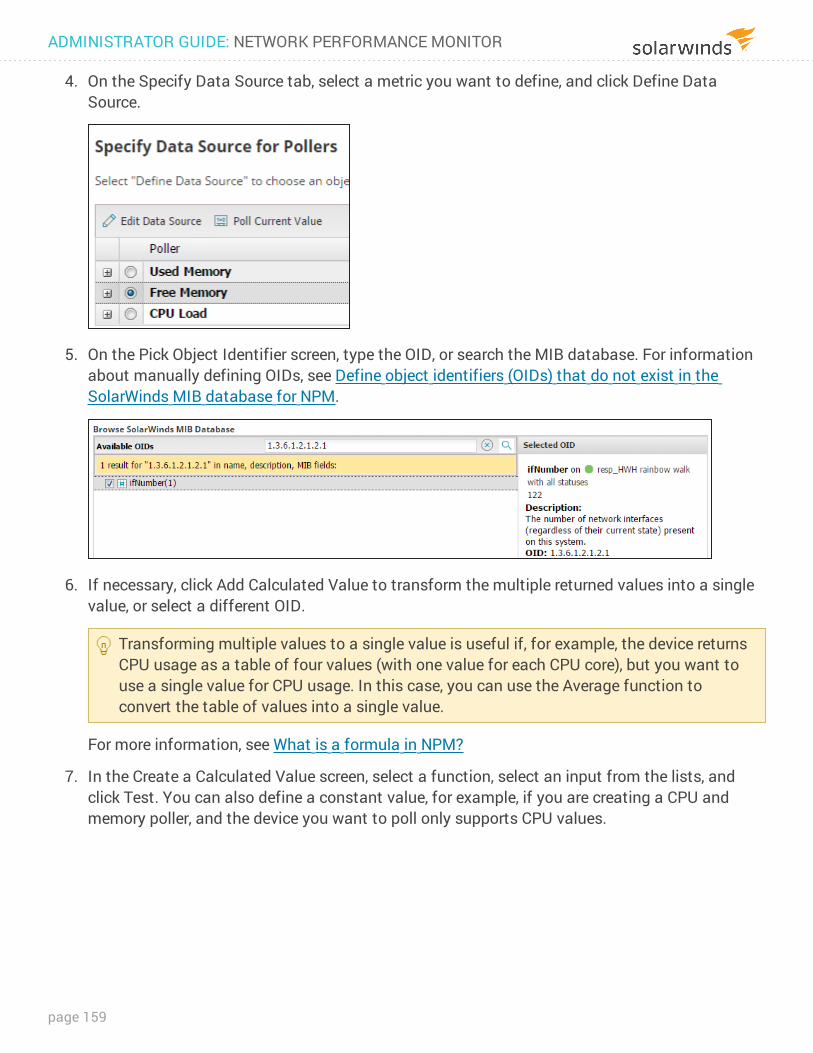
4. On the Specify Data Source tab, select a metric you want to define, and click Define Data Source.
5. On the Pick Object Identifier screen, type the OID, or search the MIB database. For information about manually defining OIDs, see Define object identifiers (OIDs) that do not exist in the SolarWinds MIB database for NPM.
6. If necessary, click Add Calculated Value to transform the multiple returned values into a single value, or select a different OID.
Transforming multiple values to a single value is useful if, for example, the device returns CPU usage as a table of four values (with one value for each CPU core), but you want to use a single value for CPU usage. In this case, you can use the Average function to convert the table of values into a single value.
For more information, see What is a formula in NPM?
7. In the Create a Calculated Value screen, select a function, select an input from the lists, and click Test. You can also define a constant value, for example, if you are creating a CPU and memory poller, and the device you want to poll only supports CPU values.
ADMINISTRATOR GUIDE: NETWORK PERFORMANCE MONITOR
page 159
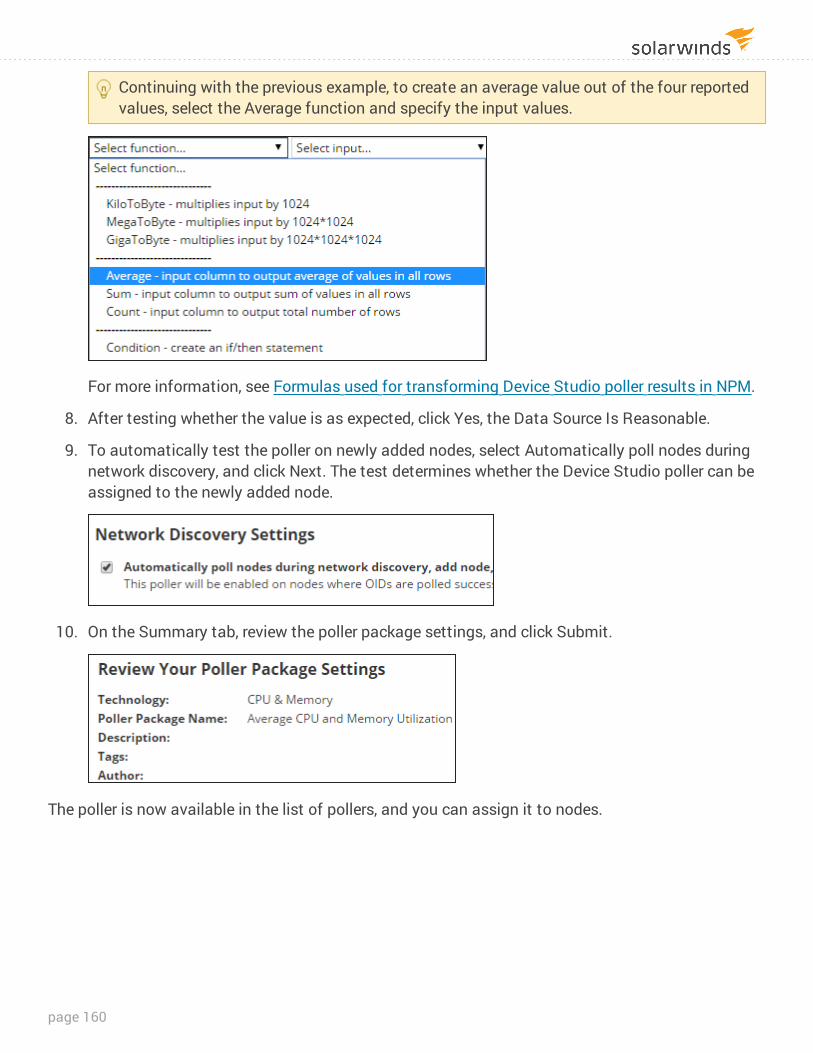
Continuing with the previous example, to create an average value out of the four reported values, select the Average function and specify the input values.
For more information, see Formulas used for transforming Device Studio poller results in NPM.
8. After testing whether the value is as expected, click Yes, the Data Source Is Reasonable.
9. To automatically test the poller on newly added nodes, select Automatically poll nodes during network discovery, and click Next. The test determines whether the Device Studio poller can be assigned to the newly added node.
10. On the Summary tab, review the poller package settings, and click Submit.
The poller is now available in the list of pollers, and you can assign it to nodes.
page 160
Define object identifiers (OIDs) that do not exist in the SolarWinds MIB database for NPM
1. On the Pick Object Identifier screen, select the check box under Manually Define Object Identifier (OID).
Not sure how to get here? See Create pollers for more details.
2. Type the name and OID.
3. Select the SNMP get type. See What is the SNMP Get Type in NPM? for more information.
4. Click Poll Current Value From Test Node.
What is the SNMP Get Type in NPM?The SNMP Get type defines the type of query you have to run to retrieve the appropriate information. You can retrieve scalar values by using either GET or GET NEXT, and you can retrieve values from a particular column in a table value by using GET TABLE.
For table records, only the first five values are returned.
What is a formula in NPM?Values polled by a custom poller are often better understood after a calculation transforms the value to a different format. For example, if a poller returns values in MB, you might want to work with the values presented in GB. The calculations and transformations that are used to manipulate poller results are called formulas.
Two types of values or data sources are available:
l Scalar: one value l Tabular: column of values
When a new data source is created, the name is generated automatically according to the syntax:
<Property name>Formula<Number>
For example: UsedMemoryFormula1
Formulas used for transforming Device Studio poller results in NPMformula description
KiloToByte Multiplies input by 1024
MegaToByte Multiplies input by 1024 x 1024
ADMINISTRATOR GUIDE: NETWORK PERFORMANCE MONITOR
page 161
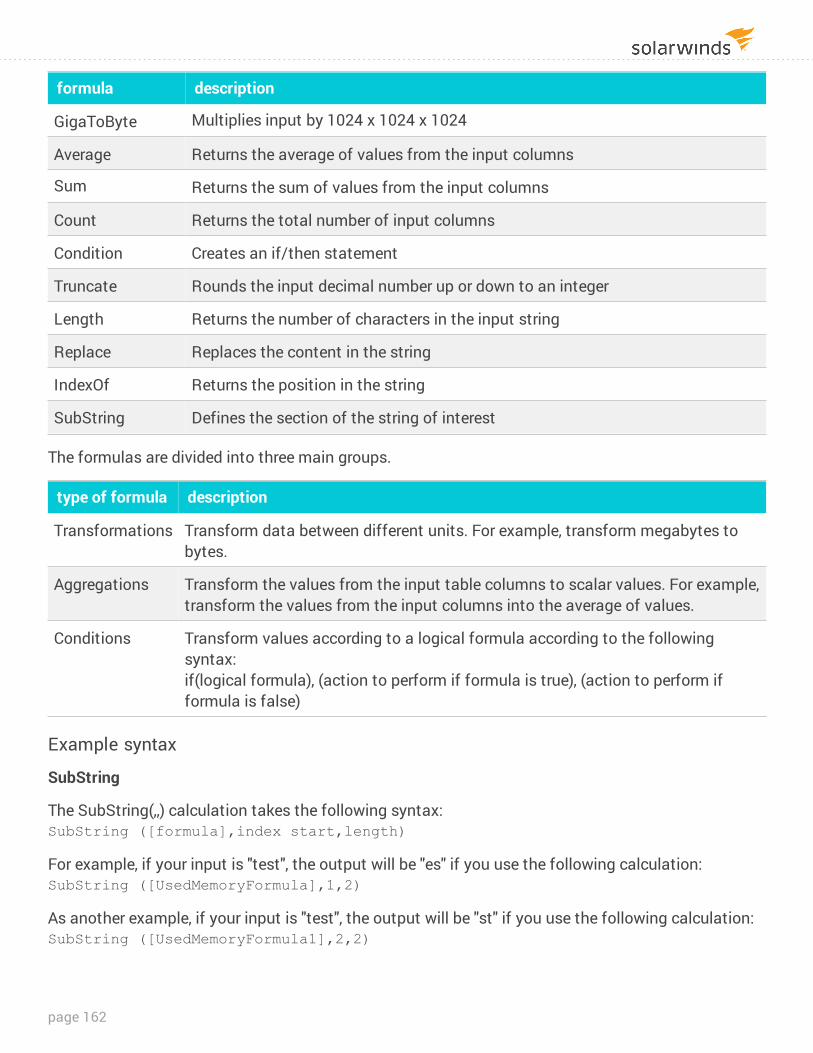
formula description
GigaToByte Multiplies input by 1024 x 1024 x 1024
Average Returns the average of values from the input columns
Sum Returns the sum of values from the input columns
Count Returns the total number of input columns
Condition Creates an if/then statement
Truncate Rounds the input decimal number up or down to an integer
Length Returns the number of characters in the input string
Replace Replaces the content in the string
IndexOf Returns the position in the string
SubString Defines the section of the string of interest
The formulas are divided into three main groups.
type of formula description
Transformations Transform data between different units. For example, transform megabytes to bytes.
Aggregations Transform the values from the input table columns to scalar values. For example, transform the values from the input columns into the average of values.
Conditions Transform values according to a logical formula according to the following syntax:if(logical formula), (action to perform if formula is true), (action to perform if formula is false)
Example syntax
SubString
The SubString(,,) calculation takes the following syntax:SubString ([formula],index start,length)
For example, if your input is "test", the output will be "es" if you use the following calculation:SubString ([UsedMemoryFormula],1,2)
As another example, if your input is "test", the output will be "st" if you use the following calculation:SubString ([UsedMemoryFormula1],2,2)
page 162
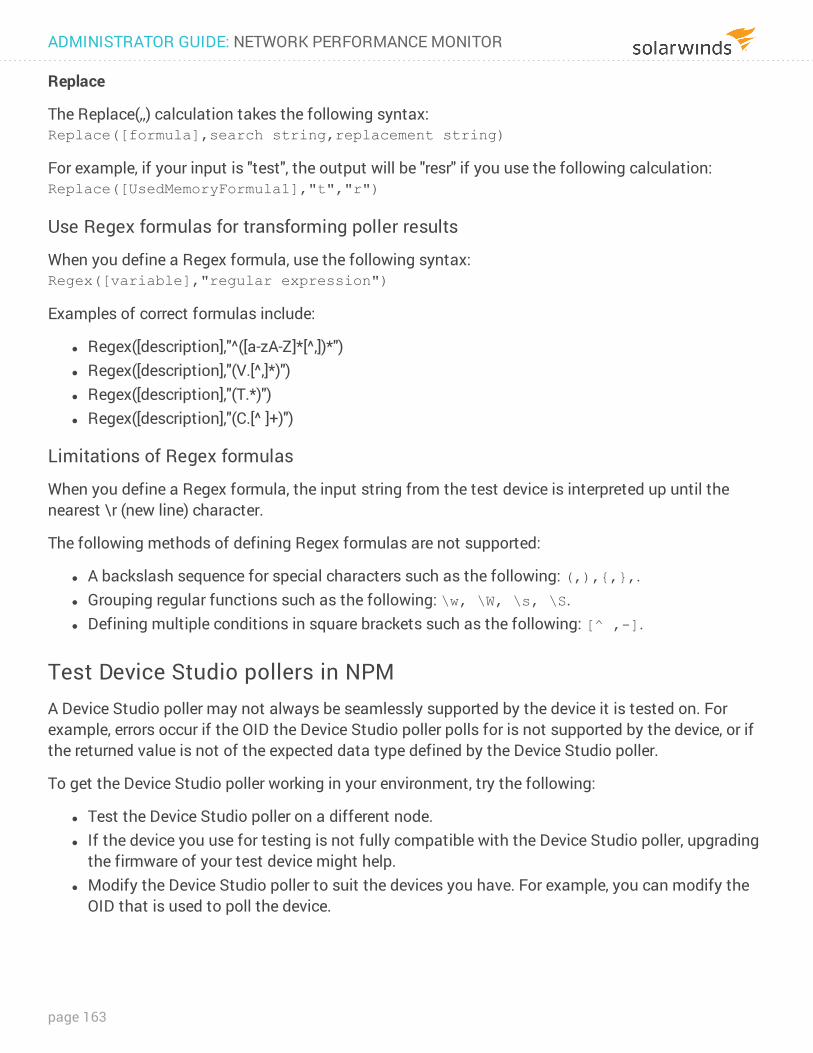
Replace
The Replace(,,) calculation takes the following syntax:Replace([formula],search string,replacement string)
For example, if your input is "test", the output will be "resr" if you use the following calculation: Replace([UsedMemoryFormula1],"t","r")
Use Regex formulas for transforming poller results
When you define a Regex formula, use the following syntax:Regex([variable],"regular expression")
Examples of correct formulas include:
l Regex([description],"^([a-zA-Z]*[^,])*") l Regex([description],"(V.[^,]*)") l Regex([description],"(T.*)") l Regex([description],"(C.[^ ]+)")
Limitations of Regex formulas
When you define a Regex formula, the input string from the test device is interpreted up until the nearest \r (new line) character.
The following methods of defining Regex formulas are not supported:
l A backslash sequence for special characters such as the following: (,),{,},. l Grouping regular functions such as the following: \w, \W, \s, \S. l Defining multiple conditions in square brackets such as the following: [^ ,-].
Test Device Studio pollers in NPMA Device Studio poller may not always be seamlessly supported by the device it is tested on. For example, errors occur if the OID the Device Studio poller polls for is not supported by the device, or if the returned value is not of the expected data type defined by the Device Studio poller.
To get the Device Studio poller working in your environment, try the following:
l Test the Device Studio poller on a different node. l If the device you use for testing is not fully compatible with the Device Studio poller, upgrading
the firmware of your test device might help. l Modify the Device Studio poller to suit the devices you have. For example, you can modify the
OID that is used to poll the device.
ADMINISTRATOR GUIDE: NETWORK PERFORMANCE MONITOR
page 163
o Modifying Device Studio pollers this way requires familiarity with the MIB database structure.
o Some of the pollers provided by SolarWinds cannot be modified with Device Studio. You can only modify the poller definition of these pollers in a text editor.
Monitor devices with NPM using THWACK community pollersApart from creating your own Device Studio pollers, you can also import pollers provided by contributors of the THWACK community.
The THWACK community pollers are available in the Orion Web Console under Manage Pollers > THWACK Community Pollers. The list is updated automatically every 30 minutes, and it contains the device pollers that have been made available on THWACK, under Network Performance Monitor > NPM Content Exchange > Device Pollers > Documents.
You can group the available pollers according to tags, author, or technology. Click the name of a device poller to view the description of the poller.
To verify whether a poller suits your specific device, test the poller before importing it.
Test THWACK Device pollers
1. Select the THWACK community poller from the list, and click Test Device Poller.
2. Type your THWACK credentials, and click Submit.
3. Select an SNMP node for testing, and click Test Poller.
After the test is finished, you can directly assign the device poller to the test node.
Import Device pollers from THWACK
1. Select the THWACK community poller from the list, and click Import Device Poller.
2. Type your THWACK user credentials, and click Submit.
3. After the import is finished, the poller will be available in the Local Poller Library, and you can assign it to a device. For more information, see Assign Device Studio pollers to monitored devices in NPM.
If the poller was already imported earlier, you can either overwrite the existing poller, or create a new one.
page 164
Import THWACK community pollers to an environment without Internet connection
The THWACK community pollers are only updated automatically if you have a working Internet connection. To import THWACK community pollers to an environment that does not have an Internet connection, download the pollers from a computer which can access the Internet, save them to a portable drive or a USB drive, and import them manually.
Export Device Studio pollers to the THWACK community
1. On the Manage Pollers screen, click the Local Poller Library tab, and select a poller.
You can export Device Studio pollers that you created, but you cannot export pollers that are provided by SolarWinds.
2. Click Export, and select Export to Thwack.
3. Type your THWACK user credentials, and click Submit.
If you already logged in to THWACK from the Orion Web Console during the same session, you do not have to enter your credentials again, and the Device Studio poller will be exported immediately.
The Device Studio poller will be available on THWACK, in the Network Performance Monitor > NPM Content Exchange > Device Pollers > Documents section.
Why can't I connect to THWACK from NPM ?Your Orion server must be able to open internet connections to connect to THWACK.
If the connection is blocked by a firewall or a proxy:
l The list of shared pollers cannot be retrieved from THWACK l Any operation that relies on communication with THWACK, such as the upload or download of
a poller, will fail.
Check your firewall and proxy settings to make sure that your Orion server can connect to the internet.
Assign Device Studio pollers to monitored devices in NPMSpecify devices on which you want to poll the statistics defined by the poller.
1. On the Manage Pollers page, select a poller, and click Assign.
2. Select the node you want to assign the poller to.
ADMINISTRATOR GUIDE: NETWORK PERFORMANCE MONITOR
page 165
3. If the node has not been scanned yet, click Scan Now.
4. If the scan result is a match or a multiple match, select the node, and click Enable Poller.
You can only scan SNMP nodes whose status is Up.
Scan monitored objects in NPM to verify if the OIDs matchWhen a monitored node is scanned, the OIDs of the monitored node and the OIDs specified in the poller are compared to see if they match.
These scenarios are possible:
l If the OIDs do not match, the scan returns a result indicating the mismatch, and the poller cannot be assigned to the monitored node.
l If the OIDs match, and there is no other poller supporting the specific technology, then the poller is automatically enabled on the node.
l If the OIDs match, but there is already another poller for the technology, the new poller is not enabled. You can enable the poller manually. See Assign Device Studio pollers to monitored devices in NPM.
page 166
Troubleshoot NPM issues with Performance Analysis dashboardsWith complex networks consisting of cloud, hybrid IT, virtualization, storage area networks, and so on, multi-faceted IT issues can be difficult to pinpoint and diagnose. When an issue surfaces, for example a badly performing application or server, the investigation can take significant time to locate the core issue. The problem could be in storage, network connectivity, user access, or a mix of resources and configurations.
To investigate the issue, create troubleshooting projects with the Performance Analysis (PerfStack™) dashboard that visually correlate historical and real-time data from multiple SolarWinds products and entity types in a single view.
With Performance Analysis dashboards, you can do the following:
l Compare and analyze multiple metric types in a single view, including status, events, and statistics.
l Compare and analyze metrics for multiple entities in a single view, including, nodes, interfaces, volumes, applications, and more.
l Correlate data from across the Orion Platform on a single, shared time line. l Visualize hybrid data for on-premises, cloud, and everything in between. l Share a troubleshooting project with your teams and experts to review historical data for an
issue.
PerfStack is designed for expert users to quickly sift through data. If you need help to select relevant metrics or more automated troubleshooting, consider using AppStack or NetPath™.
Troubleshoot intermittent network slowdowns with NPMThis topic provides an example of how you can troubleshoot an issue where a router drops or delays packets. Bandwidth issues are already ruled out.
This example describes creating a Performance Analysis dashboard (PerfStack™) that correlates the following metrics to investigate the cause of the network slowdown:
l Average Response Time (ms) and Percent Loss to assess the symptoms of the problem: how fast is the network getting your traffic to the server and how much of your traffic is lost.
l Average CPU Load and Average Percent Memory Used to verify whether the system-wide resources are not overloaded and thus causing the issue.
ADMINISTRATOR GUIDE: NETWORK PERFORMANCE MONITOR
page 167
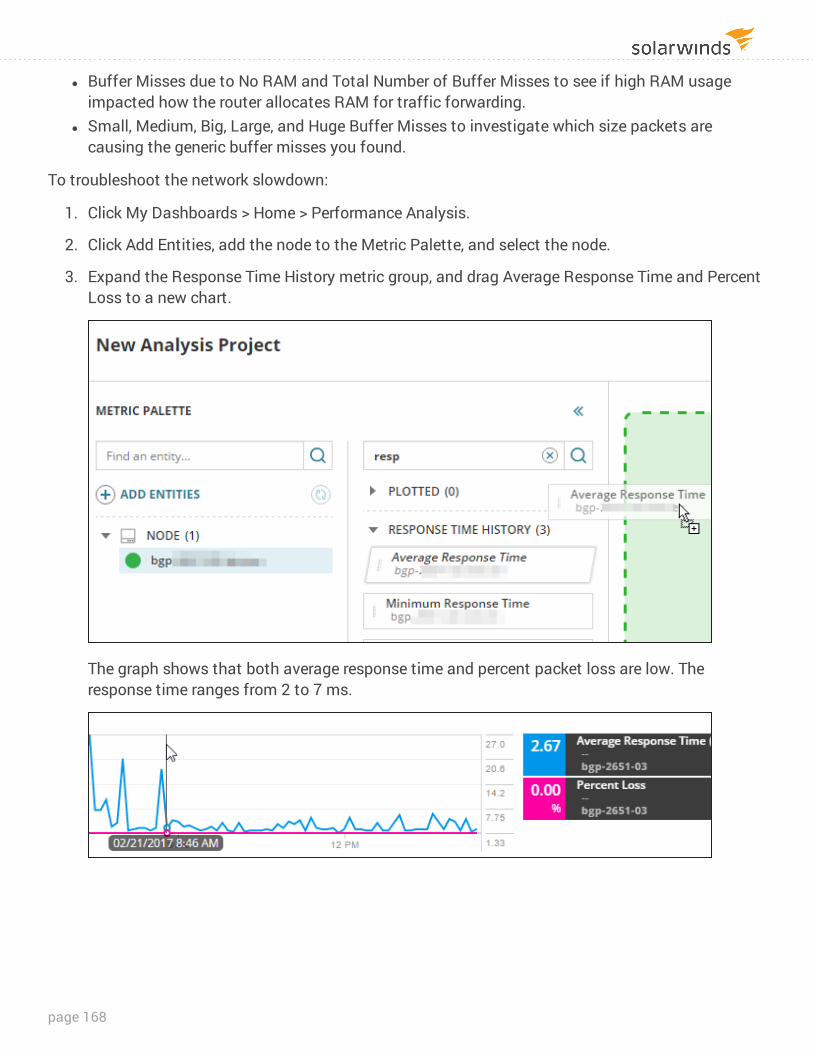
l Buffer Misses due to No RAM and Total Number of Buffer Misses to see if high RAM usage impacted how the router allocates RAM for traffic forwarding.
l Small, Medium, Big, Large, and Huge Buffer Misses to investigate which size packets are causing the generic buffer misses you found.
To troubleshoot the network slowdown:
1. Click My Dashboards > Home > Performance Analysis.
2. Click Add Entities, add the node to the Metric Palette, and select the node.
3. Expand the Response Time History metric group, and drag Average Response Time and Percent Loss to a new chart.
The graph shows that both average response time and percent packet loss are low. The response time ranges from 2 to 7 ms.
page 168
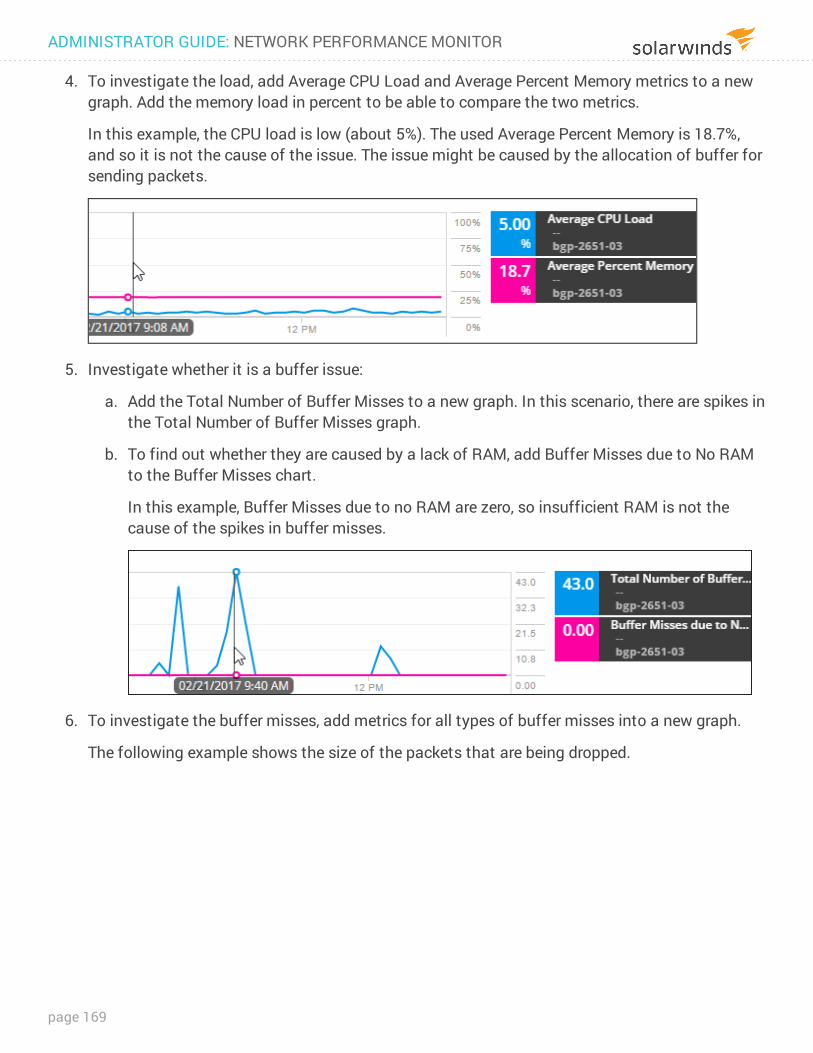
4. To investigate the load, add Average CPU Load and Average Percent Memory metrics to a new graph. Add the memory load in percent to be able to compare the two metrics.
In this example, the CPU load is low (about 5%). The used Average Percent Memory is 18.7%, and so it is not the cause of the issue. The issue might be caused by the allocation of buffer for sending packets.
5. Investigate whether it is a buffer issue:
a. Add the Total Number of Buffer Misses to a new graph. In this scenario, there are spikes in the Total Number of Buffer Misses graph.
b. To find out whether they are caused by a lack of RAM, add Buffer Misses due to No RAM to the Buffer Misses chart.
In this example, Buffer Misses due to no RAM are zero, so insufficient RAM is not the cause of the spikes in buffer misses.
6. To investigate the buffer misses, add metrics for all types of buffer misses into a new graph.
The following example shows the size of the packets that are being dropped.
ADMINISTRATOR GUIDE: NETWORK PERFORMANCE MONITOR
page 169
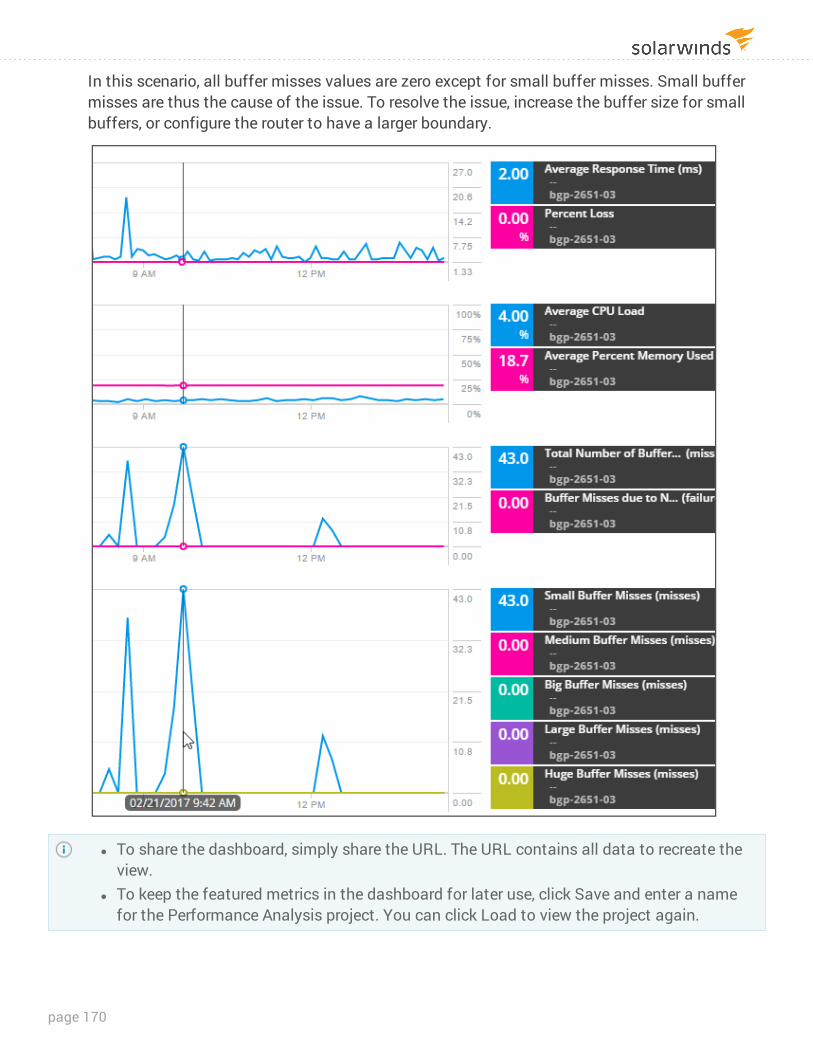
In this scenario, all buffer misses values are zero except for small buffer misses. Small buffer misses are thus the cause of the issue. To resolve the issue, increase the buffer size for small buffers, or configure the router to have a larger boundary.
l To share the dashboard, simply share the URL. The URL contains all data to recreate the view.
l To keep the featured metrics in the dashboard for later use, click Save and enter a name for the Performance Analysis project. You can click Load to view the project again.
page 170
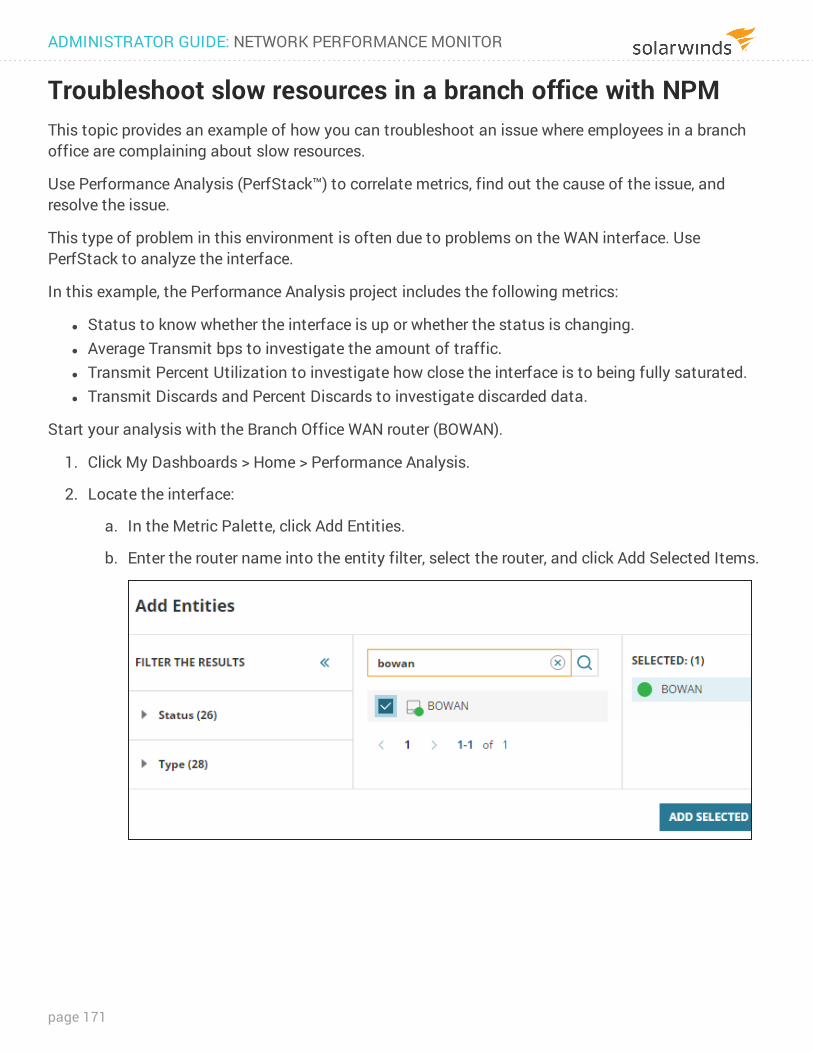
Troubleshoot slow resources in a branch office with NPMThis topic provides an example of how you can troubleshoot an issue where employees in a branch office are complaining about slow resources.
Use Performance Analysis (PerfStack™) to correlate metrics, find out the cause of the issue, and resolve the issue.
This type of problem in this environment is often due to problems on the WAN interface. Use PerfStack to analyze the interface.
In this example, the Performance Analysis project includes the following metrics:
l Status to know whether the interface is up or whether the status is changing. l Average Transmit bps to investigate the amount of traffic. l Transmit Percent Utilization to investigate how close the interface is to being fully saturated. l Transmit Discards and Percent Discards to investigate discarded data.
Start your analysis with the Branch Office WAN router (BOWAN).
1. Click My Dashboards > Home > Performance Analysis.
2. Locate the interface:
a. In the Metric Palette, click Add Entities.
b. Enter the router name into the entity filter, select the router, and click Add Selected Items.
ADMINISTRATOR GUIDE: NETWORK PERFORMANCE MONITOR
page 171
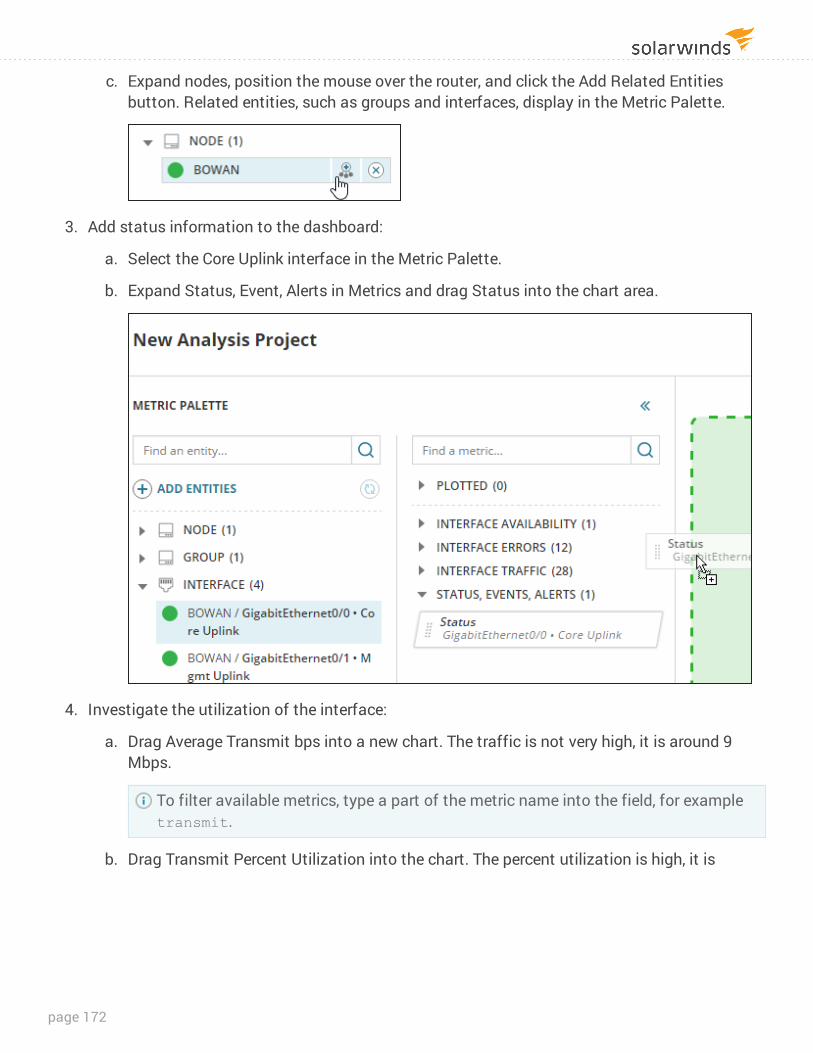
c. Expand nodes, position the mouse over the router, and click the Add Related Entities button. Related entities, such as groups and interfaces, display in the Metric Palette.
3. Add status information to the dashboard:
a. Select the Core Uplink interface in the Metric Palette.
b. Expand Status, Event, Alerts in Metrics and drag Status into the chart area.
4. Investigate the utilization of the interface:
a. Drag Average Transmit bps into a new chart. The traffic is not very high, it is around 9 Mbps.
To filter available metrics, type a part of the metric name into the field, for example transmit.
b. Drag Transmit Percent Utilization into the chart. The percent utilization is high, it is
page 172
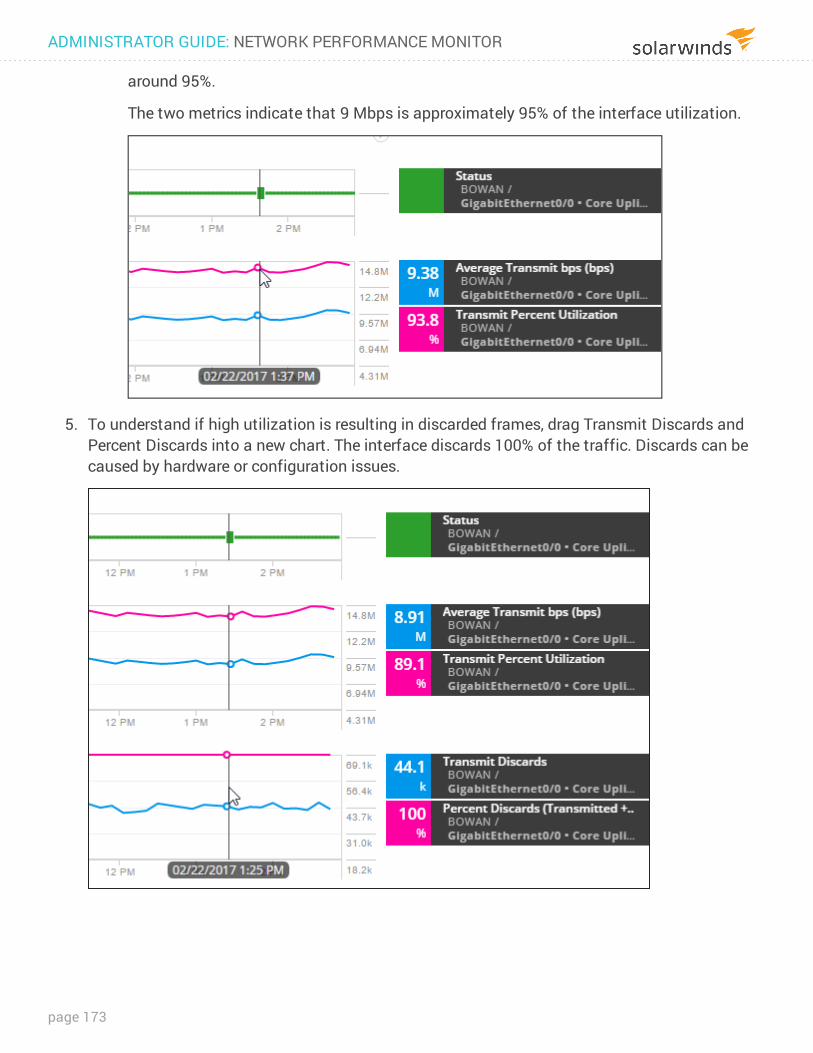
around 95%.
The two metrics indicate that 9 Mbps is approximately 95% of the interface utilization.
5. To understand if high utilization is resulting in discarded frames, drag Transmit Discards and Percent Discards into a new chart. The interface discards 100% of the traffic. Discards can be caused by hardware or configuration issues.
ADMINISTRATOR GUIDE: NETWORK PERFORMANCE MONITOR
page 173
6. To verify the configuration and acting state on the port, log in to the device and check the configuration. For example, go to the BOWAN details view, and click telnet in the Node Details resource.
In this example, you discover that the interface is configured to run at 10 Mb. However, it is a Gigabit interface and it should be running at 1,000 Mbps. Correct the configuration to resolve the issue.
l To share the dashboard, simply share the URL. The URL contains all data to recreate the view.
l To keep the featured metrics in the dashboard for later use, click Save and enter a name for the Performance Analysis project. You can click Load to view the project again.
page 174