Embed Size (px)
Citation preview

7
Solar Radiation Models and Information for Renewable Energy Applications
E. O. Falayi1 and A. B. Rabiu2 1Department of Physics, Tai Solarin University of Education, Ijebu-Ode,
2Department of Physics, Federal University of Technology, Akure, Nigeria
1. Introduction
The Sun is a sphere of intense hot gaseous matter with a diameter of 1.39 x 10⁹m and is about 1.5 x 10¹¹m away from the Earth. A schematic representation of the structure of the Sun is shown in Figure 1.1. The Sun’s core temperature is about 16 million K and has a density of about 160 times the density of water. The core is the innermost layer with 10 percent of the Sun’s mass, and the energy is generated from nuclear fusion. Because of the enormous amount of gravity compression from all the layers above it, the core is very hot and dense.
Fig. 1.1. The structure of the Sun
www.intechopen.com

Solar Radiation
112
The layer next to it is the radiative zone, where the energy is transported from the sunspot interior to the cold outer layer by photons. Other features of the solar surface are small dark areas called pores, which are of the same order of magnitude as the convective cells and larger dark areas called sunspots, which vary in size. The outer layer of the convective cells is called the photosphere. The photosphere is the layer below which the Sun becomes opaque to visible light. Above the photosphere is the visible sunlight which is free to propagate into space, and its energy escapes the Sun entirely. The change in opacity is due to the decreasing amount of H− ions, which absorb visible light easily. The next layer referred to as the chromospheres, is a layer of several thousand kilometers in thickness, consisting of transparent glowing gas above the photosphere. Many of the phenomena occurring in the photosphere also manifest in the chromospheres. Because the density in the chromospheres continues to decrease with height and is much lower than in the photosphere, the magnetic field and waves can have a greater influence on the structure. Still further out is the corona which is of very low density and has a high temperature of about 1×10⁶oK to 2×10⁶oK.
The radiation from the sun is the primary natural energy source of the planet Earth. Other natural energy sources are the cosmic radiation, the natural terrestrial radioactivity and the geothermal heat flux from the interior to the surface of the Earth, but these sources are energetically negligible as compared to solar radiation. When we speak of solar radiation, we mean the electromagnetic radiation of the Sun. The energy distribution of electromagnetic radiation over different wavelength is called Spectrum. The electromagnetic spectrum is divided into different spectral ranges (Figure 1.2).
Fig. 1.2. Spectral ranges of electromagnetic radiation
www.intechopen.com

Solar Radiation Models and Information for Renewable Energy Applications
113
Solar radiation as it passes through the atmosphere undergoes absorption and scattering by various constituents of the atmosphere. The amount of solar radiation finally reaching the surface of earth depends quite significantly on the concentration of airborne particulate matter gaseous pollutants and water (vapour, liquid or solid) in the sky, which can further attenuate the solar energy and change the diffuse and direct radiation ratio (Figure 1.3).
Fig. 1.3. Radiation balance of the atmosphere
The global solar radiation can be divided into two components: (1) diffuse solar radiation, which results from scattering caused by gases in the Earth’s atmosphere, dispersed water droplets and particulates; and (2) direct solar radiation, which have not been scattered. Global solar radiation is the algebraic sum of the two components. Values of global and diffuse radiations are essential for research and engineering applications.
Global solar radiation is of economic importance as renewable energy alternatives. More recently global solar radiation has being studied due to its importance in providing energy for Earth’s climatic system. The successful design and effective utilization of solar energy systems and devices for application in various facets of human needs, such as power and water supply for industrial, agricultural, domestic uses and photovoltaic cell largely depend on the availability of information on solar radiation characteristic of the location in which the system and devices are to be situated. This solar radiation information is also required in
www.intechopen.com

Solar Radiation
114
the forecast of the solar heat gain in building, weather forecast, agricultural potentials studies and forecast of evaporation from lakes and reservoir. However, the best solar radiation information is obtained from experimental measurement of the global and its components at the location. The use of solar energy has increased worldwide in recent years as direct and indirect replacements for fossil fuel, motivated to some degree by environmental concerns such were expressed in the Kyoto Protocol. As a result, a complete knowledge and detailed analysis about the potentiality of the site for solar radiation activity is of considerable interest.
1.2 Radiation fluxes at horizontal surface
The energy balance on a horizontal surface at the ground or on a solid body near the ground is given by
0 Q K H L W P (1.1)
Each term in this equation stands for an energy flux density or power density in Wm-2. The vectorial terms in equation (1.1) are counted positive when they are directed towards the surface from above or below. The parameters have the following meaning.
Q =net total radiation=sum of all positive and negative radiation fluxes to the surface
K Heat flux from the interior of the body (ground) to its surface H Sensible heat flux from the atmosphere due to molecular and convective heat conduction (diffusion and turbulence) L Latent heat flux due to condensation or evaporation at the surface. W= Heat flux due to advection that is heat transported by horizontal air current. W is set zero if:
a. the measuring surface is located at a horizontal and homogeneous plane of sufficient extension so that the so called Katabatic flow is negligible
b. the measuring time is small compared to time of an air mass exchange. P = Heat flux brought to the surface by falling precipitation. P is often not taken into consideration because the measurements are confined to times without precipitation (Kasten, 1983).
The net total radiation Q is at daytime, to be compensated by the heat fluxes K, H and L the
net total radiation Q in equation (1.1) given
Q G R A E (1.2)
Q is called the total radiation balance.
G= global radiation = sum of direct and diffuse solar radiation on the horizontal surface R= reflected global radiation = fraction of G which is reflected by the body (ground) A= atmospheric radiation = downward thermal radiation of the atmosphere (from atmosphere gases, mainly water vapour and from clouds) E= terrestrial surface radiation = upward thermal radiation of the body (ground). G and R are solar or shortwave radiation fluxes therefore
sQ G R (1.3)
www.intechopen.com

Solar Radiation Models and Information for Renewable Energy Applications
115
Is called net solar or net global radiation, or short wave radiation balance. A and E are terrestrial or long wave radiation fluxes so that
tQ A E (1.4)
Is called the long wave radiation balance and
tQ E A (1.5)
the (upward) net terrestrial surface radiation.
The short-wave radiation fluxes exhibit a pronounced variation during day light hours; the long-wave radiation fluxes vary but slightly because the temperature of atmosphere and ground vary during the day.
The ratio
sR
QG
(1.6)
is called short-wave radiation of the body
Terrestrial surface radiation E is composed of two terms:
1. The thermal radiation emitted by the body ground i.e.
4t tE T (1.7)
where t is called effective long-wave absorptance of the surface, slightly depending
on temperature T. is called Stefan Boltzman constant = 5.6697 x 10⁸ Wm-2K-4.
2. Reflected atmosphere radiation
2 tE Q A (1.8)
where 1t tQ = effective long-wave reflectance of the surface. Thus E is strictly
given by
41 2 (1 )t tE E E T A (1.9)
1.3 Solar declination angle
The angle that the Sun’s makes with equatorial plane at solar noon is called the angle of declination. It varies from 23.45o on June 21 to 0o on September 21 to -23.45o on December 21, to 0o on March 21. It also defined as the angular distance from the zenith of the observer at the equator and the Sun at solar noon.
The axis of rotation is tilted at an angle of 23.45° with respect to the plane of the orbit around the Sun. The axis is orientated so that it always points towards the pole star and this accounts for the seasons and changes in the length of day throughout the year. The angle between the equatorial plane and a line joining the centres of the Sun and the Earth is called
www.intechopen.com

Solar Radiation
116
the declination angle ( ) Because the axis of the Earth's rotation is always pointing to the Pole
Star the declination angle changes as the Earth orbits the Sun (Figure 1.4)
Fig. 1.4. Orbit of the Earth around the Sun
On the summer solstice (21st June) the Earth's axis is orientated directly towards the Sun, therefore the declination angle is 23.45° (Figure 1.4). All points below 66.55° south have 24 hours of darkness and all point above 66.55° north have 24 hours of daylight. The sun is directly over head at solar noon at all points on the Tropic of Cancer. On the winter solstice (21st December) the Earth's axis is orientated directly away from the Sun, therefore the declination angle is -23.45° (Figure 1.4). All points below 66.55° south have 24 hours of daylight and all point above 66.55° north have 24 hours of darkness. The sun is directly over head at solar noon at all points on the Tropic of Capricorn. At both the autumnal and vernal equinoxes (23rd September and 21st March respectively) the Earth's axis is at 90° to the line that joins the centres of the Earth and Sun, therefore the declination angle is 0° (Figure 1.4).
www.intechopen.com

Solar Radiation Models and Information for Renewable Energy Applications
117
Fig. 1.5. The celestial sphere. Declination angle ( ) is the declination angle which is
maximum at the solstices and zero at the equinoxes.
The equation used to calculate the declination angle in radians on any given day is
284
23.45 sin 2180 365.25
n (1.10)
where: = declination angle (rads)
n = the day number, such that n = 1 on the 1st January and 365 on December 31st.
Fig. 1.6. The variation in the declination angle throughout the year.
www.intechopen.com

Solar Radiation
118
The declination angle is the same for the whole globe on any given day. Figure 1.6 shows the change in the declination angle throughout a year. Because the period of the Earth's complete revolution around the Sun does not coincide exactly with the calendar year the declination varies slightly on the same day from year to year.
1.4 Solar hour angle
The hour angle is positive during the morning, reduces to zero at solar noon and increasingly negative when the afternoon progresses. The following equations can be used to obtain the hourly angle when various values of the angles are known.
cos sin
sincos
zAw
(1.11)
sin sin sin
sincos cos
w
(1.12)
Where = altitude angle
w = the hour angle
Az = the solar azimuth angle
= observer angle
= declination angle
The hour angle is equals to zero at solar noon and since the hour angle changes at 15° per hour, the hour angle can be calculated at any time of day. The hour angles at sunrise (negative angle) and sunset (ws) is positive angle. They are important parameters and can be calculated from
cos tan tanws (1.13)
1cos tan tanws (1.14)
12cos tan tan
15L (1.15)
This L is known as the Length of the day also known as the maximum number of hour of
insolation.
1.5 Solar constant
The solar constant is defined as the quantity of solar energy (W/m²) at normal incidence
outside the atmosphere (extraterrestrial) at the mean sun-earth distance. Its mean value is
1367 W/m². The solar constant actually varies by +/- 3% because of the Earth's elliptical
orbit around the Sun. The sun-earth distance is smaller when the Earth is at perihelion
(first week in January) and larger when the Earth is at aphelion (first week in July). Some
www.intechopen.com

Solar Radiation Models and Information for Renewable Energy Applications
119
people, when talking about the solar constant, correct for this distance variation, and refer
to the solar constant as the power per unit area received at the average Earth-solar
distance of one “Astronomical Unit” or AU which is 1.49 x 10⁸ million kilometres (IPS and
Radio Services).
2. Empirical equations for predicting the availability of solar radiation
2.1 Angstrom-type model
Average daily global radiation at a specific location can be estimated by the knowledge of
the average actual sunshine hours per day and the maximum possible sunshine hour per
day at the location. This is done by a simple linear relation given by Angstrom (1924) and
modified by (Prescott, 1924).
maxO
G Sa b
G S
(2.1)
In Nigeria, the hourly global solar radiation were obtained through Gun Bellani distillate,
and were converted and standardized after Folayan (1988), using the conversion factor
calculated from the following equations.
2(1.35 0.176) /GBG H KJ m (2.2)
Where G is the monthly average of the daily global solar radiation on a horizontal surface at
a location (KJ/m2-day), G0 is the average extraterrestrial radiation (KJ/m2-day). S is the
monthly average of the actual sunshine hours per day at the location. Smax monthly average
of the maximum possible sunshine hours per day, n is mean day of each month.
224 3600 360
1 0.033365 360
So S
WnG Gsc Cos Cos Cos SinW Sin Sin
(2.3)
1max
2cos tan tan
15S (2.4)
Several researchers have determined the applicability of the Angstrom type regression
model for predicting global solar irradiance (Akpabio et al., 2004; Ahmad and Ulfat, 2004;
Sambo, 1985; Sayigh, 1993; Fagbenle, 1990; Akinbode, 1992; Udo, 2002; Okogbue and
Adedokun, 2002; Halouani et al., 1993; Awachie and Okeke, 1990; El –Sebaii and Trabea;
2005, Falayi and Rabiu, 2005; Serm and Korntip, 2004; Gueymard and Myers, 2009; Skeiker,
2006; Falayi et al., 2011 ). Of recent (Akpabio and Etuk 2002; Falayi et al., 2008; Bocco et al.,
2010; Falayi et al., 2011) have developed a multiple linear regression model with different
variables to estimate the monthly average daily global. Also, prognostic and prediction
models based on artificial intelligence techniques such as neural networks (NN) have been
developed. These models can handle a large number of data, the contribution of these in the
outcome can provide exact and adequate forecast (Krishnaiah, 2007; Adnan, 2004; Lopez,
2000; Mohandes et al., 2000).
www.intechopen.com

Solar Radiation
120
2.2 Method of model evaluation
2.2.1 Correlation coefficient (r)
Correlation is the degrees of relationship between variables and to describe the linear or
other mathematical model explain the relationship. The regression is a method of fitting the
linear or nonlinear mathematical models between a dependent and a set of independent
variables. The square root of the coefficient of determination is defined as the coefficient of
correlation r. It is a measure of the relationship between variables based on a scale 1.
Whether r is positive or negative depends on the inter-relationship between x and y, i.e.
whether they are directly proportional (y increases and x increases) or vice versa (Muneer,
2004).
2.2.2 Correlation of determination (r2)
The ratio of explained variation, (Gpred - Gm)2, to the total variation, (Gobser - Gm)2, is called
the coefficient of determination. Gm is the mean of the observed G values. The ratio lies
between zero and one. A high value of r2 is desirable as this shows a lower unexplained
variation.
2.2.3 Root mean square error, mean bias error and mean percentage error
The root mean square error (RMSE) gives the information on the short-term performance of
the correlations by allowing a term-by-term comparison of the actual deviation between the
estimated and measured values. The lower the RMSE, the more accurate is the estimate. A
positive value of mean bias error (MBE) shows an over-estimate while a negative value an
under-estimate by the model. MPE gives long term performance of the examined regression
equations, a positive MPE values provides the averages amount of overestimation in the
calculated values, while the negatives value gives underestimation. A low value of MPE is
desirable (Igbai, 1983).
1pred obsMBE G G
n (2.5)
1
221pred obsRMSE G G
n
(2.6)
100 /obs pred
obs
G GMPE n
G
(2.7)
3. Monthly mean of horizontal global irradiation
Monthly mean global solar radiation data leads to more accurate modelling of solar energy processes. Several meteorological stations publish their data in terms of monthly-averaged values of daily global irradiation. Where such measurements are not available, it may be
www.intechopen.com
Solar Radiation Models and Information for Renewable Energy Applications
121
possible to obtain them from the long-term sunshine data via models presented in Chapter 2.
3.1 Monthly variation of extraterrestrial and terrestrial solar radiation
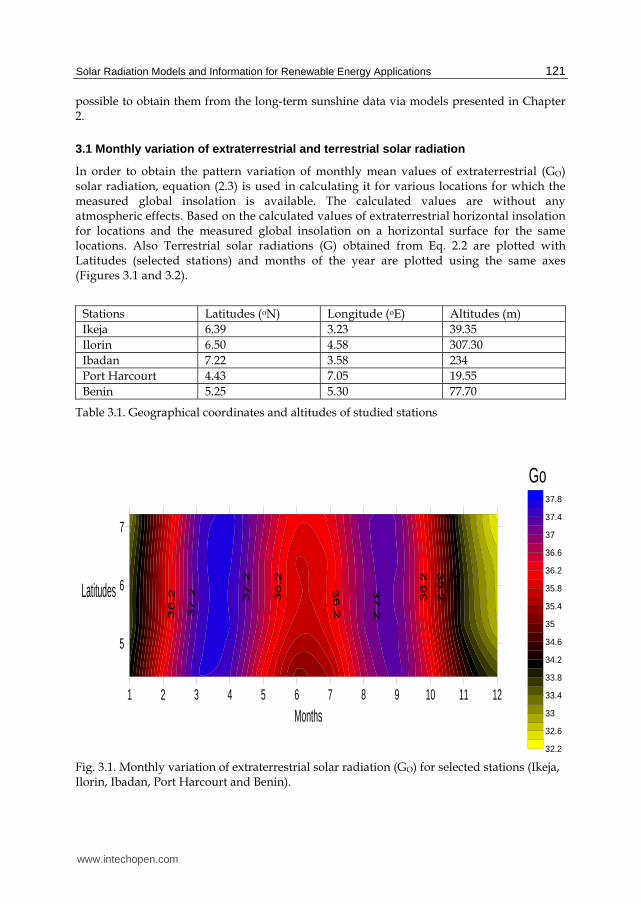
In order to obtain the pattern variation of monthly mean values of extraterrestrial (GO) solar radiation, equation (2.3) is used in calculating it for various locations for which the measured global insolation is available. The calculated values are without any atmospheric effects. Based on the calculated values of extraterrestrial horizontal insolation for locations and the measured global insolation on a horizontal surface for the same locations. Also Terrestrial solar radiations (G) obtained from Eq. 2.2 are plotted with Latitudes (selected stations) and months of the year are plotted using the same axes (Figures 3.1 and 3.2).
Stations Latitudes (oN) Longitude (oE) Altitudes (m)
Ikeja 6.39 3.23 39.35
Ilorin 6.50 4.58 307.30
Ibadan 7.22 3.58 234
Port Harcourt 4.43 7.05 19.55
Benin 5.25 5.30 77.70
Table 3.1. Geographical coordinates and altitudes of studied stations
1 2 3 4 5 6 7 8 9 10 11 12
5
6
7
32.2
32.6
33
33.4
33.8
34.2
34.6
35
35.4
35.8
36.2
36.6
37
37.4
37.8
Months
Latitudes
Go
Fig. 3.1. Monthly variation of extraterrestrial solar radiation (GO) for selected stations (Ikeja, Ilorin, Ibadan, Port Harcourt and Benin).
www.intechopen.com

Solar Radiation
122
1 2 3 4 5 6 7 8 9 10 11 12
5
6
7
10.51111.51212.51313.51414.51515.51616.51717.51818.51919.52020.521
Months
Latitudes
G
Fig. 3.2. Monthly variation of terrestrial solar radiation (G) for selected stations (Ikeja, Ilorin, Ibadan, Port Harcourt and Benin).
3.2 Monthly variation of Clearness Index
Clearness index (KT) is defined as the ratio of the observation/measured horizontal
terrestrial solar radiation (G), to the calculated/predicted horizontal extraterrestrial solar
radiation (Go). Clearness index is a measure of solar radiation extinction in the atmosphere,
which includes effects due to clouds but also effects due to radiation interaction with other
atmospheric constituents. To develop the model for the clearness index, the insolation on a
horizontal surface for a few locations is measured over a period of time encompassing all
seasons and climatic conditions. Different values of the clearness index at different stations
may be as a result of different atmospheric contents of water vapour and aerosols. It can be
seen from the above expressions that the extra-terrestrial horizontal insolation is a function
of latitude and the day of year only. Hence, it can be calculated for any location for any
given day. However, the calculated insolation does not take any atmospheric effects into
account
TO
GK
G (3.1)
www.intechopen.com
Solar Radiation Models and Information for Renewable Energy Applications
123
1 2 3 4 5 6 7 8 9 10 11 12
5
6
7
0.29
0.31
0.33
0.35
0.37
0.39
0.41
0.43
0.45
0.47
0.49
0.51
0.53
0.55
0.57
0.59
Months
Latitudes
KT
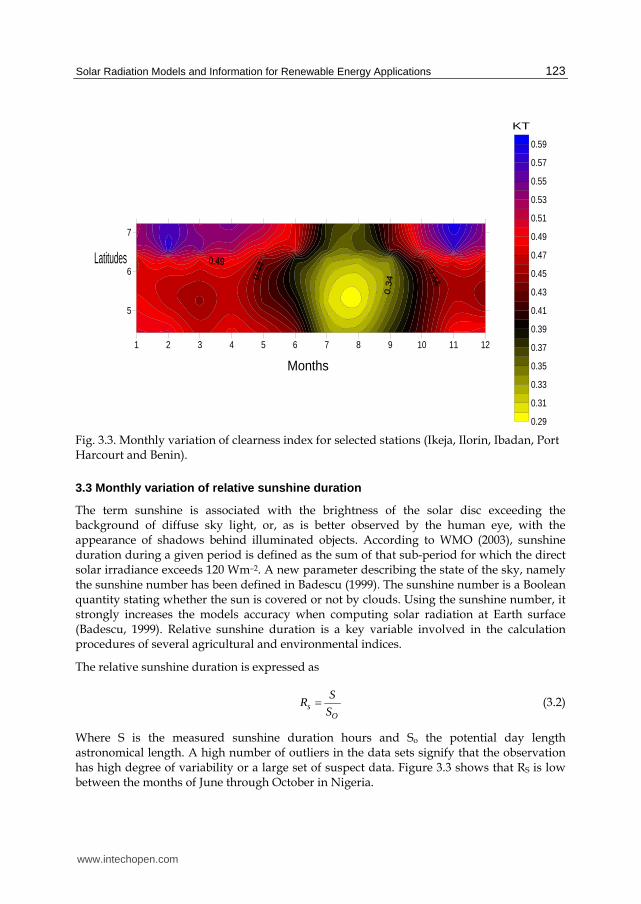
Fig. 3.3. Monthly variation of clearness index for selected stations (Ikeja, Ilorin, Ibadan, Port Harcourt and Benin).
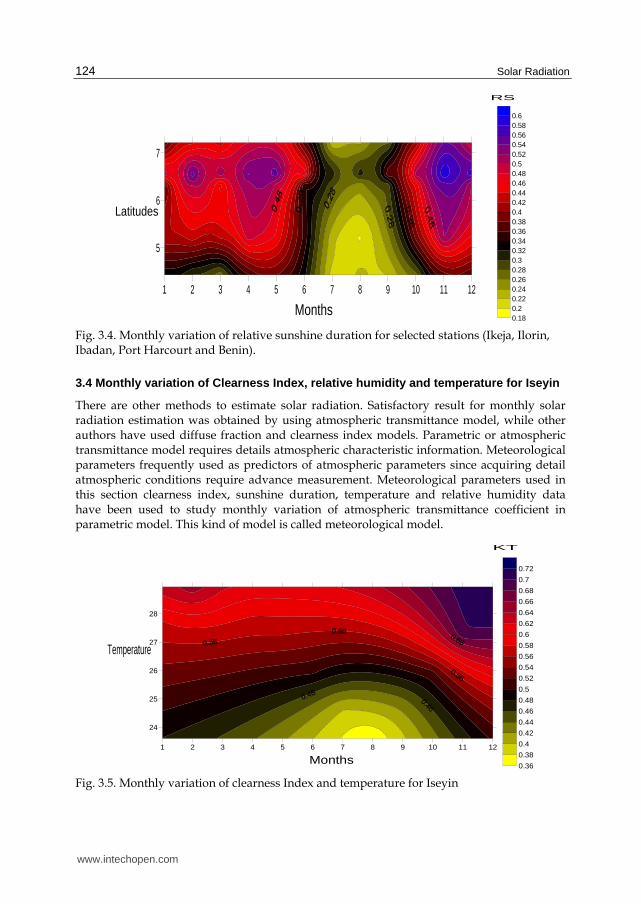
3.3 Monthly variation of relative sunshine duration
The term sunshine is associated with the brightness of the solar disc exceeding the background of diffuse sky light, or, as is better observed by the human eye, with the appearance of shadows behind illuminated objects. According to WMO (2003), sunshine duration during a given period is defined as the sum of that sub-period for which the direct solar irradiance exceeds 120 Wm–2. A new parameter describing the state of the sky, namely the sunshine number has been defined in Badescu (1999). The sunshine number is a Boolean quantity stating whether the sun is covered or not by clouds. Using the sunshine number, it strongly increases the models accuracy when computing solar radiation at Earth surface (Badescu, 1999). Relative sunshine duration is a key variable involved in the calculation procedures of several agricultural and environmental indices.
The relative sunshine duration is expressed as
sO
SR
S (3.2)
Where S is the measured sunshine duration hours and So the potential day length astronomical length. A high number of outliers in the data sets signify that the observation has high degree of variability or a large set of suspect data. Figure 3.3 shows that RS is low between the months of June through October in Nigeria.
www.intechopen.com
Solar Radiation
124
1 2 3 4 5 6 7 8 9 10 11 12
5
6
7
0.180.20.220.240.260.280.30.320.340.360.380.40.420.440.460.480.50.520.540.560.580.6
Months
Latitudes
RS
Fig. 3.4. Monthly variation of relative sunshine duration for selected stations (Ikeja, Ilorin, Ibadan, Port Harcourt and Benin).
3.4 Monthly variation of Clearness Index, relative humidity and temperature for Iseyin
There are other methods to estimate solar radiation. Satisfactory result for monthly solar radiation estimation was obtained by using atmospheric transmittance model, while other authors have used diffuse fraction and clearness index models. Parametric or atmospheric transmittance model requires details atmospheric characteristic information. Meteorological parameters frequently used as predictors of atmospheric parameters since acquiring detail atmospheric conditions require advance measurement. Meteorological parameters used in this section clearness index, sunshine duration, temperature and relative humidity data have been used to study monthly variation of atmospheric transmittance coefficient in parametric model. This kind of model is called meteorological model.
1 2 3 4 5 6 7 8 9 10 11 12
24
25
26
27
28
0.36
0.38
0.4
0.42
0.44
0.46
0.48
0.5
0.52
0.54
0.56
0.58
0.6
0.62
0.64
0.66
0.68
0.7
0.72
Months
Temperature
KT
Fig. 3.5. Monthly variation of clearness Index and temperature for Iseyin
www.intechopen.com

Solar Radiation Models and Information for Renewable Energy Applications
125
1 2 3 4 5 6 7 8 9 10 11 12
24
25
26
27
28
59
61
63
65
67
69
71
73
75
77
79
81
83
85
87
89
Months
Temperature
Relative Humidity (%)
Fig. 3.6. Monthly variation of clearness Index and temperature for Iseyin
4. Variation of diffuse solar radiation
Several models for estimating the diffuse component based on the pioneer works of Angstrom (1924) and Liu and Jordan (1960) and developed by Klein (Klein, 1977). These models are usually expressed in either linear or polynomial fittings relating the diffuse fraction (Hd) with the clearness index and combining both clearness index (KT) and relative sunshine duration (Orgill and Hollands, 1977; Erbs et al., 1982; Trabea, 1992; Jacovides, 2006; Hamdy, 2007, Falayi et al., 2011) established hourly correlations between KT and Hd under diverse climatic conditions. Ulgen and Hepbasli (2002) correlated the ratio of monthly average hourly diffuse solar radiation to monthly average hourly global solar radiation with the monthly average hourly clearness index in form of polynomial relationships for the city of Izmir, Turkey. Oliveira et al., (2002) used measurements of global and diffuse solar radiations in the City of Sao Paulo (Brazil) to derive empirical models to estimate hourly, daily and monthly diffuse solar radiation from values of the global solar radiation, based on the correlation between the diffuse fraction and clearness index
The diffuse solar radiation Hd can be estimated by an empirical formula which correlates the diffuse solar radiation component Hd to the daily total radiation H. The ratio, Hd/H, therefore, is an appropriate parameter to define a coefficient, that is, cloudiness or turbidity of the atmosphere. The correlation equation which is widely used is developed by Page (Page, 1964).
1.00 1.13dT
HK
H (4.1)
Another commonly used correlation is due to Liu and Jordan (1960) and developed by Klein (Klein, 1977) and is given by
2 31.390 4.027 5.53 3.108d
T TH
K K KTH
(4.2)
www.intechopen.com
Solar Radiation
126
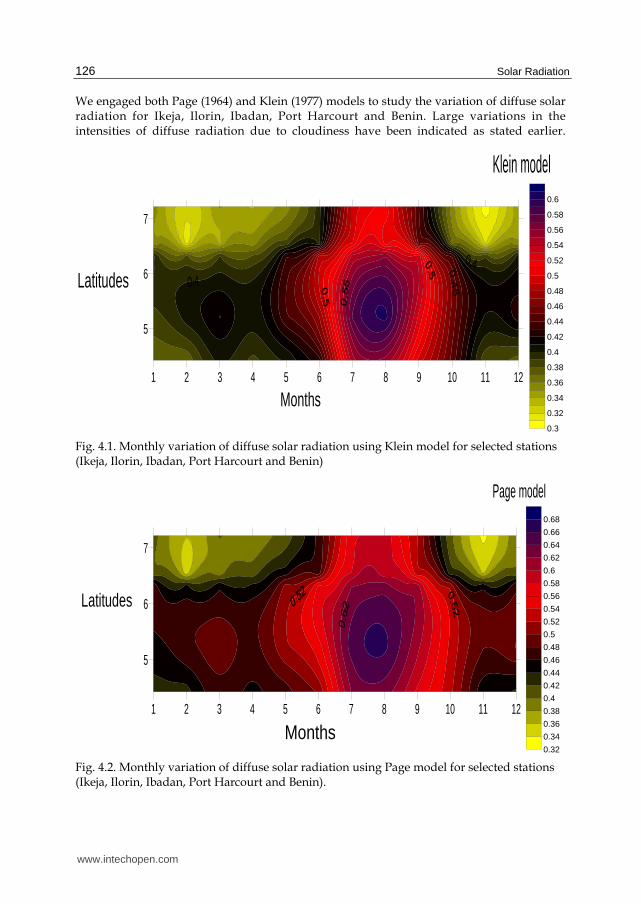
We engaged both Page (1964) and Klein (1977) models to study the variation of diffuse solar radiation for Ikeja, Ilorin, Ibadan, Port Harcourt and Benin. Large variations in the intensities of diffuse radiation due to cloudiness have been indicated as stated earlier.
1 2 3 4 5 6 7 8 9 10 11 12
5
6
7
0.3
0.32
0.34
0.36
0.38
0.4
0.42
0.44
0.46
0.48
0.5
0.52
0.54
0.56
0.58
0.6
Months
Klein model
Latitudes
Fig. 4.1. Monthly variation of diffuse solar radiation using Klein model for selected stations (Ikeja, Ilorin, Ibadan, Port Harcourt and Benin)
1 2 3 4 5 6 7 8 9 10 11 12
5
6
7
0.32
0.34
0.36
0.38
0.4
0.42
0.44
0.46
0.48
0.5
0.52
0.54
0.56
0.58
0.6
0.62
0.64
0.66
0.68
Months
Latitudes
Page model
Fig. 4.2. Monthly variation of diffuse solar radiation using Page model for selected stations (Ikeja, Ilorin, Ibadan, Port Harcourt and Benin).
www.intechopen.com

Solar Radiation Models and Information for Renewable Energy Applications
127
The results of the variation are plotted in Figures 4.1 and 4.2 exhibit the trend variation of diffuse solar radiation. The maxima of diffuse radiation for the month of July - September are quite appreciable. This means that there was a high proportion of cloudy days and relatively low solar energy resource in July –September across the locations, and there was high proportion of sunshine days and relatively abundant solar energy resource between the month of April and October across the stations. This wet season is expected due to poor sky conditions caused atmospheric controls as the atmosphere is partly cloudy and part of solar radiation are scattered by air molecules. The presence of low values of diffuse solar radiation in Figures 4.1 and 4.2 will be very useful for utilizing it for solar concentrators, solar cookers and solar furnaces etc.
5. Conclusion
The global solar radiation incident on a horizontal or inclined surface is estimated by establishing the sky conditions. Monthly variation of clearness index (KT), diffuse ratio (KD), Temperature and the relative sunshine duration (RS) were employed in this study. Klein and Page model were used in this study to examine the variation of diffuse solar radiation for Iseyin, as no station in Iseyin measures diffuse solar radiation.
6. Acknowledgement
The authors are grateful to the management of Nigeria Meteorological Agency, Oshodi, Lagos State for making the data of global solar radiation, sunshine duration, minimum and maximum temperature and relative humidity available.
7. References
Adnan Sozen, Erol Arcakliogulu and Mehmet Ozalp, 2004. Estimation of Solar Potential in
Turkey by artificial neural networks using meteorological and geographical data.
Energy Conversion and Management, 45: 3033-3052.
Ahmad F, Ulfat, I (2004). Empirical models for the correlation of monthly average daily solar
radiation with hours of sunshine on a horizontal surface at Karachi, Pakistan.
Turkish J. Physics, 28: 301-307.
Akinbode FO (1992). Solar radiation in Mina: A correlation with Meteorological data, Nig. J.
Renewable Energy, 3: 9-17.
Akpabio L.E, Udo S.O, Etuk S.E (2004). Empirical correlation of global solar radiation with
Meteorological data for Onne, Nigeria. Turkish J.Physics, 28: 222-227.
Akpabio LE, Etuk SE (2002). Relationship between solar radiation and sunshine duration for
Onne Nigeria. Turkish J. Physics, 27: 161-167.
Almorox J, Benito M, Hontoria C (2005). Estimation of monthly Angstrom – Prescott
equation coefficients from measured daily data in Toledo, Spain. Renewable
Energy Journal, 30: 931-936.
Angstrom A.S (1924). Solar and terrestrial radiation meteorological society 50: 121-126.
Awachie I.R.N, Okeke C.E (1990). New empirical model and its use inpredicting global solar
irradiation. Nig. J. Solar Energy, 9: 143-156.
www.intechopen.com

Solar Radiation
128
Badescu, V., 1999. Correlations to estimate monthly mean daily solar global irradiation:
application to Romania,” Energy, vol. 24, no. 10, pp. 883–893.
Bocco Mónica, Enrique Willington, and Mónica Arias. Comparison of regression and neural
networks models to estimate solar radiation. Chilean Journal of Agriculture
Research: 70(3): 428-435
Burari, F.W, Sambo A.S (2001). Model for the prediction of global solar radiation for Bauchi
using Meteorological Data. Nig. J. Renewable Energy, 91: 30-33.
Chandel SS, Aggarwal RK, Pandey AN (2005). New correlation to estimate global solar
radiation on horizontal surface using sunshine duration and temperature data for
Indian sites. J. solar engineering, 127(3): 417-420.
Che H.Z, Shi G.Y, Zhang X.Y, Zhao J.Q, Li Y (2007). Analysis of sky condition using 40
years records of solar radiation data in china. Theoretical and applied climatology.
89: 83-94.
Duffie J.A, Beekman W.A (1994). Solar Engineering of Thermal Processes, 2nd Edition. John
Wiley, New York.
EL-Sebaii A.A and Trabea AA (2005). Estimation of global solar radiation on horizontal
surfaces over Egypt, Egypt J. Solids, 28:163- 175.
Erbs DG, Klein S. A and Duffie J. A., 1982. Estimation of the diffuse radiation fraction for
hourly, daily and monthly average global radiation. Sol Energ y,28:293–302.
Fagbenle R.O (1990). Estimation of total solar radiation in Nigeria using meteorological data
Nig. J. Renewable Energy,14: 1-10.
Falayi E.O, Rabiu AB (2005). Modeling global solar radiation using sunshine duration data.
Nig. J. Physics, 17S: 181-186.
Falayi, E.O., J.O. Adepitan and A.B. Rabiu, 2008. Empirical models for the correlation of
global solar radiation with meteorological data for Iseyin. Nigeria Int. J. Phys. Sci.,
3(9): 210-216.
Falayi, E.O., Rabiu, A.B and Teliat, R.O. 2011. Correlations to estimate monthly mean of
daily diffuse solar radiation in some selected cities in Nigeria. Advances in Applied
Science Research, 2 (4):480-490. Pelagia Research Library.
Folayan CO (1988). Estimation On Global Solar Radiation Bound for some Nigeria Cities.
Nigeria J. Solar Energy, 3: 3-10.
Gueymard, C.A., Myers, D.R., 2009. Evaluation of conventional and high-performance
routine solar radiation measurements for improved solar resource, climatological
trends, and radiative modeling. Solar Energy 83, 171–185.
Halouani M, Nguyen CT, Vo Ngoc D (1993). Calculation of monthly average global solar
radiation on horizontal for station five using daily hour of bright sunshine, Solar
Energy,pp 50: 247-255.
Hamdy K. E., (2007).Experimental and theoretical investigation of diffuse solar radiation:
Data and models quality tested for Egyptian sites. Energy 32, 73–82
http://www.ips.gov.au/Category/Educational/The%20Sun%20and%20Solar%20Activity/
General%20Info/Solar_Constant.pdf
Igbal M (1993). An Introduction to solar radiation Academic press. New York pp. 59-67.
www.intechopen.com

Solar Radiation Models and Information for Renewable Energy Applications
129
Jacovides, C.P., Tymvios, F.S., Assimakopoulos V.D and Kaltsounides, N.A., 2006.
Comparative study of various correlations in estimating hourly diffuse fraction of
global solar radiation. Renewable Energy 31, 2492–2504.
Klein S. A. Calculation of monthly average insulation on tilted surfaces. Sol Energy 1977;
43(3):153–68.
Krishnaiah, T., Srinivasa Rao, S., Madhumurthy, K., Reddy, K.S., Neural Network Approach
for Modelling Global Solar Radiation. Journal of Applied Sciences Research, 3(10):
1105-1111, 2007
Liu B.Y.H and Jordan R.C. 1960. The interrelationship and characteristic distribution of
direct, diffuse and total solar radiation. Sol Energy 1960; 4:1–19.
Lopez, G., M. Martinez, M.A. Rubio, J. Torvar, J. Barbero and F.J. Batlles, 2000. Estimation of
hourly diffuse fraction using a neural network based model. In the Proceedings of
the 2000 Asamblea Hispano-Portugusea de Geodisia y Geofisica, Lagos, Portugal,
pp: 425-426.
Mohandes, M., A. Balghonaim, M. Kassas, S. Rehman and T.O. Halawani, 2000. Use of
radial basis functions for estimating monthly mean daily solar radiation. Solar
Energy, 68(2): 161-168.
Munner, T., Solar Radiation and Daylight Models. Second edition 2004, Grear Britain, 61-70.
Okogbue E.C, Adedokun J.A (2002). On the estimation of solar radiation at Ondo, Nigeria.
NiG. J. Physics, 14: 97-99.
Oliveira A.P, Escobedo J.F, Machado A.J, Soares J. 2002. Correlation models of diffuse solar
radiation applied to the city of Sao Paulo, Brazil. Appl Energy, 71: 59–73.
Orgill J.F and Holland K.G.T. 1977.Correlation equation for hourly diffuse radiation on a
horizontal surface. Sol Energy,19:357–9.
Page, J.K., 1964. The estimation of monthly mean values of daily total short - wave radiation
on vertical and inclined surfaces from sunshine records for latitude 40ºN-40ºS.
Proceeding of the UN Conference on New Sources of Energy, Paper S/98.
Prescott JA (1940). Evaporation from a water surface in relation to solar radiation. Tran. R.
Soc. S. Austr. 64: 114-118.
Sambo AS (1985). Solar radiation in Kano. A correlation with meteorological data. Nig. J.
Solar Energy, 4: 59-64.
Sayigh AA (1993). Improved Statistical procedure for the Evaluation of solar radiation
Estimating models. Solar Energy, 51: 289-291.
Serm J and Korntip T (2004). A model for the Estimation of global solar radiation from
sunshine duration in Thailand. The joint international conference on Suitable
energy and environment (SEE), pp. 11-14.
Skeiker K (2006). Correlation of global solar radiation with common geographical and
meteorological parameters for Damascus province, Syria. Energy conversion and
management, 47: 331-345.
Sodha M.S, Bansal N.K, Kumar K.P and Mali A.S (1986). Solar Passive building: Science and
design persanon Press, pp. 1-16.
Trabea A. A., 1999. Multiple linear correlations for diffuse radiation from global solar
radiation and sunshine data over Egypt. Renewable Energy 17: 411–20.
www.intechopen.com

Solar Radiation
130
Udo SO (2002). Contribution to the relationship between solar radiation of sunshine
duration to the tropics, A case study of experimental data at Ilorin Nigeria, Turkish
J. Physics 26: 229-336.
Ulgen, K. and A. Hepbasli, 2002. Estimation of solar radiation parameters for Izmir, Turkey.
Int. J. Energy Res., 26: 807-823.
WMO (2008) Guide to meteorological instruments and methods of observation, WMO-No.8.
http://www.wmo.int/
Zhou J, Yezheng W, Gang Y (2004). Estimation of daily diffuse solar radiation in China.
Renewable energy, 29: 1537-1548.
www.intechopen.com

Solar RadiationEdited by Prof. Elisha B. Babatunde
ISBN 978-953-51-0384-4Hard cover, 484 pagesPublisher InTechPublished online 21, March, 2012Published in print edition March, 2012
InTech EuropeUniversity Campus STeP Ri Slavka Krautzeka 83/A 51000 Rijeka, Croatia Phone: +385 (51) 770 447 Fax: +385 (51) 686 166www.intechopen.com
InTech ChinaUnit 405, Office Block, Hotel Equatorial Shanghai No.65, Yan An Road (West), Shanghai, 200040, China
Phone: +86-21-62489820 Fax: +86-21-62489821
The book contains fundamentals of solar radiation, its ecological impacts, applications, especially inagriculture, architecture, thermal and electric energy. Chapters are written by numerous experienced scientistsin the field from various parts of the world. Apart from chapter one which is the introductory chapter of thebook, that gives a general topic insight of the book, there are 24 more chapters that cover various fields ofsolar radiation. These fields include: Measurements and Analysis of Solar Radiation, Agricultural Application /Bio-effect, Architectural Application, Electricity Generation Application and Thermal Energy Application. Thisbook aims to provide a clear scientific insight on Solar Radiation to scientist and students.
How to referenceIn order to correctly reference this scholarly work, feel free to copy and paste the following:
E. O. Falayi and A. B. Rabiu (2012). Solar Radiation Models and Information for Renewable EnergyApplications, Solar Radiation, Prof. Elisha B. Babatunde (Ed.), ISBN: 978-953-51-0384-4, InTech, Availablefrom: http://www.intechopen.com/books/solar-radiation/solar-radiation-models-and-information-for-renewable-energy-applications

© 2012 The Author(s). Licensee IntechOpen. This is an open access articledistributed under the terms of the Creative Commons Attribution 3.0License, which permits unrestricted use, distribution, and reproduction inany medium, provided the original work is properly cited.