Embed Size (px)
Citation preview
11
Solar Radiation Effect on Crop Production
Carlos Campillo, Rafael Fortes and Maria del Henar Prieto Centro de Investigación finca la Orden-Valdesequera
Spain
1. Introduction
Solar radiation is the set of electromagnetic radiation emitted by the Sun. The Sun behaves almost like a black body which emits energy according to Planck's law at a temperature of 6000 K. The solar radiation ranges goes from infrared to ultraviolet. Not all the radiation reaches Earth's surface, because the ultraviolet wavelengths, that are the shorter wavelengths, are absorbed by gases in the atmosphere, primarily by ozone.
The atmosphere acts as a filter to the bands of solar spectrum, and at its different layers as solar radiation passes through it to the Earth's surface, so that only a fraction of it reaches the surface. The atmosphere absorbs part of the radiation reflects and scatters the rest some directly back to space, and some to the Earth, and then it is irradiated. All of this produce a thermal balance, resulting in radiant equilibrium cycle (figure 1).
Fig. 1. Effects of clouds on the Earth's Energy Budget. This image is from a NASA site
www.intechopen.com
Solar Radiation
168
Depending on the type of radiation, it is known that the 324 Wm-2 reaching the Earth in the upper atmosphere (1400 Wm-2 is the solar constant), 236 Wm-2 are reissued into space infrared radiation, 86 Wm-2 are reflected by the clouds and 20 Wm-2 are reflected by the ground as short-wave radiation. But part of the re-emitted energy is absorbed by the atmosphere and returned to the earth surface, causing the "greenhouse effect".
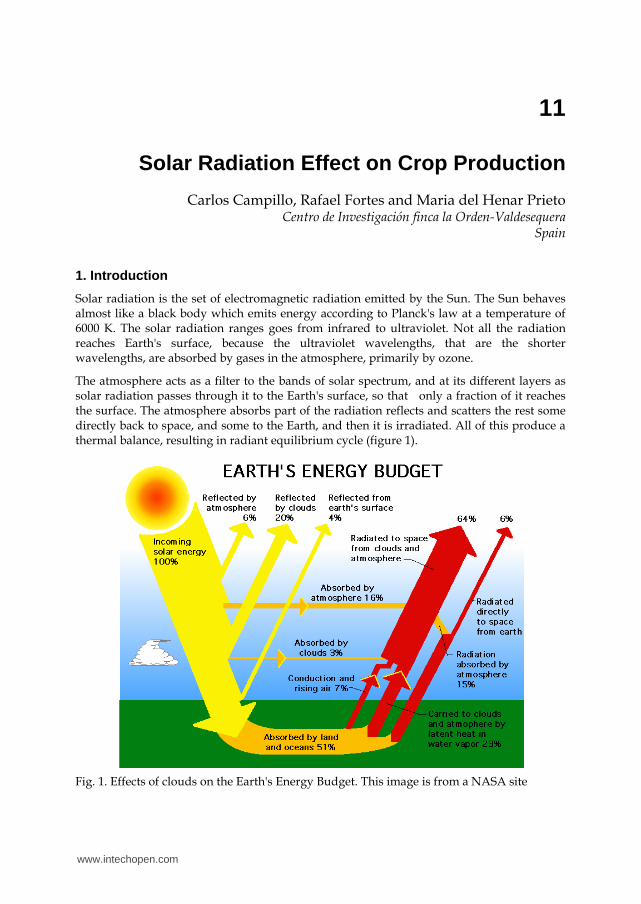
The average energy that reaches the outside edge of the atmosphere from the sun is a fixed amount, called solar constant. The energy contains between the 200 and 4000 nm wavelengths and it is divided into ultraviolet radiation, visible light and infrared radiation.
Ultraviolet radiation: Consists of the shorter wavelengths band (360 nm), it has a lot of energy and interacts with the molecular bonds. These waves are absorbed by the upper atmosphere, especially by the ozone layer.
Visible Light: This radiation band corresponds to the visible area with wavelengths between 360 nm (violet) and 760 nm (red), it has a great influence on living beings.
Infrared radiation: Consists of wavelengths between 760 and 4000 nm, it corresponds to the longer wavelengths and it has little energy associated with it. Its absorption increases molecular agitation, causing the increase of temperature.
Fig. 2. Spectrum of solar radiation above the atmosphere and sea level. prepared by Robert A. Rohde as part of the Global Warming Art project
Solar radiation on the earth can be classified as:
Direct radiation: This radiation comes directly from the sun without any change in its direction. This type of radiation is characterized by projecting defined shadow onto the objects that intersect.
www.intechopen.com
Solar Radiation Effect on Crop Production
169
Diffuse radiation: This radiation comes from all over the atmosphere as a result of reflection and scattering by clouds, particles in the atmosphere, dust, mountains, trees, buildings, the ground itself, and so on. Global radiation: Is the total radiation. It is the sum of the two radiations above. On a clear day with a clear sky, the direct radiation is predominant above the diffuse radiation.
Animals with thermoregulatory abilities and mobility can seek or avoid certain features of current weather. In contrast, terrestrial plants are rooted in place and must accept that the rates of their metabolic processes are determined by the ambient conditions.
Crop communities exert a strong influence over their local microenvironment. Nearly all cropping practices are geared toward, or have the effect of, modifying chemical and physical aspects of that environment (aerial and soils properties).
One of the most important factors that influences plants development is the solar radiation intercepted by the crop. The solar radiation brings energy to the metabolic process of the plants. The principal process is the photosynthetic assimilation that makes synthesize vegetal components from water, CO2 and the light energy possible. A part of this, energy is used in the evaporation process inside the different organs of the plants, and also in the transpiration through the stomas.
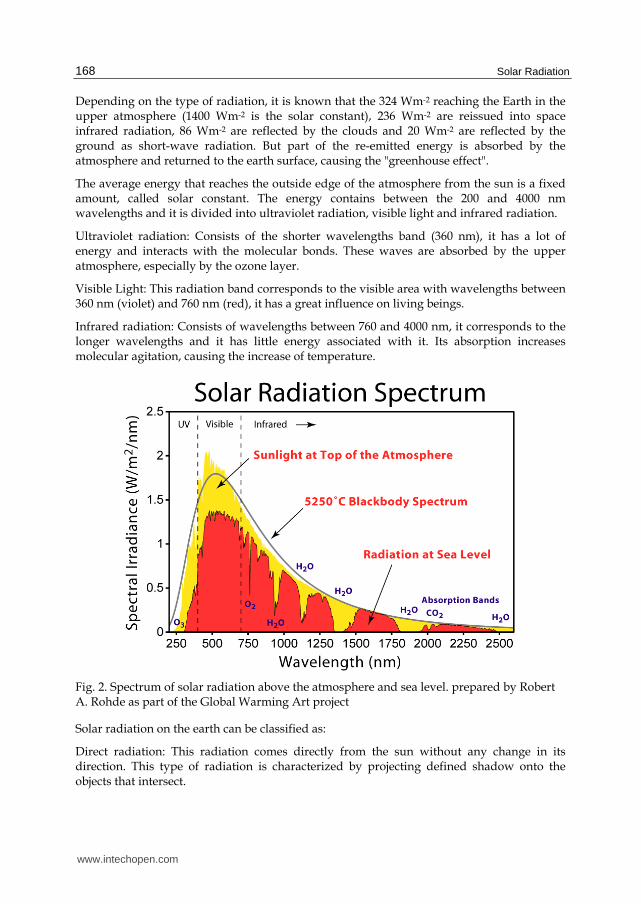
Photosynthesis is a chemical process that converts carbon dioxide into organic compounds, especially sugars, using the energy from sunlight. Depending on how carbon dioxide is fixed the plants can be grouped into three types: C3, C4, and CAM. The C3 plants are the more usual superior plants, which are the temperate weather crops (wheat, barley and sunflower, etc); the C4 category are species from arid weathers or hotter or tropical weathers (corn, sugar or sorghum). The C3 type are generally considered less productive than C4 (figure 3).
Fig. 3. Typical theorized relationships between cumulated aboveground biomass and cumulated intercepted solar radiation for C4 and C3 species. From Gosse et al. 1986.
www.intechopen.com
Solar Radiation
170
One difference lies in the fact that photorespiration is very active in C3 plants. The photorespiration makes plants increase the oxygen consumption when they are illuminated by the sun, and this is very important for agriculture in temperate zones. In a hot day with no wind, the CO2 concentration in the plant decreases considerably for photosynthesis consumption, therefore, the relationship between carbon and oxygen decreases, and the CO2 fixation increases the photorespiration.
2. Interception of radiation
In the interception of light (LI) by a canopy, difference between the solar incident radiation and reflected radiation by the soil surface (Villalobos et al., 2002), is a determining factor in crop development and provides the energy needed for fundamental physiological processes such as photosynthesis and transpiration.
Plants intercept direct and diffuse sunlight. The upper leaves receive both types of radiation, while the lower leaves intercept a small portion of direct radiation. Diffuse radiation therefore, becomes more significant in the lower leaves due to radiation transmitted and reflected from the leaves and the soil surface. Solar radiation transmitted by the leaves is predominantly infrared. From a practical point of view, the solar radiation spectrum is divided into regions, each with its own characteristic properties. Appropriate procedures and sensors must be chosen according to the specific objectives of the radiation measurements. Visible radiation, between the wavelengths of 400 and 700 nm, is the most important type from an ecophysiological viewpoint, as it relates to photosynthetically active radiation (PAR). Only 50% of the incident radiation is employed by the plant to perform photosynthesis (Varlet-Gancher et al, 1993). The quantity of radiation intercepted by plant cover is influenced by a series of factors such as leaf angle, the properties of the leaf surface affecting light reflection, the thickness and chlorophyll concentration, which affect the light transmission, the size and shape of the leaf phyllotaxis and vertical stratification, and the elevation of the sun and distribution of direct and diffuse solar radiation. Of the 100% total energy received by the leaf only 5% is converted into carbohydrates for biomass production later. Losses of energy are: by non-absorbed wavelengths: 60%. Reflection and transmission: 8%.Heat dissipation: 8%. Metabolism: 19%.
Of the global radiation incident on the plant canopy only a proportion is used to carry out photosynthesis: PAR (photosynthetic active radiation). The plant’s response differs with different wavelengths. Chlorophyll is the main pigment that absorbs the light, other accessory pigments are the b-carotene, red isoprenoid compound which is the precursor of vitamin A in animals and the xanthophyll, a yellow carotenoid.
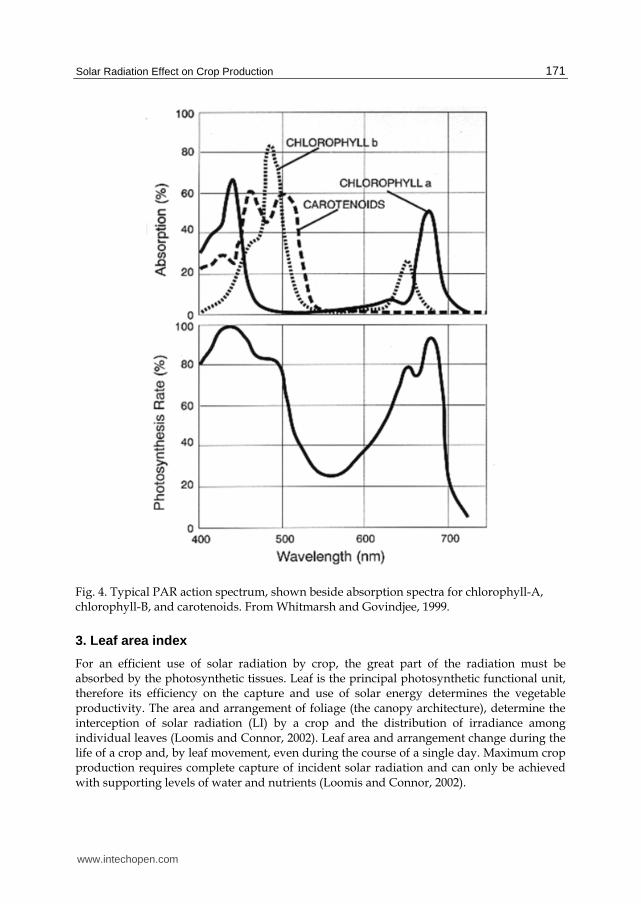
Essentially the entire visible light is capable of promoting photosynthesis, but the regions from 400 to 500 and 600 to 700 nm are the most effective (figure 4). In addition, pure chlorophyll has a very weak absorption, between 500 and 600 nm. The accessory pigments complement the absorption of light in this region, supplementing the chlorophylls.
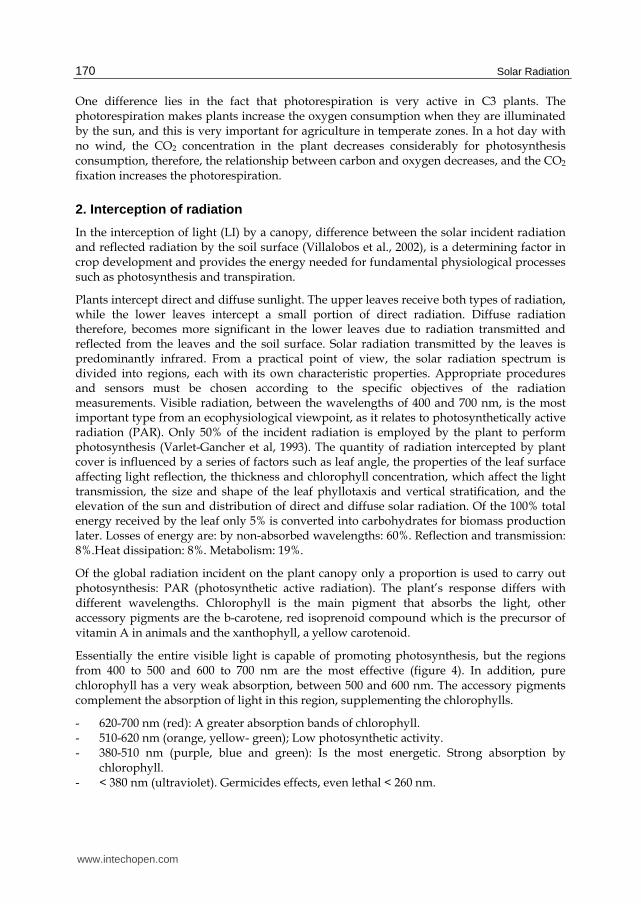
- 620-700 nm (red): A greater absorption bands of chlorophyll. - 510-620 nm (orange, yellow- green); Low photosynthetic activity. - 380-510 nm (purple, blue and green): Is the most energetic. Strong absorption by
chlorophyll. - < 380 nm (ultraviolet). Germicides effects, even lethal < 260 nm.
www.intechopen.com
Solar Radiation Effect on Crop Production
171
Fig. 4. Typical PAR action spectrum, shown beside absorption spectra for chlorophyll-A, chlorophyll-B, and carotenoids. From Whitmarsh and Govindjee, 1999.
3. Leaf area index
For an efficient use of solar radiation by crop, the great part of the radiation must be absorbed by the photosynthetic tissues. Leaf is the principal photosynthetic functional unit, therefore its efficiency on the capture and use of solar energy determines the vegetable productivity. The area and arrangement of foliage (the canopy architecture), determine the interception of solar radiation (LI) by a crop and the distribution of irradiance among individual leaves (Loomis and Connor, 2002). Leaf area and arrangement change during the life of a crop and, by leaf movement, even during the course of a single day. Maximum crop production requires complete capture of incident solar radiation and can only be achieved with supporting levels of water and nutrients (Loomis and Connor, 2002).
www.intechopen.com
Solar Radiation
172
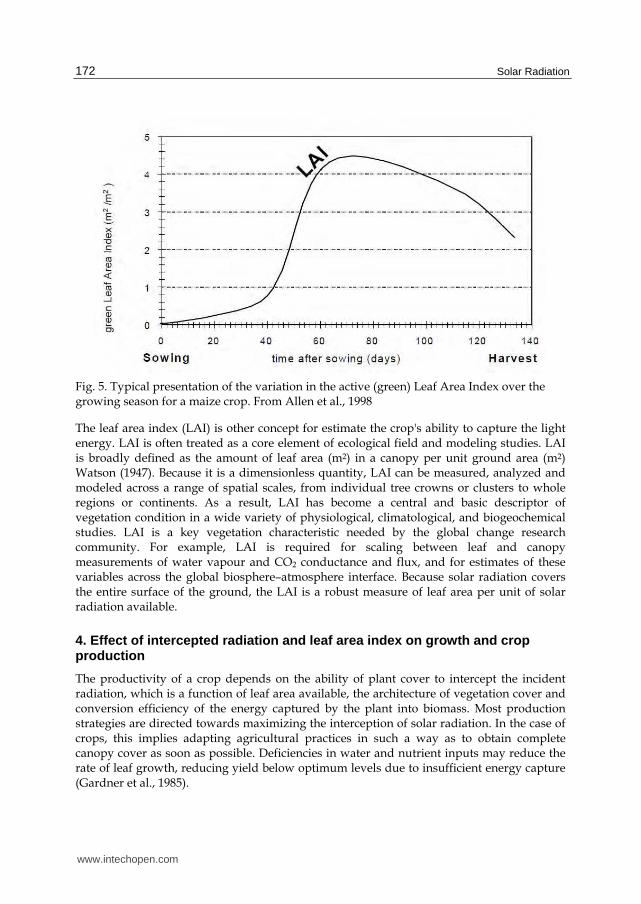
Fig. 5. Typical presentation of the variation in the active (green) Leaf Area Index over the growing season for a maize crop. From Allen et al., 1998
The leaf area index (LAI) is other concept for estimate the crop's ability to capture the light energy. LAI is often treated as a core element of ecological field and modeling studies. LAI is broadly defined as the amount of leaf area (m2) in a canopy per unit ground area (m2) Watson (1947). Because it is a dimensionless quantity, LAI can be measured, analyzed and modeled across a range of spatial scales, from individual tree crowns or clusters to whole regions or continents. As a result, LAI has become a central and basic descriptor of vegetation condition in a wide variety of physiological, climatological, and biogeochemical studies. LAI is a key vegetation characteristic needed by the global change research community. For example, LAI is required for scaling between leaf and canopy measurements of water vapour and CO2 conductance and flux, and for estimates of these variables across the global biosphere–atmosphere interface. Because solar radiation covers the entire surface of the ground, the LAI is a robust measure of leaf area per unit of solar radiation available.
4. Effect of intercepted radiation and leaf area index on growth and crop production
The productivity of a crop depends on the ability of plant cover to intercept the incident radiation, which is a function of leaf area available, the architecture of vegetation cover and conversion efficiency of the energy captured by the plant into biomass. Most production strategies are directed towards maximizing the interception of solar radiation. In the case of crops, this implies adapting agricultural practices in such a way as to obtain complete canopy cover as soon as possible. Deficiencies in water and nutrient inputs may reduce the rate of leaf growth, reducing yield below optimum levels due to insufficient energy capture (Gardner et al., 1985).
www.intechopen.com
Solar Radiation Effect on Crop Production
173
The efficiency of interception of PAR depends on the leaf area of the plant population (Varlet-Grancher et al., 1989) as well as on the leaf shape and inclination to the canopy. Gallo & Daughtry (1986) observed that the difference between the intercepted and absorbed PAR, along the maize crop cycle, was lower than 3.5%. According to this, Müller (2001) showed that maize leaves absorb 92% of the intercepted radiation by the canopy. The efficiency of interception of a canopy corresponds to the capacity of the plant population in intercepting the incident solar radiation, which is the main factor influencing the photosynthesis and the transpiration processes (Thorpe, 1978). The efficient crops tend to spend their early growth to expand their leaf area; they make a better use of solar radiation. Agronomic practices, such as fertilization boot, high stocking densities and better spatial arrangement of plants (eg narrow rows) are used to accelerate ground cover and increase light interception.
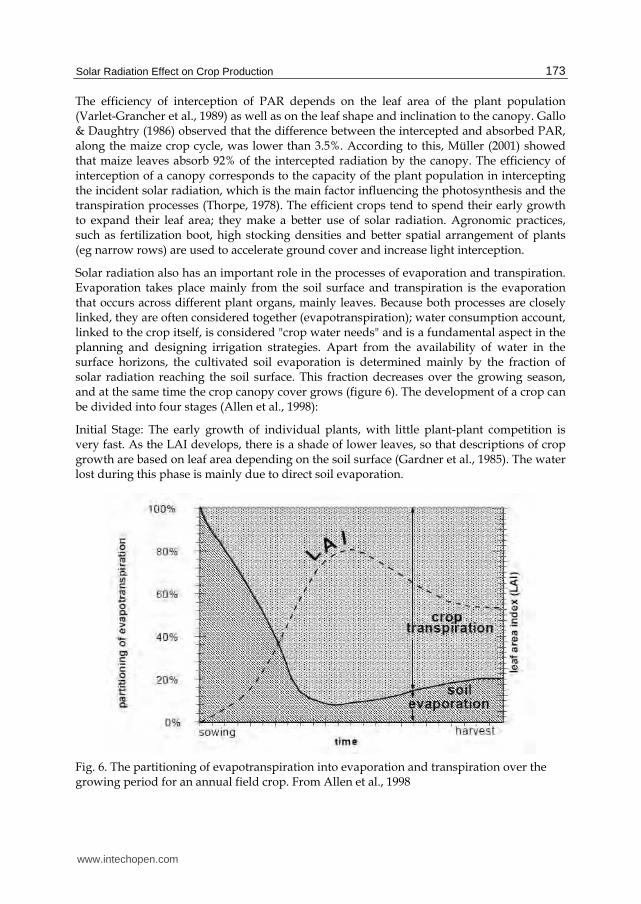
Solar radiation also has an important role in the processes of evaporation and transpiration. Evaporation takes place mainly from the soil surface and transpiration is the evaporation that occurs across different plant organs, mainly leaves. Because both processes are closely linked, they are often considered together (evapotranspiration); water consumption account, linked to the crop itself, is considered "crop water needs" and is a fundamental aspect in the planning and designing irrigation strategies. Apart from the availability of water in the surface horizons, the cultivated soil evaporation is determined mainly by the fraction of solar radiation reaching the soil surface. This fraction decreases over the growing season, and at the same time the crop canopy cover grows (figure 6). The development of a crop can be divided into four stages (Allen et al., 1998):
Initial Stage: The early growth of individual plants, with little plant-plant competition is very fast. As the LAI develops, there is a shade of lower leaves, so that descriptions of crop growth are based on leaf area depending on the soil surface (Gardner et al., 1985). The water lost during this phase is mainly due to direct soil evaporation.
Fig. 6. The partitioning of evapotranspiration into evaporation and transpiration over the growing period for an annual field crop. From Allen et al., 1998
www.intechopen.com
Solar Radiation
174
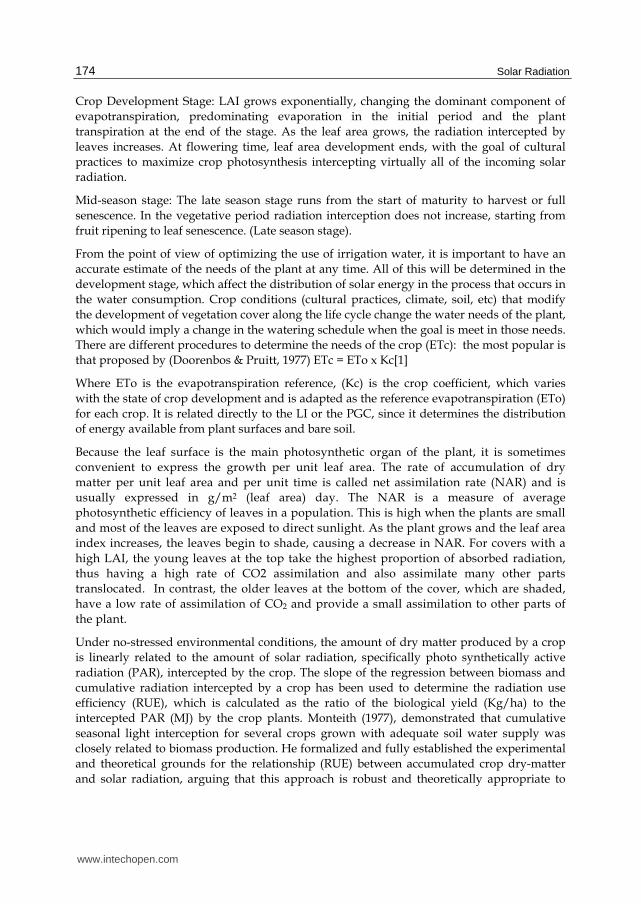
Crop Development Stage: LAI grows exponentially, changing the dominant component of
evapotranspiration, predominating evaporation in the initial period and the plant
transpiration at the end of the stage. As the leaf area grows, the radiation intercepted by
leaves increases. At flowering time, leaf area development ends, with the goal of cultural
practices to maximize crop photosynthesis intercepting virtually all of the incoming solar
radiation.
Mid-season stage: The late season stage runs from the start of maturity to harvest or full
senescence. In the vegetative period radiation interception does not increase, starting from
fruit ripening to leaf senescence. (Late season stage).
From the point of view of optimizing the use of irrigation water, it is important to have an
accurate estimate of the needs of the plant at any time. All of this will be determined in the
development stage, which affect the distribution of solar energy in the process that occurs in
the water consumption. Crop conditions (cultural practices, climate, soil, etc) that modify
the development of vegetation cover along the life cycle change the water needs of the plant,
which would imply a change in the watering schedule when the goal is meet in those needs.
There are different procedures to determine the needs of the crop (ETc): the most popular is
that proposed by (Doorenbos & Pruitt, 1977) ETc = ETo x Kc[1]
Where ETo is the evapotranspiration reference, (Kc) is the crop coefficient, which varies
with the state of crop development and is adapted as the reference evapotranspiration (ETo)
for each crop. It is related directly to the LI or the PGC, since it determines the distribution
of energy available from plant surfaces and bare soil.
Because the leaf surface is the main photosynthetic organ of the plant, it is sometimes
convenient to express the growth per unit leaf area. The rate of accumulation of dry
matter per unit leaf area and per unit time is called net assimilation rate (NAR) and is
usually expressed in g/m2 (leaf area) day. The NAR is a measure of average
photosynthetic efficiency of leaves in a population. This is high when the plants are small
and most of the leaves are exposed to direct sunlight. As the plant grows and the leaf area
index increases, the leaves begin to shade, causing a decrease in NAR. For covers with a
high LAI, the young leaves at the top take the highest proportion of absorbed radiation,
thus having a high rate of CO2 assimilation and also assimilate many other parts
translocated. In contrast, the older leaves at the bottom of the cover, which are shaded,
have a low rate of assimilation of CO2 and provide a small assimilation to other parts of
the plant.
Under no-stressed environmental conditions, the amount of dry matter produced by a crop
is linearly related to the amount of solar radiation, specifically photo synthetically active
radiation (PAR), intercepted by the crop. The slope of the regression between biomass and
cumulative radiation intercepted by a crop has been used to determine the radiation use
efficiency (RUE), which is calculated as the ratio of the biological yield (Kg/ha) to the
intercepted PAR (MJ) by the crop plants. Monteith (1977), demonstrated that cumulative
seasonal light interception for several crops grown with adequate soil water supply was
closely related to biomass production. He formalized and fully established the experimental
and theoretical grounds for the relationship (RUE) between accumulated crop dry-matter
and solar radiation, arguing that this approach is robust and theoretically appropriate to
www.intechopen.com
Solar Radiation Effect on Crop Production
175
describe crop growth. RUE is highly dependent on the photosynthetic performance of crop
canopies and can be influenced by several factors, namely, extremes temperature, water,
and nutrient status. This is indicated by the variation reported in RUE among and within
crop species and across locations and growing environments (Subbarao et al 2005). The
literature reported quite a large number of RUE values for different crops and locations
(Gallagher & Biscoe, 1978; Gosse et al., 1986; Kiniry et al., 1989). Stockle & Kemanian (2009)
at intervals showed the value of RUE in g / MJ for large groups of plants: C3 Annuals (1.2-
1.7), C4 Annuals (1.7-2.0), C3 Oil crops (1.3-1.6), Legumes (1.0-1.2) and Tuber and root (1.6-
1.9). Moreover, the radiation use efficiency (RUE) approach that relates dry mass
accumulation to the amount of intercepted PAR (Monteith, 1994; Kiniry, 1999) is widely
used to estimate biomass accumulation in horticultural crops, fruit trees and forest
(Landsberg & Hingston, 1996; Kiniry et al., 1998; Mariscal et al., 2000).
The efficiency of radiation interception is also influenced by the levels of nutrients in plants,
mainly by nitrogen (Dewar, 1996; Scott Green et al., 2003). High crop RUE is directly
dependent on obtaining the maximum leaf photosynthetic rate (Sinclair and Horie, 1989;
Hammer and Wright, 1993). Nearly 70% of the soluble protein in leaf is concentrated in the
carboxylation enzymes (i.e., Rubisco). A positive relationship between leaf nitrogen content
per unit area (specific leaf nitrogen) and photosynthetic rates has been reported for a
number of crops including wheat, maize, sorghum, rice, soybean, potato, sunflower, peanut,
and sugarcane (Muchow & Sinclair, 1994; Sinclair & Shiraiwa, 1993; Sinclair & Horie, 1989;
Hammer and Wright, 1993; Evans, 1983; Marshall and Vos, 1991; Giminez, et al 1994; Anten,
et al, 1995; Peng, et al, 1994 and Vos & Van Der Putten, 1998 as cited in Subbarao et al 2005).
The quantum yield of CO2 assimilation, which is one of the major determinants of the
photosynthetic efficiency of crop canopies, reportedly decreases under N deficiency Meinzer
and Zhu, 1998). Levels of photoinhibition also increase under N deficiency (Henley et al.,
1991). Thus, a favorable crop nitrogen status appears to be necessary for the
realization/expression of maximum RUE in a given crop species. Several studies have
reported a positive response of RUE to N fertilization in a number of crops (Muchow &
Sinclair, 1994; Hall et al., 1995; Green, 1987). Nitrogen deficiency should decrease the range
where there is a linear response between PAR and increased light and thus the range of
maximum RUE (Sinclair, 1990; Muchow, 1988). A substantial decrease in RUE under
nitrogen stress has been reported for maize (Muchow & Davis, 1988; Muchow, 1994),
sorghum (Muchow, 1988), kenaf (Muchow, 1992), wheat (Green, 1987), sunflower (Hall et
al., 1995 and Bange et al., 1997), and peanut (Wright et al., 1993). Uhart & Andrade (1995)
showed the differences in RUE produced in a crop of corn with nitrogen and without
nitrogen, the latter being 40% lower (Figure 7).
The water deficit reduces the interception of solar radiation due to rolling up the leaves (Müller, 2001). If the water deficit is prolonged, the number and size of leaves may be reduced or the total leaf area may decrease, reducing as a result, the interception of radiation (Collinson et al., 1999). Soil water and the resulting plant water status play a key role in determining stomata conductance and canopy photosynthesis. Soil water deficit results in plant water deficits that lead to stomata closure and reduced photosynthesis, and results in loss of photosynthetic efficiency of the canopy and thus to a decrease in RUE (Monteith, 1977). Plants have developed a number of adaptive mechanisms to cope with water deficits to minimize the impact on their productivity (Subbarao et al 1995 and Tunner, 1997).
www.intechopen.com
Solar Radiation
176
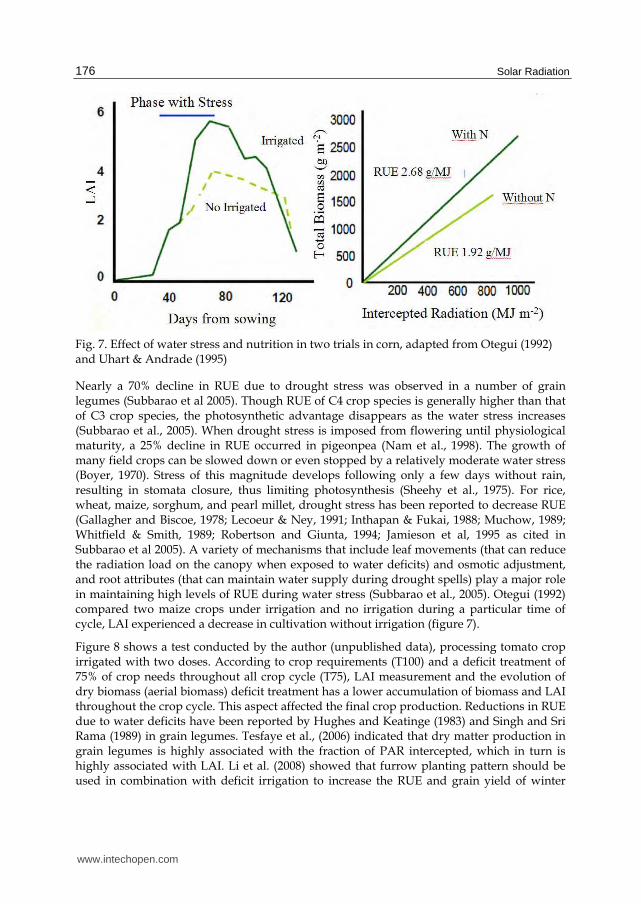
Fig. 7. Effect of water stress and nutrition in two trials in corn, adapted from Otegui (1992) and Uhart & Andrade (1995)
Nearly a 70% decline in RUE due to drought stress was observed in a number of grain legumes (Subbarao et al 2005). Though RUE of C4 crop species is generally higher than that of C3 crop species, the photosynthetic advantage disappears as the water stress increases (Subbarao et al., 2005). When drought stress is imposed from flowering until physiological maturity, a 25% decline in RUE occurred in pigeonpea (Nam et al., 1998). The growth of many field crops can be slowed down or even stopped by a relatively moderate water stress (Boyer, 1970). Stress of this magnitude develops following only a few days without rain, resulting in stomata closure, thus limiting photosynthesis (Sheehy et al., 1975). For rice, wheat, maize, sorghum, and pearl millet, drought stress has been reported to decrease RUE (Gallagher and Biscoe, 1978; Lecoeur & Ney, 1991; Inthapan & Fukai, 1988; Muchow, 1989; Whitfield & Smith, 1989; Robertson and Giunta, 1994; Jamieson et al, 1995 as cited in Subbarao et al 2005). A variety of mechanisms that include leaf movements (that can reduce the radiation load on the canopy when exposed to water deficits) and osmotic adjustment, and root attributes (that can maintain water supply during drought spells) play a major role in maintaining high levels of RUE during water stress (Subbarao et al., 2005). Otegui (1992) compared two maize crops under irrigation and no irrigation during a particular time of cycle, LAI experienced a decrease in cultivation without irrigation (figure 7).
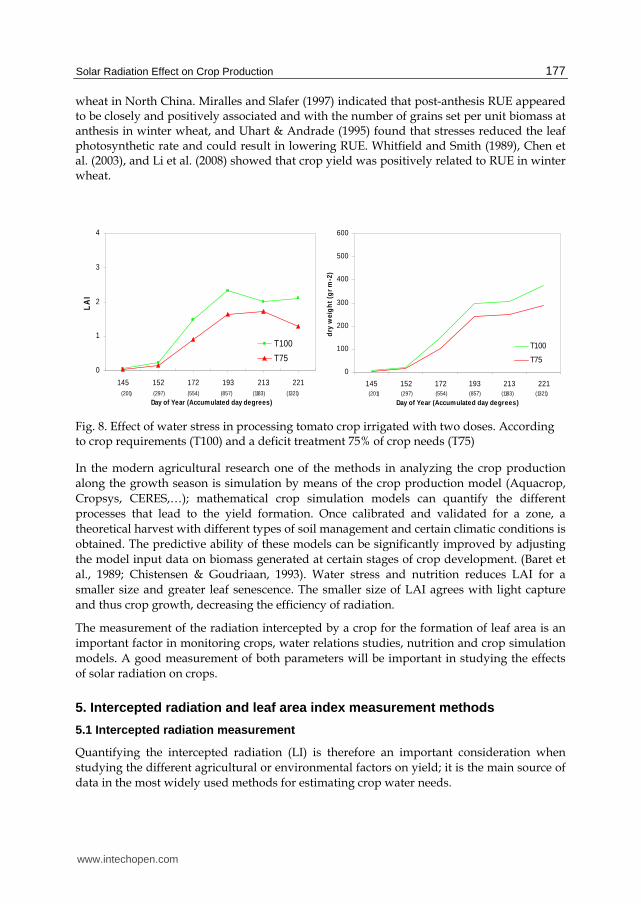
Figure 8 shows a test conducted by the author (unpublished data), processing tomato crop irrigated with two doses. According to crop requirements (T100) and a deficit treatment of 75% of crop needs throughout all crop cycle (T75), LAI measurement and the evolution of dry biomass (aerial biomass) deficit treatment has a lower accumulation of biomass and LAI throughout the crop cycle. This aspect affected the final crop production. Reductions in RUE due to water deficits have been reported by Hughes and Keatinge (1983) and Singh and Sri Rama (1989) in grain legumes. Tesfaye et al., (2006) indicated that dry matter production in grain legumes is highly associated with the fraction of PAR intercepted, which in turn is highly associated with LAI. Li et al. (2008) showed that furrow planting pattern should be used in combination with deficit irrigation to increase the RUE and grain yield of winter
www.intechopen.com
Solar Radiation Effect on Crop Production
177
wheat in North China. Miralles and Slafer (1997) indicated that post-anthesis RUE appeared to be closely and positively associated and with the number of grains set per unit biomass at anthesis in winter wheat, and Uhart & Andrade (1995) found that stresses reduced the leaf photosynthetic rate and could result in lowering RUE. Whitfield and Smith (1989), Chen et al. (2003), and Li et al. (2008) showed that crop yield was positively related to RUE in winter wheat.
0
1
2
3
4
145 152 172 193 213 221
Day of Year (Accumulated day degrees)
LA
I
T100
T75
(201) (297) (554) (857) (1183) (1321)
0
100
200
300
400
500
600
145 152 172 193 213 221
Day of Year (Accumulated day degrees)
dry
wei
gh
t (g
r m
-2)
T100
T75
(201) (297) (554) (857) (1183) (1321)
Fig. 8. Effect of water stress in processing tomato crop irrigated with two doses. According to crop requirements (T100) and a deficit treatment 75% of crop needs (T75)
In the modern agricultural research one of the methods in analyzing the crop production
along the growth season is simulation by means of the crop production model (Aquacrop,
Cropsys, CERES,…); mathematical crop simulation models can quantify the different
processes that lead to the yield formation. Once calibrated and validated for a zone, a
theoretical harvest with different types of soil management and certain climatic conditions is
obtained. The predictive ability of these models can be significantly improved by adjusting
the model input data on biomass generated at certain stages of crop development. (Baret et
al., 1989; Chistensen & Goudriaan, 1993). Water stress and nutrition reduces LAI for a
smaller size and greater leaf senescence. The smaller size of LAI agrees with light capture
and thus crop growth, decreasing the efficiency of radiation.
The measurement of the radiation intercepted by a crop for the formation of leaf area is an
important factor in monitoring crops, water relations studies, nutrition and crop simulation
models. A good measurement of both parameters will be important in studying the effects
of solar radiation on crops.
5. Intercepted radiation and leaf area index measurement methods
5.1 Intercepted radiation measurement
Quantifying the intercepted radiation (LI) is therefore an important consideration when
studying the different agricultural or environmental factors on yield; it is the main source of
data in the most widely used methods for estimating crop water needs.
www.intechopen.com
Solar Radiation
178
The LI measurement methods are not necessarily destructive, since the provision of plants on the ground plays a key role. However, there are differences between the different methods in terms of the changes introduced into the covers to make measurements, direct methods and indirect methods.
5.1.1 LI measurement with direct methods
A direct method for determining the percentage of intercepted radiation (LI) is to measure
PAR both above and below the canopy at noon on completely cloudless days (Board et al.,
1992; Purcell, 2000; Reta-Sánchez y Fowler, 2002):
1
PAR below canopyLI
PAR above canopy (1)
Commercially available lineal PAR sensors are used to take these measurements which are based on PAR values registered by the sensor. These measurements can be taken either by locating sensors perpendicular to the crop rows (Egli, 1994) or by taking multiple measurements parallel to them (Board et al., 1992). The latter method can be costly, according to the number of measurements needed to characterize the study area, especially in the case of low-lying crops, where it may be necessary to remove vegetation in order to place sensors under it, which also has the drawback of introducing alterations during data collection. Using the percentage of shaded soil at solar noon or the percentage of ground cover (PGC) to estimate LI, is an easier and more economical way to obtain the required data. It is generally assumed that the shaded area at soil level corresponds to the fraction of incident radiation which has been intercepted by the crop. This is an approximation that is valid as long as the percentage of light transmission through the leaves is small in comparison to its absorption. The precision with which PGC estimates LI will therefore depend on how well the shaded area is defined and on the capacity of the canopy to capture all of the radiation within the shaded area. In this second case, estimates could be improved by taking complementary measurements of radiation at a sufficient number of points within the shaded area to characterize the radiation traversing the canopy (Lang et al., 1985).
Some of the methods used to determine PGC involve visual estimates (Olmstead et al., 2004;
Ortega-Farias et al., 2004). Methods such as the “interception line” (Gallo y Daughtry 1986;
Mohillo y Moran, 1991), the analysis the intersection of shadows on metric strips and paper
drawings of the sampling areas were used to determine PGC in a non-destructive way
(García et al., 2001). However, to apply these last three methods, cloudless days are needed,
as a sufficient number of measurements at different orientations are needed to allow a
reliable characterization of the area (Ewing y Horton, 1999). The precision of the visual
estimation method varies, because it depends on the skill of the operator; results will not be
comparable when several people are involved (Olmstead et al., 2004). Furthermore, it has
been shown that coverage values tend to be overestimated (Olmstead et al., 2004). In the
cases of the interception line and metric strip methods, similar problems are encountered as
those associated with the use of PAR bars in the case of low-lying crops and it is difficult to
take measurements below the canopy. Finally, making paper drawings is very costly when
working under field conditions and when a relatively large area must be characterized.
www.intechopen.com
Solar Radiation Effect on Crop Production
179
5.1.2 LI measurement with indirect methods
In indirect methods, different apparatus for estimating the different components of radiation, such as direct radiation, diffuse, land, atmospheric... are used which consider the net radiation balance in order to know how much available radiation reaching the surface.
The inherent difficulties in measuring PAR throughout a canopy and advances in radiometric techniques have led to the development of methods for remotely sensing radiation capture. Radiometric methods rely on differences in the spectral reflectance of vegetation and soil. Vegetative indices based on reflectance in broad wavebands have provided good estimates of radiation capture and yield in crop plants (Gallo et al., 1985; Hatfield et al., 1984). Vegetation indices have also provided good estimates of fractional groundcover (Boissard et al., 1992; White et al., 2000). More recently, spectroradiometers capable of measuring narrow band radiation have been used to monitor plant stress (Elvidge & Chen, 1995). Radiometric satellite data are now available for the evaluation of large areas, and small portable radiometers are becoming less expensive as the technology progresses. In this respect, good results have been obtained with measurements using digital photographic images to determine crop cover and radiation interception in soybean (Purcell, 2000) and lettuce (Klassen et al., 2003), crop cover in turfgrass (Richardson et al., 2001), and canopy and soil cover with straw mulch (Bennet et al., 2000; Beverly, 1996; Olmstead et al., 2004). Other important points are that the area of soil exposed to the sun can be differentiated from that covered by leaves while the angle of the camera is close to that of the sun (Purcell, 2000). With regards to differentiating between the green parts of the crop and the soil surface, results could vary in the case of soils of different colors as a result of their different behavior with respect to the reflection and absorption of radiation; this is particularly the case for different kinds of mulches. In this case, the validity of the method will largely depend on the capacity of the software to discriminate between parts of the crop’s green canopy. In the presence of weeds or green cover, it may be necessary to prescreen images.
Digital images offer a series of additional advantages over other methods for estimating LI, assuming that the soil background can be distinguished from leaves, light transmission of leaves is small relative to light absorption, and that the angle of the camera to the horizon approximates the solar angle (Purcell, 2000) such as the direct treatment of images by computers. Moreover, a graphic record of the crop is generated in the case of studies of canopy evolution. This can be used for phonological monitoring (Shelton et al., 1988) to determine differences in color and fertility in maize (Ewing and Horton, 1999) and to study the incidence of pests and diseases.
Automated methods of digital image analysis are indirect methods of LI measurement. Initially they were not widely used because they generally require complex and expensive instrumentation, as well as making mistakes with the changing colors of soil and plant (Hayes & Han, 1993; Van Henten & Bontsema, 1995; Beverly 1996). However, no alteration of vegetation cover and the automation of image analysis has allowed the elimination of many subjective decisions of the observer.
Recent advances in high-resolution digital cameras and associated image manipulation software provide enhanced methods of visual discrimination and computer thresholding that are user-friendly and inexpensive. Three recent studies have demonstrated the accuracy
www.intechopen.com
Solar Radiation
180
of digital imaging analysis for monitoring plant growth. Paruelo et al. (2000) described a method for estimating aboveground biomass in semiarid grasslands using digitized photographs and a DOS-based program they developed. Purcell (2000) described a method for measuring canopy coverage and light interception in soybean fields using a digital camera and standard imaging software. Richardson et al. (2001) described a digital method for quantifying turfgrass cover following a modified version of Purcell (2000). Klassen 2002 used standard methods of measurement of radiation for comparison with the analysis of vegetation cover as with digital photography using the analysis software Adobe Photoshop 6.0 image. Olmstead et al. (2004) analyzed vegetation cover in grapevine crop through the analysis of digital images, using Sigma Scan Pro 5.0 compared with estimated visualization measures. Other authors used the measurement by digital photography analysis for other uses, Adamsen et al. (1999) to measure maize senescence.
A seemingly key advantage of using digital cameras is that they allow for continuous monitoring of vegetation (White et al., 2000), in the case of low-lying horticultural crops. These measures do not alter the disposition of the crop. Replacing standard procedures, such as the width of cultivation, direct quantification of the shadows or linear PAR sensors, are subjective and costly, and often inaccurate (Campillo et al., 2008).
Taking advantage of the latest developments in digital technology, it is now possible to measure the evolution of vegetation cover through digital photography and to determine the PGC using image interpretation techniques (Campillo et al., 2008; Rodríguez et al., 2000).
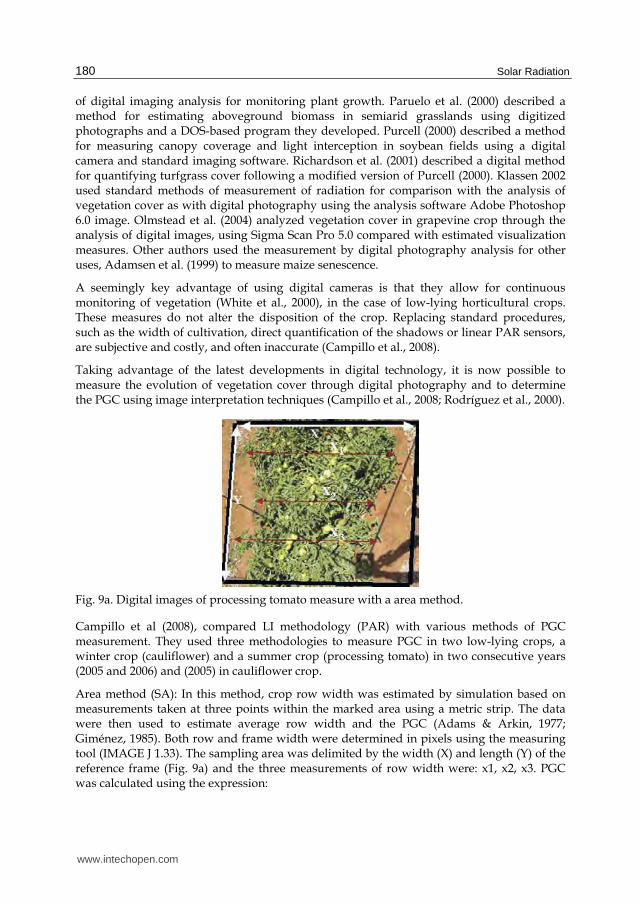
Fig. 9a. Digital images of processing tomato measure with a area method.
Campillo et al (2008), compared LI methodology (PAR) with various methods of PGC measurement. They used three methodologies to measure PGC in two low-lying crops, a winter crop (cauliflower) and a summer crop (processing tomato) in two consecutive years (2005 and 2006) and (2005) in cauliflower crop.
Area method (SA): In this method, crop row width was estimated by simulation based on measurements taken at three points within the marked area using a metric strip. The data were then used to estimate average row width and the PGC (Adams & Arkin, 1977; Giménez, 1985). Both row and frame width were determined in pixels using the measuring tool (IMAGE J 1.33). The sampling area was delimited by the width (X) and length (Y) of the reference frame (Fig. 9a) and the three measurements of row width were: x1, x2, x3. PGC was calculated using the expression:
www.intechopen.com
Solar Radiation Effect on Crop Production
181
1 2 3
3100
x x xY
PGCX Y
(2)
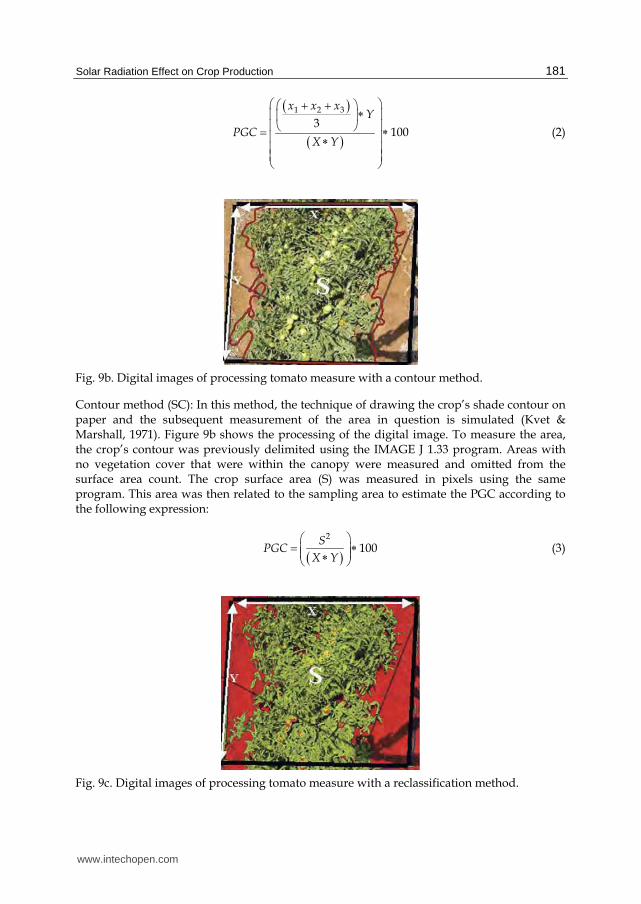
Fig. 9b. Digital images of processing tomato measure with a contour method.
Contour method (SC): In this method, the technique of drawing the crop’s shade contour on paper and the subsequent measurement of the area in question is simulated (Kvet & Marshall, 1971). Figure 9b shows the processing of the digital image. To measure the area, the crop’s contour was previously delimited using the IMAGE J 1.33 program. Areas with no vegetation cover that were within the canopy were measured and omitted from the surface area count. The crop surface area (S) was measured in pixels using the same program. This area was then related to the sampling area to estimate the PGC according to the following expression:
2
100
SPGC
X Y (3)
Fig. 9c. Digital images of processing tomato measure with a reclassification method.
www.intechopen.com
Solar Radiation
182
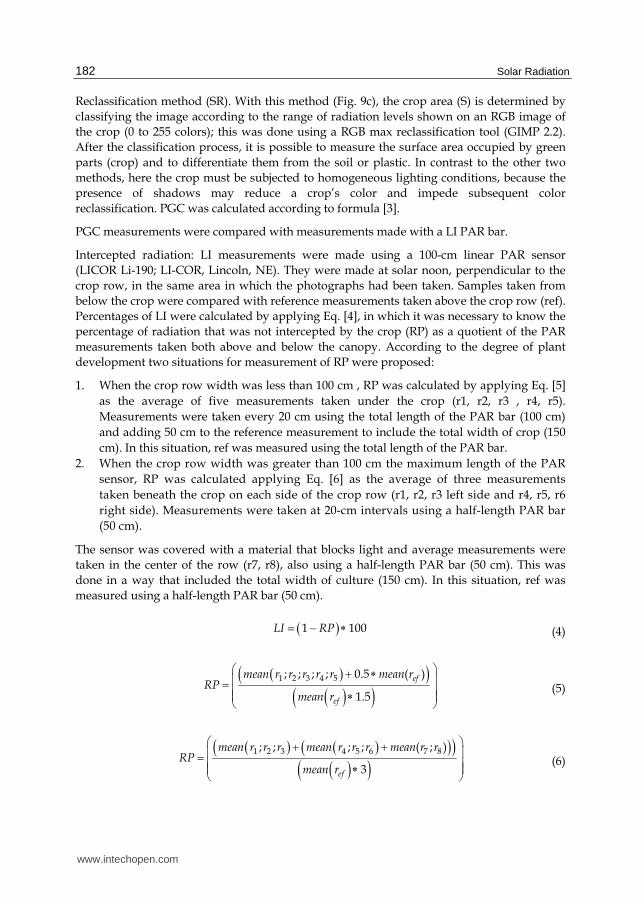
Reclassification method (SR). With this method (Fig. 9c), the crop area (S) is determined by
classifying the image according to the range of radiation levels shown on an RGB image of
the crop (0 to 255 colors); this was done using a RGB max reclassification tool (GIMP 2.2).
After the classification process, it is possible to measure the surface area occupied by green
parts (crop) and to differentiate them from the soil or plastic. In contrast to the other two
methods, here the crop must be subjected to homogeneous lighting conditions, because the
presence of shadows may reduce a crop’s color and impede subsequent color
reclassification. PGC was calculated according to formula [3].
PGC measurements were compared with measurements made with a LI PAR bar.
Intercepted radiation: LI measurements were made using a 100-cm linear PAR sensor
(LICOR Li-190; LI-COR, Lincoln, NE). They were made at solar noon, perpendicular to the
crop row, in the same area in which the photographs had been taken. Samples taken from
below the crop were compared with reference measurements taken above the crop row (ref).
Percentages of LI were calculated by applying Eq. [4], in which it was necessary to know the
percentage of radiation that was not intercepted by the crop (RP) as a quotient of the PAR
measurements taken both above and below the canopy. According to the degree of plant
development two situations for measurement of RP were proposed:
1. When the crop row width was less than 100 cm , RP was calculated by applying Eq. [5]
as the average of five measurements taken under the crop (r1, r2, r3 , r4, r5).
Measurements were taken every 20 cm using the total length of the PAR bar (100 cm)
and adding 50 cm to the reference measurement to include the total width of crop (150
cm). In this situation, ref was measured using the total length of the PAR bar.
2. When the crop row width was greater than 100 cm the maximum length of the PAR
sensor, RP was calculated applying Eq. [6] as the average of three measurements
taken beneath the crop on each side of the crop row (r1, r2, r3 left side and r4, r5, r6
right side). Measurements were taken at 20-cm intervals using a half-length PAR bar
(50 cm).
The sensor was covered with a material that blocks light and average measurements were
taken in the center of the row (r7, r8), also using a half-length PAR bar (50 cm). This was
done in a way that included the total width of culture (150 cm). In this situation, ref was
measured using a half-length PAR bar (50 cm).
1 100 LI RP (4)
1 2 3 4 5; ; ; ; 0.5 ( )
1.5
ef
ef
mean r r r r r mean rRP
mean r (5)
1 2 3 4 5 6 7 8; ; ; ; ( ; )
3
ef
mean r r r mean r r r mean r rRP
mean r (6)
www.intechopen.com
Solar Radiation Effect on Crop Production
183
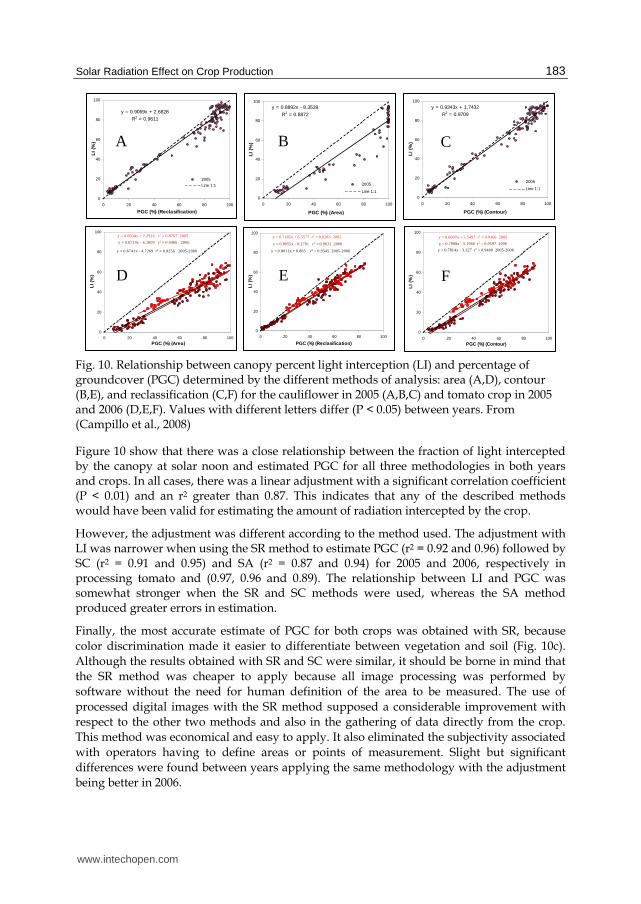
Fig. 10. Relationship between canopy percent light interception (LI) and percentage of groundcover (PGC) determined by the different methods of analysis: area (A,D), contour (B,E), and reclassification (C,F) for the cauliflower in 2005 (A,B,C) and tomato crop in 2005 and 2006 (D,E,F). Values with different letters differ (P < 0.05) between years. From (Campillo et al., 2008)
Figure 10 show that there was a close relationship between the fraction of light intercepted by the canopy at solar noon and estimated PGC for all three methodologies in both years and crops. In all cases, there was a linear adjustment with a significant correlation coefficient (P < 0.01) and an r2 greater than 0.87. This indicates that any of the described methods would have been valid for estimating the amount of radiation intercepted by the crop.
However, the adjustment was different according to the method used. The adjustment with LI was narrower when using the SR method to estimate PGC (r2 = 0.92 and 0.96) followed by SC (r2 = 0.91 and 0.95) and SA (r2 = 0.87 and 0.94) for 2005 and 2006, respectively in processing tomato and (0.97, 0.96 and 0.89). The relationship between LI and PGC was somewhat stronger when the SR and SC methods were used, whereas the SA method produced greater errors in estimation.
Finally, the most accurate estimate of PGC for both crops was obtained with SR, because
color discrimination made it easier to differentiate between vegetation and soil (Fig. 10c).
Although the results obtained with SR and SC were similar, it should be borne in mind that
the SR method was cheaper to apply because all image processing was performed by
software without the need for human definition of the area to be measured. The use of
processed digital images with the SR method supposed a considerable improvement with
respect to the other two methods and also in the gathering of data directly from the crop.
This method was economical and easy to apply. It also eliminated the subjectivity associated
with operators having to define areas or points of measurement. Slight but significant
differences were found between years applying the same methodology with the adjustment
being better in 2006.
y = 0.8011x + 0.865 r2 = 0.9545 2005-2006
y = 0.7185x + 6.5577 r2 = 0.9283 2005
y = 0.8055x - 0.2701 r2 = 0.9631 2006
0
20
40
60
80
100
0 20 40 60 80 100
PGC (%) (Reclasification)
LI
(%)
y = 0.8892x - 8.3539
R2 = 0.8872
0
20
40
60
80
100
0 20 40 60 80 100
PGC (%) (Area)
LI
(%)
2005
Line 1:1
y = 0.9343x + 1.7432
R2 = 0.9709
0
20
40
60
80
100
0 20 40 60 80 100
PGC (%) (Contour)
LI
(%)
2005
Line 1:1
y = 0.9069x + 2.6828
R2 = 0.9611
0
20
40
60
80
100
0 20 40 60 80 100
PGC (%) (Reclasification)
LI
(%)
2005
Line 1:1
y = 0.6741x - 4.7269 r2 = 0.9256 2005-2006
y = 0.6034x + 2.2916 r2 = 0.8767 2005
y = 0.6719x - 6.1009 r2 = 0.9466 2006
0
20
40
60
80
100
0 20 40 60 80 100
PGC (%) (Area)
LI
(%)
y = 0.7814x - 3.127 r2 = 0.9400 2005-2006
y = 0.6697x + 5.5497 r2 = 0.9166 2005
y = 0.7908x - 5.1966 r2 = 0.9597 2006
0
20
40
60
80
100
0 20 40 60 80 100PGC (%) (Contour)
LI
(%)
A B C
D E F
www.intechopen.com
Solar Radiation
184
5.2 Leaf area index measurement
Determination of LAI is often the most expensive in a field study, because direct measurement (destructive methods) is time-consuming. We can classify in the same way as with LI, in direct methods (which can be destructive or non destructive) and indirect, based on properties of vegetation cover, being non-destructive.
5.2.1 LAI measurement with direct methods
Direct methods for determining leaf area have so far been restricted to the use of an
automatic area-integrating meter. Tracing, shadow graphing, and the use of a planimeter
to measure the total leaf area attached to shoots are all time-consuming and are tedious
approaches; furthermore, in some experiments, there is not enough time to make such
measurements (Manivel & Weaver, 1974). All direct methods are similar in that they are
difficult, extremely labor-intensive, require many replicates to account for spatial
variability in the canopy, and are therefore costly in terms of time and money and also
destructive.
5.2.2 LAI measurement with indirect methods
Many indirect methods for measuring LAI have been developed.
Methods based on empirical relationships between leaf area and easily obtainable
parameters such as the size of the leaves are available. In any case, the empirical relationship
should always be check with direct action as they may vary during the crop cycle and some
other varieties. Some used are S = A * L * I and S = A * LB, where S is the area, L the length
and I the maximum width plant element, A and B are empirical elements. Also can estimate
the leaf area through relationships with the weight. A first group of methods is based on the
S = M / where M is the leaf weight in grams and is the specific weight (g/m2) (Patón et
al., 1998). Techniques based on gap-fraction analysis assume that leaf area can be calculated
from the canopy transmittance (the fraction of direct solar radiation which penetrates the
canopy) (Ford, 1997). Optical methods are indirect, non-contact, and are commonly
implemented. They are based on the measurement of light transmission through canopies
(Jonckheere et al., 2004). These methods apply the Beer-Lambert law, taking into account the
fact that the total amount of radiation intercepted by a canopy layer depends on the incident
irradiance, the canopy structure, and its optical properties (Breda, 2003). Monsi & Saeki
(1953) expanded the Beer-Lambert extinction law to apply it to plant canopies. The Beer-
Lambert law expresses the attenuation of radiation in a homogenous turbid medium. In
such a medium, the flux is absorbed in proportion to the optical distance. The LAI is related
to the incident solar radiation intercepted by the crop (LI) and extinction coefficient (K),
which describes the angle of the blades in relation to the sun, through the formula proposed
by Monsi and Saeki (1953):
1
K LAILI e (7)
This approach could also be used to estimate LAI using Eq. [7]; however, we would need to know the extinction coefficient for each crop and variety (Campbell, 1986). Several
www.intechopen.com

Solar Radiation Effect on Crop Production
185
authors have discussed how to determine k (Hassika et al., 1997; Ledent, 1977; Smith, 1993; Vose et al., 1995) and the accuracy of methodology to be applied (Nel & Wessman, 1993). It is also important to consider that the extinction coefficient also depends on stand structure and canopy architecture (Smith et al., 1991; Turton, 1985) and that the canopy extinction coefficient is a function of wavelength (Jones, 1992), radiation type, and direction (Berbigier & Bonnefond, 1995). It is also important to maximize spatial integration by using large, linear and/or mobile sensors. Extinction coefficient, which varies with species, season and environmental conditions (Hay & Walter, 1989), take values in terms of leaf angles: spherical (0.5-0.7), conical (1), vertical or erectofila (0.3-0.7). The distributions of leaf angles have agronomic and ecological implications. Horizontal distribution implies a high k, allowing for increased intercepted radiation by small plants. the disadvantage is that when the LAI is high the light distribution is very unequal, the lower leaves receive little light, which tends to accelerate senescence. In the opposite, erectofila distribution can be advantageous to intercept radiation when the zenith angle is large (winter, high latitudes) and represents a more homogeneous distribution of radiation when the LAI is high.
This method involves ground-based measurements of total, direct, and/or diffuse
radiation transmittance to the forest floor and it makes use of line quantum sensors or
radiometers (Pierce and Running, 1988), laser point quadrats (Wilson, 1963), and
capacitance sensors (Vickery et al., 1980). These instruments have already proven their
value in estimations of LAI for coniferous (Marshall and Waring, 1986; Pierce and
Running, 1988) as well as broad-leafed (Chason et al., 1991) stands. In comparison with
allometric methods, the approach provides more accurate LAI estimates (Smith et al.,
1991). However, the light measurements required to calculate LAI require cloudless skies,
and there is generally a need to incorporate a light extinction coefficient that is both site-
and species-specific as a result of leaf angle, leaf form, and leaf clumping, etc. (Vose et al.,
1995). Measurements can be taken either by locating the sensors perpendicular to the crop
rows (Egli, 1994) or by taking multiple measurements parallel to them (Board et al., 1992).
This determination can, however, be costly; it depends on the number of measurements
needed to characterize the study area, especially in low-lying crops, where vegetation
must be moved to place sensors under it, which implies introducing alterations during
data collection. There are several commercial systems available to measure indirectly the
structure of vegetation and LAI, based on the Beer-Lambert law, including analyzer plant
canopy (plant canopy analyzer LiCor LAI-2000) (Li-Cor, 1989); (Cintra et al., 2001;
Malone, 2002). El LiCor LAI-2000 has an optical sensor and a control box easily
manipulated by an operator. The LAI is estimated according to a model developed by
Miller (1967), based on gap-fraction analysis (Barclay et al., 2000). Similar instruments is
the CI-100 (Digital plant canopy imager). It consists of a digital camera with a lens of "fish
eye" with a 180 degrees field of view.
The analysis of remote estimation methods, provides a temporal and spatial information. The new technologies, provide LAI data from digital cameras (Adamsen et al., 1999), video images (Beverly, 1996), multispectral digital sensors (Bellairs et al., 1996; Shanahan et al., 2001), aerial imagery (Blackmer et al., 1996; Flowers et al., 2001) and satellite images (Wiegand et al., 1979; Thenkabail et al., 1992; Green et al., 1997). One of the remote methods most used is Normalized Difference Vegetation Index (NDVI). These spectral reflectances
www.intechopen.com
Solar Radiation
186
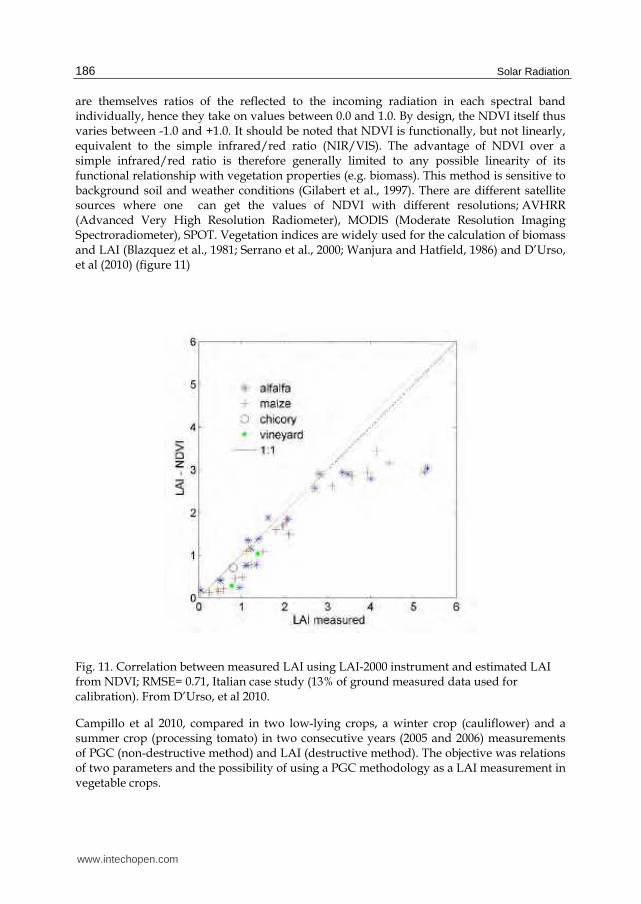
are themselves ratios of the reflected to the incoming radiation in each spectral band individually, hence they take on values between 0.0 and 1.0. By design, the NDVI itself thus varies between -1.0 and +1.0. It should be noted that NDVI is functionally, but not linearly, equivalent to the simple infrared/red ratio (NIR/VIS). The advantage of NDVI over a simple infrared/red ratio is therefore generally limited to any possible linearity of its functional relationship with vegetation properties (e.g. biomass). This method is sensitive to background soil and weather conditions (Gilabert et al., 1997). There are different satellite sources where one can get the values of NDVI with different resolutions; AVHRR (Advanced Very High Resolution Radiometer), MODIS (Moderate Resolution Imaging Spectroradiometer), SPOT. Vegetation indices are widely used for the calculation of biomass and LAI (Blazquez et al., 1981; Serrano et al., 2000; Wanjura and Hatfield, 1986) and D’Urso, et al (2010) (figure 11)
Fig. 11. Correlation between measured LAI using LAI-2000 instrument and estimated LAI from NDVI; RMSE= 0.71, Italian case study (13% of ground measured data used for calibration). From D’Urso, et al 2010.
Campillo et al 2010, compared in two low-lying crops, a winter crop (cauliflower) and a summer crop (processing tomato) in two consecutive years (2005 and 2006) measurements of PGC (non-destructive method) and LAI (destructive method). The objective was relations of two parameters and the possibility of using a PGC methodology as a LAI measurement in vegetable crops.
www.intechopen.com
Solar Radiation Effect on Crop Production
187
r2 = 0.89
r2 = 0.95
y = -3.1808x2 + 33.831x + 6.3576r2 = 0.88
0
1
2
3
4
5
6
0 10 20 30 40 50 60 70 80 90 100
PGC (%)
LA
I 20052006Polinomyc (2005)Polinomyc (2006)Both years
r2= 0.93
r2 = 0.90
y = -5.9539x2 + 40.537x + 5.8304r2 = 0.92
0
1
2
3
4
5
0 10 20 30 40 50 60 70 80 90 100
PGC (%)
LA
I 20052006Polinomyc (2005)Polinomyc (2006)Both years
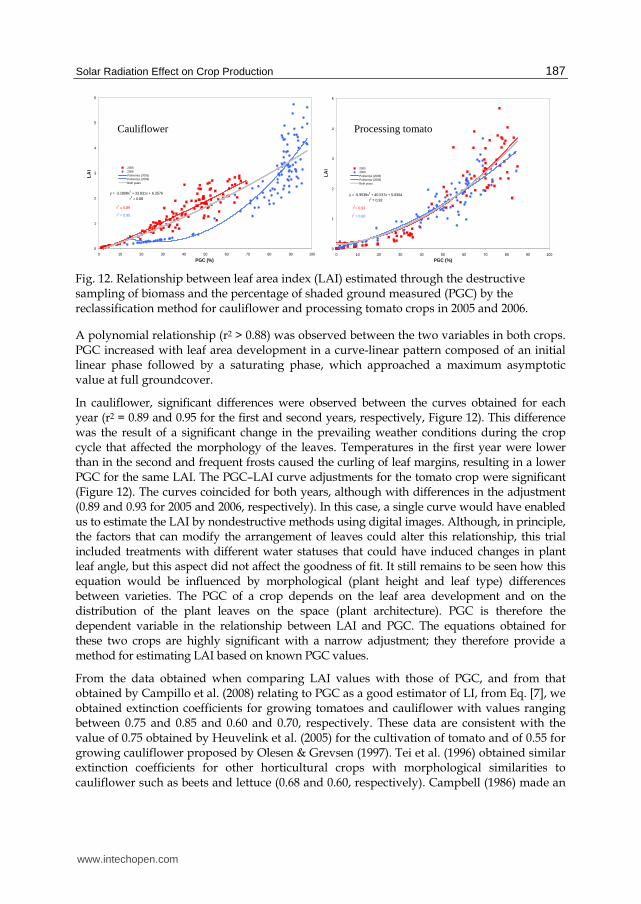
Fig. 12. Relationship between leaf area index (LAI) estimated through the destructive sampling of biomass and the percentage of shaded ground measured (PGC) by the reclassification method for cauliflower and processing tomato crops in 2005 and 2006.
A polynomial relationship (r2 > 0.88) was observed between the two variables in both crops. PGC increased with leaf area development in a curve-linear pattern composed of an initial linear phase followed by a saturating phase, which approached a maximum asymptotic value at full groundcover.
In cauliflower, significant differences were observed between the curves obtained for each year (r2 = 0.89 and 0.95 for the first and second years, respectively, Figure 12). This difference was the result of a significant change in the prevailing weather conditions during the crop cycle that affected the morphology of the leaves. Temperatures in the first year were lower than in the second and frequent frosts caused the curling of leaf margins, resulting in a lower PGC for the same LAI. The PGC–LAI curve adjustments for the tomato crop were significant (Figure 12). The curves coincided for both years, although with differences in the adjustment (0.89 and 0.93 for 2005 and 2006, respectively). In this case, a single curve would have enabled us to estimate the LAI by nondestructive methods using digital images. Although, in principle, the factors that can modify the arrangement of leaves could alter this relationship, this trial included treatments with different water statuses that could have induced changes in plant leaf angle, but this aspect did not affect the goodness of fit. It still remains to be seen how this equation would be influenced by morphological (plant height and leaf type) differences between varieties. The PGC of a crop depends on the leaf area development and on the distribution of the plant leaves on the space (plant architecture). PGC is therefore the dependent variable in the relationship between LAI and PGC. The equations obtained for these two crops are highly significant with a narrow adjustment; they therefore provide a method for estimating LAI based on known PGC values.
From the data obtained when comparing LAI values with those of PGC, and from that obtained by Campillo et al. (2008) relating to PGC as a good estimator of LI, from Eq. [7], we obtained extinction coefficients for growing tomatoes and cauliflower with values ranging between 0.75 and 0.85 and 0.60 and 0.70, respectively. These data are consistent with the value of 0.75 obtained by Heuvelink et al. (2005) for the cultivation of tomato and of 0.55 for growing cauliflower proposed by Olesen & Grevsen (1997). Tei et al. (1996) obtained similar extinction coefficients for other horticultural crops with morphological similarities to cauliflower such as beets and lettuce (0.68 and 0.60, respectively). Campbell (1986) made an
Cauliflower Processing tomato
www.intechopen.com
Solar Radiation
188
overall estimate of extinction coefficients for various crops based on the angle distribution of their leaves; considering average values for crops with leaf angles that were mainly almost horizontal, the values obtained ranged between 0.50 and 0.70.
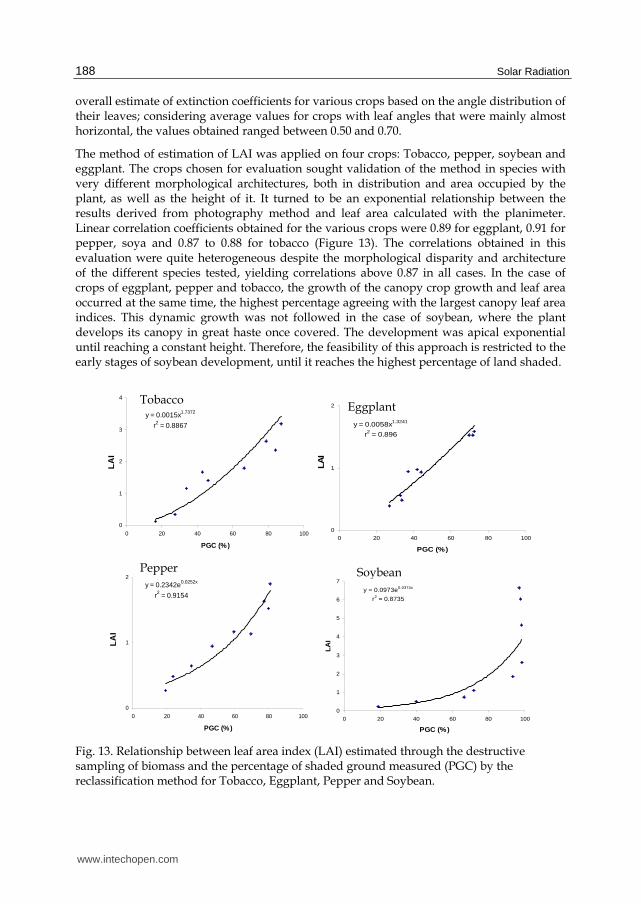
The method of estimation of LAI was applied on four crops: Tobacco, pepper, soybean and eggplant. The crops chosen for evaluation sought validation of the method in species with very different morphological architectures, both in distribution and area occupied by the plant, as well as the height of it. It turned to be an exponential relationship between the results derived from photography method and leaf area calculated with the planimeter. Linear correlation coefficients obtained for the various crops were 0.89 for eggplant, 0.91 for pepper, soya and 0.87 to 0.88 for tobacco (Figure 13). The correlations obtained in this evaluation were quite heterogeneous despite the morphological disparity and architecture of the different species tested, yielding correlations above 0.87 in all cases. In the case of crops of eggplant, pepper and tobacco, the growth of the canopy crop growth and leaf area occurred at the same time, the highest percentage agreeing with the largest canopy leaf area indices. This dynamic growth was not followed in the case of soybean, where the plant develops its canopy in great haste once covered. The development was apical exponential until reaching a constant height. Therefore, the feasibility of this approach is restricted to the early stages of soybean development, until it reaches the highest percentage of land shaded.
y = 0.0015x1.7372
r2 = 0.8867
0
1
2
3
4
0 20 40 60 80 100
PGC (%)
LA
I
y = 0.0058x1.3241
r2 = 0.896
0
1
2
0 20 40 60 80 100
PGC (%)
LA
I
y = 0.2342e0.0252x
r2 = 0.9154
0
1
2
0 20 40 60 80 100
PGC (%)
LA
I
y = 0.0973e0.0374x
r2 = 0.8735
0
1
2
3
4
5
6
7
0 20 40 60 80 100
PGC (%)
LA
I
Fig. 13. Relationship between leaf area index (LAI) estimated through the destructive sampling of biomass and the percentage of shaded ground measured (PGC) by the reclassification method for Tobacco, Eggplant, Pepper and Soybean.
Pepper Soybean
Tobacco Eggplant
www.intechopen.com
Solar Radiation Effect on Crop Production
189
6. Conclusions
The productivity of a crop depends on the ability of plant cover to intercept the incident radiation, which is a function of the leaf area available, the architecture of vegetation cover and conversion efficiency of the energy captured by the plant in biomass.
Water stress and nutrition reduce LAI to a smaller size and greater leaf senescence. The smaller size of LAI agrees with light capture and thus crop growth, decreasing the efficiency of radiation.
The measurement of radiation intercepted by a crop for formation of leaf area is an important factor in monitoring crops, water relations studies, and nutrition and in crop simulation models
Measurements taken from digital images exhibit practical advantages with respect to the PAR bar, which must be used at solar noon. In contrast, measurements obtained with a digital camera can be taken at any time of the day and full sunshine is not necessary.
The data obtained by digital photography PGC allow rapid estimation of leaf area using a camera and free software obtaining LAI values in the simplest way than when measured with a planimeter carried out using destructive measurement and individual leaf analysis.
7. Acknowledgment
INIA proyect RTA04-060-C6-03
Junta de Extremadura proyect PRI-08A069 and GRU 10130
Cofinanced by FEDER
8. References
Adams, J.E. & G.F.Arkin. (1977).Alight interception method for measuring row crop ground cover. Soil Sci. Soc. Amer. J. 41:789–792.
Adamsen, FJ; Pinter, PJJ; Barnes, EM; LaMorte, RL; Wall, GW; Leavitt, SW & Kimball, BA. (1999). Measuring wheat senescence with a digital camera. Crop Science 39:719-724.
Allen, RG; Pereira, LS; Raes, D & Smith, M. (1998). Crop evapotranspiration - Guidelines for computing crop water requirements. FAO Irrigation and drainage paper 56.
Bange, MP ; Hammer, GL & Rickert, KG. (1997). Effect of specific leaf nitrogen on radiation use efficiency and growth of sunflower. Crop Sci.; 37:1201–1207.
Barclay, HJ; Trofymow, JA & Leach RI. (2000). Assessing bias from boles in calculating leaf area index in immature Douglas-fir with the LI-COR canopy analyzer. Agricultural and Forest Meteorology 100:255-260.
Baret, F.; Guyot, G. & Major, D.J. (1989). Crop biomass evaluation using radiometric measurements. Photogrammetría (PRS), 43: 241- 256.
Becker, P; Erhart, DW & Smith, AP. (1989). Analysis of forest light environments. Part I. Computerized estimación of solar radiation from hemispherical canopy photographs. Agriculture Forest meteorology 44(3-4):217-232.
Bellairs, SM; Turner, NC; Hick, PT & Smith, RCG. (1996). Plant and soil influences on estimating biomass of wheat in plant breeding plots using field spectral radiometers. Australian Journal Agriculture Research 47:1017-1034.
www.intechopen.com
Solar Radiation
190
Beverly, RB. (1996). Video image analysis as nondestructive measure of plant vigor for precision agriculture. Soil Science and Plant analysis 27:607-614.
Blackmer, TM; Schepers, JS; Varvel, GE & Meyer GE. (1996). Analysis of aerial photography for nitrogen stress within corn fields. Agronomy Journal 88:729-733.
Blazquez, CH; Elliot, RA & Edwards GJ. (1981). Vegetable crop management with remote sensing. Photogrammetric Engineering and Remote Sensing 47:543-547.
Boissard, P; Pointel, J & Tranchefort J. (1992). Estimation of the ground cover ratio of a wheat canopy using radiometry. International Journal Remote Sensing 13(9):1681-1692.
Boyer JS. (1970). Leaf enlargement and metabolic rates. Plant Physiol. 46:233–235.
Brougham, RW. (1957). Interception of light by the foliage of pure and mixed stands of pasture plants. Australian Journal Agriculture Research 9(1):39-52.
Campbell, GS. (1986). Extinction coefficients for radiation in plant canopies calculated using an ellipsoidal inclination angle distribution. Agriculture Forest meteorology 36:317-321
Campillo, C. ; García, M.I. ; Daza, C. & Prieto M.H.(2010). Study of a non-destructive method for estimating the leaf area index in vegetable crops using digital images. Hortscience 45 (10): 1459-1463.
Campillo, C. ; Prieto M.H. ; Daza, C. ; Moñino, M.J. & García, M.I. (2008). Using digital images to characterizing the canopy coverage and light interception in a processing tomato crop. Hortscience 43 (6): 1780-1786.
Cintra, WJ; Ribeiro, FX; Resende, R & Costa LZ. (2001). Comparison of Two Methods for Estimating Leaf Area Index on Common Bean. Agronomy Journal 93:989-991.
Coombs, J; Hall, D.O.; Long, S.P. & Scurlock; M.O. (1985). Techniques in bioproductivity and photosyntesis.21-25.
Chen, Y.H.; Yu S.L. & Yu Z.W. (2003): Relationship between amount or distribution of PAR
interception and grain output of wheat communities. Acta Agron. Sin., 29: 730–734. Christensen, S. & Goudriaan, J. (1993). Deriving light interception and biomass from spectral
reflectance ratio. Remote Sensing of Environment, 43: 87-95. D'urso, G.; Richter, K.; Calera A.; Osann M.A.; Escadafal R.; Garatuzapajan J.; Hanich I.;
Perdigäo A.; Tapia J.B. & Vuolo F. (2010). Earth observation products for operational irrigation management in the context of the pleiades project, Agricultural water management, 98, 271-282
Doorenbos, J & Pruitt WO. (1977). Guidelines for predicting crop water requirements. FAO Irrigation and Drainage; Rome. p 144.
Egli, D.B. (1994). Mechanisms responsible for soybean yield response to equidistant planting patterns. Agron. J. 86:1046–1049. Evans LT. (1975). Crop Physilogy. 1-22 p.
Evans JR. (1983). Nitrogen and photosynthesis in the flag leaf of wheat (Triticum aestivum L.). Plant Physiol. 72:297–302.
Ewing, RP & Horton R. (1999). Quantitative Color Image Analysis of Agronomic Images. Agronomy Journal 91:148-153
Flowers, M; Heiniger, R & Weisz R. (2001). Remote sensing of winter wheat tiller density for early nitrogen application decisions. Agronomy Journal 93:783-789.
Ford, DR. (1997). Minimizing errors in LAI estimates from laser-probe inclined-point quadrats. Field Crops Research 51:231-240.
www.intechopen.com
Solar Radiation Effect on Crop Production
191
Frazer, GW; Fournier, RA; Trofymow, JA & Hall, RJ. (2001). A comparison of digital and film fisheye photography for analysis of forest canopy structure and gap light transmission. Agricultural and Forest Meteorology 109:249-263.
Gallagher, JN & Biscoe, PV. (1978). Radiation absorption, growth and yield of cereals. J. Agric. Sci. Camb. 91:47–60.
Gallo, KP & Daughtry CST. (1986). Techniques for measuring intercepted and absorbed photosynthetically active radiation in corn canopies. Agronomy Journal 78:752-756.
Gardner, FP; Parce; R. & Mitchel; R.L. (1985). Carbon fixation by crop canopies. Physiology of Crop Plants:31-57.
Gilabert, MA; Gozález-Piqueras, J & García-Haro J. (1997). Acerca de los índices de vegetación. Revista de teledetección 8:1-10.
Giménez, C. 1985. Resistencia a sequıía de cultivares de girasol bajo condiciones de campo. Tesis Escuela Superior De Ingenieros Agrónomos. Universidad de Cordoba.
Gosse, G ; Varlet-Grancher, C ; Bonhomme, R ; Chartier, M ; Allirand, JM & Lemaire G (1986). Maximum dry matter production and solar radiation intercepted by a canopy. Agronomie, 6: 47-56.
Goward, SN; Markham, B; Dye, DG; Dulaney, W & Yang J. (1991). Normalized difference vegetation index measurements from the Advanced Very High Resolution Radiometer. Remote Sensing Environment 35:257-277.
Grattan, SR; Bowers, W; Dong, A; Snyder, RL; Carroll, JJ & William G. (1998). New crop coefficients estimate water use of vegetables; row crops. California Agriculture 52(1):16-20.
Green, EP; Mumby, PJ; Edwards, AJ; Clark, CD &Ellis AC. (1997). Estimating leaf area index of mangroves from satellite data. Aquatic Botany 58:11-19.
Green, CF. (1987). Nitrogen nutrition and wheat in growth in relation to absorbed solar radiation. Agric. For. Meteorol. 41:207–248.
Han, H.; Li, H.; Ning, T.; Zhang, X.; Shan, Y & Bai, M. (2008). Radiation use efficiency and yield of winter wheat under deficit irrigation in North China. Plant soil environ., 54,
2008 (7): 313–319. Hall, AJ; Connor, DJ & Sadras VO. (1995). Radiation use efficiency of sunflower crops:
effects of specific leaf nitrogen and ontogeny. Field Crops Res. 41:65–77.
Hay, R; Walker, A. (1989). An introduction to the Physiology of Crop Yield. 292 p. Hayes, JC & Han, YJ. (1993). Comparison of crop-cover measuring systems. Transactions of
the ASAE 36:1727-1732. Henley, WJ; Levavasseur, G; Franklin, LA; Osmond, CB & Ramus, J. (1991).
Photoacclimation and photoinhibition in Ulva rotundata as influenced by nitrogen availability. Planta 184:235–243.
Inthapan, P & Fukai, S. (1988). Growth and yield of rice cultivars under sprinkler irrigation in South Eastern Queensland. 2. Comparison with maize and grain sorghum under wet and dry conditions. Aust. J. Exp. Agric. 28:243–248.
Jamieson, PD; Martin, RJ; Francis, GS & Wilson, DR. (1995). Drought effects on biomass production and radiation use efficiency in barley. Field Crops Res. 43: 77–86.
Kiniry, J.R. (1999). Response to questions raised by Sinclair and Muchow. Field Crops Research 62:245-247.
www.intechopen.com
Solar Radiation
192
Kiniry, J.R.; Landivar, J.A.; Witt, M.; Gerik, T.J.; Cavero, J. & Wade, L.J. (1998). Radiation-use efficiency response to vapor pressure deficit for maize and sorghum. Field Crops Research 56:265-270.
Klassen, SP; Ritchie, G; Frantz, JM; Pinnock, D & Bugbee B. (2001). Real-time imaging of ground cover: Relationships with radiation capture; canopy photosynthesis; and daily growth rate. Crop Science Society of America Special Publication on Digital Technologies;19.
Kvet, J. & J.K. Marshall. (1971). Assessments of leaf area and other assimilating plant surfaces. Z.sesta´k jc, and p.g. jarvis, The Hague, The Netherlands. p. 517–574.
Lang, ARG; Yuequin, X & Norman JM. (1985). Crop structure and the penetration of direct sunlight. Agriculture Forest Meteorology 35:83-101.
Landsberg, J.J. & F.J. Hingston. (1996). Evaluating a simple radiation/dry matter conversion model using data from Eucalyptus globulus plantations in Western Australia. Tree Physiology 16:801-808.
Lecoeur, J & Ney B. (2003). Change with time in potential radiation use efficiency in field
pea. Eur. J. Agron. 19:91–105. Li-Cor. (1989). LAI-2000 Plant canopy analizer operating manual. Li-cor; Lincoln;NE. 180 p. Li, Q.Q.; Chen, Y.H.; Liu, M.Y.; Zhou, X.B; Yu S.L. & Dong B.D. (2008): Effects of irrigation
and planting patterns on radiation use efficiency and yield of winter wheat in
North China. Agric. Water Manage., 95: 469–476. Loomis, RS & Connor DJ. (2002). Crop Ecology: Productivity and management in
agricultural system. Cambridge University press. Malone, S; Herbert, D. A.Jr. & Holshouser D.L. (2002). Evaluation of the LAI-2000 Plant
Canopy Analyzer to Estimate Leaf Area in Manually Defoliated Soybean. Agronomy Journal 94:1012-1019.
Mariscal, M.J.; Orgaz, F. & Villalobos, F.J. (2000). Radiation-use efficiency and dry matter partitioning of a young olive (Olea europaea) orchard. Tree Physiology 20:65-72.
Meliá, J & Gilabert MA. (1990). La signatura espectral en teledetección. Aplicaciones a problematicas vegetales; Universidad del País Vasco.
Meinzer, FC & Zhu, J. (1998). Nitrogen stress reduces the efficiency of the C4 CO2 concentrating system and, therefore, the quantum yield, in Saccharum (sugarcane) species. J. Exp. Bot. 49:1227–1234.
Miralles, D.J. & Slafer, G.A. (1997): Radiation interception and radiation use efficiency of
near-isogenic wheat lines with different height. Euphytica, 97: 201–208. Monteith, JL. (1977). Climate and the efficiency of crop production in Britain. Philos. Trans.
R. Soc. Lond. Ser. B 281:277–294. Monteith, J.L. (1994). Validity of the correlation between intercepted radiation and biomass.
Agricultural and Forest Meteorology 68:213-220. Molloy, JM & Moran, CJ. (1991). Compiling a field manual from overhead photographs for
estimating crop residue cover. Soil Use and Management 7(4):177-182. Muchow, RC. (1992). Effects of water and nitrogen supply on radiation interception and
biomass accumulation of kenaf (Hibiscus cannabinus) in a semi-arid tropical environment. Field Crops Res. 28:281–293.
Muchow, RC & Davis R. (1988). Effect of nitrogen supply on the comparative productivity of maize and sorghum in a semi-arid tropical environment. II. Radiation interception and biomass accumulation. Field Crops Res. 18:17–30.
www.intechopen.com
Solar Radiation Effect on Crop Production
193
Muchow, RC. (1994). Effect of nitrogen on yield determination in irrigated maize in tropical and subtropical environments. Field Crops Res. 38:1–13.
Muchow, RC. (1989). Comparative productivity of maize, sorghum and pearl millet in a semiarid tropical environment. 1. Yield potential. Field Crops Res. 20:191–205.
Nam, NH; Subbarao, GV; Chauhan, YS & Johansen C. (1998). Importance of canopy attributes in determining dry matter accumulation of pigeonpea under contrasting moisture regimes. Crop Sci. 38:955–961.
Olmstead, MA; Wample, R; Greene, S & Tarara J. (2004). Nondestructive measurement of vegetative cover using digital image analysis. Hortscience 39(1):55-59.
Olmstead, MA; Lang, ARG & Grove GG. (2001). Assessment of severity of powdery mildew infection of sweet cherry leaves by digital image analysis. Hortscience 36(1):107-109.
Ortega-Farías, S; Calderón, R; Martelli, N & Antonioletti R. (2004). Evaluación de un modelo para estimar la radiación neta sobre un cultivo de tomate industrial. Agricultura técnica 64:1-11.
Otegui, ME (1992). Incidencia de una sequía alrededor de antesis en el cultivo de maíz. Consumo de agua, producción de materia seca y determinación del rendimiento. Tesis de Magister Scientiae Thesis, UNMdP, Balcarce, Buenos Aires, Argentina, 93 pp.
Paruelo, JM; Lauenroth, WK & Roset PA. (2000). Estimating aboveground plant biomass using a photographic technique. Journal Rangeland Management 53(2):190-193.
Patón, D; Núñez-Trujillo, J; Muñoz, A & Tovar J. (1998). Determinación de la fitomasa forrajera de cinco especies del género Cistus procedentes del parque natural de Monfragüe mediante regresiones múltiples. Archivos de Zootecnía 47(177):95-105.
Purcell, LC. (2000). Soybean canopy coverage and light interception measurements using digital imagery. Crop Science 40:834-837.
Richardson, MD; Karcher DE & Purcell LC. (2001). Quantifying Turfgrass Cover Using Digital Image Analysis. Crop Science 41:1884-1888.
Robertson, MJ & Giunta, F. (1994). Responses of spring wheat exposed to pre-anthesis water stress. Aust. J. Agric. Res. 45:19–35.
Rodrıíguez, A.; de la Casa, A.; Accietto, R.; Bressanini, L. & Ovando, G. (2000). Determinación del área foliar en papa (Solanumtuberosum L., var. Spunta) por medio de fotografıías digitales conociendo la relación entre el número de pixeles y la altura de adquisición. Revista brasileira de agrometeorologıa 8:215–221.
Röhrig, M; Stützel, H; Alt, C. (1999). A three-dimensional approach to modeling light interception in heterogeneous canopies. Agronomy Journal 91:1024-1032.
Sheehy, J; Green, R & Robson M. (1975). The influence of water stress on the photosynthesis of a simulated sward of perennial ryegrass. Ann. Bot. 39:387–401.
Serrano, L; Filella, I & Penuelas J. (2000). Remote sensing of biomass and yield of winter wheat under different nitrogen supplies. Crop Science 40:723-731.
Shanahan, JF; Schepers, JS; Francis, D; Varvel, GE; Wilhelm, WW; Tringe, JM; Schlemmer, MR & Major DJ. (2001). Use of remote-sensing imagery to estimate corn grain yield. Agronomy Journal 93:583-589.
Sinclair, TR. (1990). Nitrogen influence on the physiology of crop yield. In: Rabbinge R, Goudriaan J, van Keulen H, Penning de Vries T, van Laar HH, eds. Theoretical Production Ecology: Reflections and Prospects. Wageningen: PUDOC, 41–55.
www.intechopen.com
Solar Radiation
194
Stöckle, C.O. & A.R. Kemanian. (2009). Crop radiation capture and use efficiency: A framework for crop growth analysis. In Crop Physiology (V. Sadras and D. Calderini Eds). Academic Press, Elsevier Inc. p 145-170.
Subbarao, GV; Johansen, C; Slinkard, AE; Nageswara; Rao, RC; Saxena, NP & Chauhan, YS. (1995). Strategies for improving drought resistance in grain legumes. Crit. Rev. Plant Sci. 14:469–523.
Subbarao, G.V.; Ito, O. & Berry, W. (2005). Crop Radiation Use Efficiency and Photosynthate Formation-Avenues for Genetic Improvement, M. Pessarakli, Editor, Handbook of photosynthesis, (2nd ed.), Taylor and Francis, New York.
Thenkabail, P; Ward, A; Lyon, J & Van Deventer, P. (1992). Landsat thematic mapper indices for evaluating management and growth caracteristics of soybean and corn. transactions of the ASAE 35:1441-1448.
Turner, NC. (1997). Further progress in crop water relations. Adv. Agron. 58:293–337.
Uhart, S.A. & Andrade, F.H. (1995). Nitrogen deficiency in maize. I. Effects on crop growth,
development, dry matter partitioning and kernel set. Crop Sci., 35: 1376–1383. Van Henten, EJ & Bontsema J. (1995). Non-destructive crop measurements by image
processing for crop growth control. Journal Agric Engng Res 61:97-105. Varlet-Grancher, C; Bonhomme, R. & Sinoquet, H. (1993). Crop structure and light
microclimate. 518 p. Villalobos, FJ; Mateos, L; Orgaz, F & Fereres E. (2002). Fitotecnia: Bases y tecnologías de la
producción agrícola. Mundi-Prensa; editor. 496 p. Wanjura, DF & Hatfield JL. (1986). Sensitivity of spectral vegetative indices to crop biomass.
transactions of the ASAE 30:810-816. Watson DJ. 1947. Comparative physiological studies on the growth of field crops: I.
Variation in net assimilation rate and leaf area between species and varieties, and with and between years. Annals of Botany. 11:41-76
Welles, JM & Norman JM. (1991). Instrument for indirect measurement of canopy architecture. Agronomy Journal 83:818-825.
White, MA; Asner, GP; Nemani, RR; Privette, JL & Running SW. (2000). Measuring fractional cover and leaf area index in arid ecosystems: digital camera; radiatuon transmittace and laser altimetry methods. Remote Sensing Environment 74(45-57).
Wiegand, CL; Richardson, AJ & Kanemasu ET. (1979). Leaf area index estimates for wheat from LANDSAT and their implications for evapotranspiration and crop modeling. Agronomy Journal 71:336-342.
Whitfield, D.M. & Smith C.J. (1989). Effect of irrigation and nitrogen on growth, light
interception and efficiency of light conversion in wheat. Field Crops Res. 20: 279–295. Whitmarsh & Govindjee. (1999). The photosynthetic process. In: "Concepts in Photobiology:
Photosynthesis and Photomorphogenesis", Edited by Singhal, Renger, SK Sopory, K-D Irrgang and Govindjee, Narosa Publishers and Kluwer Academic, pp. 11-51.
Wright, GC; Bell, MJ & Hammer GL. (1993). Leaf nitrogen content and minimum temperate
interactions affect radiation-use efficiency in peanut. Crop Sci.33:476–481. Yonekawa, S; Sakai, N & Kitani O. (1996). Identification of idealized leaf types using simple
dimensionless shape factors by image analysis. transactions of the ASAE 39(4):1525-1533.
www.intechopen.com
Solar RadiationEdited by Prof. Elisha B. Babatunde
ISBN 978-953-51-0384-4Hard cover, 484 pagesPublisher InTechPublished online 21, March, 2012Published in print edition March, 2012
InTech EuropeUniversity Campus STeP Ri Slavka Krautzeka 83/A 51000 Rijeka, Croatia Phone: +385 (51) 770 447 Fax: +385 (51) 686 166www.intechopen.com
InTech ChinaUnit 405, Office Block, Hotel Equatorial Shanghai No.65, Yan An Road (West), Shanghai, 200040, China
Phone: +86-21-62489820 Fax: +86-21-62489821
The book contains fundamentals of solar radiation, its ecological impacts, applications, especially inagriculture, architecture, thermal and electric energy. Chapters are written by numerous experienced scientistsin the field from various parts of the world. Apart from chapter one which is the introductory chapter of thebook, that gives a general topic insight of the book, there are 24 more chapters that cover various fields ofsolar radiation. These fields include: Measurements and Analysis of Solar Radiation, Agricultural Application /Bio-effect, Architectural Application, Electricity Generation Application and Thermal Energy Application. Thisbook aims to provide a clear scientific insight on Solar Radiation to scientist and students.
How to referenceIn order to correctly reference this scholarly work, feel free to copy and paste the following:
Carlos Campillo, Rafael Fortes and Maria del Henar Prieto (2012). Solar Radiation Effect on Crop Production,Solar Radiation, Prof. Elisha B. Babatunde (Ed.), ISBN: 978-953-51-0384-4, InTech, Available from:http://www.intechopen.com/books/solar-radiation/solar-radiation-effect-on-crop-production