Embed Size (px)
Citation preview

DIVISION S-6—SOIL & WATER MANAGEMENT& CONSERVATION
Soil Water Storage in Dryland Cropping Systems: The Significanceof Cropping Intensification
H. J. Farahani,* G. A. Peterson, D. G. Westfall, L. A. Sherrod, and L. R. Ahuja
ABSTRACTSoil and water conservation is essential to the sustainability of
Great Plains dryland agriculture. We hypothesized that cropping in-tensification improves the efficient use of precipitation. We evaluatedlong-term observations of soil water at three locations in easternColorado for a range of pan evaporations (1050-1900 mm), soils,and cropping systems. Soils at various locations were mostly of theArghistoll subgroup except for one Ustochrept and one Haplargid,both at the higher evaporation location. Normal precipitation at thethree locations ranges from 400 to 425 mm yr '. Systems included a2-yr winter wheat (Triticum aestivum L.)-fallow (WF) and moreintense 3-yr winter wheat-corn (Zea mays L.)-fallow and winterwheat-sorghum [Sorghum bicolor (L.) Moench]-fallow and 4-yr rota-tions. To quantify the effectiveness of the intensified systems at utiliz-ing precipitation, we introduce the System-Precipitation-Storage In-dex (SPSI) and System-Precipitation-Use Index (SPUI). Mean SPSIvalues were 0.19 and 0.28 for 2- and 3-yr systems, respectively, meaningthat the fallow periods in the 3-yr rotation were collectively 47%more efficient at storing precipitation than fallow in WF. Inclusionof a summer crop, such as corn or sorghum, increased the fractionof precipitation allocated to growing-season crop production (i.e.,SPUI) from 0.43 in WF to 0.56 (i.e., an increase of 30%) in 3-yrsystems. The gains in efficient use of precipitation with intensificationresulted from (i) reducing the frequency of the inefficient fallowpreceding wheat, and (ii) using water for transpiration that wouldotherwise be lost during fallow through soil evaporation, runoff, anddeep percolation.
THE PRACTICE OF SUMMER FALLOW dominates theNorth American Great Plains in regions that receive
<500 mm in annual precipitation. With this practice,no crop is grown during the fallow period and weeds arecontrolled by cultivation or chemicals for the purpose ofenhancing soil water storage and nutrient availabilityfor the subsequent crop. Both winter and spring wheat-fallow systems are practiced in the Great Plains. In thecentral and southern Great Plains, hard red winterwheat is the dominant dryland crop, primarily due toits high yield potential (Greb et al., 1979). For winter
H.J. Farahani, USDA-ARS Water Management Research Unit, Ag-ricultural Engineering Research Center, Colorado State Univ., FortCollins, CO 80523; G.A. Peterson and D.G. Westfall, Dep. of Soiland Crop Sciences, Colorado State Univ., Fort Collins, CO 80526;L.A. Sherrod and L.R. Ahuja, USDA-ARS Great Plains SystemsResearch Unit, Fort Collins, CO. A joint contribution from the Dep.of Soil and Crop Sciences, Colorado State Univ., and the USDA-ARS Great Plains Systems Research Unit, Fort Collins, CO. Received9 June 1997. * Corresponding author ([email protected]).
Published in Soil Sci. Soc. Am. J. 62:984-991 (1998).
wheat, the fallow period is approximately 14 mo, run-ning from harvest in July to planting in September ofthe next year.
Most Great Plains farmers agree that water is theprimary limiting factor controlling dryland production.Yet only a small portion of the precipitation receivedis stored in the soil during fallow, and evaporation fromthe soil far exceeds other losses. Mathews and Army(1960) summarized soil water storage and precipitationfor 25 stations for the first half of this century, represent-ing >450 wheat-fallow years on well-managed fallowlands in the Great Plains. The average soil water storageduring the fallow (for both winter and spring wheat)was 100 mm or 16% of the precipitation (617 mm)received, corresponding to an 84% loss of precipitation.They attributed this loss to evaporation from the soil,since runoff and deep seepage losses were known tobe very low. In a recent review, Peterson et al. (1996)examined the effects of tillage and residue managementon fallow soil water storage from Canada to Texas.Fallow soil water storage efficiencies using no-till sum-mer fallow were reported as 10% in Texas, 22% ineastern Colorado, and 25 to 30% in western Kansas forthe 14-mo fallow period of winter wheat, and from 18to 37% in the northern Great Plains for the 21-mo fallowof spring wheat. From their summary, an average effi-ciency of 25% was found for water storage during fallow(for both winter and spring wheat) in the Great Plains.Comparing this with the earlier findings of Mathewsand Army (1960), one may conclude that from the dustmulch days in the early 1900s to the present era, fallowefficiency has only improved from 16 to 25% storagewith no-till fallow. A huge loss, 75% of the fallow precip-itation, still remains, even with our best-known soil andwater conservation practices.
Existing soil and water conservation practices, veryimportant to erosion and soil productivity, are at or neartheir practical limits of water conservation. A differentapproach to water conservation and efficient use of pre-cipitation is obviously needed. The most direct and prac-tical solution to improving efficient use of precipitationis the inclusion of a summer crop (i.e., corn, sorghum,millet [Panicum miliaceum L.], or sunflower [Helianthus
Abbreviations: ET, evapotranspiration; SD, standard deviation; SPSI,System-Precipitation-Storage Index; SPUI, System-Precipitation-Use Index; WCF, 3-yr winter wheat-corn-fallow rotation; WCMF,4-yr winter wheat-corn-millet-fallow rotation; WF, 2-yr winterwheat-fallow rotation; WSF, 3-yr winter wheat-sorghum-fallow rota-tion; WSSF, 4-yr winter wheat-sorghum-sorghum-fallow rotation.
984

FARAHANI ET AL.: SOIL WATER STORAGE IN DRYLAND CROPPING SYSTEMS 985
annuus L.]) in the year following the wheat crop. Thelogic behind this solution is twofold: (i) summer rainfallprevails in the Great Plains, with nearly 75% of theannual precipitation occurring from April to September,and (ii) fallow soil water storage efficiency is lowest,even negative at times, during summer periods whenprecipitation is greatest. If summer rainfall is not utilizedby a crop, it will be consumed via evaporation. Anexample is replacing the 2-yr wheat-fallow by a moreintense 3-yr wheat-corn, sorghum, millet, or sunflower-fallow rotation. The immediate question is, "Will therebe adequate soil water at spring planting in the yearfollowing a wheat crop?"
The term cropping intensification is used to definedryland systems with more crops and less summer fallowper unit time. We define the system as a complete cycleof a dryland cropping sequence that includes all cropand fallow periods. A crop period is defined by thegrowing season. A fallow period refers to the periodfrom harvest of one crop to planting of the next.
The underlying concepts that favor cropping intensifi-cation as a fundamental and practical solution to ineffi-cient fallow are not entirely evident from the literature.In particular, evaluation and comparison of intensifiedsystems are made difficult because the frequency of cropoccurrence and duration of fallow periods varies, andtheir time-of-year precipitation characteristics varyamong systems with differing crop choice and sequence.Quantitative measures and indices are needed to studyintensified rotations on a system basis. From a systemsperspective, three questions are of importance: (i) Howefficiently is precipitation received during the fallowperiods stored in the soil? (ii) How effectively is systemprecipitation allocated between crop and fallow peri-ods? and (iii) How efficiently is the stored water utilizedto produce biomass?
Our objective in this study was to answer the firsttwo questions by exploring how intensification affectsefficient storage and use of precipitation. The thirdquestion deals with system production and productivity(i.e., yield, crop water use, and water use efficiency),and was not studied. We present soil water storage dataacross a range of climate, soils, and dryland croppingsystems, with increasing cropping intensity from the tra-ditional 2-yr winter wheat-fallow to 3- and 4-yr ro-tations.
MATERIALS AND METHODSDryland Agroecosystem Management Project
The data used in this study were obtained from the Sustain-able Dryland Agroecosystem Management Project (Petersonet al, 1993a), established in 1985 to study dryland no-till crop-ping systems in eastern Colorado. The extent of the projectis well beyond the objectives pursued here, and thus only asummary of relevant methods is provided below.
The project includes three farmer-owned locations in Colo-rado, near the communities of Sterling (40.37°N, 103.13°W,1341 m above mean sea level [MSL]), Stratton (39.18°N,102.26°W, 1335 m above MSL), and Walsh (37.23°N, 102.17°W,1134 m above MSL). The climate is cool, semiarid with a meanannual temperature of 10°C, and becomes warmer and drier
north (Sterling) to south (Walsh), representing nearly a two-fold increase in pan evaporation from Sterling (1050 mm) toWalsh (1900 mm). Long-term precipitation ranges from 400to 425 mm yr~' for all locations, with most occurring duringMay and June. The cropping systems under study have fourdriving variables: (i) climate, (ii) soil, (iii) cropping intensity,and (iv) time. The soil driving variable has three levels, witheach level being represented by a distinct soil type at a distinctposition on the landscape. For instance, at each location, eachexperimental unit (or treatment plot) has three soil typesrelating to three hillside positions on a soil catena ranging inslope from <1% on the summit and toeslope to as high as5% on the adjoining sideslope (see Fig. 1).
The cropping systems imposed at each location are a contin-uum of increasing cropping intensity and fewer summer fallowperiods per unit time, with all systems managed using no-tilltechniques. The use of the term no-till is not intended to implyabsolutely no tillage since on a few occasions sweep tillagewas required to eliminate herbicide-resistant perennial grassyweeds. The selection of the cropping systems and crops wasinitially based on regional research findings and producers'interests. The benchmark cropping system is the WF, withone crop every 2 yr; or a 0.5 cropping (and 0.5 summer fallow)intensity per year. Cropping intensity increases to 0.67 (twocrops every 3 yr) and summer fallow intensity decreases to0.33 (one summer fallow every 3 yr) for the 3-yr rotationsof wheat-corn-fallow (WCF) and wheat-sorghum-fallow(WSF), and similarly to 0.75 (0.25 summer fallow inten-sity) for the 4-yr rotations of winter wheat-corn-millet-fal-low (WCMF) and winter wheat-sorghum-sorghum-fallow(WSSF). The systems evaluated at Sterling and Stratton areWF, WCF, and WCMF. At Walsh, we replaced corn and milletwith sorghum (i.e., the cropping systems are WF, WSF, andWSSF), which was due to the longer growing season at Walshcoupled with a better response of sorghum than corn or prosomillet to water stress and temperature. We refer to sorghumin WSF and the first sorghum in WSSF by sorghum-1. Theterm sorghum-2 refers to the second year of sorghum in theWSSF system.
Hard red winter wheat (TAM 107') was planted in mid(Sterling and Stratton) to late (Walsh) September, in rows 0.3m apart at a rate of 67 kg ha"1. Wheat was harvested thefollowing year in mid-July (Sterling and Stratton) and lateJune (Walsh). Corn (Pioneer 3732) was planted in mid-May,in rows 0.76 m apart at a rate of 33 000 to 42 000 seeds ha"1,and was harvested in early October. Proso millet ('Cope' or'Sunup') was planted in early June, in rows 0.3 m apart at arate of 10 kg ha"1, and was harvested late August. Sorghum(Cargill 607E) was planted during early June, in rows 0.76 mapart at a rate of 86500 to 106000 seeds ha"1, and was har-
Summit
ideslope
Toeslope
Fig. 1. A schematic diagram of the experimental units (strips) placedon a soil catena having three distinct slope positions and soils.Each experimental unit constitutes a cropping system, with eachsystem replicated twice (not to scale).

986 SOIL SCI. SOC. AM. J., VOL. 62, JULY-AUGUST 1998
Table 1. Soil classification, series, and surface texture for each slope position at the three experimental locations.
Location
Sterling
Stratton
Walsh
Slopeposition
SummitSideToeSummitSideToeSummitSideToe
Soil classification
Fine, mixed, mesic Aridic ArgiustollFine-loamy, mixed, mesic Aridic ArgiustollFine-loamy, mixed, mesic Pachic ArgiustollFine-silty, mixed, mesic Aridic ArgiustollFine, montmorillonitic, mesic Aridic ArgiustollFine-silty, mixed, mesic Pachic ArgiustollFine-loamy, mixed, mesic Aridic UstochreptFine-loamy, mixed, mesic Ustollic HaplargidFine, montmorilonitic, mesic Aridic Argiustoll
Soil series
WeldSan tanaAlbinasNorkaRichfieldKumaNot assignedNot assignedNunn
Surface texturef
LoamLoamLoamClay loamLoamLoamLoamy sandSandy loamSandy clay loam
t For the top 0.1-m soil surface.
vested in early October. Crop cultivar selection was based onexpert opinions and producers' experiences. Nitrogen fertil-izer was applied annually in accordance with the NO3 contentof the soil profile (0-1.8-m depth) before planting, and ex-pected yield for each soil position at each location. The Nfertilizer source was urea-NH4NO3 solution (32-0-0) and itwas dribbled over the row (directly behind the planter's presswheel). Herbicides were selected to permit crop sequencingby minimizing herbicide carryover problems for each systemat each location.
Each experimental unit (shown in Fig. 1) was 6.1 m wideby 185 to 305 m long, replicated twice. We cannot rule outadvection (and edge) effects from adjacent plots, but we con-sider their influence on the final results to be minimal. Thisis because every unit (plot) is in a different phase each year,with all plots ultimately experiencing similar advection effectsduring a cropping system cycle. In this study, we have notobserved lateral movement of surface water, although no mea-surements have been taken to scientifically rule out possiblecross-contamination of units by lateral runoff. The experimen-tal design was a split block that includes three climate regimesor locations, three soils or slope positions within each location,and three cropping systems at all locations. All phases of eachrotation were present each year. The split-block arrangementwas represented by location (Sterling, Stratton, Walsh) as thehighest level. The second level in the arrangement was slopeposition (i.e., soil, nonrandom treatment). Each phase of eachcropping system was then randomly assigned within eachblock. Analysis of variance (SAS Institute, 1996) included thefactors location, slope position, and rotation using mean valuesacross years (1988-1995) for testing main effects and their in-teractions.
During the past decade, extensive measurements of soil andcrop components have been made on each experimental unit.For the purpose of this study, changes in soil water and precipi-tation were of particular interest. At each location, there weretwo 1.8-m-long aluminum access tubes placed permanently in
Table 2. Soil surface and profile properties for each slope positionat the three experimental locations.
Location
Sterling
Stratton
Walsh
Slopeposition
SummitSideToeSummitSideToeSummitSideToe
Fieldcapacityt
mm profile"1
410380590480560720550600660
Wiltingpointf
mm profile"1
131115173186171249243314341
Bulkdensity!
Mgm '1.421.511.351.411.401.331.511.591.37
Organicmatter!
gkg~'17172518183355
15
t Soil profile depths are 1.8 m for all slopes, except the summit andsideslope at Sterling, which are 1.2 m deep.
! For the top 0.1-m soil surface.
the central area of each slope position in each cropping systemin 1988. The tubes are not removed for any field operationand remain in the exact positions year to year. Soil watercontent measurements were taken biweekly (planting to har-vest) at 0.3-m depth increments to 1.8 m or to the bottom ofthe soil profile using a neutron depth moisture probe (Troxler4300, Troxler Electronic Laboratories, Research TrianglePark, NC). The probe was calibrated at the time of tubeinstallation using gravimetric soil water and bulk density mea-surements. Soil classification, series, and surface texture aregiven in Table 1. Soil surface properties along with profilefield capacity and wilting point values are summarized in Table2. On-site automated weather stations provided hourly mea-surements of rainfall. To account for snowfall during winter,precipitation data from the nearest official weather station toeach location (Leroy Station: 6.4 km from Sterling; StrattonStation: 3.2 km from Stratton; and Stonington Station: 2.4km from Walsh) were used. Because of possible differencesbetween on- and off-location snowfall amounts and snowblowoff patterns, and because of the crude nature of soil watermeasurements associated with neutron attenuation, we im-posed a ±5-mm precision on all reported (mean) precipitation,soil water profile, and soil water storage values.
For our analysis, we used data collected from 1988 through1995, starting with the fall wheat planting in 1988. Althoughthe project was started in 1985, the first 3 yr were requiredto allow the systems to be independent of earlier farmingpractices. Also soil water data were not collected from 1985to 1987. Prior to 1985, conventional WF had been used atthe experimental locations for >50 yr. For analysis, all cropgrowing seasons were ended at physiological maturity, thusmarking the beginning of the subsequent fallow period. Foreach fallow period, soil water storage was calculated as theending minus the beginning soil water profile (profile depthswere 1.8 m for all slopes, except the summit and sideslope atSterling, which were only 1.2 m deep). The term precipitationlost is used to define the difference between the precipitationreceived and the change in soil water between two measure-ment days. The sources of precipitation losses are many, in-cluding evaporation from the soil, runoff, deep percolation,uptake by weeds, and snow blowoff. For the fallow periods(Table 3), soil water storage efficiency was calculated as thesoil water storage divided by incident precipitation (multipliedby 100).
RESULTS AND DISCUSSIONMean yearly precipitation for the experimental period
was nearly equal at all three locations, averaging 465mm (standard deviation [SD] = 70 mm) at Sterling,470 mm (SD = 45 mm) at Stratton, and 460 mm (SD =60 mm) at Walsh, corresponding to 3, 15, and 16%higher than normal (1948-1995), respectively. However,

FARAHANI ET AL.: SOIL WATER STORAGE IN DRYLAND CROPPING SYSTEMS 987
Table 3. Summary of precipitation received during fallow periodsfor all cropping systems at the three experimental locations.
Location
Sterling
Stratton
Walsh
Croppingsystemf
WFWCFWCMFWFWCFWCMFWFWSFWSSF
Precipitation
Wheat
610 (120)fl420 (95)450 (95)645 (85)455 (80)485 (40)705 (115)470 (40)455 (35)
during fallow period precedingCorn or
sorghum-It
360 (75)360 (75)
340 (55)340 (55)
475 (140)475 (140)
Millet orsorghum-2§
195 (10)
195 (65)
240 (85)
Table 4. Plant-available soil water at planting of all crops as af-fected by location (climate), slope (soil), and cropping system(rotation) treatments.
t Cropping systems are wheat-fallow (WF), wheat-corn-fallow (WCF),wheat-corn-millet-fallow (WCMF), wheat-sorghum-fallow (WSF), andwheat-sorghum-sorghum-fallow (WSSF).
I Sorghum-1 denotes sorghum in WSF and the first sorghum crop followingwheat in WSSF.
§ Sorghum-2 denotes the second year of sorghum following wheat inWSSF. At Walsh, proso millet (1989 and 1990) and forage sorghum(1991 and 1992) were planted in place of the second year of sorghumin WSSF.
H Means with standard deviations given in parentheses for 1988 to 1995.
temporal distribution of precipitation was highly vari-able. Table 4 provides available soil water data at plant-ing for all slopes and locations. Calculated values forsoil water storage and storage efficiency during all fallowperiods are summarized in Table 5, providing slope-averaged values for each cropping system and location.We consider the slope-averaged values given in Table5 to best represent the landscape as a whole.
Slope had significant effects on soil water at plantingof all crops, being greater for the toeslope than forsummit and sideslope positions (Tables 4 and 5). Thisprobably resulted from greater water-holding capacitiesfor toeslope soils, coupled with some harvested water(i.e., surface runoff from summit and sideslope posi-tions). This was especially pronounced at Stratton be-cause of its unique topographical configuration, repre-senting an outlet for the immediate surrounding area. Ingeneral, soil water at planting for summit and sideslopesacross all locations is mixed, with no apparent conclusivetrends. Soil water at wheat planting had a significantlocation X rotation interaction, otherwise rotation hadno effect while location effects on soil water at plantingwere significant (being greater at Stratton; Table 5).
Fallow Soil Water StorageThe longest fallow period in our dryland cropping
systems always precedes the winter wheat crop and var-ies in duration from 14 mo in WF, to 10 to 13 moin the 3- and 4-yr systems. Length and time of fallowinfluences the amount of precipitation received duringfallow (Table 3), with the 14-mo fallow having thelargest mean precipitation of 655 mm for all locations(Table 5). During the fallow preceding wheat in all crop-ping systems, the amounts of soil water storage andstorage efficiencies were highly variable across years,and had significant location X slope X rotation interac-tions (Table 5). This is of no surprise in this regionwhere, as stated by Haas and Willis (1962), extremevariability is the rule rather than the exception.
Plant-available soil water at planting^:
Location
Sterling
Stratton
Walsh
Croppingsystemf
WF
WCF
WCMF
WF
WCF
WCMF
WF
WSF
WSSF
Slopeposition
SummitSideToeSummitSideToeSummitSideToeSummitSideToeSummitSideToeSummitSideToeSummitSideToeSummitSideToeSummitSideToe
Wheat
170 (30)#165 (20)225 (50)150 (50)140 (30)240 (50)170 (40)180 (30)250 (50)215 (30)260 (20)380 (25)210 (35)220 (15)390 (35)220 (25)275 (35)340 (30)200 (20)195 (30)220 (20)215 (30)180 (35)250 (25)205 (25)190 (35)225 (20)
Corn orSorghum-l§
155 (30)170 (20)265 (40)165 (40)185 (25)250 (45)
220 (25)250 (25)390 (25)220 (20)265 (20)355 (35)
225 (20)185 (35)235 (45)205 (25)190 (35)210 (55)
Millet orSorghum-211
140 (15)145 (30)215 (45)
185 (55)225 (50)295 (65)
180 (30)160 (35)190 (40)
t Cropping systems are wheat-fallow (WF), wheat-corn-fallow (WCF),wheat-corn-millet-fallow (WCMF), wheat-sorghum-fallow (WSF), andwheat-sorghum-sorghum-fallow (WSSF).
t All values are rounded up to the nearest ±5 mm. Soil profile depthsare 1.8 m for all slopes, except the summit and sideslope at Sterling,which are only 1.2 m deep.
§ Sorghum-1 denotes sorghum in WSF and the first sorghum crop followingwheat in WSSF.
H Sorghum-2 denotes the second year of sorghum following wheat inWSSF. At Walsh, proso millet (1989 and 1990) and forage sorghum(1991 and 1992) were planted in place of the second year of sorghumin WSSF.
# Means with standard deviations given in parentheses for 1988 to 1995.
As shown in Table 5, for the no-till fallow precedingwheat in the WF system, soil water storage ranged from100 and 105 mm at Sterling and Walsh, respectively,to 175 mm at Stratton. These correspond to storageefficiency values ranging from a mean of 15 and 16%at Walsh and Sterling, respectively, to 27% at Stratton.For eastern Colorado, that is an average of only 19%storage (or 125 mm water) for no-till fallow in WF. Theamounts of soil water storage and storage efficiencyduring fallow preceding wheat in the 3-yr systems werenot greatly different than fallow in WF (Table 5). Inthe 4-yr systems, however, soil water storage duringfallow preceding wheat was noticeably less (average ofonly 65 mm) than in the 2- and 3-yr systems. During thelong fallow preceding wheat, surface residue amounts,types, age, cover, and architecture (i.e., standing vs. flat)are all expected to be different for the 2-, 3- and 4-yrsystems. This could play a major role, affecting soil waterstorage differently. During fallow preceding wheat, sur-face residue mass is greater in the order of 4-yr >3-yr > 2-yr rotations. That, however, does not necessar-ily translate into an increasing residue cover in the ordergiven because of differences in residue type, age, andarchitecture. Wheat residues are known to be more ef-

988 SOIL SCI. SOC. AM. J., VOL. 62, JULY-AUGUST 1998
Table 5. Summary of plant-available soil water (PASW) at planting of all crops, and precipitation (P), soil water storage (SWS), andprecipitation storage efficiency (PSE) during all fallow periods as affected by location (climate) and cropping system (rotation)treatments. Values are means across slopes (soil) for 1988 to 1995.
Location
Sterling
Stratton
VValsh
Mean
PASWCropping at wheatsystemf planting
WFWCFWCMFWFWCFWCMFWFWSFWSSF2-yr3-yr4-yr
Analysis of variance, P >Location (L)Slope (S)Rotation (R)L X SL X RS X RL X S X R
185175200285270280205215205225220230
F0.02320.0028
NSNS
0.0278NSNS
Fallow precedingwheat '
P
- mm —610420450645455485705470455655450465
swst
1008050
17511065
10511575
12510565
0.0760NS
0.00010.02590.00050.00030.0103
——————— 1
PSE§
~
161911272512152617192313
NSttNS
0.00010.05470.00080.00170.0328
PASW at con>r sorghum-1'
planting
195200
285280
215200
235225
0.02890.0055
NSNSNSNSNS
Fallow precedingFallow preceding corn millet or
n or sorghum-Ill PASW at millet sorghum-2#n ° „_ „_- i ——— -»u °
p— mm ————
360360
340340
475475
390390
swst
130125
160160
110100
135130
NS0.0001
NS0.0041
NSNSNS
—————————— Ul aUI gllUlll-ATT ——————
PSE§ planting P
-
3736
5448
2119
3734
0.02710.0011
NS0.0210
NSNSNS
—————— mm ———
165 195
235 195
175 240
195 210
0.06980.0183
-NS__-
swst
80
95
80
85
NSNS-
0.0127_--
PSE§
°/o
40
52
37
43
0.0141NS-
0.0203__-
t Cropping systems are wheat-fallow (WF), wheat-corn-fallow (WCF), wheat-corn-millet-fallow (WCMF), wheat-sorghum-fallow (WSF), and wheat-sorghum-sorghnm-fallow (WSSF).
t Soil water storage (SWS) = soil water profile at the end of fallow minus soil water at the beginning of fallow.§ Precipitation storage efficiency (PSE) = (fallow soil water storage divided by fallow precipitation) x 100.U Sorghum-1 denotes sorghum in WSF and the first sorghum crop following wheat in WSSF.# Sorghum-2 denotes the second year of sorghum following wheat in WSSF.tt NS = not significant at the 0.1 level of probability.
fective than corn, sorghum, and millet at retarding evap-oration by providing the most surface cover per unitmass. However, because of decomposition and distur-bance, there is less wheat residue during the fallow pre-ceding wheat in the order of 4-yr < 3-yr < 2-yr systems.In the 4-yr systems, the lack of sufficient wheat residueremaining on the soil 3 yr after wheat harvest couldhave been a major factor affecting soil water storage.In general, wheat straws are hollow (large surface areaper unit mass) and decompose much faster than thepithy corn and sorghum stalks.
Even under the most intense conservation practiceof no-till, the amount of precipitation stored in the soilduring the lengthy fallow that precedes winter wheatwas extremely low, regardless of the intensity of thecropping system. The issue is the large amount of precip-itation lost during fallow, averaging 530, 345, and 400mm in the 2-, 3-, and 4-yr systems. It is important tonote, however, that the more intense 3- and 4-yr systemsare superior to the 2-yr WF because the frequency ofoccurrence of the inefficient lengthy fallow precedingwheat is reduced by intensification. For example, thefallow preceding wheat is reduced from one in every2 yr (or a 0.5 summer fallow intensity per year) in the2-yr WF system to one in every 3 yr (or a 0.33 intensityper year) in the 3-yr system (and to one in every 4 yr[or a 0.25 intensity per year] in the 4-yr system). Bymultiplying each intensity value by the amount of pre-cipitation lost during fallow, one obtains estimates ofannualized precipitation lost during fallow, averaging265 mm yr'1 in WF, 115 mm yr"1 in WCF and WSF,
and 100 mm yr""1 in WCMF and WSSF systems. It isobvious that, at least from a water conservation perspec-tive, intensified systems are superior to WF.
The fallow period preceding corn planting averages11 mo. As shown in Table 5 (and previously by McGeeet al., 1997), soil water storage and storage efficiencypreceding corn (in WCF and WCMF) was much greaterthan for fallow preceding wheat in the same system(Table 5). For example, in the WCF system at Sterling,130 mm of storage (at 37% efficiency) occurred fromwheat harvest to corn planting, while only 80 mm ofstorage (at 19% efficiency) was achieved from corn ma-turity to wheat planting, even though precipitation was60 mm greater in the latter than in the former case.These differences are expected to be partly influencedby the greater standing and flat wheat residues re-maining after wheat harvest, thus providing a bettersurface cover to retard evaporation and snow blowoffand enhance snow catch, than 2 yr later after corn har-vest. Furthermore, corn residues do not provide as ade-quate a cover as wheat residue. During the fallow periodpreceding sorghum-1 (in WSF and WSSF) at Walsh,results of soil water storage and efficiency were quitecomparable to the fallow preceding wheat in the samesystems (Table 5).
Plant-Available Soil WaterTwo of the most significant observations from this
study are as follows. First, based on the landscape aver-age values (Table 5), available soil water at wheat plant-

FARAHANI ET AL.: SOIL WATER STORAGE IN DRYLAND CROPPING SYSTEMS 989
Coin (sorghum-1) in 3-yr systemCorn (sorghum-1) in 4-yr system
Wheat m 2-yr systemWheat in 3-yr system
Sterling WalshStrattonFig. 2. Plant-available soil water at wheat and corn or sorghum-1
planting in mid-September and early May or June, respectively,in the three cropping systems at the Sterling, Stratton, and Walshexperimental locations (values are means across slopes for 1988to 1995). Values above bars are the standard errors of the means.
ing in all three systems at a given location was similar,in spite of the fact that precipitation received duringthe 14-mo fallow in WF was 160 to 250 mm greater thanprecipitation during the fallow preceding wheat in the3- and 4-yr systems. This confirms previous findings ofUnger (1984), Norwood (1994), and Jones and Popham(1997) that available soil water at wheat planting is nota function of the intensity of the cropping system aslong as the wheat is preceded by a lengthy fallow. It isequally important to note that the similarity of soil waterat wheat planting among the systems occurred in spiteof the fact that soil water storage and storage efficiencyduring the fallow preceding wheat planting variedamong the systems, ranging from 125 mm of storage(19% efficiency) in the 2-yr, 105 mm (23%) in the3-yr, to only 65 mm (13%) in the 4-yr rotations (Table5). From a precipitation management perspective, thesimilarity of soil water at wheat planting favors the in-tensified systems over WF, since on the average 200mm less precipitation was required in the intensifiedsystems to store nearly the same amount of soil water.
The second important observation is that at each loca-tion and slope, plant-available soil water at corn (inWCF and WCMF) and sorghum-1 (in WSF and WSSF)planting were similar to the corresponding soil water atwheat planting in the same system (Tables 4 and 5).The observed adequacy of soil water at spring plantingfollowing wheat harvest further emphasizes the poten-tial practicality of the concept of cropping intensifica-tion. Previously, we substantiated the similarity of soilwater at wheat planting among the systems at a location.That combined with the observed similarity in soil waterat wheat and corn or sorghum-1 planting in a givensystem (as highlighted in Fig. 2) is indicative that, onthe average, no additional water was conserved in thesoil during the summer months of fallow just prior towheat planting in September. This was true even thoughnearly 60 to 65% of annual precipitation occurred dur-ing the 4 to 5 mo of summer just prior to wheat planting.This means that most precipitation received during thesummer of fallow just preceding wheat planting waslost. That precipitation, however, was efficiently usedin the intensified systems to grow an additional crop ofcorn or sorghum. Based on our results, spring soil water
350
|̂ 300
I 250s:§.2ooCJ
(S 150
'5 100•3I 50
Summit
6/26/90 Harvest 6/30/94 Harvest6/16/92 HarvestFig. 3. Plant-available soil water (bottom) during two consecutive
wheat-fallow cycles on the summit position at the Sterling location.The top graph shows cumulative precipitation between measure-ment days.
sampling during the past decade would have indicatedfavorable soil water conditions for summer cropping atall three locations.
Soil Water Dynamics during Fallowin Wheat-Fallow
We examined the dynamics of soil water for two con-secutive cycles of WF (1990-1994) on the summit andtoeslope positions at the Sterling location (Fig. 3 and4). For both 1990-1991 and 1992-1993 fallow phasesand on both slopes, soil water decreased during thesummer of fallow from July to wheat planting. For exam-ple, soil water in August 1992 (2 mo after harvest) wasrelatively high due to significant rainfall. From then toSeptember 1993, a total of 440 mm of precipitation wasreceived, but soil water did not change on the summit
06/26/90 Harvest 6/16/92 Harvest 6/30/94 Harvest
Fig. 4. Plant-available soil water during two consecutive wheat-fallowcycles on the toeslope position at the Sterling location.
990 SOIL SCI. SOC. AM. J., VOL. 62, JULY-AUGUST 1998
100
01992 1993Harvest Planting
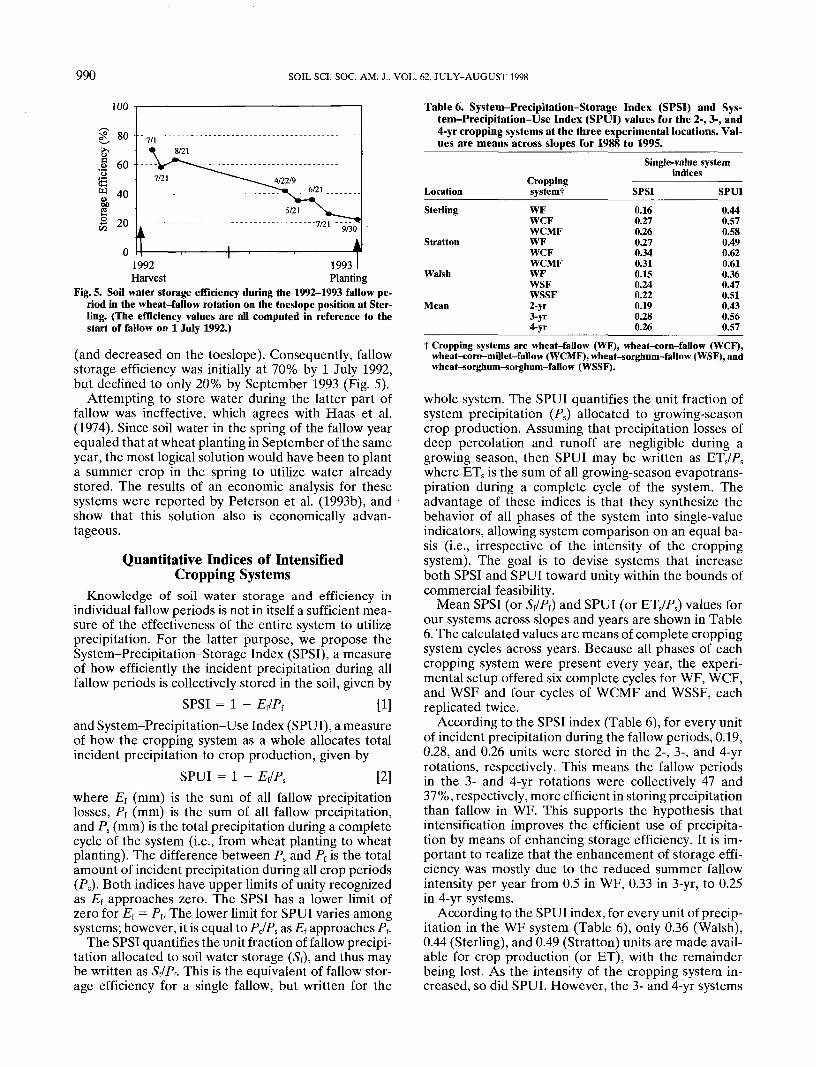
Fig. 5. Soil water storage efficiency during the 1992-1993 fallow pe-riod in the wheat-fallow rotation on the toeslope position at Ster-ling. (The efficiency values are all computed in reference to thestart of fallow on 1 July 1992.)
(and decreased on the toeslope). Consequently, fallowstorage efficiency was initially at 70% by 1 July 1992,but declined to only 20% by September 1993 (Fig. 5).
Attempting to store water during the latter part offallow was ineffective, which agrees with Haas et al.(1974). Since soil water in the spring of the fallow yearequaled that at wheat planting in September of the sameyear, the most logical solution would have been to planta summer crop in the spring to utilize water alreadystored. The results of an economic analysis for thesesystems were reported by Peterson et al. (1993b), andshow that this solution also is economically advan-tageous.
Quantitative Indices of IntensifiedCropping Systems
Knowledge of soil water storage and efficiency inindividual fallow periods is not in itself a sufficient mea-sure of the effectiveness of the entire system to utilizeprecipitation. For the latter purpose, we propose theSystem-Precipitation-Storage Index (SPSI), a measureof how efficiently the incident precipitation during allfallow periods is collectively stored in the soil, given by
SPSI = 1 - E{/P{ [1]and System-Precipitation-Use Index (SPUI), a measureof how the cropping system as a whole allocates totalincident precipitation to crop production, given by
SPUI = 1 - Ef/Ps P]where Ef (mm) is the sum of all fallow precipitationlosses, PI (mm) is the sum of all fallow precipitation,and Ps (mm) is the total precipitation during a completecycle of the system (i.e., from wheat planting to wheatplanting). The difference between Ps and Pf is the totalamount of incident precipitation during all crop periods(Pc). Both indices have upper limits of unity recognizedas EI approaches zero. The SPSI has a lower limit ofzero for Ef = Pf. The lower limit for SPUI varies amongsystems; however, it is equal to PC/PS as Ef approaches Pf.
The SPSI quantifies the unit fraction of fallow precipi-tation allocated to soil water storage (Sf), and thus maybe written as SJP{. This is the equivalent of fallow stor-age efficiency for a single fallow, but written for the
Table 6. System-Precipitation-Storage Index (SPSI) and Sys-tem-Precipitation-Use Index (SPUI) values for the 2-, 3-, and4-yr cropping systems at the three experimental locations. Val-ues are means across slopes for 1988 to 1995.
Location
Sterling
Stratton
Walsh
Mean
CroppingsystemfWFWCFWCMFWFWCFWCMFWFWSFWSSF2-yr3-yr4-yr
Single-value systemindices
SPSI
0.160.270.260.270.340.310.150.240.220.190.280.26
SPUI
0.440.570.580.490.620.610.360.470.510.430.560.57
t Cropping systems are wheat-fallow (WF), wheat-corn-fallow (WCF),wheat-corn-millet-fallow (WCMF), wheat-sorghum-fallow (WSF), andwheat-sorghum-sorghum-fallow (WSSF).
whole system. The SPUI quantifies the unit fraction ofsystem precipitation (Ps) allocated to growing-seasoncrop production. Assuming that precipitation losses ofdeep percolation and runoff are negligible during agrowing season, then SPUI may be written as ETS/PSwhere ETS is the sum of all growing-season evapotrans-piration during a complete cycle of the system. Theadvantage of these indices is that they synthesize thebehavior of all phases of the system into single-valueindicators, allowing system comparison on an equal ba-sis (i.e., irrespective of the intensity of the croppingsystem). The goal is to devise systems that increaseboth SPSI and SPUI toward unity within the bounds ofcommercial feasibility.
Mean SPSI (or Sf/Pf) and SPUI (or ETS/PS) values forour systems across slopes and years are shown in Table6. The calculated values are means of complete croppingsystem cycles across years. Because all phases of eachcropping system were present every year, the experi-mental setup offered six complete cycles for WF, WCF,and WSF and four cycles of WCMF and WSSF, eachreplicated twice.
According to the SPSI index (Table 6), for every unitof incident precipitation during the fallow periods, 0.19,0.28, and 0.26 units were stored in the 2-, 3-, and 4-yrrotations, respectively. This means the fallow periodsin the 3- and 4-yr rotations were collectively 47 and37%, respectively, more efficient in storing precipitationthan fallow in WF. This supports the hypothesis thatintensification improves the efficient use of precipita-tion by means of enhancing storage efficiency. It is im-portant to realize that the enhancement of storage effi-ciency was mostly due to the reduced summer fallowintensity per year from 0.5 in WF, 0.33 in 3-yr, to 0.25in 4-yr systems.
According to the SPUI index, for every unit of precip-itation in the WF system (Table 6), only 0.36 (Walsh),0.44 (Sterling), and 0.49 (Stratton) units are made avail-able for crop production (or ET), with the remainderbeing lost. As the intensity of the cropping system in-creased, so did SPUI. However, the 3- and 4-yr systems

FARAHANI ET AL.: SOIL WATER STORAGE IN DRYLAND CROPPING SYSTEMS 991
were not significantly different from each other. Com-paring the locations, Walsh, the location with the highestpotential ET, was the least efficient utilizer of precipita-tion with an SPUI of 0.36 to 0.51. Inclusion of a summercrop, such as corn or sorghum, increased the fractionof system precipitation allocated to growing-season cropproduction from 0.43 in WF to 0.56 (i.e., an increase of30%) in 3-yr systems. These gains result from usingwater for transpiration that would otherwise be lostthrough soil evaporation, runoff, and deep percolationduring fallow.
Note that for the experimental period of our study,annual precipitation was at or greater than normal.The potential of intensification to enhance efficient useof precipitation during dry years, with precipitationamounts of <300 mm, is not known.
CONCLUSIONSResearch before the 1980s focused on improving the
fallow practice, although Haas et al. (1974) and othersquestioned the wisdom of fallowing. That perspectivehas changed in the most recent decade, during whichthe underlying objective has been broadened to enhanc-ing the efficient use of precipitation rather than justimproving summer fallow efficiency. Our long-term re-sults show that even under our most intense conserva-tion practice of no-till, the amount of precipitationstored in the soil profile during the lengthy fallow thatprecedes winter wheat is low.
Results show that soil water accumulated by latespring of the fallow preceding wheat planting is notsignificantly different than soil water accumulated 5 molater at wheat planting. This occurs even though nearly65% of annual precipitation occurs during this 5-moperiod; meaning that, on the average, most precipitationreceived during the last summer of fallow is lost.
In a cynical view of the practice of summer fallow inthe 1990s, we are now wasting about 80% of incidentprecipitation and only capturing the remaining 20%. Acritique of the practice of fallow raises the fundamentalquestion, "Does the true socioeconomic value of this20% of water outweigh the loss of the remaining 80%?"