Embed Size (px)
Citation preview

Soil-structure interaction simulations of 2D & 3D block model with spectral element methods. Javed Iqbal, Emmanuel Chaljub, Philippe Guéguen and Pierre-Yves Bard Institut des Sciences de la Terre (ISTerre), CNRS, IFSTTAR, Université Joseph Fourier, Grenoble, France
SUMMARY: For a macroscopic description of soil-structure interaction effects, a real building can be represented by a block model consisting of piecewise homogeneous, visco-elastic material. Such a model can be relevant only if its global dynamic characteristics reproduce those of the original structure. Here we are presenting 2D and 3D block models of a scaled RC structure which has been used for a number of experiments, including pull-out tests, at the Euroseistest Volvi site in Greece, and the dynamic properties of which are well known through published literature. A spectral element method was used to perform a numerical simulation of the pull out test with 2D as well as 3D block models. Comprehensive parameter studies have revealed that shear wave velocity in the building block model plays dominant role in the tuning process, while other factors like stiffness contrast between soil and building and even the dimensionality of the model also play their role to certain extent, especially for damping characteristics. Keywords: Soil-Structure-Interaction, Spectral element method, 2D and 3D effects 1. INTRODUCTION As reported in (Guéguen et al., 2000), a pull-out test ("POT" experiment was performed on a scaled RC structure at the Volvi test site in Greece within the framework of the EURO-SEISTEST project (see Fig. 1c for the location). In this experiment, vibrations were measured in and around the structure by a dense network of three component seismic instruments, while geological and geotechnical information about the site have been thoroughly surveyed and are available in the published literature (Jongmans et al., 1998). We have therefore selected this RC structure for testing a macroscopic modelling of soil-structure interaction phenomena through numerical simulation (as used for instance in Wirgin & Bard, 1996; Tsih-gka & Wirgin, 2003; Boutin & Roussillon, 2004; Kham et al., 2006; Semblat et al., 2008; Padron et al., 2009). The spectral element method has become a popular technique of numerical simulation of ground motion from local to global scale (Chaljub et al., 2007). Here we have used SPECFEM2D and SPECFEM3D computer codes (http://www.geodynamics.org) for simulating the propagation of elastic waves in visco-elastic materials representing both the RC structure block model and the underlying soil profile. Soil profile underneath the block model is assumed to be same as presented in Table 1 (Guéguen et al, 2000). The RC structure used in POT experiment is represented here by a block consisting of visco-elastic materials with the same dimensions as those of the original structure. The visco-elastic properties of the block model are tuned so as to obtain the same dynamic characteristics of the block model as those actually observed from the POT experiment recordings. This tuning process led us to investigate in detail the individual and combined effects of shear wave velocity, density and Q factor on the system natural frequency, its damping ratio and its rocking ratio. It also gave rise to an analysis of the differences between 2D and 3D models with similar elastic properties, which provided some hints on

the explanation of the "damping paradox" in 2D vs 3D models (Meek & Wolf, 1992). 2. POT EXPERIMENT A full description of the Volvi pull out test is provided in Guéguen et al, 2000. It is only briefly summarized here, together with the sketch showing the main features of the structure and of the instrumental layout as displayed in Fig. 1a. This structure was pulled out by a cable, which was anchored on a surface concrete block at some distance from the basement, see Fig. 1b. The cable was released suddenly to allow the structure to vibrate freely. The ground motion generated by the waves propagating away from the foundation of the freely vibrating RC structure was recorded by a network of seismic instruments installed in and around the structure, along longitudinal and transverse profiles as displayed in Fig. 1c. POT was performed in the two L and T directions. The present document considers only the POT in the L direction because of 2D code limitation to in-plane motion.
c) Site and instrument locations
Figure 1 : Sketch of the Pull out test (POT) experiment. (a) structure of the five-story scaled RC building (b) pull out scheme in longitudinal and transverse directions (c) Location of site and instrumental layout (Guéguen et al,
2000). 3. 2D BLOCK MODEL FOR SIMULATION In view of simulating the ground motion in the vicinity of a freely vibrating RC structure as in a POT experiment, a block of visco-elastic material with the same dimensions as those of the actual RC structure, is considered and assumed to be resting with full elastic contact on the soil profile presented by Guéguen et al. (2000), as shown in Fig. 2. It consists of three homogeneous parts labelled A, B and C, representing the added-mass, the main structure and the foundation slab, respectively. The unit mass of these three sub-blocks is derived from the total mass of the corresponding part of the actual RC structure, and the sub-block volume. A pull out inclined force is applied on the block at a height of 5.4m above the ground surface, similar to what was applied in the real POT experiment. Ground

motion time histories are then computed at the right locations shown in Fig. 1. Table 1. Soil profile characteristics at Euroseistest site volvi, in Greece presented in (Guéguen et al, 2000).
Depth (m) Density ρ (kg/m3)
Vp (m/sec) Vs (m/sec) Qp Qs
0.0 1816 225 130 50 10 3.0 2116 261 151 50 15 4.5 2250 364 210 50 15 8.0 1815 369 213 50 30
17.0 2250 376 217 50 30 21.0 1932 540 312 80 40 25.0 1816 560 323 80 40 45.0 1932 580 335 100 50 50.0 2065 797 460 100 50 65.0 1997 876 506 100 50
120.0 1900 1143 660 100 50 175.0 2000 1576 910 100 50 240 2400 3200 1850 100 50
Figure 2. Block model used for 2D block simulation, where A, B and C represents added mass, main structure
and foundation slab of RC structure. D-F and E-G represents the top two soil layers.
Figure 3. Block model used for 3D block simulations. The soil structure has the same layering
as in the 2D case.
A satisfactory numerical simulation requires to reproduce the same natural frequency and damping as actually observed in the in-situ POT experiment. As the actual RC structure was very stiff in the vertical direction, a constant, high P-wave velocity was assumed for the material of block model. The tuning was achieved by varying the shear stiffness of structure, i.e., the shear wave velocity, and the damping values in the visco-elastic material of the structural blocks. The structural frequency and damping values of the simulation model were derived from the analysis of the computed time histories at building top, and their Fourier spectra, using peak picking and logarithmic decrement techniques, and matching the computed time response to damped oscillations with ad-hoc frequency and damping. The first step of the 2D tuning process considers a "fixed-base" structure, replacing the soil by a very stiff rock having the properties of the deep underlying bedrock: it is simply intended to get the right

range for the structural block stiffness (especially block B), around which it may be varied when considering the actual, softer and deeper soil. The observed natural frequency of 4.9 Hz is obtained with a Vs value of 305 m/s. A second step taking into account the actual soil profile as presented in Table 1, led to significantly increase the structural stiffness to keep the same natural frequency for the soil-structure system: the best agreement was reached for Vs=420 m/s in block B. The end results of this 2D tuning process are presented in Table 2, for two different structural damping values (a quality factor Q of 200 corresponds to a material damping of 0.25%, while a Q of 30 corresponds to a 1.67% damping). The overall damping of the 2D soil-structure system turns out to be much higher than the actually observed one, even for an unrealistic, quasi – zero damping within the structure. This is due to the leak of energy into the soft soil ("radiative damping"), witnessed by the very high value of the rocking ratio (representing the percentage of rigid rocking in the roof motion). 4. 3D SIMULATION OF BLOCK MODEL The same block model was assumed for the 3D POT simulation, consisting in three parts, i.e. foundation slab, main body and added top mass as shown in Figures 2 and 3. Each part has the same density values as were used in the 2D case. The original soil profile as given in Table 1, presented by Guéguen et al. (2000) is used here too. A horizontal Dirac force is applied at a 5.4 m height (see Fig. 1b) to simulate the POT and force into vibration the block model (this is a slight change compared to the 2D case where an inclined force was used: present limitations in the SPECFEM3D code forced to use a horizontal force. A similar tuning process was performed for the 3D model, starting with the initial stiffness values obtained at the end of the 2D tuning process. The dynamic characteristics of the 3D block model proved indeed to be very different from those of the 2D block model: identical visco-elastic properties result in a slight increase for the natural frequency, and a large reduction for the damping ratio. A number of iterations was thus needed in view to obtain an optimal match of the target frequency and damping values. In each case, the natural frequency, damping ratio and rocking ratio are evaluated as for the 2D case. The final dynamic characteristics of the tuned 3D block model are presented in Table 2 along with those of the 2D block model and those derived from the in-situ POT experiment. The "best" stiffness and quality factor values are Vs = 360m/s and Q = 30. As the radiative damping is much lower in the 3D case than in the 2D case, the material damping in block B significantly affects the damping ratio of the whole soil-structure 3D system. Table 2. Dynamic characteristics identified for RC structure in POT experiment and those of 2D and 3D block models on the soil profile presented in Guéguen et al. (2000).
Vs in B block (m/s)
Q-value Natural frequency (Hz)
% Damping Ratio
Rocking Ratio
Observed in POT Experiment 4.9 1.5
2D Block Model 420 200 4.91 3.96 0.36 2D Block Model 400 30 4.99 5.33 0.40 3D Block Model 360 200 4.79 0.75 0.127 3D Block Model 360 30 4.86 1.61 0.131 5. COMPARISON OF 2D AND 3D BLOCK MODELS OF RC STRUCTURE USED IN POT EXPERIMENT IN VOLVI. The main differences between the 2D and 3D cases concern the damping and rocking values. They are to be interpreted in relation to the role of soil-structure interaction: the high 2D damping value is associated with a high rocking ratio (40%), while the much smaller 3D damping value is associated

with a much lower rocking ratio (10%). The 2D block model actually can be viewed as a 3D wall-like structure – as displayed in Fig. 4 -, while the 3D block model is limited to a square block with finite dimension compared to soil profile: as a consequence, the soil mass involved by the foundation motion is much larger in the 2D case, which affects the frequency (larger mass results in a shift to lower frequency), and the couple (damping, rocking ratio) with a much more efficient downward leakage of energy into the soil. In order to better understand the transition between 2D and 3D behaviours, a series of intermediate 3D models were considered, with rectangular instead of square structures having a fixed width W (equal to the actual horizontal size of the real structure), and a length L varying from 2 W to 20 W (quasi 2D case). The considered length-to-width ratios are 2, 3, 4, 6, 8, 12 and 20, as listed in Table 3.
Figure 4. Long, wall like structure in 3D, which is assumed to be equivalent to the 2D block model. The blue coloured arrows schematically illustrate the case of multiple synchronous sources, while the red arrow illustrate
the single source case. These simulations were carried out with two types of excitation sources: the first one is a single horizontal Dirac force applied in the centre of the wall at a 5.4 m height above the ground level, while the second one is a series of synchronous horizontal forces uniformly distributed along the stretch of the wall at the same height. The corresponding results in terms of time histories and spectra of the computed motion at the wall top in its centre top are displayed in Fig. 5 for the single source case, and Fig.6 for the multiple, synchronous source case. The single source results exhibit several modes below 10 Hz, when the stretch of the wall exceeds 6 times the slab width. Indeed, higher modes also exist for smaller aspect ratios, but they correspond to frequencies larger than 10 Hz : their signature can be detected on time histories down to L = 3W. These higher transverse modes are not seen in the multiple source case (Fig. 6). They are linked to the propagation of waves along the wall from the point where the single force is applied, and their subsequent reverberation on each edge. These modes cannot be excited for uniformly distributed, synchronous forces, since they are associated with an increasing number of nodes and out-of-phase motion along the longitudinal direction. The overall dynamic characteristics of these wall like structures are listed in Table 3 for both the single and multiple source cases. They exhibit a clear increase of the damping value and decrease of the rocking ratio with increasing wall length. The increase rate however significantly decays for wall lengths beyond 4W, so that damping and rocking ratios do not reach their 2D values, even at aspect rations L/W as large as 20. This phenomenon has also been observed by various authors (e.g., Meek & Wolf, 1992, or Adam et al. 2000): some of them have proposed solutions to eliminate this discrepancy (Wolf & Meek, 1994), but could never completely eliminate this 2D-3D inconsistency (Wolf, 2004).
structure – as displayed in Fig. 4 -, while the 3D block model is limited to a square block with finite
dimension compared to soil profile: as a consequence, the soil mass involved by the foundation motion
is much larger in the 2D case, which affects the frequency (larger mass results in a shift to lower
frequency), and the couple (damping, rocking ratio) with a much more efficient downward leakage of
energy into the soil.
In order to better understand the transition between 2D and 3D behaviours, a series of intermediate 3D
models were considered, with rectangular instead of square structures having a fixed width W (equal
to the actual horizontal size of the real structure), and a length L varying from 2 W to 20 W (quasi 2D
case). The considered length-to-width ratios are 2, 3, 4, 6, 8, 12 and 20, as listed in Table 3.
!
Figure 4. Long, wall like structure in 3D, which is assumed to be equivalent to the 2D block model. The blue
coloured arrows schematically illustrate the case of multiple synchronous sources, while the red arrow illustrate
the single source case.
These simulations were carried out with two types of excitation sources: the first one is a single
horizontal Dirac force applied in the centre of the wall at a 5.4 m height above the ground level, while
the second one is a series of synchronous horizontal forces uniformly distributed along the stretch of
the wall at the same height. The corresponding results in terms of time histories and spectra of the
computed motion at the wall top in its centre top are displayed in Fig. 5 for the single source case, and
Fig.6 for the multiple, synchronous source case.
The single source results exhibit several modes below 10 Hz, when the stretch of the wall exceeds 6
times the slab width. Indeed, higher modes also exist for smaller aspect ratios, but they correspond to
frequencies larger than 10 Hz : their signature can be detected on time histories down to L = 3W.
These higher transverse modes are not seen in the multiple source case (Fog. 6). They are linked to the
propagation of waves along the wall from the point where the single force is applied, and their
subsequent reverberation on each edge. These modes cannot be excited for uniformly distributed,
synchronous forces, since they are associated with an increasing number of nodes and out-of-phase
motion along the longitudinal direction.
The overall dynamic characteristics of these wall like structures are listed in Table 3 for both the
single and multiple source cases. They exhibit a clear increase of the damping value and decrease of
the rocking ratio with increasing wall length. The increase rate however significantly decays for wall
lengths beyond 4W, so that damping and rocking ratios do not reach their 2D values, even at aspect
ratios L/W as large as 20. This phenomenon has also been observed by various authors (e.g., Meek &
Wolf, 1992, or Adam et al., 2000): some of them have proposed solutions to eliminate this discrepancy
(Wolf & Meek, 1994), but could never completely eliminate this 2D-3D inconsistency (Wolf, 2004).

Figure 5. Time histories and spectra of record at the centre-top of the wall model when single Dirac force is
applied in the centre of the stretch of the wall model
Figure 6. Time histories and spectra of record at the centre-top of the wall model when uniformly distribute
multiple Dirac forces uniformly distributed through out the stretch of the wall

Table 3. Comparison of simulation results between 2D and 3D block and wall models of different aspect ratio L/W for excitation cases (single source applied in the centre of the stretch of the wall, uniformly distributed multiple sources). Vs in the top two soil layers below the block model is increased to 200m/s to simulate the rocking ratio 0.25 reported for RC structure.
Natural Frequency (Hz) % Damping Rocking Ratio
Model Vs (m/s) in model
Q value in model Single
Source Multiple Source
Single Source
Multiple Source
Single Source
Multiple Source
2D Block Model 380 200 4.88 3.86 0.25 3D Block Model 380 200 5.12 0.77 0.098 3D wall, L = 2W 380 200 4.98 4.89 1.06 0.93 0.195 0.164 3D wall, L = 3W 380 200 4.84 4.86 1.83 1.38 0.210 0.195 3D wall, L = 4W 380 200 4.83 4.84 2.17 1.80 0.144 0.209 3D wall, L = 6W 380 200 4.82 4.83 2.61 2.16 0.173 0.216 3D wall, L = 8W 380 200 4.82 4.74 2.70 2.70 0.198 0.202 3D wall, L = 12W 380 200 4.81 4.85 2.73 2.69 0.176 0.227 3D wall, L = 20W 380 200 5.0 4.83 4.48 2.75 0.2 0.227 6. ATTENUATION OF PEAK GROUND MOTION IN THE VICINITY OF STRUCTURE The ground motion has been computed at ground surface in the immediate vicinity of the structure (according to the instrumental layout shown on Fig. 1) in order to compare it to the actual in-situ POT recordings, to quantify the energy of the radiated wavefield and analyse its attenuation rate with distance from the structure foundation. Fig. 7 displays the decay of the recorded and simulated pga (peak ground acceleration) as a function of distance from the edge of foundation, for the various values of the L/W aspect ratio, and for both the vertical and radial horizontal components. Only the multiple source case is considered here since it is better suited to investigate the 2D-3D transition. These attenuation curves are normalised to the peak acceleration value recorded at the closest location to the foundation slab. The recorded peak ground motion decays according, very grossly, to a 1/r trend for the vertical component and horizontal components. The anomalously large values of peak ground motion recorded at 8 and 9.2 m locations are simply due to the reaction mass where the pull-out cable was anchored: this acted as an additional point source of equal amplitude, resulting in a very localized surge in ground motion. The decay observed in the simulations varies from case to case, but nevertheless exhibits some consistent features. It is systematically smaller at "large" distances (i.e., beyond 10 m) than at "short" distances, and it (almost) systematically decreases from the full 3D case to the 2D case. Both observations may be related to the composition of the radiated wavefield, consisting of a mixture of body and surface waves : in the very near field (i.e., at distances comparable to the foundation size, body waves and near-field terms are predominant, resulting in a rapid decay, while at larger distances, surface waves are predominant. The geometrical spreading of surface waves is highly dependent on the dimensionality: it follows a 1/√r trend in the full 3D case as they spread on a circular wavefront, while it completely vanishes in the full 2D case, since this model is equivalent to a wall like structure resting on strip foundation, acting as a line source in 3D, away of which surface wave propagate as a plane wave front, without any amplitude decay. At very short distances from the slab, there are thus no significant differences between the 2D and 3D cases, as the source (i.e., the freely vibrating RC structure) in the 3D real world is seen almost as a line source very similar to the 2D model source. At larger distances, there is gradual increase of decay from 2D to 3D. It is worth to notice that whenever the wall length exceeds 6 times the slab width, the decay with distance gets very close to the full 2D case: it can be concluded that long structures with aspect ratios exceeding 5-6 could be simulated with 2D modelling, at least as far as macroscopic effects of soil-structure interaction are concerned. It is to be mentioned also that the downward bend at
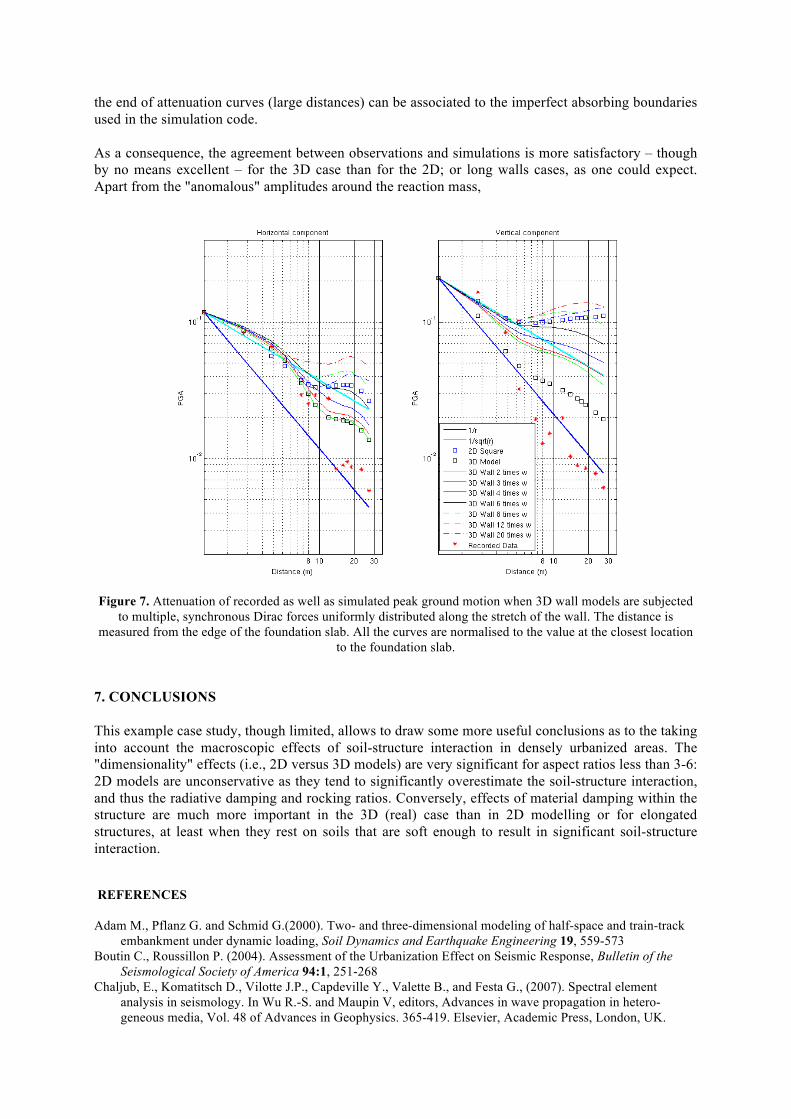
the end of attenuation curves (large distances) can be associated to the imperfect absorbing boundaries used in the simulation code. As a consequence, the agreement between observations and simulations is more satisfactory – though by no means excellent – for the 3D case than for the 2D; or long walls cases, as one could expect. Apart from the "anomalous" amplitudes around the reaction mass,
Figure 7. Attenuation of recorded as well as simulated peak ground motion when 3D wall models are subjected
to multiple, synchronous Dirac forces uniformly distributed along the stretch of the wall. The distance is measured from the edge of the foundation slab. All the curves are normalised to the value at the closest location
to the foundation slab. 7. CONCLUSIONS This example case study, though limited, allows to draw some more useful conclusions as to the taking into account the macroscopic effects of soil-structure interaction in densely urbanized areas. The "dimensionality" effects (i.e., 2D versus 3D models) are very significant for aspect ratios less than 3-6: 2D models are unconservative as they tend to significantly overestimate the soil-structure interaction, and thus the radiative damping and rocking ratios. Conversely, effects of material damping within the structure are much more important in the 3D (real) case than in 2D modelling or for elongated structures, at least when they rest on soils that are soft enough to result in significant soil-structure interaction. REFERENCES Adam M., Pflanz G. and Schmid G.(2000). Two- and three-dimensional modeling of half-space and train-track
embankment under dynamic loading, Soil Dynamics and Earthquake Engineering 19, 559-573 Boutin C., Roussillon P. (2004). Assessment of the Urbanization Effect on Seismic Response, Bulletin of the
Seismological Society of America 94:1, 251-268 Chaljub, E., Komatitsch D., Vilotte J.P., Capdeville Y., Valette B., and Festa G., (2007). Spectral element
analysis in seismology. In Wu R.-S. and Maupin V, editors, Advances in wave propagation in hetero-geneous media, Vol. 48 of Advances in Geophysics. 365-419. Elsevier, Academic Press, London, UK.

Guéguen, P., Bard P.-Y. and Oliveira C.S., (2000). Experimental and numerical analysis of soil motions caused by free vibrations of a building model, Bulletin of the Seismological Society of America 90, 1464–1479
Jongmans D., Pitilakis K., Demanet D., Raptakis D., Riepl J., Horrent C., Tsokas G., Lontzetidis K. and Bard P.-Y., (1998) EURO-SEISTEST: Determination of the geological structure of the Volvi basin and validation of the basin response, Bulletin of the Seismological Society of America 88:2, 473-487
Kham, M., Semblat J.-F., Bard P.-Y. and Dangla P., (2006). Seismic Site–City Interaction: Main Governing Phenomena through Simplified Numerical Models, Bulletin of the Seismological Society of America 96:5, 1934-1951
Komatitsch, D. and Tromp J., (1999). Introduction to the spectral element method for three-dimensional seismic wave propagation. Geophysical Journal International 139, 806-822
Meek, J.W., & J.P. Wolf, (1992) Insight on 2D vs. 3D-modeling of surface foundations. 10th world conference on earthquake engineering. Madrid 3, 1633-1637.
Semblat, J.-F., Kham M. and Bard P.-Y.,(2008). Seismic wave propagation in alluvial basins and influence of site-city interaction, Bulletin of the Seismological Society of America 98:6, 665–2678
Padrón, L.A., Aznárez J. J. and Maeso O., (2009). Dynamic structure-soil-structure interaction between nearby piled buildings under seismic excitation by BEM-FEM model. Soil Dynamics and Earthquake Engineering, 29,1084-1096
Tsogka, C. and Wirgin A., (2003). Simulation of seismic response in an idealized city, Soil Dynamics and Earthquake Engineering 23, 391-402
Wirgin, A. and BardP.‐Y.,(1996). Effects of building on the duration and amplitude of ground motion in Mexico City, Bulletin of the Seismological Society of America 86:3, 914-920
Wolf, J.P., (2004). Foundation vibration analysis using simple physical models. Prentice Hall Upper Saddle River, NJ USA.
Wolf, J.P., and Meek J.W., (1994). Insight on 2D- versus 3D-modeling of surface foundations via strength of materials solutions for soil dynamics. Earthquake Engineering and Structural dynamics 23, 91-112


![Simulations For Teaching Social Interaction[1]](https://img.dokumen.tips/doc/110x75/5452a454af7959ed5f8b529b/simulations-for-teaching-social-interaction1.jpg)