Embed Size (px)
Citation preview

1
Soil Properties - I
Amit Prashant
Indian Institute of Technology Gandhinagar
Short Course on
Geotechnical Aspects of Earthquake Engineering 04 – 08 March, 2013
Regional Soil Deposits of India
2
Alluvial deposits
Marine deposits
Desert Soils
Laterites and lateritic soils
Black cotton soils
Boulder deposits

2
Soil: A Complex Material
Particulate Media
Three Phase Relationship
Volume Change Characteristics
Principal of Effective Stress
Pressure Dependency
Transient Response
Highly Non-linear Response
Spatial Variability
Others
3
Particle Shapes and Sizes
4
Rounded Subrounded
Subangular Angular
Sands and Gravels Particle Size > 75 mm 17 mm
2 mm
Clays Size > 2 mm

3
Soil Groups Based on its Particle Size
5
Fine grain soils
Coarse grain soils
0.002 300 80 4.75 0.075
Grain size (mm)
Boulder Clay Silt Sand Gravel Cobble
Granular soils or Cohesion less soils
Cohesive soils
Non-Clay minerals Clay minerals
0.425 2.0
Fine Medium Course Fine Course
20
Grain Size Distribution
6
Poorly Graded
Well Graded
Gap Graded

4
Three Phases in Soils
7
S : Solid Soil particle
W: Liquid Water (electrolytes)
A: Air Air
v
s
Ve
VVoid ratio,
Air
Water
Solid
ra
rw
rs
Particle Assemblage: Void Ratio
8

5
Relative Density
9
max
max min
r
e eD
e e
Void ratio, e
1.0
0.8
0.6
0.4
0.2
0
emax
Dr = 0%
e
0%<Dr <100%
emin
Dr = 100%
Atterberg Limits
10
The presence of water in fine-grained soils can significantly affect associated engineering behavior, so we need a reference index to clarify the effects.

6
Typical Values of Atterberg Limits
11
(From Mitchell, 1993)
Plasticity Chart
12
H L M
7
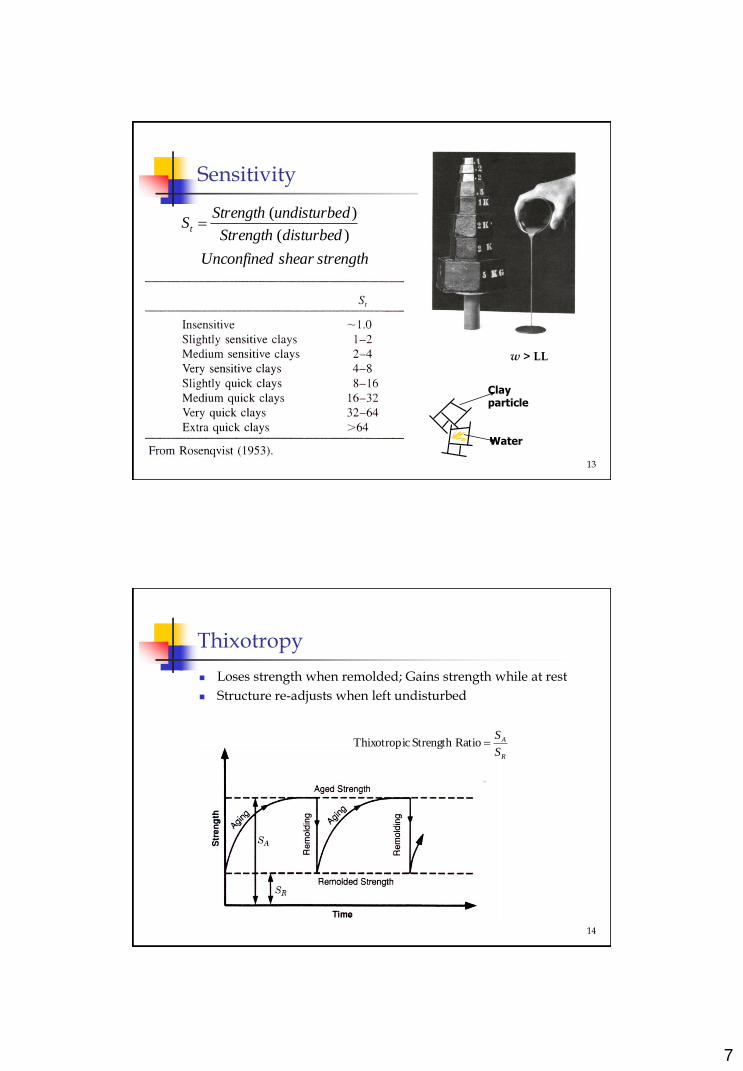
Sensitivity
13
strengthshearUnconfined
disturbedStrength
dundisturbeStrengthSt
)(
)(
Clay particle
Water
w > LL
Thixotropy
Loses strength when remolded; Gains strength while at rest
Structure re-adjusts when left undisturbed
14
R
A
S
SRatioStrength cThixotropi
8
F
F
Displacement
Ax
ial
Fo
rce
, F
k
1
Time
De
form
ati
on
, F
Time
Ax
ial
Fo
rce
, F
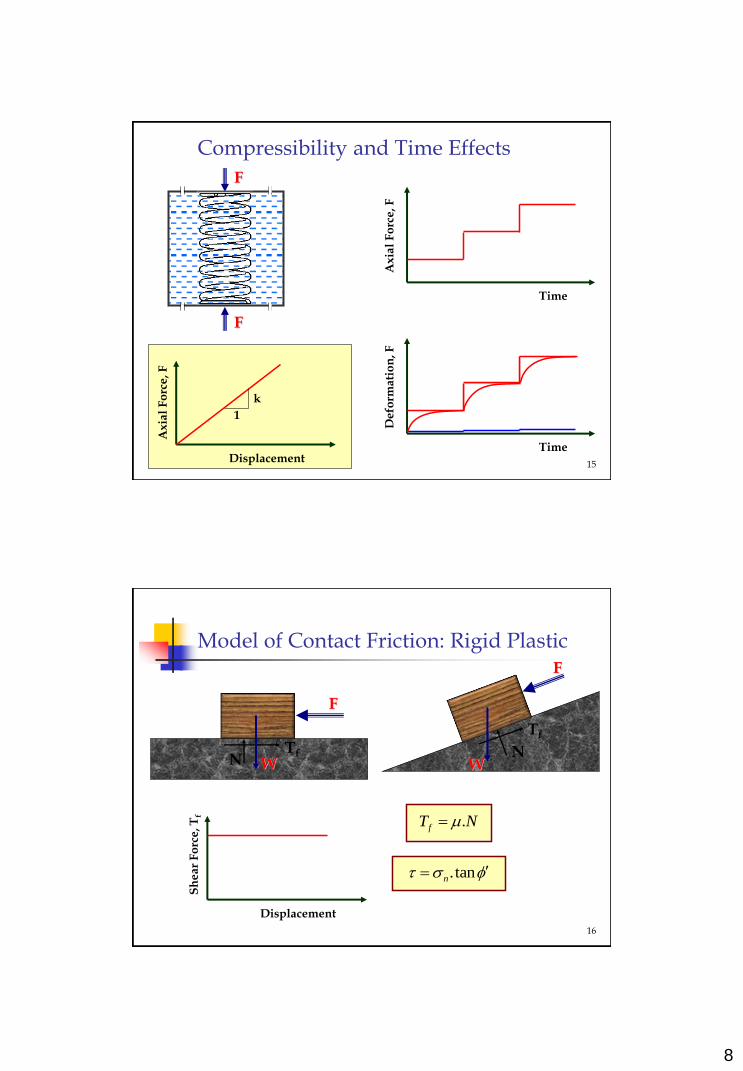
Compressibility and Time Effects
15
Displacement
Sh
ea
r F
orc
e, T
f
W
F
N
Tf
W
F
N Tf
.fT Nm
. tann
16
Model of Contact Friction: Rigid Plastic

9
17
F sh
w
s
wh
F
. .s s w w sN h h h .s sN h
sh w
s
wh
.F Nm .F Nm
Area = 1
Total Stress
Effective Stress
Water Pressure
.w wu h
N
Area
N
Area
.F Nm
. tan
.tanu
. .s s w sN h h
.w wN N h
. .s s w wN h h
Effective stress
Effective Stress Profile in Soil Deposit
18
10
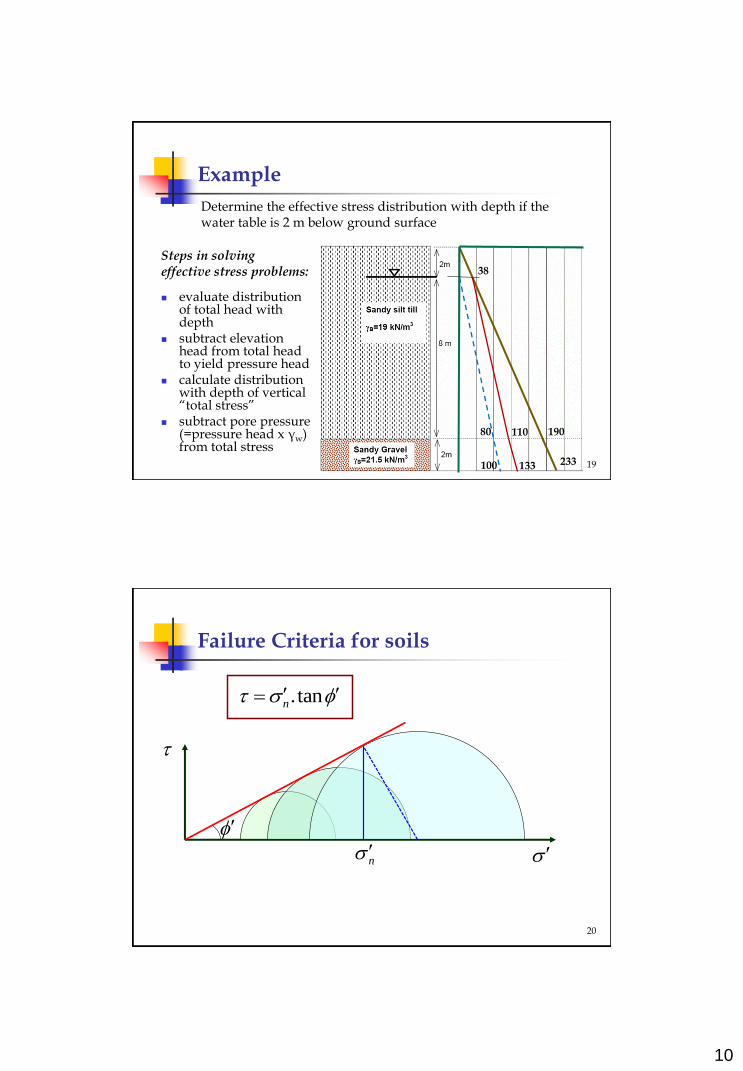
19 19
Example
Determine the effective stress distribution with depth if the water table is 2 m below ground surface
evaluate distribution
of total head with depth
subtract elevation head from total head to yield pressure head
calculate distribution with depth of vertical “total stress”
subtract pore pressure (=pressure head x γw) from total stress
Steps in solving effective stress problems: 38
190
233
80
100
110
133
. tann
n
Failure Criteria for soils
20
11
N
N
F
F Glue
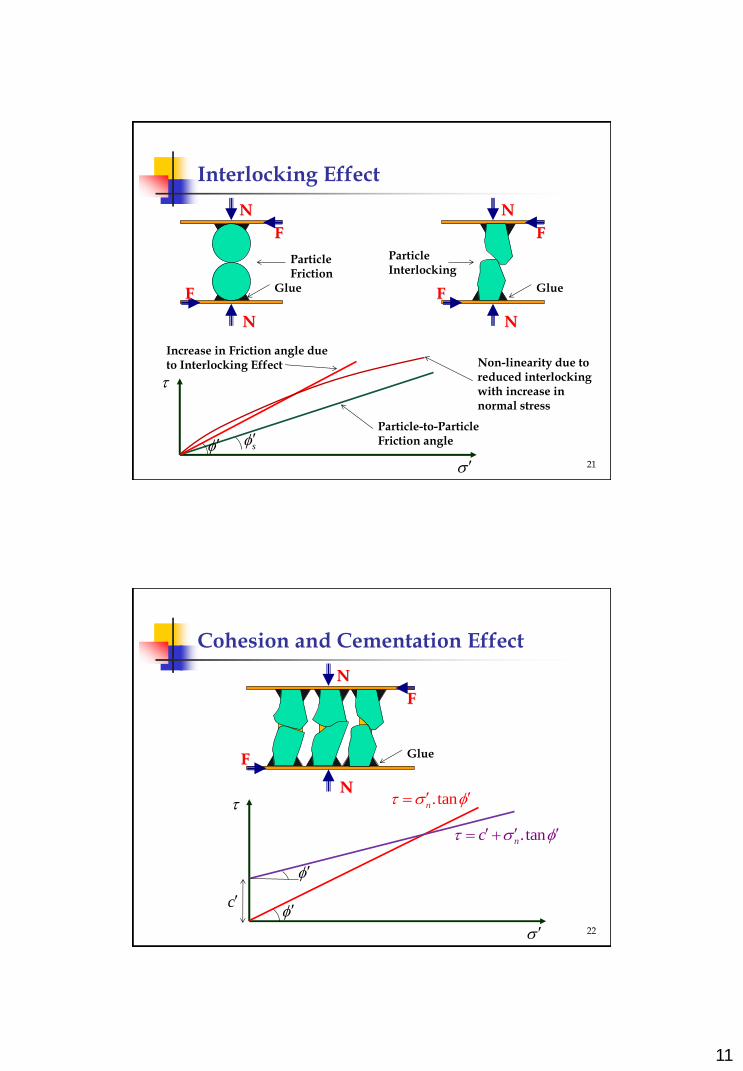
Particle Friction
N
N
F
F Glue
Particle Interlocking
sParticle-to-Particle Friction angle
Increase in Friction angle due to Interlocking Effect Non-linearity due to
reduced interlocking with increase in normal stress
Interlocking Effect
21
N
N
F
F Glue
c
. tann
.tannc
Cohesion and Cementation Effect
22
12
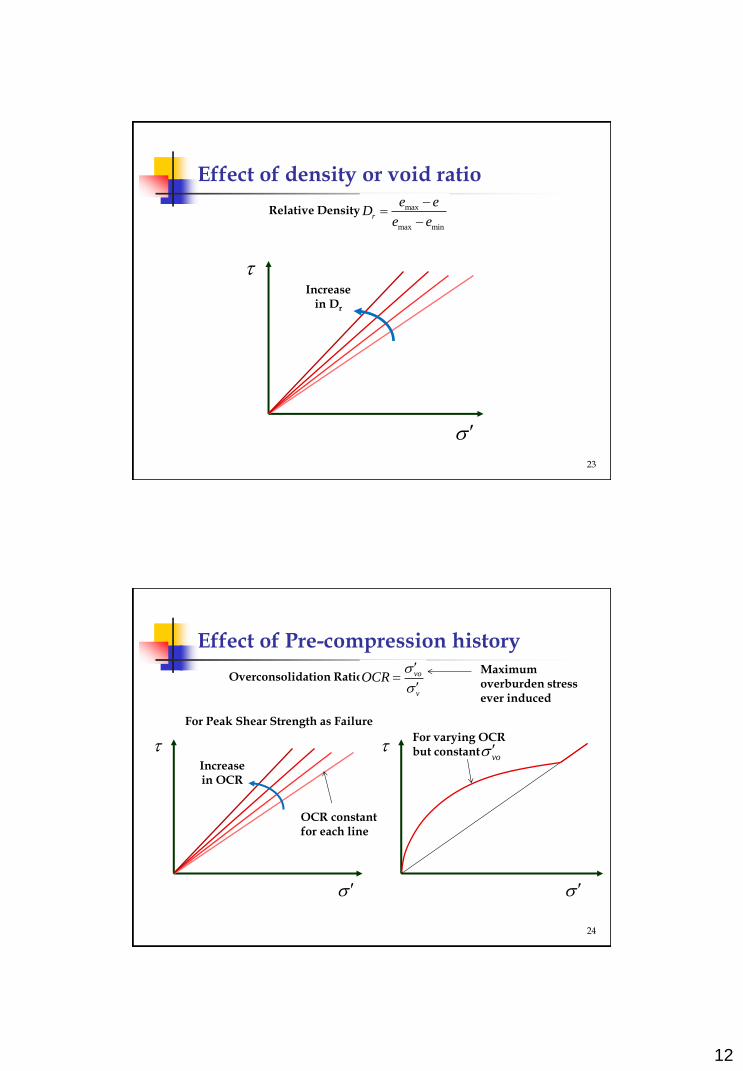
Relative Density, max
max min
r
e eD
e e
Increase
in Dr
Effect of density or void ratio
23
Overconsolidation Ratio, vo
v
OCR
Maximum overburden stress ever induced
Increase in OCR
For Peak Shear Strength as Failure
OCR constant for each line
For varying OCR but constant
vo
Effect of Pre-compression history
24
13
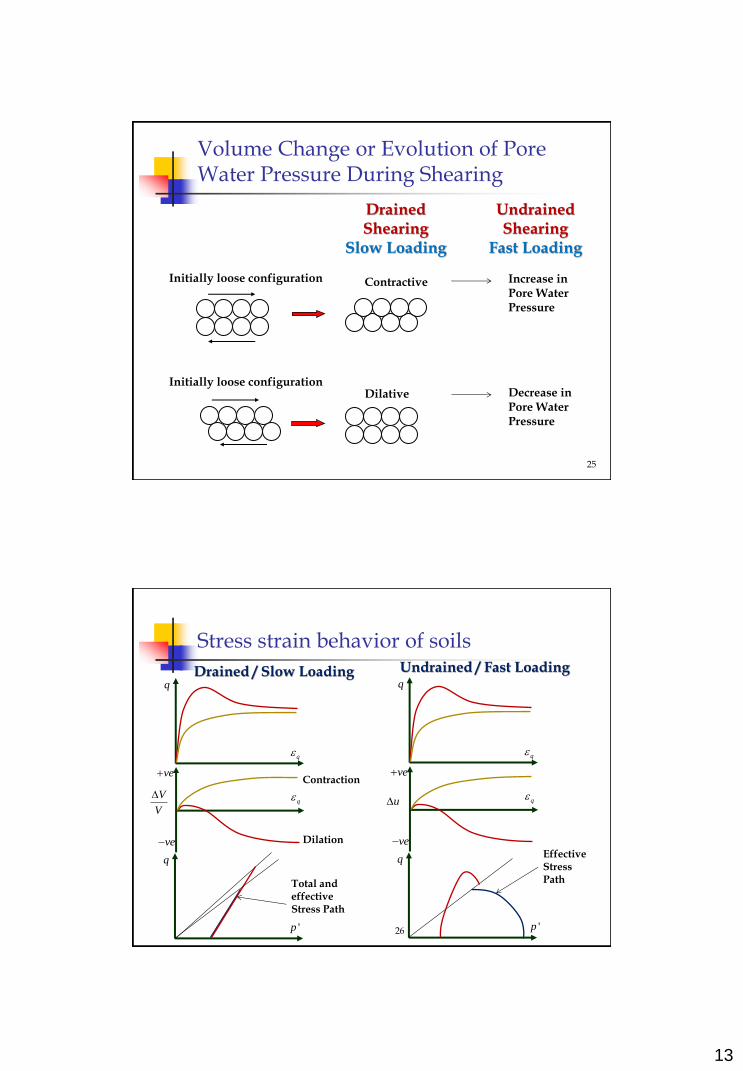
Initially loose configuration Contractive
Dilative Initially loose configuration
Increase in Pore Water Pressure
Drained Shearing
Slow Loading
Undrained Shearing
Fast Loading
Decrease in Pore Water Pressure
Volume Change or Evolution of Pore Water Pressure During Shearing
25
Stress strain behavior of soils
26
Drained / Slow Loading Undrained / Fast Loading
q
q
qV
V
ve
ve
'p
q
Total and effective Stress Path
q
q
qu
ve
ve
'p
q
Contraction
Dilation
Effective Stress Path

14
Stress Strain Curve for soils
q
q
27
2Gmax
2G
q
q
First yield point
Elastic zone
Peak Shear Strength
Strain hardening zone
Softening zone Zone of instability
Steady State Shear Strength
Gmax = Maximum Shear Modulus
G = Secant Shear Modulus
Strain Dependent Shear Modulus
Linear Elastic Model
Nonlinear Elastic Model
%
Include Plasticity
28

15
Oil Tank
Flood Flood
Transient Effects on structures
29
30
16 m 18 m
10 m
1
2
10 m
Under Filter
1
2
b = 18 kN/m3; sat = 20 kN/m3 ' = 18º (CU test) Top line of water seepage
Transient Effects on structures
16
1
2
3
4
5
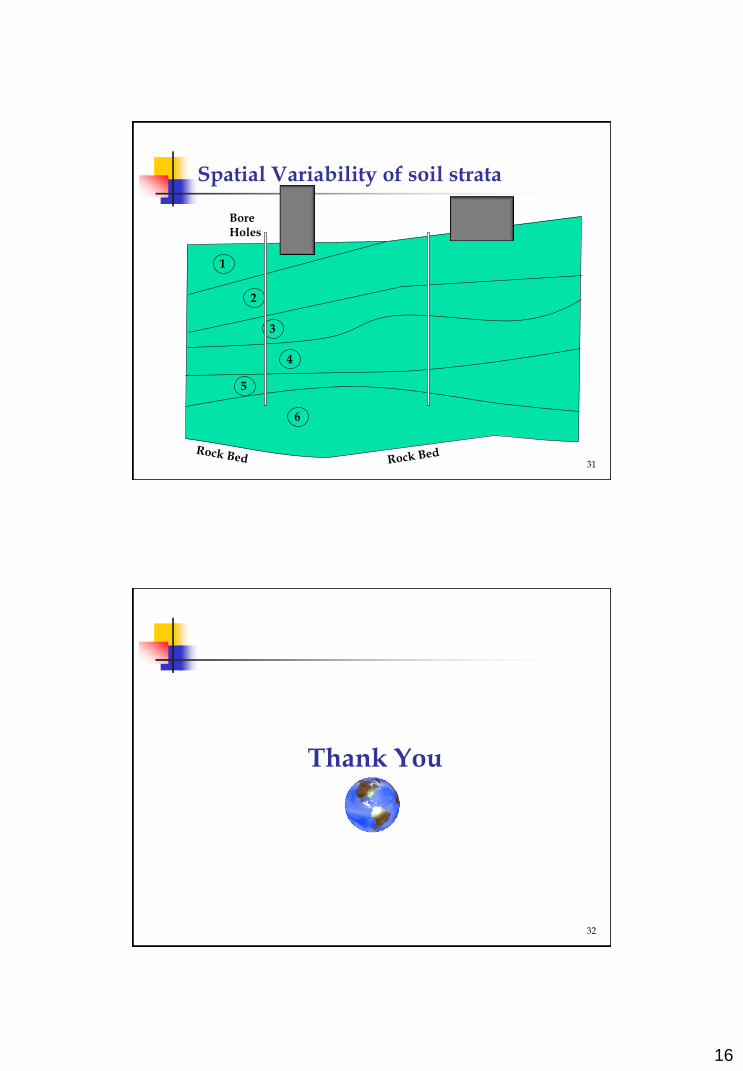
6
Bore Holes
Spatial Variability of soil strata
31
32
Thank You