Embed Size (px)
Citation preview
Proceedings of the 2nd Symposium on Coupled Phenomena in Environmental Geotechnics (CPEG2), Leeds, UK 2017
Soil-bentonite slurry trench cutoff wall lateral deformations, consolidation, stress transfer and hydraulic conductivity
Jeffrey Evans, Dept. of Civil & Environmental Engineering, Bucknell University, USA, [email protected] Maximilian Ororbia, Dept. of Civil & Env. Engineering, Bucknell University, USA, [email protected] James Gutelius, Dept. of Civil & Env. Engineering, Bucknell University, USA, [email protected] Daniel Ruffing, Geo-Solutions, Inc, USA, [email protected] Landon Barlow, Dept. of Civil & Env. Engineering, Bucknell University, USA, [email protected] Michael Malusis, Dept. of Civil & Env. Engineering, Bucknell University, USA, [email protected]
ABSTRACT: Soil-bentonite slurry trench cutoff walls have long been used to control ground water flow and contaminant transport. Previous studies have shown that hydraulic conductivity of the soil-bentonite backfill is stress dependent. Furthermore, the stresses are dependent upon the load transfer generated by the formation sidewalls and the backfill consolidation and creep. The rate of consolidation is controlled by the flow out of the backfill into the formation, which is also stress dependent. These coupled phenomena are further complicated by the lateral deformation of the formation sidewalls during the various stages of slurry trench construction including excavation, backfilling, backfill consolidation, and backfill creep. The coupled mechanical phenomena are simultaneously occurring as the ground temperature changes. To fully evaluate the interactions between the various phenomena, a full-scale soil-bentonite slurry trench cutoff wall was constructed to a length of 660 m, a width of 0.9 m, and a depth of 6.2 to 7.1 m. Relevant to the phenomena discussed in this paper, the construction was instrumented with four pairs of inclinometers, four settlement plates, and four sets of earth pressure cells to measure total stresses in the backfill in three dimensions (i.e., vertical, horizontal longitudinal, and horizontal transverse) at four different locations within the wall. Each set of earth pressure cells was mounted on a cage with an accompanying pressure transducer and thermistor for pore pressure and temperature measurements, as well as sensors for roll and pitch. The study showed that the primary consolidation was complete approximately two weeks after wall construction. However, coupled phenomena consisting of lateral deformation, backfill creep and resulting settlement, pore pressure dissipation, temperature change, and load transfer were still occurring four months after wall construction. Effective stresses remain far below geostatic. The maximum stresses are those transverse to the axis of the trench from the impact of lateral deformations evident in the inclinometer data. The lowest stresses are the vertical stresses, reflecting the impact of arching or side wall friction as the soft backfill moves downward within the trench. Longitudinal horizontal stresses are intermediate between the transverse horizontal stresses and vertical stresses.
KEYWORDS: slurry wall, bentonite, stress, inclinometer, cutoff wall, hydraulic conductivity
1. INTRODUCTION.
For over 50 years, soil-bentonite walls have been used to control groundwater flow and subsurface contaminant transport. Soil-bentonite (SB) slurry trench barriers are named for the backfill barrier material used to fill the excavated trenches. Several complex issues and performance mechanisms arise due to the installation procedures and inherent backfill properties. Further, there exists a lack of testing and investigation of these issues and mechanisms at the full scale.
Although SB cutoff walls are common and widely used, field performance of these walls has not been studied in detail, thus leading to a deficiency in information (National Research Council 2007). For example, stress distribution and development within SB backfill has been the subject of some research, but is not fully understood. The hydraulic conductivity of SB backfill is stress dependent (Evans, 1994; Evans et al. 2016) and, therefore, understanding of the state of stress is necessary to predict the in situ hydraulic conductivity.
Presently, several models have been developed to predict the stresses in SB cutoff walls, two of which are referred to as an “arching” model (Evans et al. 1995) and a “lateral squeezing” model (Filz 1996). The arching model predicts the stresses in SB cutoff walls assuming that the trench walls are
rigid (Evans et al. 1995, Kezdi 1975). The assumption that the sidewalls experience no lateral movement when the trench is excavated, backfilled, and allowed to consolidate is contrasted by the lateral squeezing model (Filz 1996) which predicts the stresses in SB cutoff walls based on stress/strain compatibility between the formation soils and the SB backfill based on sidewall deformations. The lateral squeezing model was further developed into the modified lateral squeezing (MLS) model which takes into account the stress-dependent nature of SB backfill compressibility (Ruffing et al. 2010). None of these existing models relate the stresses in all three directions. In reality, the stress state is controlled by both the vertical consolidation coupled with the lateral squeezing of the trench side walls.
In order to investigate the stress state and the coupled relationship between vertical consolidation and lateral squeezing, a full-scale SB slurry trench cutoff wall was constructed with the support of the National Science Foundation. The SB cutoff wall was outfitted with instrumentation to directly measure vertical and lateral deformation along with the resulting state of stress.
Proceedings of the 2nd Symposium on Coupled Phenomena in Environmental Geotechnics (CPEG2), Leeds, UK 2017 1 .1 SB Wall Construction
The coupled nature of deformation and stress behaviour can be understood in the context of SB cutoff wall construction procedures. For this project, and consistent with standard industry procedures, a slurry filled trench was excavated using a Cat 330C excavator with a 0.9 m wide bucket. The slurry was made from a mixture of 5-6% sodium bentonite clay suspended in water and employed to maintain trench stability (i.e., liquid shoring). Once excavation to the design grade 7 m below ground surface was completed, backfill was added as excavation continued. The backfill was made from excavated on-site soils blended with the bentonite-water slurry to form a material with a viscous liquid consistency (measured values of slump varied between 75mm and 150mm. A schematic of the process is shown in Figure 1. Since backfill is placed at a viscous liquid consistency, substantial self-weight consolidation occurs. The otherwise geostatic nature of self-weight consolidation is impacted by the relatively incompressible trench sidewalls and results in load transfer from the backfill to the sidewalls. Coupled to these two phenomena is the inward movement of the trench sidewalls to achieve the necessary stress-strain compatibility between the backfill and the adjacent formation. Finally, given void ratio changes that result from consolidation stresses, the hydraulic conductivity changes in response to the stress.
Figure 1. Excavation and backfill process to construct a soil-bentonite slurry trench cutoff wall (Evans, 1995).
1 .2 Instrumentation
Consistent with the research goals, a comprehensive instrumentation program was developed and implemented as shown in Figure 2. Notice in Figure 2, instrumentation includes settlement plates, monitoring wells, test borings, and inclinometers along with instrument cluster cages as described below. The inclinometers were installed in pairs and this paper examines inclinometer pair 5-6 at station 0+90 closest to the earth pressure cages at station 0+84.
Figure 2. Layout of Instrumentation.
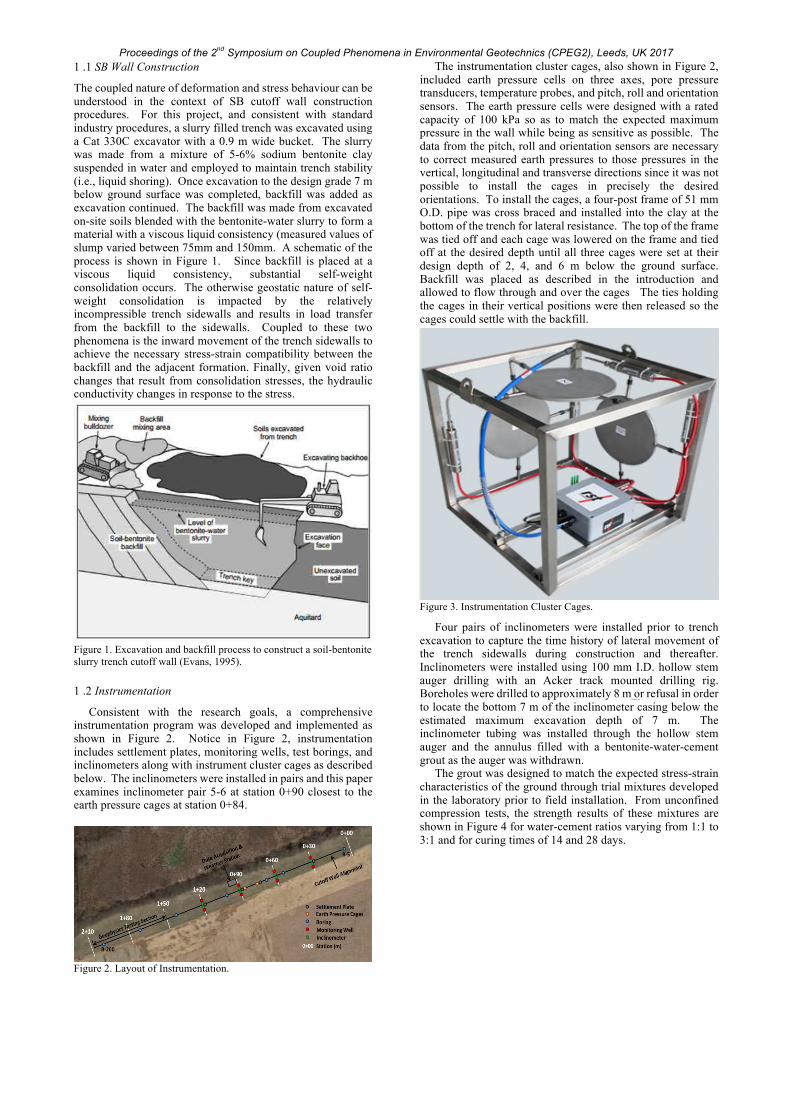
The instrumentation cluster cages, also shown in Figure 2, included earth pressure cells on three axes, pore pressure transducers, temperature probes, and pitch, roll and orientation sensors. The earth pressure cells were designed with a rated capacity of 100 kPa so as to match the expected maximum pressure in the wall while being as sensitive as possible. The data from the pitch, roll and orientation sensors are necessary to correct measured earth pressures to those pressures in the vertical, longitudinal and transverse directions since it was not possible to install the cages in precisely the desired orientations. To install the cages, a four-post frame of 51 mm O.D. pipe was cross braced and installed into the clay at the bottom of the trench for lateral resistance. The top of the frame was tied off and each cage was lowered on the frame and tied off at the desired depth until all three cages were set at their design depth of 2, 4, and 6 m below the ground surface. Backfill was placed as described in the introduction and allowed to flow through and over the cages The ties holding the cages in their vertical positions were then released so the cages could settle with the backfill.
Figure 3. Instrumentation Cluster Cages.
Four pairs of inclinometers were installed prior to trench excavation to capture the time history of lateral movement of the trench sidewalls during construction and thereafter. Inclinometers were installed using 100 mm I.D. hollow stem auger drilling with an Acker track mounted drilling rig. Boreholes were drilled to approximately 8 m or refusal in order to locate the bottom 7 m of the inclinometer casing below the estimated maximum excavation depth of 7 m. The inclinometer tubing was installed through the hollow stem auger and the annulus filled with a bentonite-water-cement grout as the auger was withdrawn.
The grout was designed to match the expected stress-strain characteristics of the ground through trial mixtures developed in the laboratory prior to field installation. From unconfined compression tests, the strength results of these mixtures are shown in Figure 4 for water-cement ratios varying from 1:1 to 3:1 and for curing times of 14 and 28 days.

Proceedings of the 2nd Symposium on Coupled Phenomena in Environmental Geotechnics (CPEG2), Leeds, UK 2017
Figure 4. Strength of trial grout mixtures for inclinometers.
Given the estimated unconfined compressive strength of the formation soils adjacent the trench, the sample with a water-cement ratio of 3 was the best match in terms of strength compatibility. From unconfined compression tests, the strain at failure results of these mixtures are shown on Figure 5 for water-cement ratios varying from 1:1 to 3:1 and for curing times of 14 and 28 days. At the selected water-cement ratio of 3:1, the strain at failure was just over 1% at 28 days. Since low strains were expected (and measured) in the inclinometers, these values were deemed acceptable. A 3:1 grout was determined to closely match the stress / strain behavior of the soils and was subsequently used.
Figure 5. Strain at Failure for trial grout mixtures for inclinometers.
2. RESULTS AND DISCUSSION
As noted earlier, instrumentation included inclinometers, settlement plates, earth pressure cells and pore pressure transducers. This instrumentation was monitored prior to excavation, during excavation using bentonite-water slurry, during backfilling of the excavated trench with SB material, and during a nine-month post construction period. The results of this monitoring and a discussion of the coupled phenomena as revealed in the results are presented in this section of the paper.
2 .1 Inclinometers
Inclinometer readings were taken on all eight inclinometers (four pairs) beginning at time prior to the start of excavation to the present at frequencies. Measurements were initially measured in days and hours and now measured in weeks. Data at various times were selected and plotted for inclinometer pair 5-6 as a function of depth as shown in Figure 6. These data reveal maximum movements at the top and little to no movement at depths of 7m and deeper (excavation was to a depth of 7 m in this area. Notice a bulge centered at a depth of 5m consistent with boring data indicating low blow count material at this depth.
Figure 6. Lateral Displacement for Inclinometer Pair 5-6.
To better visualize movement over time and couple this movement with construction activities, the movement from inclinometers 5 and 6 at a representative depth of 2.5 m below ground surface prior to the start of construction was plotted as shown in Figure 7. The first reading shows no movement and represents the position of the inclinometer at the time of installation. The next several readings show inward movement as excavation under slurry to full depth is completed. Slurry unit weight was 10.2 kN/m3 when pumped to the trench from the hydration pond, but gains weight as formation fines mix with the slurry as excavation proceeds. The unit weight of the slurry at a depth of 2 m taken at the time the instrumentation cage was installed was found to be 10.8 kN/m3. As expected, the sidewalls move inward during excavation under slurry in order to balance the stress in the formation soils with the stress exerted by the slurry. Movement continued between the end of excavation and the start of backfilling due to creep of formation soils inward toward and into the slurry filled trench. Inward movement of the sidewalls was constrained toward the bottom of the trench (see Figure 6) illustrating the need to consider this constraint in assessment of stresses.
Figure 7. Lateral Displacement for Inclinometer Pair 5-6.
The next step in the construction process for a SB cutoff wall is placement of the SB backfill. Backfill was placed as a dense viscous liquid having an average unit weight of 18.3 kN/m3 for measurements taken in the vicinity of the instrumentation cages and inclinometers 5 and 6. Given the viscous liquid nature of the backfill, the horizontal stress is approximately
0
1000
2000
3000
4000
5000
6000
0 0.5 1 1.5 2 2.5 3 3.5
Unconfinedcom
pressiv
estrength(kPa)
Water-CementRatio
14daycuring
28daycuring
0
0.5
1
1.5
2
2.5
3
0 1 2 3 4
StrainatFailure(%
)
Water-CementRatio
14daycuring
28daycuring
Proceedings of the 2nd Symposium on Coupled Phenomena in Environmental Geotechnics (CPEG2), Leeds, UK 2017 equal to the vertical stress, i.e. the lateral earth pressure coefficient is approximately 1. Further, since the backfill has a significantly higher unit weight than the slurry, the backfill is capable of exerting a higher lateral stress. This stress increase causes lateral movement of the sidewall in the outward direction and this movement is observed in the inclinometer readings as shown in Figure 7. At the completion of backfilling when the lateral stresses exerted by the backfill are at their maximum, the net inward movement observed for inclinometers 5 and 6 was only 3 mm.
The final two stages of movement shown in Figure 7 are self-weight consolidation and secondary consolidation (creep) of the backfill. During these two stages, multiple coupled phenomena are occurring. As the backfill consolidates the material gains strength and settles. The downward movement of the backfill relative to the trench sidewalls results in the development of shear stresses between the backfill and the sidewalls of the trench. This shear stress development has the effect of transferring some of the weight of the backfill to the adjacent formation soils along the sidewalls of the trench. This coupling of inward lateral movement with stress reduction from the simultaneous stress transfer to the sidewalls is discussed in more detail in Section 2.2.
2 .2 Earth pressure cells and settlement plates
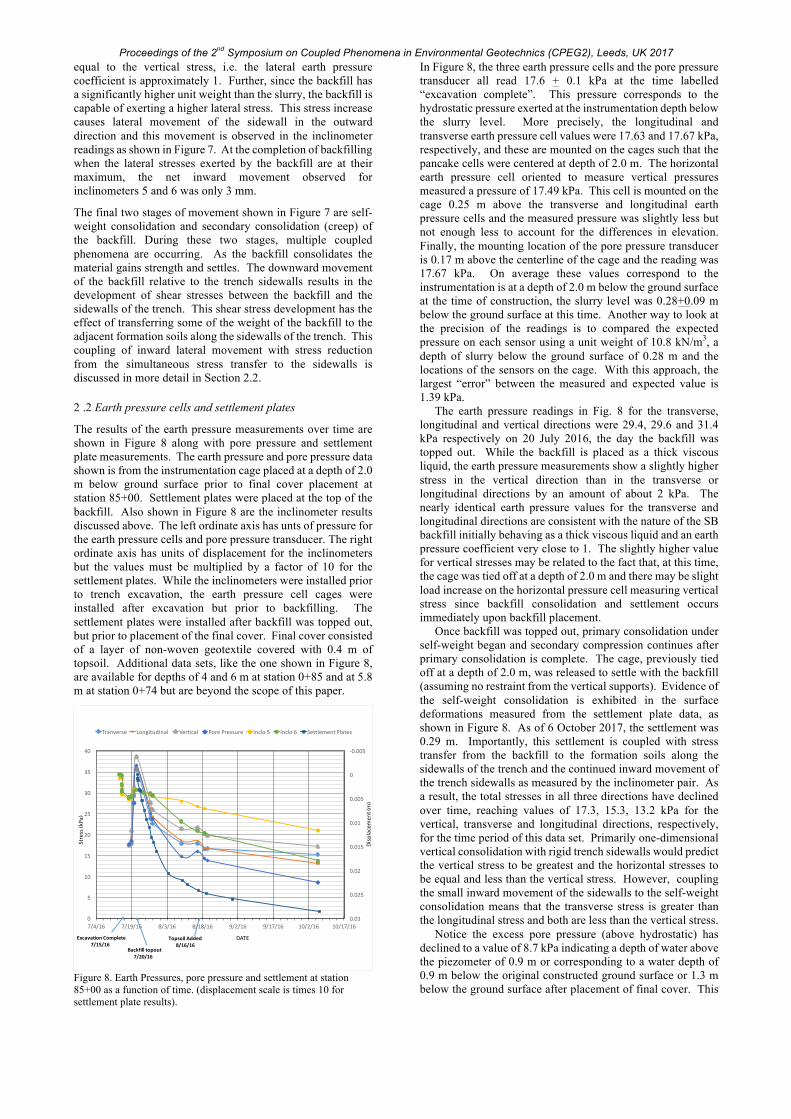
The results of the earth pressure measurements over time are shown in Figure 8 along with pore pressure and settlement plate measurements. The earth pressure and pore pressure data shown is from the instrumentation cage placed at a depth of 2.0 m below ground surface prior to final cover placement at station 85+00. Settlement plates were placed at the top of the backfill. Also shown in Figure 8 are the inclinometer results discussed above. The left ordinate axis has unts of pressure for the earth pressure cells and pore pressure transducer. The right ordinate axis has units of displacement for the inclinometers but the values must be multiplied by a factor of 10 for the settlement plates. While the inclinometers were installed prior to trench excavation, the earth pressure cell cages were installed after excavation but prior to backfilling. The settlement plates were installed after backfill was topped out, but prior to placement of the final cover. Final cover consisted of a layer of non-woven geotextile covered with 0.4 m of topsoil. Additional data sets, like the one shown in Figure 8, are available for depths of 4 and 6 m at station 0+85 and at 5.8 m at station 0+74 but are beyond the scope of this paper.
Figure 8. Earth Pressures, pore pressure and settlement at station 85+00 as a function of time. (displacement scale is times 10 for settlement plate results).
In Figure 8, the three earth pressure cells and the pore pressure transducer all read 17.6 + 0.1 kPa at the time labelled “excavation complete”. This pressure corresponds to the hydrostatic pressure exerted at the instrumentation depth below the slurry level. More precisely, the longitudinal and transverse earth pressure cell values were 17.63 and 17.67 kPa, respectively, and these are mounted on the cages such that the pancake cells were centered at depth of 2.0 m. The horizontal earth pressure cell oriented to measure vertical pressures measured a pressure of 17.49 kPa. This cell is mounted on the cage 0.25 m above the transverse and longitudinal earth pressure cells and the measured pressure was slightly less but not enough less to account for the differences in elevation. Finally, the mounting location of the pore pressure transducer is 0.17 m above the centerline of the cage and the reading was 17.67 kPa. On average these values correspond to the instrumentation is at a depth of 2.0 m below the ground surface at the time of construction, the slurry level was 0.28+0.09 m below the ground surface at this time. Another way to look at the precision of the readings is to compared the expected pressure on each sensor using a unit weight of 10.8 kN/m3, a depth of slurry below the ground surface of 0.28 m and the locations of the sensors on the cage. With this approach, the largest “error” between the measured and expected value is 1.39 kPa.
The earth pressure readings in Fig. 8 for the transverse, longitudinal and vertical directions were 29.4, 29.6 and 31.4 kPa respectively on 20 July 2016, the day the backfill was topped out. While the backfill is placed as a thick viscous liquid, the earth pressure measurements show a slightly higher stress in the vertical direction than in the transverse or longitudinal directions by an amount of about 2 kPa. The nearly identical earth pressure values for the transverse and longitudinal directions are consistent with the nature of the SB backfill initially behaving as a thick viscous liquid and an earth pressure coefficient very close to 1. The slightly higher value for vertical stresses may be related to the fact that, at this time, the cage was tied off at a depth of 2.0 m and there may be slight load increase on the horizontal pressure cell measuring vertical stress since backfill consolidation and settlement occurs immediately upon backfill placement.
Once backfill was topped out, primary consolidation under self-weight began and secondary compression continues after primary consolidation is complete. The cage, previously tied off at a depth of 2.0 m, was released to settle with the backfill (assuming no restraint from the vertical supports). Evidence of the self-weight consolidation is exhibited in the surface deformations measured from the settlement plate data, as shown in Figure 8. As of 6 October 2017, the settlement was 0.29 m. Importantly, this settlement is coupled with stress transfer from the backfill to the formation soils along the sidewalls of the trench and the continued inward movement of the trench sidewalls as measured by the inclinometer pair. As a result, the total stresses in all three directions have declined over time, reaching values of 17.3, 15.3, 13.2 kPa for the vertical, transverse and longitudinal directions, respectively, for the time period of this data set. Primarily one-dimensional vertical consolidation with rigid trench sidewalls would predict the vertical stress to be greatest and the horizontal stresses to be equal and less than the vertical stress. However, coupling the small inward movement of the sidewalls to the self-weight consolidation means that the transverse stress is greater than the longitudinal stress and both are less than the vertical stress.
Notice the excess pore pressure (above hydrostatic) has declined to a value of 8.7 kPa indicating a depth of water above the piezometer of 0.9 m or corresponding to a water depth of 0.9 m below the original constructed ground surface or 1.3 m below the ground surface after placement of final cover. This
-0.005
0
0.005
0.01
0.015
0.02
0.025
0.030
5
10
15
20
25
30
35
40
7/4/16 7/19/16 8/3/16 8/18/16 9/2/16 9/17/16 10/2/16 10/17/16
DATE
Tranverse Longitudinal Vertical PorePressure Inclo5 Inclo6 SettlementPlates
Backfilltopout7/20/16
ExcavationComplete7/15/16
TopsoilAdded8/16/16
Stress(kPa)
Displacemen
t(m)
Proceedings of the 2nd Symposium on Coupled Phenomena in Environmental Geotechnics (CPEG2), Leeds, UK 2017 is consistent with data from nearby monitoring wells indicating little to no excess pore water pressure remaining.
2 .3 Earth pressure comparisons to theoretical
These earth pressure cell total stress data (17.3, 15.3, 13.2 kPa for vertical, transverse and longitudinal, respectively) and pore pressured data (8.7 kPa) can be used to compute effective stresses in the wall some three months after construction. The results are 8.6, 6.6 and 4.5 kPa for the vertical, transverse and longitudinal directions, respectively. Under geostatic conditions at a nominal cage depth of 2.4 m, a backfill unit weight of 18.3 kN/m3 and a depth to water of 1.3 m, the vertical effective stress total and effective stresses on the horizontal earth pressure sensor locate 0.25 m above the centerline of the cage would be equal to 39.3 kPa and 29.0 kPa, respectively. The stress reduction from calculated geostatic (29.0 kPa) to measured 8.6) due to the load transfer from the backfill to the formation at the sidewalls is clearly substantial.
The computed values of effective stress can be compared to those predicted using the arching model (Evans et al. 1995) and the modified lateral squeezing model (Ruffing et al. 2010). The arching model assumes rigid sidewalls and friction forces developing to the limit state between the consolidating backfill and sidewalls of the trench. For a trench width of 0.9 m, a backfill unit weight of 18.3 kN/m3, an interface friction of 30o, and a cohesion of zero, the predicted vertical effective stress based on the arching model is 9.6 kPa. Note that the current version of the arching model assumes the ground water at the surface. Nonetheless, a computed value of 9.6 kPa is in relatively good agreement with a measured value of vertical effective stress of 8.6 kPa.
The modified lateral squeezing model incorporates properties of both the backfill and the adjacent formation soils. Using typical properties for medium and high fines backfills and silty and sandy formation soils would result in predicted lateral movement of 0.15 m at a depth of 2.5 m, consistent with that movement observed in the inclinometers. With these range of formation soil property assumptions and encouraged by the good agreement between movements in the model and those measured, the modified lateral squeezing model predicts a lateral stress of 4.5. and 8.5 kPa for the two formation soil types. In comparison, the measured value of the transverse effective stress was 6.6 kPa for a depth of 2.4 m.
3. CONCLUSION AND FUTURE STUDIES
The goal of this paper was to explore the coupled nature of SB backfill settlement, formation sidewall movement and resulting stress state in the backfill through settlement plate, inclinometer, earth pressure and pore water pressure measurements. Measured values of vertical, transverse and longitudinal stresses were compared with arching and modified lateral squeezing model predictions made using site specific construction data. Agreement between measured and predicted stresses is encouraging. The findings of this study coupled with previous studies comparing model results with field results (.e.g. Ruffing et al. 2010 and Ruffing and Evans 2015), make it clear that the use of geostatic stress conditions in SB slurry trench cutoff walls is incorrect and can lead to an underestimation of the stress dependent hydraulic conductivity of the backfill.
In addition to the field data discussed herein, additional instrumentation has been deployed included cages at additional locations and deeper depths. Settlement plates and inclinometer pairs not discussed in this paper may provide additional verification and/or insight into the findings reported in this paper. The assessment methodology described herein
has been demonstrated for one data set and it remains necessary to apply it to the remainder of the data. Also, in situ tests are planned for additional measures of stress and strength to correlate with those data from the instrumentation cages.
The authors are encouraged by this agreement and plan additional modification to the models to account for varying water levels and plan addition laboratory testing of formation soils for use in future model.
3. ACKNOWLEDGEMENTS
The authors appreciate the support of the National Science Foundation (Award # 1463198) that enabled this research project. The authors also appreciate CETCO for the donation of the bentonite for this project, Central Builders Supply for providing onsite support during construction and the study location, and Geo-Solutions, Inc. for their construction of the project. In addition, the authors acknowledge the Jeffrey C Evans Geotechnical Engineering Laboratory endowment, established through the generosity of Michael and Laureen Costa, which was used to provide financial support for the students and faculty. Special thanks are also given to Professor Alan Marchiori for his contributions to the data acquisition and transmission of the data to a web-based dashboard. Contributing students include Ushma Manadhar, Brian Ward, Tyler Zbytek, Fernando Andrade Orellana Alves, A. C. Li and Nancy Ingabire Abayo. Finally, the authors appreciate the detailed reviews and helpful comments received as part of the peer review process
4. REFERENCES
Britton, J.P., Filz, G.M., and Herring, W.E. (2004). Measuring the hydraulic conductivity of soil- bentonite backfill. Journal of Geotechnical and Geoenvironmental Engineering, 130(12), 1250-1258.
Evans, J.C. (1993). Vertical cutoff walls. Geotechnical Practice for Waste Disposal. D.E. Daniel, ed., Chapman and Hall, London.
Evans, J.C. (1994). Hydraulic conductivity of vertical cutoff walls. Hydraulic Conductivity and Waste Contaminant Transport in Soils, ASTM STP 1142, D. E. Daniel and S. J. Trautwein, eds., American Society for Testing and Materials, Philadelphia, 79-94.
Evans, J.C. (1995). Soil- and cement-based vertical barriers with focus on materials. Assessment of Barrier Containment Technologies – A Comprehensive Treatment for Environmental Applications.
Evans, J.C. and Ryan, C.R. (2005). Time-dependent strength behavior of soil-bentonite slurry wall backfill. Waste Containment and Remediation: Proceedings of the Geo-Frontiers 2005 Congress, ASCE Geotechnical Special Publication No. 142.
Evans, J.C. Costa, M. and Cooley, B. (1995). The state of stress in soil-bentonite slurry trench cutoff walls. ASCE Specialty Conference on Characterization, Containment, Remediation and Performance in Environmental Geotechnics, The Geoenvironment 2000, ASCE Geotechnical Special Publication No. 46.
Evans, J.C., Fang, H.Y., and Kugelman, I.J. (1985). Containment of hazardous materials with soil- bentonite slurry walls," Proceedings of the 6th National Conference on the Management of Uncontrolled Hazardous Waste Sites, Washington, D.C., November, 1985, 249-252
Evans, J.C., Malusis, M.A. and Jacob, R. (2014) Field Testing and Monitoring of an Experimental Soil-Bentonite Cutoff Wall, Proposal to the National Science Foundation, Award # 1463198
Evans, J.C., Huang, H. and Ruffing, D. G. (2016) “Evaluation of Soil-Bentonite Backfill Consolidation Properties” Proceedings of the DFI International Conference on Deep Foundations, Seepage Control and Remediation, NY, NY, pp. 169-178.
Filz, G.M. (1996). Consolidation stresses in soil-bentonite back-filled trenches. Proceedings of the 2nd International Congress on Environmental Geotechnics, M. Kamon, ed., Osaka, Japan, 497-502.
Filz, G.M., Baxter, D.Y., Bentler, D.J., and Davidson, R.R. (1999). Ground deformations adjacent to a soil-bentonite cutoff wall.

Proceedings of the 2nd Symposium on Coupled Phenomena in Environmental Geotechnics (CPEG2), Leeds, UK 2017 Proceedings, Geo-Engineering for Underground Facilities, ASCE Geotechnical Special Publication 90, 121-139.
Malusis, M.A., Yeom, S., and Evans, J.C. (2011). Hydraulic conductivity of model soil-bentonite backfills subjected to wet-dry cycling. Canadian Geotechnical Journal, 48(8), 198-211.
Millet, R.A., Perez, J.Y., and Davidson, R.R. (1992). USA Practice Slurry Wall Specifications 10 Years Later. Slurry Walls: Design, Construction, and Quality Control, ASTM STP 1129, Paul, Davidson and Cavalli, Eds., American Society for Testing and Materials, Philadelphia, PA, 42-68.
Millet, R.A. and Perez, J.Y. (1981). Current USA Practice: Slurry Wall Specifications. Journal of the Geotechnical Engineering Division, ASCE, 107(GT8), 1041-1056.
National Research Council (2007). Assessing the Performance of Surface and Subsurface Engineered Barriers. National Academies Press, Washington, D.C.
Ruffing, D. G., and Evans, J. C., (2010). In situ evaluation of a shallow soil-bentonite slurry trench cutoff wall. Proceedings of the 6th International Congress on Environmental Geotechnics, New Delhi, India, Tata McGraw-Hill, ISBN 13:9780070707108, 758-763.
Ruffing, D.G., Evans, J.C., and Malusis, M.A. (2010). Prediction of earth pressures in soil-bentonite cutoff walls. GeoFlorida 2010: Advances in Analysis, Modeling, and Design, ASCE Geotechnical Special Publication 199, 2416-2425.
Ruffing, D. G., and Evans, J.C., (2015) “Strength and Stress Estimation in Soil Bentonite Slurry Trench Cutoff Walls using Cone Penetration Test Data.” The International Foundations Congress and Equipment Expo, San Antonio Texas ASCE GSP 256, pp. 2567-2576.
Ryan, C.R. and Day, S.R. (2003). Soil-bentonite slurry wall specifications. Pan American Conference on Soils Mechanics & Geotechnical Engineering, ASCE Geo-Institute and MIT, Cambridge, MA, 8 p.
Shackelford, C.D. (1994). Waste-soil interactions that alter hydraulic conductivity. ASTM STP 1142, Hydraulic Conductivity and Waste Contaminant Transport in Soil, D.E. Daniel and S.J. Trautwein, eds., 111-168.
View publication statsView publication stats