Embed Size (px)
Citation preview

Soil and water management for rainfed agriculture in semi-arid areas
Securing livelihoods and food production
by slowing the water flow in catchment areas
Pieter van der Zaag
UNESCO-IHE Institute for Water Education
Delft, June 2015

Source cover illustration: taken from the journal Farming in South Africa, circa 1940

Table of Content
1. Introduction: from erosion control to soil and watershed management 1
2. Crop water requirement 3
2.1 Intermezzo: water requirements for food diets 7
2.2 The water balance of a crop 8
2.3 Defining green and blue water 10
3. The yield gap 12
3.1 Water 13
3.2 Nutrients 13
3.3 Soil management 16
4. Different approaches to water control 19
5. Increasing soil moisture storage 21
6. Small-scale rainwater harvesting and water storage 24
7. Off-farm impacts 28
8. Watershed linkages 31
9. Additional strategies to drought-proof livelihoods 35
10. Conclusion: slowing the flow and institutionalising linkages 37
Annex: Soil moisture 38
References 40

Newly constructed terraces on steep slopes in Biriwiri valley, eastern Zimbabwe, 1995

1
Soil and water management for rainfed agriculture in semi-arid zones ∗
Securing livelihoods and food production by slowing the water flow in catchment areas
Pieter van der Zaag
UNESCO-IHE Institute for Water Education, Delft, The Netherlands
If water is running make it walk, if water is walking make it stand, if water is standing make it sit, if water is sitting make it sleep.
Upanishad (cited in Vishnudas, 2006)
1. Introduction: from erosion control to soil and watershed
management Erosion control has been the primary focus of soil and water management until recently. Now the focus has widened to soil and water productivity, including both erosion control and soil and water management and crop husbandry that targets yield increase within the framework of sustainable agriculture. Soil and water management includes a wider focus on dry spell mitigation and integrated farming systems development, where water is linked to soil and crop management. Soil and water management at the farm level also includes water resources management. This micro scale water resources management is based on the same principles as large water development, i.e., assessment of runoff dynamics and design of storage reservoirs and water management schemes. The difference is the scale of operation. This micro-scale, farm-level soil and water management deals, among others, with crop water use, crop yields, and water productivity of crops, and with three important water fluxes: rainfall, (soil) evaporation (and interception), and (crop) transpiration. Upscaling from crops and the farmers’ fields one reaches the watershed. It is at this scale where soil, water and crop management combine and may potentially result in marked impacts downstream. This lecture series focuses on the question how crop yields under rainfed conditions can be improved, and what the possible effects are on water availability downstream.
∗ The lecture note is based on the UNESCO-IHE lecture note on “Soil and Water Management” of 2005 by Johan Rockström and Pieter van der Zaag; an invited paper by Pieter van der Zaag for the NethCID Symposium, 22 March 2007 at UNESCO-IHE, Delft, entitled “Possibilities and constraints of rainfed agriculture in Africa: securing food stocks by slowing the water flow”, and on Van der Zaag (2010).

2
Moreover, we touch on the question how the linkages between upstream and downstream users in catchments areas can be institutionalised. The questions raised are extremely relevant: the majority of the world’s farmers practise rainfed agriculture, and many are poor. Crop production in many semi-arid areas of the world where rainfed agriculture is being practised has remained sub-optimal despite prolonged government, non-governmental as well as international support since the 1970s. Grain yields still hover around 1 ton/ha as they did 25 years ago and regularly farmers are faced with total crop failure. There are more than 830 million undernourished people in the world, and despite the targets set out by the MDGs, this number has been increasing (FAO, 2006; UN, 2011). During the last 10 years there has been a renewed interest to understand how the large agricultural potential of semi-arid savannah areas of the world can be ‘unlocked’. The low agricultural productivity has been explained by at least five factors: (a) farm lands remain nutrient poor (Morris et al., 2008) and (b) lack sufficient water, while farmers are constrained by (c) energy (for tillage, weeding, and hauling of water), and (d) access to capital to invest in these three constraining elements (Yilma et al, 2004); while farmer initiative has been stifled by (e) diminutive and imperfect markets and unrealistically low farm-gate prices for staple crops (Awulachew et al., 2005). This paper assesses the first three explanatory factors, which are interrelated albeit in non-linear ways. While nutrient deficits may be the major constraining element in achieving high crop yields, this is known to the farmer and thus a non-stochastic variable. The second limiting factor, water, appears in the form of highly volatile rainfall events, as well as water flowing in nearby rivulets and rivers and as groundwater. This production factor is difficult to predict and costly to control. Energy, the third factor limiting crop production, crosscuts and influences the factors identified earlier. With human power and other forms of energy, plough pans can be broken, terraces can be constructed, storage tanks and small dams can be dug, from which water can be pumped to supplement rainfall. One thought underlying this lecture series is that by slowing the flow of water in catchment areas, the cumulative benefits derived from water increase. By linking different categories of water users (up- and down-stream), it may be possible to unlock this sustainable development potential. The next section first deals with crop water requirements (section 2). The section that follows explains the yield gap, focusing on water, nutrients and soil management (section 3). Then different approaches to water control are reviewed (section 4), and two approaches are discussed in detail: increasing soil moisture storage (section 5) and small-scale rainwater harvesting and water storage (section 6). Then the focus is enlarged looking at off-farm impacts of soil and water management (section 7), and to the watershed linkages that obtain (section 8). Additional strategies to drought-proof livelihoods are briefly discussed (section 9). The last section draws some conclusions about our focus on slowing the water flow and institutionalising upstream-downstream linkages (section 10).

3
2. Crop water requirement Plant growth occurs through the process of photosynthesis (also known as CO2 assimilation). Photosynthesis is the manufacture, in green plant leaves, of organic materials (carbohydrates, (CH2 O)n ), through reduction of carbon dioxide (CO2) from the air by means of solar energy (sunlight = short-wave radiation) in the presence of H2O:
CO2 + H2O + solar energy -> CH2 O + O2 Photosynthesis itself uses a negligible amount of water. However, through transpiration of water through the stomata of plant leaves, nutrients flow from the plant roots through the stem to the leaves. Transpiration of water, thus, should not be considered a ‘water loss’; it is essential for plant production. Crops utilise a lot of water. The water utilization efficiency for harvested produce (Ey) range, for grain crops such as wheat, sorghum, maize and rice, between 0.6 and 1.6 kg harvested grain per m3 of water used. For tuber and root crops, such as potatoes, the water utilization efficiency is around 4-7 kg/m3. For fresh vegetables and fruits, such as fresh beans, tomatoes, water melon, this efficiency ranges from 1.5-12 kg/m3 (Table 1). In a situation where nutrients are not in short supply, total biomass production (Ytot) is a function of incoming shortwave radiation (Rs) and maximum evapotranspiration (ETm), and inversely related to the moisture in the air (expressed as the difference between the saturation vapour pressure ea and actual vaporation pressure ed: ea-ed):
Ytot = f ( Rs, ETm, 1 / (ea-ed) ) In this relationship, evapotranspiration is of greatest interest since this is the term which can be influenced by soil and water management: more water available to the crop translates to more evapotranspiration and to higher yields, provided nutrients are not in short supply. The water used to produce food is generally considered to include the whole green water flow branch, i.e., both non-productive evaporation (E) and productive transpiration (T). This is unfortunate as crop water use therefore includes completely different water flows; both driven by atmospheric thirst for water but involved in fundamentally different processes (transpiration directly related and proportional to plant growth, evaporation directly related to conversion of water to vapour from soil, water and canopy surfaces). As a general rule, crop transpiration is directly related to crop growth, where more transpiration equals more crop growth. This relationship is generally linear and very conservative (i.e., physiologically determined and difficult to influence based on management as long as water is non-limiting). Different crops require different amounts of productive water (transpiration) to reach maturity. If soil conditions (mainly soil fertility and aeration) and water availability for the crop are non-limiting, than the amount of transpiration for a certain plant, crop or tree is determined by physiological characteristics and climate only. This we can call potential transpiration. As soon as soil factors or water is limiting, a plant will not transpire at its potential rate. This is where management comes in.

4
The climatic factors that drive transpiration are:
- solar radiation, - air temperature, - wind speed, and - vapour pressure difference between the interior spaces of leaves (where vapour
pressure is always near to saturation) and the air surrounding the leaves. In simple terms, high solar radiation, high air temperature and a dry air (low air humidity or low vapour pressure) will increase the atmospheric thirst for water (generally defined as the potential evaporation, or potential evapotranspiration), and thereby increase potential transpiration. The dryness of the air, or deficit of vapour between the air adjacent to the canopy and inside the leaves is a key factor driving transpiration. This gradient of vapour deficit between leaf and air adjacent to the leaf, defined as the vapour pressure deficit, sucks water from the stomata of leaves to the atmosphere in an effort to equalise pressure between air and leaf following the principles of conservation of energy. In a sparsely vegetated biotope (e.g. a savannah) vapour released from leaves will rapidly be blown away by wind and thereby a dry air layer near the leaves is maintained. Wind speed thus contributes to maintain the pressure deficit and keeps the transpiration process running at a higher rate than without wind, where the released moisture from the canopy can contribute to reduce vapour pressure deficit. In contrast, in a rain forest the canopy is so closed that it creates a humid micro-climate within the biotope, which means that the pressure deficit between leaf and air is maintained low (the air is kept very humid) and this slows down the transpiration process dramatically. Relations between crop yield and evapotranspiration may be established from field experiments. The relationship found will always be site specific. Field experiments with maize in California and Israel found a linear relation between dry matter production (a specific measure of yield) and the evapotranspiration (Figure 1).
Figure 1: Relation between dry matter production and transpiration (Source: Loomis and Connor, 1992)
Plants in tropical regions often have a different physiology compared to temperate plants. For example, temperate grains (wheat, barley, rye, oats) have a photosynthetic

5
pathway where carbon dioxide has to be taken up continuously to maintain photosynthesis. This means that transpiration flow is continuous as well, because transpiration flow occurs only when stomata of the leaves are open for uptake of carbon dioxide. These temperate crops are defined as C3 crops. Tropical food crops on the other hand, have developed another photosynthetic pathway with an intermediary storage of carbon dioxide in the leaf, which enables them to carry out a more water efficient photosynthesis (less water is lost per unit carbon assimilation). These are defined as C4 crops. It has been shown that C4 crops have roughly twice as high carbon assimilation per unit transpiration compared to C3 crops. Interestingly, this assimilation rate, for a given vapour pressure deficit, is rather conservative for different crops. This means that for temperate food crops a less efficient photosynthetic pathway is compensated for by a more moist atmosphere (i.e., a lower pressure gradient driving transpiration), and conversely in the tropics a thirsty atmosphere is compensated for by a more efficient photosynthetic pathway. The implication of the above is, for example, that a wheat crop in Europe and a maize crop in India will produce roughly similar biomass or grain per unit transpiration. This rate of plant growth per unit productive green water flow (i.e. transpiration T) is in the order of 10-12 kg biomass per mm and hectare (or 1.0-1.2 kg m-3) (Loomis and Connor, 1992). To put it in a very simplified manner; in general the water requirement of productive green water as plant transpiration, to produce a unit of food, does not differ significantly for most cereals on Earth. This is important for two reasons. First, it clarifies the common but erroneous notion that food production in hot topical regions per definition requires more water per unit food produced. Secondly, it shows the danger of bundling together evaporation and transpiration. Because, while tropical crops are efficient productive green water users, non productive water flow as evaporation tends to be much higher in tropical regions. In most statistics on water requirements for different crops of the world, water requirement is defined as total green water flow, including evaporation. Such figures are generally used to explain that tropical crops require more water, which as shown above, if focusing on the water that really counts, namely the productive flow contributing to biomass growth, is not that different. The following question arises: is evaporation part of the non-negotiable flows that are driven only by hydro-climate and not by management? The answer is partly yes and partly no. Yes, the rate of evaporation is directly proportional to evaporative demand of the atmosphere, i.e., evaporation is higher in the tropics than in temperate regions from moist soil. On the other hand, evaporation losses can be reduced through management, using various systems of mulching, intercropping, and probably most importantly, by increasing canopy of the crop grown by improving crop productivity. Still, even if evaporation is included (i.e., water per unit food produced is defined as the amount of evapotranspiration per unit food), the differences between hydroclimatic zones for different crops are surprisingly low. Table 1 shows water productivity data for a range of temperate and tropical crops. Interestingly the range for most cereal crops is between 1,000 – 2,000 m3 of green water

6
flow to produce 1 ton grain. Even for rice many systems in the world operate at this range. Tubers are generally more efficient, such as potatoes, since a larger part of total biomass is harvested compared to grains. Only 200 to 400 m3 are required to produce one ton dry matter of potato. Tomatoes is another example of a highly water productive crop. The conclusion is that in generic terms, disregarding the impact of management, it is possible to talk of a relatively universal average of some 1,500 m3 of green water to produce one ton of food (equivalent to 0.7 kg m-3). However, there are large management opportunities to influence these figures, which means that the range of actual green water use in the farmer’s field is huge, often between 1,000 – 6,000 m3/ton (or 0.2-1.0 kg m-3) for a given crop within a given hydroclimate. This range (within crop and within hydroclimate) is larger than the average ranges for different crops in different hydroclimates shown in Table 1. This suggests that the negotiable part of crop water needs – management - induces a larger variation in crop water requirements than the non-negotiable biophysical parameters - hydro-climate and crop physiology. In the search for water for food strategies where more food is produced with minimum impact on water availability for ecosystems, this is encouraging. It shows that management can offer large opportunities to change the current water use in agriculture in favour of win-win synergies where more food is produced per unit consumed water. Table 1 Water productivity (kg m-3) and crop water requirements (mm) for some major
food crops of the world.
Crop Hydroclimate Type of crop
Water productivity (kg m-3) Yield range Water requirement
Range Average (t ha-1) (mm)
Wheat Temperate C3 0.4 1.3 0.7 4-6 450 - 650
Peas, green Temperate C3 0.5 0.7 0.6 0.6-0.8 350 - 500
Potatoes Temperate C3 2.5 5.0 4.0 25-35 350 - 625
Rice Tropical C3 0.7 1.1 0.9 3-8 500 - 950
Maize Tropical C4 0.7 1.1 0.9 6-9 400 - 750
Millet Tropical C4 0.2 1.7 0.6
Sorghum Tropical C4 0.6 0.9 0.7 3-5 300 - 650
Sugarcane Tropical C4 5.0 10.0 6.7 50-150 1,500 - 2,500
Cotton seed Tropical C4 0.4 0.5 0.5 4-5 550 - 950
Sunflower seed Tropical C4 0.3 0.7 0.4 1-3.5
Beans, dry Tropical n/a 0.4 0.6 0.5 1.5-2.0 250 - 500
Soybeans Tropical n/a 0.5 0.8 0.6 1.5-3.5 450 - 825
Bananas Tropical n/a 3.1 4.3 3.6 40-60 700 - 1,700
Oranges Tropical n/a 2.0 5.0 2.9 25-40 600 - 950

7
2.1 Intermezzo: water requirements for food diets Table 2 compares the virtual water content of food diets in The Netherlands and in rural and urban Africa. The present global average use of water for food amounts to 1,200 m3 capita-1 year-1, with a range from 700 m3 capita-1 year-1 for the most malnourished region (sub-Saharan Africa) to 1,800 m3 capita-1 year-1 in the most well-fed region (North America). Earlier estimates of water to sustain an adequate diet of 2,700 kcal capita-1 day-1, amounted to 1,600 m3 capita-1 year-1. Table 2: Virtual water content of food diets in The Netherlands and in Africa
Food type
Food consumption (kg cap-1 day-1)
Water content m3/kg
Virtual water consumption (m3 cap-1 day-1)
urban Africa rural Africa Netherlands urban Africa rural Africa Netherlands
cereal 0.50 0.40 0.175 1.5 0.75 0.60 0.26
starchy roots 0.20 0.23 0.7 0.14 0.16
sugar crops 0.03 0.04 0.15 0.00 0.01
pulses 0.075 1.9 0.14
oil crops 0.025 0.05 0.027 2.0 0.05 0.10 0.05
vegetables 0.23 0.20 0.54 0.5 0.12 0.10 0.27
meat 0.10 0.01 0.22 15 1.50 0.15 3.30
egg 0.03 0.03 0.03 3.3 0.10 0.10 0.10
milk 0.06 0.15 0.76 1.0 0.06 0.15 0.76
daily total 2.57 1.48 4.91
annual total 940 540 1,790
Source: FAO (1997): Agriculture and food for Africa; Gezondheidsraad (2002): Enkele belangrijke ontwikkelingen in de voedselconsumptie
We assume a desired diet in 2050 of 3,000 kcal/person/day, i.e., the same level that FAO predicts as a global average in 2030. If we assume that 20 % of this is meat foods (a low figure compared to the present meat consumption of 30 – 35 % in developed countries but slightly higher than the present average of 10 – 15 % in developing countries), we arrive at a water requirement of 1,300 m3 capita-1 year-1. The desired volume of 1,300 m3 capita-1 year-1 for food is close to the present global average of 1,200 m3 capita-1 year-1, which indicates two essential points. First, that at a global scale we are already very close to a desired dietary balance in terms of water, i.e., there is enough water used for food production in the world today to feed everyone at desired levels. Second, it shows how extremely skewed the present average dietary water volume is. The global average is pulled up only thanks to a relatively small proportion of the world population (13 %) eating much food that requires a lot of water (23 % of present estimated green water flow, in the form of food). This refers to Europe and North America, consuming diets of 1,600 and 1,800 m3 capita-1 year-1, respectively. The desired water for food requirement thus primarily indicates the large need to improve diets in developing countries, where presently the average virtual water for food intake is 850 m3/capita/year.

8
2.2 The water balance of a crop For a good understanding of the hydrological processes involving soil and water management, it is useful to consider the water balance of a crop. Such a water balance may read as follows (refer also to Figure 2):
P + I + Ron = E+T - (C-D) + Roff + ∆S/∆t equation 1
where P: precipitation (mm/d) I: irrigation (mm/d) Ron: run-on (surface inflow into field from upstream) (mm/d) E: evaporation (mm/d) T: transpiration (mm/d) C: capillary rise (mm/d) D: deep percolation (mm/d) Roff: run-off (surface outflow from field to downstream) (mm/d) ∆S/∆t: change of soil moisture over the considered period (mm/d)
Figure 2: The water balance of a crop The capacity of the soil to store water, i.e. S in the above equation, is a key parameter. Available soil water (Sa) is the maximum volume of water that is available to the plant in the soil profile. It is the difference between the water content at Field Capacity (FC) and at Wilting Point (WP). Sa is preferably expressed in mm/m: the amount of water available per meter soil profile. As a general indication, Sa for heavy textured soils is around 200 mm/m; for medium textured soils around 140 mm/m; and for coarse textured soils it is around 60 mm/m. Table 3 provides typical values for Sa for some soils. See the Annex on soil moisture for a more elaborate treatment.
water table
soil surface
rooting depth
Run-on Ron Run-off Roff
Precipitation P Transpiration T
Evaporation E
Deep percolation D
Capillary rise C
Irrigation I

9
Table 3 Some typical examples of maximum available soil water (Sa) for various textural classes of soils (Source: Agricultural Compendium 1981: 75 table 2.3/7)
FC (pF=2) WP (pF=4.2) Sa Sa soil vol% vol% vol% mm/m sandy 10-20 4-10 6-10 60-100 sandy loam 15-27 6-12 9-15 90-150 loam 25-36 11-17 14-20 140-200 clay loam 31-41 15-20 16-22 160-220 silty clay 35-46 17-23 18-23 180-230 clay 39-49 19-24 20-25 200-250 Available Moisture (AM) is the total maximum volume of water that is available to the plant in the soil profile:
AM = D * Sa equation 2
where D = rooting depth (m) Sa = available water (mm/m) AM = available moisture (mm)
The uptake of water is already restricted before the θWP is reached. This is covered by the notion Readily Available Moisture (RAM), which is often taken as 50% of AM; but more generally can be expressed as:
RAM = p * AM equation 3
where p = soil water depletion fraction. p is crop dependent, but also decreases as evapotranspiration increases.
Table 4 provides typical values for D and p for various crops. Table 4: Some characteristics of selected crops (FAO 1979 and FAO 1977: 88, table 39 ) Crop Yield Rooting Soil water depletion fraction (ton/ha) depth D (m) p at ETm=5-6mm/d Beans 1.5-2 (dry) 0.5-0.7 0.45 Cabbage 25-60 0.4-0.5 0.45 Cotton 2-4.5 1.0-1.7 0.65 Groundnut 2-4.5 0.5-1.0 0.4 Maize 3-9 1.0-1.7 0.6 Onion 25-45 0.3-0.5 0.25 Peas 0.5-0.8 (dry) 0.6-1.0 0.35 Potato 15-35 0.4-0.6 0.25 Sorghum 2-5 1.0-2.0 0.55 Soybeans 1.5-3.5 0.6-1.3 0.5 Sugar cane 50-150 1.2-2.0 0.65 Sunflower 1-3.5 0.8-1.5 0.45 Sweet potato 12 1.0-1.5 0.65 Tomato 30-75 0.7-1.5 0.4 Wheat 3-6 1.0-1.5 0.55 After RAM has been depleted, some of the remainder of AM may be consumed by the crop, but at sub-optimal conditions: the crop will suffer from yield reduction. This means that the actual evapotranspiration ETa becomes less than the potential evapotranspiration ETm. The relation between actual evapotranspiration ETa and AM is shown schematically in Figure 3.

10
In the absence of any precise information of a particular soil, a rule of thumb may be used to make a first preliminary estimate of RAM: for most soils (not very heavy nor very light) and for field crops (except vegetables): RAM can be guestimated at 10% of the rooting depth.
Figure 3: Relative evapotranspiration in relation to moisture availability in root zone
2.3 Defining green and blue water It can be useful to distinguish blue and green water (Falkenmark, 1995): - ‘green’ water: soil moisture in the unsaturated soil layer, stemming directly from
rainfall, that is transpired by vegetation; - ‘blue’ water: water involved in the runoff (sub-)cycle, consisting of surface water
(including water in rivers, lakes and reservoirs) and groundwater (below the unsaturated zone, thus excluding soil moisture).
There is some disagreement whether to include non-productive evaporation in the definition of green water. Savenije (1998) makes a plea not to include these in the green water definition. To that end he coined the term ‘white’ water, which can be defined as follows. - ‘white’ water: rainfall and that part of rainfall which is intercepted and immediately
evaporates back to the atmosphere, as well as non-productive open water and soil evaporation.
Figure 4 gives a schematic representation of the hydrological cycle, distinguishing between these three water flows.

11
Figure 4: The hydrological cycle, with ‘white’, ‘green’ and ‘blue’ water,
and the two partitioning points (red dots)
capillary rise

12
3. The yield gap Global food production needs to double in the next 25 years in order to resolve present malnutrition of about 1 billion people, and the keep pace with population growth. We also know that focus is required in both irrigated and rainfed agriculture in order to achieve this huge challenge – which for Sub Sahara Africa and South Asia where the population growth is highest and present food deficits largest, even surpasses the impressive food growth during the so-called Green Revolution in Asia during the late 1960s and 1970s. Rainfed agriculture is the source of the bulk of world food, and will continue to do so also in the foreseeable future. Irrigation plays a very important role, but it is worth remembering that worldwide only 20 % of the agricultural land is under irrigation. It is thus in rainfed agriculture where we find the majority of the world’s 1.1 billion farmers (of which 95 % live in developing countries). Their share of global agriculture is very large, amounting to 60 % of world food production.
Figure 5: Maize yield gaps in selected countries of sub-Saharan Africa (Source: FAO Food Security report, 2008)
Current crop yields remain low in many semi-arid areas practising rainfed agriculture, and there is a huge gap between achievable yields on demonstration farm plots and average yields (Figure 5). Yields in Africa have lagged behind (Figure 6). Such low yields experienced on-farm indicate the constraints facing smallholder farmers, both in terms of water scarcity and other inputs, such as soil fertility management, tillage, timing of operations etc.. However, because the yields at present are so low, there is also a lot of room for improvement. The low yields can partly be explained by water constraints, partly by lack of sufficient nutrients (poor soils, under-application of manure and/or inorganic fertilizers), and by inadequate soil management. These three factors are briefly discussed.

13
Figure 6: Cereal yields [ton ha-1], developing regions, 1960-2005 (Source: Morris et al., 2008)
3.1 Water Under rainfed conditions, crop growth is subject to the random variability of rainfall in space and time. In tropical regions, rainfall variability is particularly high, as a result of the erratic, high intensity characteristics of the rainfall. Also, as a rule of thumb, the variability of rainfall over time increases with decreasing annual and seasonal rainfall levels. This means, e.g., that a semi-arid location with 500 mm/a of rainfall may have an annual variability of 30 – 40 % (average departure from the mean; which is normally expressed as the coefficient of variation (CV) calculated as CV = Standard Deviation/Mean), while a wetter sub-humid savannah may have a variability of only 20 % (i.e., much more reliable rainfall between years). Thus in drier areas the variability of rainfall tends to be higher than in wetter areas. Rainfall variability is strongly related to crop yields in rainfed tropical agriculture, particularly in semi-arid and dry sub-humid areas (rainfall between 400 – 900 mm/a) where water is a major constraint in food production (Figure 7). 3.2 Nutrients Crop yields are also constrained because of low soil fertility. This phenomenon should be viewed in its historical context, namely of a progressive shift from fallow based farming to continuous cultivation. The sustainability of shifting cultivation systems generally coupled with slash-and-burn practices, is based on the principle of using perennial shrubs and trees to lift soil nutrients from deep soil layers to the top soil where the annual food crops take their plant nutrients. As soon as fallow periods drop below a certain critical threshold (generally 10-15 years in the tropics) the fallow based system collapses, in the sense that the perennials are not anymore able to lift enough nutrients from deep soil layers to compensate for the export of nutrients from the cultivated annual food crops. The

14
abandoning of shifting cultivation resulted in an agrarian crisis, which was solved in the temperate zone through nutrient transfer from animals and later through fertilizers. Today modern temperate agriculture is more productive than ever before, with grain yields in the order of 6 – 10 tons/ha, based on an agricultural system that is highly unstable, in the sense that it is highly dependent on fossil fuel from external sources, which explains recent trends of moving back towards an agro-ecological climax with a better balance between animals and crops.
Figure 7: Dry spell occurrence in a semi-arid savannah agro-ecosystem
in Niger (1994-1996) (Rockström and Falkenmark, 2004; Fig 6.5; p. 124)

15
Figure 8: Fertilizer use, developing regions, 1970-2004
(Source: Morris et al., 2008)
Figure 9: Fertilizer use, developing regions, 1962, 1982, 2002
(Source: FAO Food Security report, 2008) In Africa the population driven transition from a shifting cultivation system to a largely continuous system occurred later than in Europe and Asia. The problem is that many farming systems are still in transition in many regions and experience a kind of agrarian crisis: abandoning one strategy for soil fertility recycling has not been compensated by the introduction of new soil fertility management strategies. Fertiliser use in sub-Saharan Africa is on average below 10 kg/ha (FAO, 2008) while studies in Eastern and Southern Africa show that the farming systems suffer from extensive nutrient mining, exporting on average some 50-70 kg of nitrogen, from every hectare each year (Figures 8 and 9). The farming systems have dropped down to a new agro-ecological climax, adapted to the “new” situation of extremely low soil fertility and low organic matter contents, resulting in a “one-ton-agriculture”, whereas the maximum attainable climax is 5-10 times higher. Inherently low fertile soils, the adoption of plough tillage practices with highly detrimental effects on soil structure and fertility in tropical soils, combined with the variable and erratic hydro-climate has further speeded up the process towards extremely low on-farm yields.

16
3.3 Soil management (Rockström et al., 1999) Land degradation, including both mining of soil nutrients and the destruction of soil structure through erosion, compaction and loss of organic materials, is one important factor explaining notoriously low crop yields. The effects of land degradation on crop growth are severe in many semi-arid and dry sub-humid tropical landscapes. The reason for this is that land degradation affects soil surface structure (i.e., by reducing infiltration capacity and reducing root development of crops) which in combination with the erratic, high intensity rainfall events, leads to excessively high runoff volumes and low infiltration rates, and subsequent erosion and water scarcity to the crop. A major cause for this land degradation is intensive soil preparation by hoe or plough, which together with the removal or burning of crop residues, leaves the soil exposed to climatic hazards such as rain, wind and sun. Conventional tillage using ox- or tractor drawn ploughs has over the years been perceived as the indicator of farm systems modernisation in developing countries. However, it is becoming more and more apparent that the ploughing techniques developed in temperate regions with gentle rains and low wind and water erosion, can have serious adverse effects on the long-term productivity of erosion prone tropical soils. Some of the major long-term negative effects on soil productivity from conventional ploughing are: - Compaction problems resulting in impermeable hard-pans, resulting in shallow root
development of crops. - Increased combustion of organic matter due to increased aeration and time with bare
soil exposed to solar radiation, resulting in loss of nutrients. - Decreased infiltration of rainwater into the soil, and increased direct runoff, leading
to water loss and increased soil erosion. - Loss of soil water due to increase of evaporative surfaces.
Figure 10: Rainfall partitioning in farming systems in semi-arid regions of sub-Saharan Africa, with the two partitioning points (red dots). (Rockström et al. 2001)
Given the above, it is possible to draw up a generalised on-farm water balance. Figure

17
10 gives a synthesized overview of the partitioning of rainfall in semi-arid rainfed agriculture, based on research experiences in sub-Saharan Africa. Soil evaporation E generally accounts for 30 – 50 percent of rainfall, a value that can exceed 50 percent in sparsely cropped farming systems in semi-arid regions. Surface runoff Roff is often reported to account for 10 – 25 percent of rainfall. Large and intensive rainfall events falling on soils with low water holding capacities, result in significant deep percolation D, amounting to some 10 – 30 percent of a rainfall. The result is that productive green water flow as transpiration T in general is reported to account for merely 15 – 30 percent of rainfall. Between 70 – 85 percent of rainfall can therefore be considered “lost” to the cropping system as non-productive green water flow (as soil evaporation) and as blue water flow (deep percolation and surface runoff). Figure 10 thus indicates that there is a high seasonal risk of soil moisture scarcity in crop production, in addition to spatial and temporal rainfall variability. The figure also indicates that there is much scope of improving the water availability to the crop. - If non-productive evaporation from the soil could be halved (for instance through
better weeding, mulching and other soil and crop husbandry practices), water available for transpiration of biomass could be doubled, and thereby rainfed crop production without a large downstream impact on water availability.
- Similarly, if direct run-off could be halved, for instance through proper ridging and
other soil husbandry measures, 30% more water would be available for transpiration.
- Finally, by increasing the root development of the crop, transpiration of soil
moisture could be enhanced significantly, increasing the productive transpiration of the water saved from direct runoff and non-productive evaporation. Note that a deeper root system also gives the crop access to additional soil nutrients.
In sum, many experts believe that through diligent crop and soil husbandry, the risk of crop failure and yield reduction due to dry spell may be reduced significantly, resulting in much higher yields (possibly doubling yields), and fewer instances of crop failure. But there is a second spin-off: if the risk of crop failure is reduced, farmers may be willing to invest more in their crop in terms of fertilisation (manure and/or chemical fertilisers). The combined result may be spectacular: more water and more nutrients may result in tripling or even quadrupling of yields. To sum up, appropriate soil management seeks to: • enhance the infiltration of rainwater, and thus reduce the amount of direct runoff; • enhance the development of the root system of the crop. The combined result is that soil management increases the "stock" of soil moisture at the crop’s disposal. The crop will therefore have a much better chance of withstanding dry spells.

18
A closer look at Figure 10 (above) indicates that soil and water management interventions aim at influencing two partitioning points of the water cycle. At the first partitioning point, where the rain drop touches the soil, the aim is to increase infiltration and to reduce direct runoff. As a result more water will become soil moisture. The second partitioning point is in the upper layers of the (unsaturated) soil. Here a water particle can either be taken up by vegetation and transpire, or evaporate directly from the soil, or, through deep percolation, recharge aquifers. The aim here is to enhance root development and reduce soil evaporation, so that more soil moisture can be taken up by vegetation (increasing transpiration). Depending on the vegetation and the situation of the micro-catchment, also groundwater recharge may be increased. Through these soil and water management interventions more biomass is produced, while the base flow in the river (the most valuable of blue water) may also be enhanced. Typically, the residence time of runoff flow in a watershed is increased. This, in general, has positive environmental as well as hydrological implications downstream.

19
4. Different approaches to water control It has been convincingly argued by many experts that resolving the problem of low and insecure crop yields should start with an increased control over the water resource (Savenije, 1998, 1999; Kijne, 1999; Rockström, 2000; Rockström et al., 2001; Rockström and Falkenmark, 2000). Once this is achieved farmers will be in a position to invest in soil fertility. So the crux of the matter is to make farming systems more resilient to rainfall variability. This can be done in a variety of ways. Water engineers would immediately look at the water itself, but farmers have traditionally developed other strategies of insuring themselves against the vagaries of the climate, for example through keeping grain stocks or investing in cattle or small stock (building up the herd in good rainy years, and selling or slaughtering cattle in bad years) and in educating their children (who will find salaried jobs in the cities and whose remittances can sustain the rural family in times of hardship). Economists would look at other ways to buffer the farming livelihoods, for instance through insurance schemes (e.g. Hess and Syroka, 2005). This paper is mainly concerned with the control of the water itself. Two different approaches can be distinguished that both aim at farmers having an increased control over water: one takes a conventional irrigation approach that aims at harnessing (blue) water in rivers and aquifers while the other targets rainfed agriculture and aims at improving soil water availability through a focus on rainfall and on slowing the water flow in the landscape. Both approaches are incorporated in the comprehensive agriculture development programme that NEPAD formulated in 2002, but the emphasis is on the former. This programme aimed to increase the area under improved land and water management in Africa from 8 to 15% of all arable land during the period 2002-2015 at a total investment cost (excluding O&M) of 37×109 US$ (average 1,880 US$/ha) (NEPAD, 2002). The investments included the rehabilitation and construction of large scale irrigation schemes covering 5.5 million ha, as well as small-scale irrigation developments on 14.2 million ha. The proposed programme also included water harvesting, soil and water conservation and land improvement but the investments were modest (12%) compared to irrigation development. The InterAcademy Council report on African agriculture (IAC, 2004), as well as many experts (including Droogers et al., 2001; Rijsberman, 2004; Cooper et al., 2008; Merrey and Sally, 2006) prioritise this focus on improving soil water availability in rainfed agriculture, because (a) it potentially has a much larger impact since it would target the large majority of (rainfed) farmers who produce as much as 93% of all food in Sub-Sahara Africa, and (b) conventional irrigation development has been very expensive but often with disappointing results and benefiting a minority of farm families. Small-scale forms of water management technologies are mushrooming across Africa and Asia. These all have the objective of buffering farming systems against the enormous temporal variability of rainfall and slowing the water flow in the landscape, capturing the rain as and where it falls, improving its infiltration into the unsaturated zone, storing access runoff in tanks for use during the inevitable periods of dry spells.

20
Annual rainfall amounts fluctuate, with coefficients of variation ranging between 20-40% in semi-arid and sub-humid savannah zones, whereby one out of five years can be classified as hydrological droughts and a severe drought leading to total crop failure may occur once every 10 years (e.g. Rockström, 2000; Falkenmark and Rockström, 2004; Conway, 2005; Cooper et al., 2008). Crop yields fluctuate with rainfall. Rainfall patterns during the rainy season differ markedly from year to year, making rainfed farming an uncertain and risky affair. The coefficient of variation of 10-day rainfall within the core 120 days of the rainfall season in Zimbabwe (November-February) may vary enormously from one year to the next (Figure 11). Dry spells within the rainy season to a large extent determine crop yields. For example, in semi-arid locations in Kenya and Tanzania, there is a probability of 0.2 – 0.3 for a dry spell to last more than 10 days at any time of the growing season of a crop, and a probability of 0.7 for such a dry spell to occur during the sensitive flowering stage (maize) (Rockström et al., 2001). Similar studies have been conducted for other countries. Rainfed farmers are acutely aware of these phenomena, which informs their planting strategies (Schouwenaars, 1988). Enfors and Gordon (2007) analysed rainfall patterns and the occurrence of dry spell in northern Tanzania, and whereas the decreasing trend in seasonal rainfall is not significant, the increase in the occurrence of dry spells lasting longer than 21 days was statistically significant. Buffering a rainfed crop against such long dry spells requires soils to be able to store as least 100-200 mm of water in the root zone. If the soil cannot store the entire amount, this needs to be supplied as supplementary irrigation water or the crop will experience severe water stress. The most resilient farming systems would combine both strategies to ensure that they can flexibly respond to the great variety of seasonal patterns and extremes that are likely to occur. The following sections discuss the opportunities to increase soil water availability and of harvesting rainwater.
1991-92 1992-93 1993-94 1994-95 1995-96 1996-97 1997-98 1998-99 1999-00 Mean 29.7 51.7 50.5 32.3 57.9 54.3 39.7 90.9 49.2 St.dev. 50.5 37.6 28.1 48.4 48.5 41.1 41.7 56.8 42.8
Figure 11: Variations of 10-day rainfall patterns of 9 consecutive rainy seasons, Harare, Zimbabwe, 1991-2000 (mm/10 days)
0
25
50
75
100
125
150
Aug
-91
Nov
-91
Feb-
92
May
-92
Aug
-92
Nov
-92
Feb-
93
May
-93
Aug
-93
Nov
-93
Feb-
94
May
-94
Aug
-94
Nov
-94
Feb-
95
May
-95
Aug
-95
Nov
-95
Feb-
96
May
-96
Aug
-96
Nov
-96
Feb-
97
May
-97
Aug
-97
Nov
-97
Feb-
98
May
-98
Aug
-98
Nov
-98
Feb-
99
May
-99
Aug
-99
Nov
-99
Feb-
00
May
-00
Aug
-00
rain
fall
(mm
/10
days
)

21
5. Increasing soil moisture storage The amount of soil moisture available to the crop can be increased by (a) increasing the infiltration of rainfall water, (b) increasing the development of the root system of the crop, and by (c) decreasing unproductive water losses such as soil evaporation and transpiration of weeds. Interventions to achieve this generally focus on tillage techniques and terracing. A large number of experts maintain that the conventional European mouldboard plough is ill-adapted to the specific climatic and soil qualities found in Africa and that reducing the physical disturbance of the soil through minimum tillage would be beneficial (Mupangwa et al., 2006). Prolonged superficial tillage has in many soils created plough pans that inhibit root development and rainwater infiltration. Plough-pans can be broken by ripping the soil by a tine, or by sub-soiling (Temesgen, 2007; Figure 12). Box 1 demonstrates the importance of root development for enlarging the soil moisture storage. Minimum tillage techniques and ripping have, however, often not been able to effectively curtail weed growth, which compete for scarce soil moisture (Twomlow and Bruneau, 2000). Labour required for weed control appears to be an important factor, and therefore the use of herbicides should be seriously considered. Reducing non-productive soil evaporation through mulching (covering bare soil with crop residues) has proven difficult in farming systems where cattle and small stock play important roles and graze the grain fields after the harvest.
Figure 12: Subsoiler based on the traditional Ethiopian maresha plough, developed by
Temesgen (2007) (photo: Melesse Temesgen)
22
Box 1: Rooting depth and bridging dry spells Consider a rainfed maize crop. If a dry spell of, say, 15 days, occurs during the growing season, when the crop water requirement is, say, 6 mm day-1, the crop needs to have a "stock" of 15*6 = 90 mm of soil moisture to be able to bridge the dry spell. Consider a sandy-loam soil with a water holding capacity Sa = 120 mm/m. Compare now the impact of the dry spell for two situations. The first maize crop has only a rooting depth of 0.5 meter, due to a hard plough pan in the soil. The second maize crop has a better developed root system, with a rooting depth of 1.20 m.
Situation 1 Situation 2 Water holding capacity Sa 120 mm/m 120 mm/m Rooting depth D 0.5 m 1.2 m Available Moisture (AM = D*Sa) 0.5*120 = 60 mm 1.2*120 = 144 mm Soil depletion fraction (p) 0.6 0.6 Readily Available Moisture (RAM = p*AM) 0.6*60 = 36 mm 0.6*144 = 86 mm
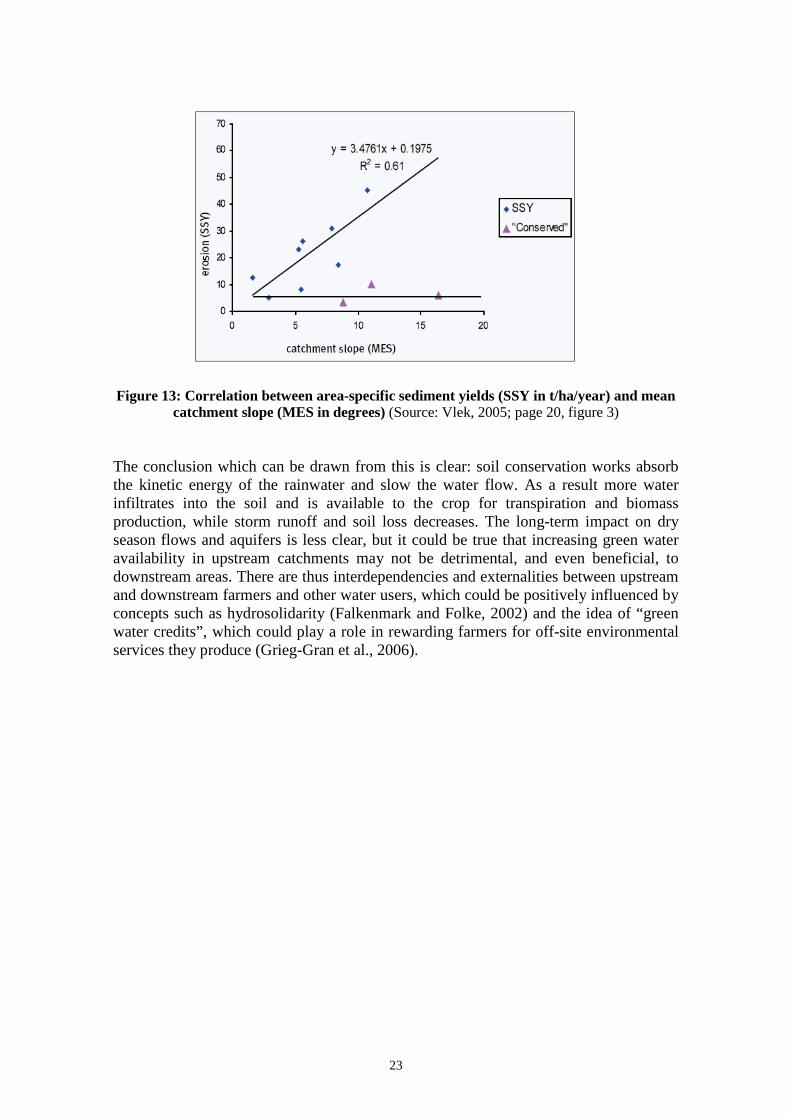
The crop with the well-developed root system can just about bridge the dry spell, if at the start of the dry spell the soil is at field capacity, drawing mainly from the readily available moisture (86 mm of the 90 mm required). As a result, the crop will hardly suffer moisture stress, and yield reduction will be minimal. The crop with shallow root development, in contrast, will suffer severe moisture stress. The total moisture available to the roots, if at the start of the dry spell the soil is as field capacity, is only 60 mm, of the 90 mm required. Already after 36/6=6 days the crop has exhausted the soil moisture that is readily available. Thereafter the crop will increasingly suffer moisture stress, resulting in severe yield reduction. If the dry spell occurs during the sensitive flowering stage, it may result in total crop failure. In places where hill slopes are steep and the pressure on land resources (and population densities) sufficiently high farmers have invested in modifying the shape of the soil profile such that rainfall water can be better captured and contained and that its infiltration into the soil is enhanced. Increased soil infiltration in the long term may trigger positive feedbacks, especially if combined with agro-forestry (Reij et al., 2005). This requires huge energy-consuming investments in the soil (as many as 300 to 550 labour days per hectare; Van der Zaag, 2003) that only occur at higher population densities (cf. Boserup, 1965; Tiffen et al., 1994). Interestingly such investments may not only have direct positive benefits to the farmers involved, but also to those living downstream, due to reduced storm flows, reduced siltation, and possibly even increased dry season flows and/or increased availability of groundwater. Vlek (2005) gives an example from Ethiopia where eight catchments without soil conservation works were compared with three with soil conversation and terraces. In those catchment areas without soil conservation, the sediment yield was proportional to hill slope, whereas in the protected catchment areas sediment yield was consistently low and did not correlate with slope (Figure 13).
23
Figure 13: Correlation between area-specific sediment yields (SSY in t/ha/year) and mean
catchment slope (MES in degrees) (Source: Vlek, 2005; page 20, figure 3) The conclusion which can be drawn from this is clear: soil conservation works absorb the kinetic energy of the rainwater and slow the water flow. As a result more water infiltrates into the soil and is available to the crop for transpiration and biomass production, while storm runoff and soil loss decreases. The long-term impact on dry season flows and aquifers is less clear, but it could be true that increasing green water availability in upstream catchments may not be detrimental, and even beneficial, to downstream areas. There are thus interdependencies and externalities between upstream and downstream farmers and other water users, which could be positively influenced by concepts such as hydrosolidarity (Falkenmark and Folke, 2002) and the idea of “green water credits”, which could play a role in rewarding farmers for off-site environmental services they produce (Grieg-Gran et al., 2006).

24
6. Small-scale rainwater harvesting and water storage Capturing and storing rainwater directly in the soil for biomass production is arguably the most efficient way of storing water. However, the capacity of the soil to store sufficient water is limited. Also, in a given year the absolute amounts of rainfall may simply be insufficient to grow a crop. In those situations the area used to capture the rainfall for the crop needs to be enlarged. This can be effectuated at the plant scale, whereby planting distances can be increased, enlarging the water catchment of individual plants. Examples are the matengo pits in Tanzania, tassa pits and half moon basins in Niger, and zaï pits in Mali (Reij et al., 1996). At the plot scale, runoff from adjacent non-cultivated fields can be channelled to cultivated plots, where the water can infiltrate and augment the soil moisture. Such runoff water may also be temporarily stored in a tank or pond before it is artificially applied to the crop by means of human or other forms of energy. This latter form of rainwater harvesting requires a catchment area from which runoff is harvested, a storage reservoir, and a device to move the water from the reservoir to the cultivated plot (Motsi et al., 2004). This is a form of supplementary or supplemental irrigation. The marginal productivity of supplementary irrigation water is known to be high. In Zimbabwe 1 m3 of supplementary irrigation water increased maize yields by 1.9 kg, which in 1999 was equivalent to a marginal value of approximately 0.2 US$ m-3 (Figure 14; Pazvakawambwa and Van der Zaag, 2000; compare with Rijsberman, 2004). Box 2 provides a calculation example of a water harvesting scheme
Figure 14: The relatively high value of supplementary irrigation water (Source: Pazvakawambwa and Van der Zaag, 2000)
In various countries rainwater harvesting and supplementary irrigation is actively promoted by the agricultural extension service. Some countries, such as the “water for food movement” of Ma Thsepo and the “war on hunger” programme in South Africa, have even started to subsidise the construction of water storage reservoirs that capture surface water generated from catchment areas, as well as the purchase of pumps that are used to convey the water from the reservoir to the crop during a dry spell. Obviously this infrastructure can also be used during the dry season to irrigate a small vegetable garden, provided sufficient water has been harvested.
0
1,000
2,000
3,000
4,000
5,000
6,000
0 50 100 150 200 250
total net supplementary irrigation (mm)
yiel
d Y
(kg
ha-1
)
Y = 1,440 + 18.7*QI (r2=0.71)

25
Box 2: Supplementary irrigation to bridge dry spells Consider again a rainfed maize crop, which again faces a dry spell of 15 days. The dry spell occurs during the sensitive flowering stage, when the crop water requirement is relatively high, in this case 7 mm day-1. Consider further that the crop has a very well-developed rooting system, due to diligent soil husbandry, with a rooting depth of 1.2 m. The soil, however, is a sandy soil with a low water holding capacity, of only 100 mm/m. How much additional water (e.g. from supplementary irrigation) to does the crop need to bridge the dry spell?
The crop water requirement during the dry spell is: 15*7 = 105 mm. If the soil is at field capacity at the start of the dry spell, there is 72 mm of readily available moisture stored in the soil (see table).
Situation 3 Water holding capacity Sa 100 mm/m Rooting depth D 1.2 m Available Moisture (AM = D*Sa) 1.2*100 = 120 mm Soil depletion fraction (p) 0.6 Readily Available Moisture (RAM = p*AM) 0.6*120 = 72 mm
There is thus a deficit of 105 - 72 = 33 mm, which has to be replenished. If we deal with a 1 hectare crop, this will require a net amount of 330 m3 of additional water (0.033*10,000), the first part of which should be supplied before the 11th day of the dry spell (72/7=10.3).
Is the water required to bridge the dry spell a lot of water in terms of water management for a small scale farmer? Let us consider storage of the water for supplemental irrigation in an open surface pond (micro dam). If we consider losses in the form of seepage and evaporation at 20 % the gross storage volume of the pond needs to be 330 * 1.2 = 400 m3. This corresponds to a pond of e.g. 20x10x2 meters. A prerequisite for successful supplemental irrigation is that such small micro dams can be filled up quickly after the onset of the rainy season. If we consider it to be filled after 3 large rainfall events, of say 25 mm/event, we need to find out the catchment area required to generate 400 m3 from a cumulative rainfall of 75 mm. To do this we need to know the runoff coefficients for each rainfall event. This is not trivial, as runoff depends on rainfall depth, intensity, soil wetness prior to rainfall, soil surface conditions, and slope.
For simplicity let’s assume a commonly experienced runoff coefficient of 0.25 (i.e., 25 % of rainfall converts into surface runoff). The catchment area to fill the 400 m3 pond after 3 rainfall events would have to be the volume stored (400 m3) divided by runoff generated (0.075*0.25 m) = 400/0.01875 = 21333 m2: a 2.1 ha catchment area. The required catchment area in this example is about twice the cultivated area that needs to receive supplemental irrigation. This type of subsidy schemes should be viewed as long-term investments in drought-proofing rural livelihoods. These small tanks may turn out to be the single most important element within a farming system that allows rural families to jump out of the poverty trap. The social value is therefore high, but the direct financial benefits may be limited due to the relatively high investment costs involved. In South Africa, a storage reservoir of 100 m3 may cost US$ 1,000 or much more. Annualizing this investment to US$ 100 per year, and assuming that the storage tank fills up two to three times during each rainy season and this water is beneficially used, the benefits would amount to 0.2×2.5×100=US$ 50 per year, i.e. half the investment costs. Assume further that the 100 m3 of stored water is used to supplement a water deficit of 100 mm, it can supplementary irrigate 1,000 m2. It would also suffice to fully irrigate a vegetable garden measuring some 200 m2 during the dry season. In order to use this water most efficiently drip irrigation has been proposed (e.g. Polak, 2005). But

26
the usefulness of drip kits has been questioned, for example in Zimbabwe (Maisiri et al., 2005; Moyo et al., 2006) If all small-scale farmers would have their own storage reservoir with a size of 100 m3 or more, each capturing surface runoff from relatively small uncultivated catchment areas (0.5-2 hectares), this would slow the flow and enhance the water value in the catchment, adding tremendous economic and social value while increasing the resilience of rural livelihoods. It is this type of distributed augmentation of storage capacity that Africa would need most (cf. Grey and Sadoff, 2006). Whereas the benefits will be significant, the negative downstream effects could be limited, but would require further study (see section 7 below). Remains the energy issue, namely how the water can be moved from the tanks into fields. A good candidate is the treadle pump, which has sufficient pumping capacity at relatively small pumping heads (1 l/s up to a total dynamic head of 5 m) (Figure 15). It would take some 28 hours of pumping to empty a 100 m3 tank. Many treadle pumps have been introduced in countries such as Kenya and Tanzania (45,000!), and also positive experiences are reported in Ghana, Malawi and Burkina Faso (Merrey and Sally, 2006). One of the problems observed by Merrey and Sally (2006) is that the price in Africa (US$ 80-200) is much higher than in Asia (US$ 25-35). It should be noted that treadle pumps are also ideal in situations where groundwater is available at depths up to 7 m, as in alluvial aquifers (Dahlin and Owen, 1998; Moyce et al., 2006; Love et al. 2010). If treadle pumps can save the crop of an enterprising farmer, it may generate sufficient income for the farmer to eventually purchase a diesel or solar powered pump. A nice prospect is that of a farmer cultivating his/her own biodiesel to fuel the pump that will secure the harvest!
Figure 15: Energy requirements for pumping water by four treadle pumps
(Source: Chigerwe et al., 2004)
0 1 2 3 4 5 6 7 8
0 2 4 6 8 10 Total Dynamic Head (m)
Discharge (m3/hr)
Super MM ITDG
Masvingo
Money Saver

27
Conclusion Rainfed agriculture is the world’s largest managed land use and will continue to constitute the major source of food for a growing world population. Nowhere is this more true than for sub-Saharan Africa. On-farm rainfed yields in savannahs (often denoted as dry lands) are low, often in the order of 0.5 – 2 t/ha, as a result of frequent dry spells, occurrence of drought, and low plant water uptake capacity related to soil fertility deficits, poor tillage, timing, weeding, and crop varieties etc. Water is thus not the only factor determining low yield levels in rainfed agriculture, even in “dry” areas. But, water is the only random factor, which creates uncertainty among farmers and inhibits farmers’ willingness to invest in improvements of other components, such as soil nutrient management (which buy fertilisers if the investment most likely is lost due to dry spells). Investing in water management such as supplemental irrigation in rainfed farming systems is therefore not only a way of increasing crop yields thanks to better water availability of the crop, but also a way of providing a conducive environment to invest in better soil nutrient management. For engineers, small scale water management may seem very simple, with few construction and design challenges. In reality this is not the case. The intricacy of runoff dynamics at small catchment scale, design of storage facilities, spill ways, techniques to seal and avoid evaporation, scheduling of supplemental irrigation (as one has to cater for rainfall occurrence) are challenging also at the small scale. Further, the catchment-wide impact (both hydrological and socio-economic) of the large-scale implementation of many small-scale and local soil and water conservation interventions is complex and an exciting field of study.

28
7. Off-farm impacts A very important question is: what is the off-farm impact of soil and water conservation measures? What happens downstream if we manage to “slow the water flow” in micro catchments? The hydrological implications at watershed level of up-scaling soil and water conservation measures, and rainwater harvesting, may be large. Box 3 gives a hypothetical calculation. Box 3: Watershed effects (Rockström et al., 1999) Let’s assume a watershed of 1000 ha (for simplicity assuming all land being cultivated) and an annual rainfall of 500 mm and grain yield levels of 1 t ha-1.
The transpirational water use efficiency lies in the order of 1000 m3 t-1 (1 kg/m3) or 100 mm t-1 ha-1, which then corresponds to 1 million m3 of water (1000 ha x 100 mm) on a watershed scale. This means that 20% of the total available rainfall (amounting to 5 million m3) in that watershed presently was used for grain production.
If yields are doubled through conservation tillage (by enhancing infiltration and reducing direct runoff), then some 200 mm, or 2 million m3, of water would be needed, which amounts to 40% of the rainfall.
Imagine a situation where all of the additional water required would come from previously non-productive evaporation, such as soil evaporation, then the downstream impact of the increased grain production would be zero. In practice this is unlikely to happen, as research has shown that in warm tropical regions it is not easy to reduce soil evaporation losses. However, to some extent the so-called vapour shift (the shift from non-productive evaporation to productive transpiration) is possible and will occur, which represents a gain in water use efficiency. For correctly assessing the impact it is crucial to distinguish productive transpiration T and non-productive evaporation E. Evaporation is driven by physical processes and includes evaporation from surfaces (interception) and evaporation from the soil (from the surface and through capillary rise from the sub-surface). Transpiration is the evaporation of water from plants through the stomata of the leaves and involves a biological process. The two fluxes differ not only in the pathways and driving mechanisms but also in their effects: the first flux is non-productive, while the second is productive, i.e. transpiration is required to produce biomass. While a near linear relationship exists between crop transpiration T and biomass production (and hence between T and the harvestable parts of crops), no such linear relationship exists between non-productive soil evaporation E and biomass production. This has to do with the fact that with increasing yields, crops will have more leaves that increasingly shade the soil surface and create micro-climatic effects that diminish energy gradients decreasing the evaporative demand of the topsoil. Hence non-productive evaporation tends to increase less than proportionally with increasing crop yields. This means that the relationship between on the one hand E + T and biomass production on the other follows a non-linear “diminishing returns” type of relationship (Figures 16 and 17). This relationship implies that at increased yield levels water is used more efficiently. This means that in general the most efficient strategy is to increase the yields of existing arable lands before extending the area under cultivation. If water is the scarcest
29
resource, while the objective is to increase crop production, then the best strategy may be to increase the production per unit area of land.
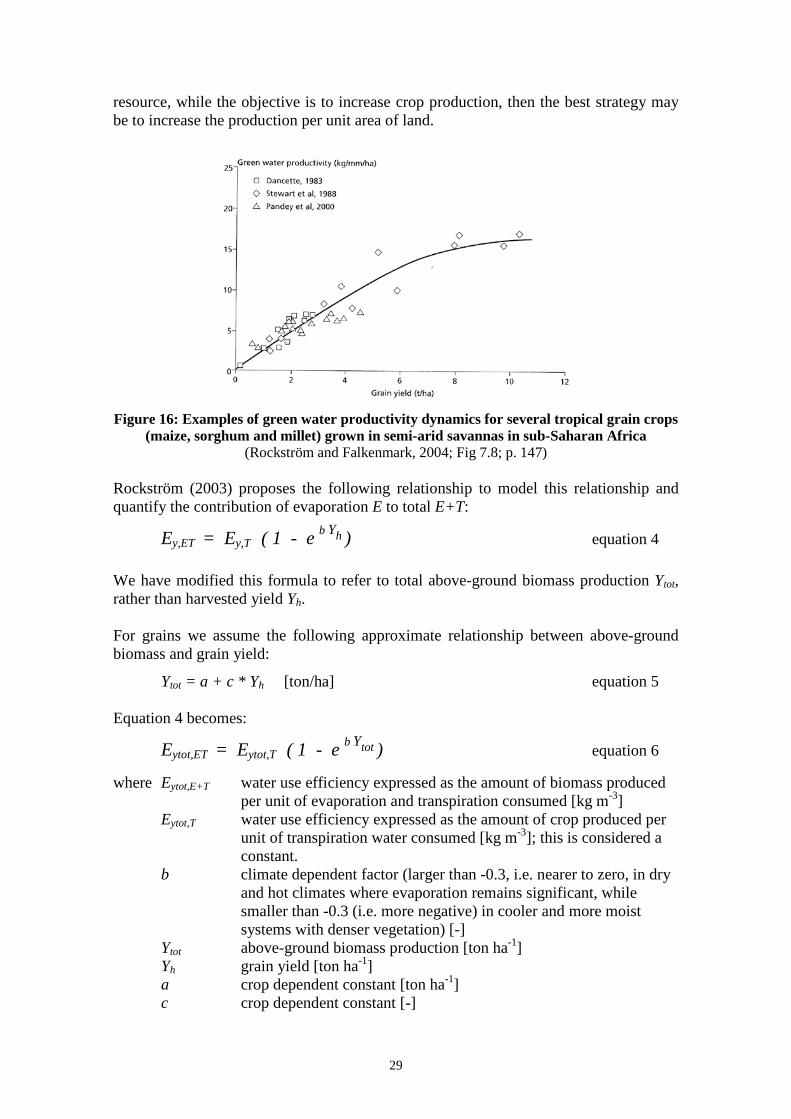
Figure 16: Examples of green water productivity dynamics for several tropical grain crops (maize, sorghum and millet) grown in semi-arid savannas in sub-Saharan Africa
(Rockström and Falkenmark, 2004; Fig 7.8; p. 147) Rockström (2003) proposes the following relationship to model this relationship and quantify the contribution of evaporation E to total E+T:
Ey,ET = Ey,T ( 1 - e b Yh ) equation 4 We have modified this formula to refer to total above-ground biomass production Ytot, rather than harvested yield Yh. For grains we assume the following approximate relationship between above-ground biomass and grain yield:
Ytot = a + c * Yh [ton/ha] equation 5 Equation 4 becomes:
Eytot,ET = Eytot,T ( 1 - e b Ytot ) equation 6
where Eytot,E+T water use efficiency expressed as the amount of biomass produced per unit of evaporation and transpiration consumed [kg m-3]
Eytot,T water use efficiency expressed as the amount of crop produced per unit of transpiration water consumed [kg m-3]; this is considered a constant.
b climate dependent factor (larger than -0.3, i.e. nearer to zero, in dry and hot climates where evaporation remains significant, while smaller than -0.3 (i.e. more negative) in cooler and more moist systems with denser vegetation) [-]
Ytot above-ground biomass production [ton ha-1] Yh grain yield [ton ha-1] a crop dependent constant [ton ha-1] c crop dependent constant [-]
30
With eq. 6 the evaporation term can be calculated. Eq. 6 also allows an estimate to be made of the impact of increased crop yields on downstream users, which is elaborated I Exercise 1. Exercise 1 Assume a maize crop in a savannah climate. The following values are given:
Eytot,T = 4 kg m-3 b = -0.1 a = 3 ton/ha c = 2
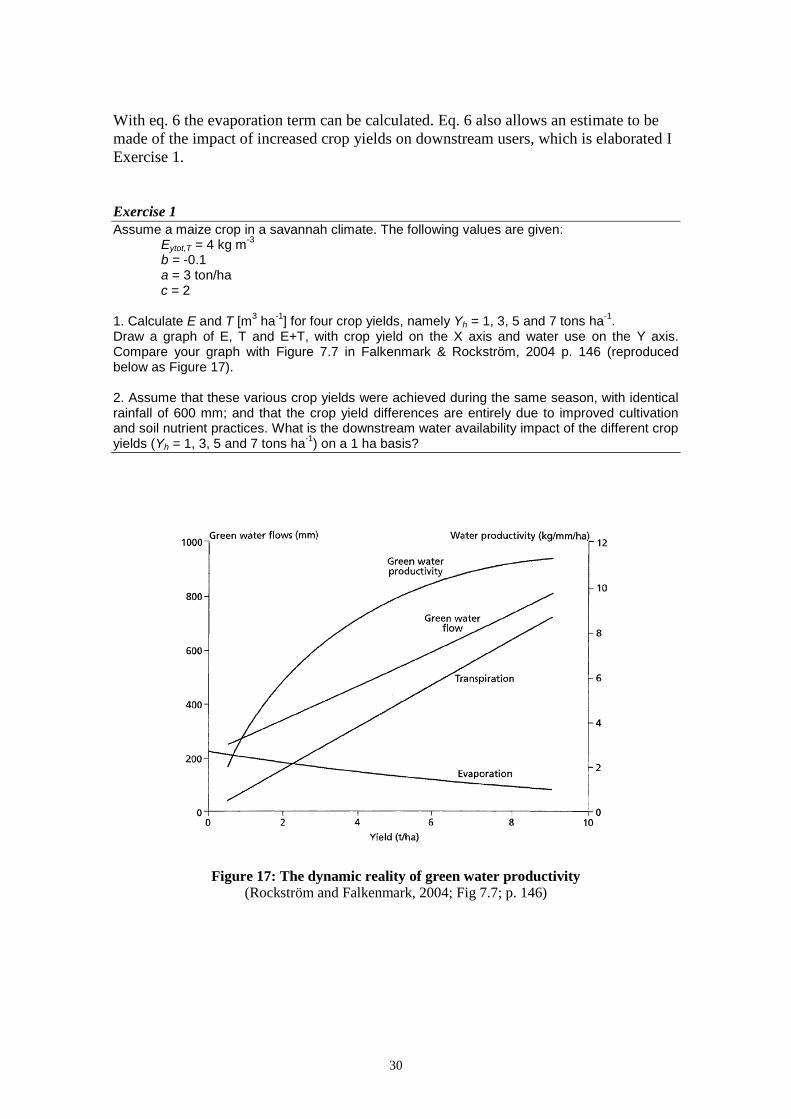
1. Calculate E and T [m3 ha-1] for four crop yields, namely Yh = 1, 3, 5 and 7 tons ha-1. Draw a graph of E, T and E+T, with crop yield on the X axis and water use on the Y axis. Compare your graph with Figure 7.7 in Falkenmark & Rockström, 2004 p. 146 (reproduced below as Figure 17). 2. Assume that these various crop yields were achieved during the same season, with identical rainfall of 600 mm; and that the crop yield differences are entirely due to improved cultivation and soil nutrient practices. What is the downstream water availability impact of the different crop yields (Yh = 1, 3, 5 and 7 tons ha-1) on a 1 ha basis?
Figure 17: The dynamic reality of green water productivity
(Rockström and Falkenmark, 2004; Fig 7.7; p. 146)

31
8. Watershed linkages Successful soil and water conservation measures in the upper parts of catchments, that result in increased and stabilized crop yields, do have impacts downstream. In general, it is likely that the total water availability downstream will decrease. However, what is also likely is that storm flows during the rainy season may decrease in intensity in the downstream areas, as well as silt fluxes. This is because more rainwater will infiltrate where it falls. It is therefore also likely that groundwater stocks will be less affected, or not at all, or perhaps even positively impacted. This depends on the dominant hydrological processes and is generally difficult to precisely predict and quantify. It is important to try to quantify these positive (increased crop yields, decreased storm flows, decreased erosion) and negative impacts (decrease of total water availability). And thus to have an improved understanding how the water users in a river catchment are linked through the water (and sediment) flow, and through other ways. (As an example, Figure 18 attempts to establish how upstream and downstream actors in the Blue Nile basin are linked.) In many river catchments socio-economic differences between upstream and downstream areas are large. These may have emerged due to differing biophysical and climatic conditions (e.g. Sivapalan et al., 2003; Brutsaert, 2005; Uhlenbrook, 2006; Rijsberman, 2006) but also because of upstream-downstream dependencies (Swallow et al., 2001; Sadoff and Grey, 2002; Van der Zaag, 2007). Despite the fact that different parts of a basin are linked due to (often poorly understood) fluxes of water and sediments, such links are not often institutionalised. This usually leads to sub-optimal management, namely in cases where certain interventions in upstream tributaries with positive externalities downstream are not economically feasible if merely the upstream context is considered. This may even lead to political tensions, especially if the different catchment areas are located in different provinces or countries. A way forward is to recognise and institutionalise upstream-downstream interdependencies that exist within river basins. This perspective takes as a starting point the environmental integrity of river basins, while acknowledging the existence of socio-economic and political differences. A basin-wide awareness of both premises may help to build hydrosolidarity among water users (Falkenmark and Folke, 2002) and thus ensure the peaceful management of the water resources. One way of institutionalising upstream-downstream linkages is through the “payment for environmental services”, whereby downstream water users (e.g. irrigators, hydropower companies) who depend on the water resources generated in upstream catchments compensate upstream land users (e.g. rainfed farmers) for the continuation of their sustainable land use and soil conservation practices (Jansson et al., 1999; Pagiola et al., 2005; Hermans and Hellegers, 2005; Grieg-Gran et al., 2006; Smith et al., 2006). Despite the promising theoretical basis of this concept, many uncertainties related to its applicability remain. First, our understanding of upstream hydrological processes and their impact on the hydrology of the whole basin is not yet sufficient to quantify with limited uncertainty the relationship between upstream land use management and the resulting water availability and sediment loads downstream. Global and regional climate change further complicates this relationship.

32
Figure 18: Linkages in the Blue Nile between Ethiopia and Sudan (with potential compensation flow in upstream direction indicated)
(Source: Van der Zaag et al. 2007: WOTRO IP research proposal “In Search of Sustainable Catchments and Basin-wide Solidarities; Transboundary Water Management of the Blue Nile River Basin”)
Second, the types of interventions that simultaneously improve livelihoods of upstream users and have positive hydrological impacts downstream are site specific and need to be carefully identified. Third, it is often not well understood why farmers fail to adopt certain improved cultivation practices and technologies that would seem to be beneficial to them. Complex linkages and feedbacks with other aspects of the farming system, gender roles and ownership structures, and wider socio-economic issues and markets need to be considered. Fourth, the criteria to decide how much downstream water users would have to compensate their upstream counterparts in order to trigger their cooperation require clarification. This not only involves questions of valuation (Brouwer, 2000; De Groot et al., 2002), but also whether water is considered a public or private good, the role of governments in its management, and in the case of transboundary basins, how this

33
relates to treaties and conventions. Finally, the institutions at the (sub-)basin level may need to be equipped with completely new arrangements and systems that allow such compensation mechanisms to be established, sustained and monitored. The value of water It is important to decide, at a catchment scale, which strategy would be best: to increase the use of blue water downstream, or to increase the use of green water upstream. One tool to assist in the decision process would be to express all uses in terms of marginal values of water; i.e. the added benefit of one unit of additional water. The strategy that attains the highest marginal value of water would then represent the best strategy from a narrowly economistic point of view. This could also open the door to formalise upstream-downstream linkages, whereby soil and water conservation practices and other protective land husbandry measures by upstream “green water” farmers are stimulated with subsidies that are funded by downstream users of blue water. We do not know what the marginal value of blue water downstream is. We can, however, estimate the value of the water that was consumed and used upstream (for crop production (T) and non-productive evaporation (E)) and thus not available downstream. We could then assess at what price downstream users would be willing to forego some water benefits (namely because of a decrease in total water availability, even though the remaining water may be more valuable!).
Figure 19: Fluctuations of the world market price of cereals, 1990-2015 (Source: IMF Primary Commodity Prices May 2015;
http://www.imf.org/external/np/res/commod/index.asp)
0
100
200
300
400
500
600
700
800
900
1000
1990 1992 1994 1996 1998 2000 2002 2004 2006 2008 2010 2012 2014 2016
grai
n pr
ice
(US$
/ton)
Maize (corn), U.S. No.2 Yellow, FOB Gulf of Mexico, U.S. price (US$/ton)
Rice, 5 percent broken milled white rice, Thailand nominal price quote (US$/ton)
Wheat, No.1 Hard Red Winter, ordinary protein, FOB Gulf of Mexico (US$/ton)

34
If we focus our analysis of the production of cereals such as Maize, then we can find information of world market prices in the “Food Outlook” which the FAO publishes quarterly on its website (see http://www.fao.org/es/giews/english/fo/index.htm), or by the IMF (http://www.imf.org/external/np/res/commod/index.asp). Figure 19 shows that the world market prices for cereals have undergone large fluctuations during the past few years. Exercise 2 Assume a price of maize that you find realistic, and justify your choice. Then, answer the following question: How does the marginal value of rainfall water change as a result of increasing yields? Use Eq. 6 from section 7 above and data from Exercise 1.

35
9. Additional strategies to drought-proof livelihoods: on nutrients, insurance schemes and markets As observed above, once the water availability is significantly enhanced and farmers are more confident that water will not be a constraining factor in crop production, they may afford to invest in chemical fertilizers. The combined effect of improved water and nutrient management can be spectacular and is likely to lead to doubling or even tripling of crop yields (Rockström et al., 2001; Falkenmark and Rockström, 2004; Twomlow et al., 2008). Figure 20 demonstrates the high probability of positive returns on low fertilizer applications in a semi-arid area of Zimbabwe.
Figure 20: The probability of exceeding given rates of return on ammonium nitrate fertilizer investment on maize production at 17 and 52 kg N ha-1. Masvingo, Zimbabwe. The figure shows that low application rates have high returns and only fail in approx.
10% of the seasons. (Source: Cooper et al., 2008; Fig 7, p. 32) This notwithstanding, Kelly (2005) reports large variations in benefit-cost ratios of fertilizer use and Vlek (2005) found that in Uganda only for those farmers who cultivated the most productive soils was fertilizer use economic, while those cultivating marginal soils could better not invest in fertilizers. One possible explanation of these disappointing findings is that the farmers studied by Kelly and Vlek did not all have sufficient control over their water resource. Another explanation is that maize prices are often kept artificially low, whilst fertilizer prices have increased since subsidies were removed in the 1980s and 1990s and energy prices have consistently increased. As a result the Value/Cost Ratio (VCR) is too small. According to Kelly (2005) VRCs should be at least two before a farmer will consider fertilizer use, while in high-risk production environments the minimum VCR for adoption may be 3 or 4. This points to a straightforward conclusion: re-introduce subsidies on fertilizers (Vlek, 2005; Love et al., 2006), possibly instead of investing billions in large scale irrigation development. If combined with improved water security the benefits will be immediate. For making farming systems more resilient to rainfall variability we have argued that increased soil moisture storage coupled with increased root development would be the first line of attack. A second intervention should focus on runoff harvesting and storage. Farmers build other buffers to safeguard themselves against extreme events, such as building up the cattle herd that can be used in times of hardships. These buffers are

36
important since they provide a more secure context that enables the farming household to survive. The question is whether the existing buffering capacity is sufficient or that governments should consider introducing innovative crop insurance schemes. The World Bank has suggested weather index insurance that pay out farmers on the basis of objectively verifiable climatic parameters, the cover of which may be automatic for all communal farmers or is paid through a special tax on some key input (e.g. seeds) (Hess and Syroka, 2005; World Bank, 2005). Farmers also face other uncertainty and risk factors that are unrelated to climate but rather to imperfect markets and to government policies that may not always be consistent and predictable. As to market failures, the cost of transportation of goods in Africa are much higher than in other continents due to wanting road infrastructure, but access to reliable information has improved markedly in the last decade due to the cell phone revolution.

37
10. Conclusion: slowing the water flow and institutionalising upstream-downstream linkages
Farmers are not only the food makers of this world but also the watershed managers and the custodians of the partitioning points of rainfall in the hydrological cycle, directly influencing how much of the rainfall water will infiltrate into the unsaturated zone, how much will be consumed as crop transpiration, how much will evaporate unproductively, how much will recharge aquifers and how much will runoff superficially at what speed. After reviewing some recent experiences, this lecture note concludes that through seemingly modest technological innovations rainfed farmers can achieve a greater control over the volatile and variable water resource. This is a precondition for them to invest in the most rewarding production factor of all: crop fertility. The innovations reviewed included tillage and terracing, as well as runoff harvesting. By combining rainfall and runoff farmers are questioning the sharp distinction we engineers and academics often make between rainfed and irrigated agriculture (Rijsberman 2006; Falkenmark, 2007; Van der Zaag, 2010). If farmers have a major role to play in achieving the millennium development goals related to poverty and hunger, then governments should provide a conducive environment and adequate boundary conditions. Governments can play an active and positive role in assisting farmers to make their farming systems more productive and more resilient against climate shocks. This can be done by recognising that farmers play a major role in watershed and catchment management, by making it attractive for farmers to invest in better land management and in small storage reservoirs, by ensuring that farmers receive a fair price for staple crops, by re-introducing subsidies on fertilizers (instead of investing in large scale irrigation development), and possibly also by introducing innovative crop insurance schemes. Furthermore, we have argued that water users in catchment area are linked through the water flow, yet this link is not often institutionalised. This may lead to sub-optimal river management, as certain interventions in upstream tributaries with positive impacts downstream may not be economically feasible if considered in isolation. A solution is to recognise and institutionalise upstream-downstream interdependencies, whereby for example those situated downstream reward upstream farmers for their sustainable land use and soil conservation practices.

38
Annex: Soil moisture Soil consists of soil particles (mineral and organic), water and air. Plants need all three of them as a medium for growth. Water in the soil is also called soil moisture. The roots of most plants only develop in the unsaturated zone. The roots can extract water from the soil through suction (positive pressure) against the water retaining (capillary) forces of the soil (a negative pressure). Only when the negative pressure becomes too high (the soil becomes drier), and the plant cannot extract any more water from the soil, the plant will suffer from water stress. If, on the other hand, the root zone is completely saturated with water, the plant may suffer from water logging. The soil may be seen as a water storage reservoir, from which plants can draw water. The storage capacity depends strongly on the soil texture, the size and distribution of pores and the total soil depth penetrated by the plant roots. The purpose of soil and water conservation measures, as well as irrigation, is to keep sufficient water in this soil storage reservoir. • Water Content (θv) is the volume of water in the soil sample, expressed as a
percentage of the volume of the whole soil sample [vol%]. • Porosity (n) is the voids (pores) in a soil sample, expressed as a percentage of the
total volume of the soil sample [vol%]. A soil is saturated when all pores in the soil are filled with water: θv equals n. A soil is unsaturated when part of the pores of the soil is filled with water and part is filled with air. Water is retained in the soil against gravity through capillary forces (negative pressure or suction). Suction is expressed as a pressure head h (cm); with h ranging from -1 cm (saturation) to -10,000,000 cm (oven dry soil). Suction is usually expressed as pF, with pF = log |h|. Under field conditions, pF values range between 0 and 5. A soil profile normally shows an unsaturated and a saturated zone. The top of the saturated zone is called the groundwater table, or phreatic level. Here the pressure of the water is equal to the atmospheric pressure. Percolation is the downward flow of groundwater to the saturated zone. Above the groundwater level the soil is normally not saturated. After heavy rainfall, the whole soil profile may be saturated, but water will subsequently flow down to the groundwater table. Percolation is caused by gravity [mm/d]. Above the phreatic water table, in the unsaturated zone, water is retained in the pores by capillary forces: the water is under negative pressure. Smaller pores retain water more easily than larger pores; actually some water may flow upwards from the saturated zone into the unsaturated zone; this is called capillary rise [mm/d]. The downward flow of water from the unsaturated zone (percolation) stops, when the gravitational forces are in equilibrium with the water retaining (capillary) forces. However, there is still water in the unsaturated zone: the water content of the soil at this point is the Field Capacity (FC, θfc). This is an important notion, because at this water content there is no water loss towards the groundwater, while there is enough water available for the plant to take up from the soil. The θfc depends on the soil texture, and is expressed in vol%. Normally, it is assumed that at field capacity, pF = 2 (h = -100 cm . -10 kPa = 0.10 bar).
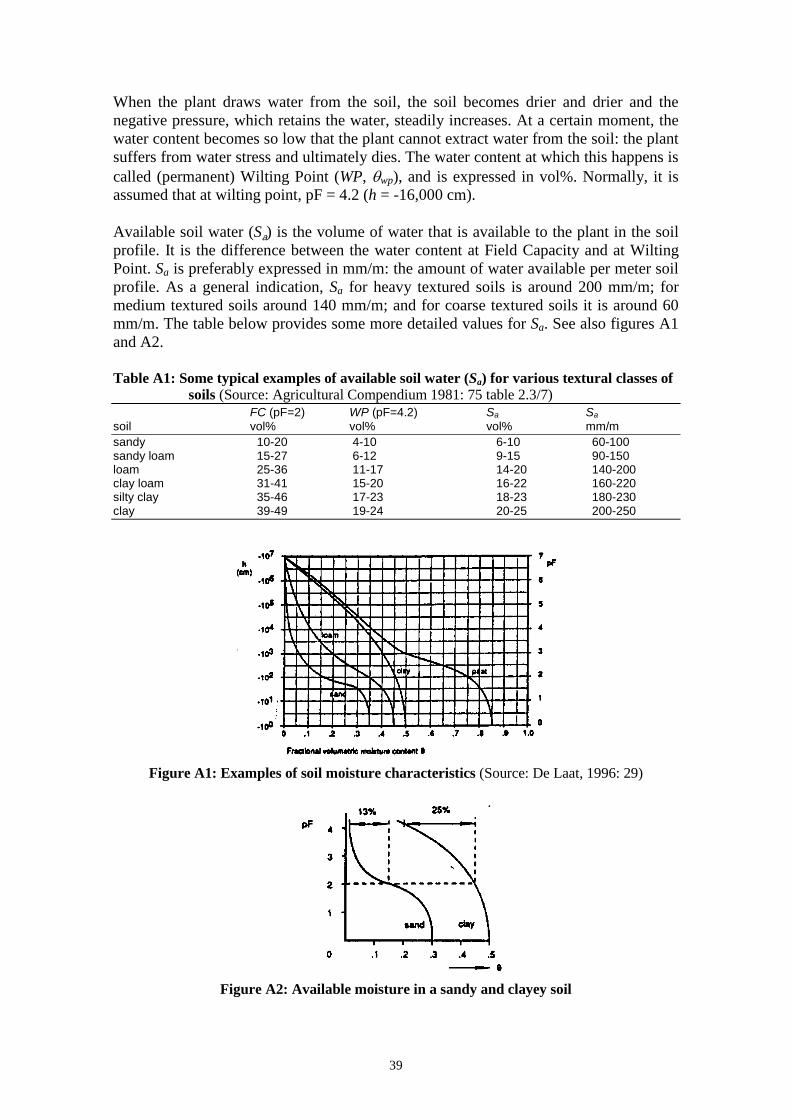
39
When the plant draws water from the soil, the soil becomes drier and drier and the negative pressure, which retains the water, steadily increases. At a certain moment, the water content becomes so low that the plant cannot extract water from the soil: the plant suffers from water stress and ultimately dies. The water content at which this happens is called (permanent) Wilting Point (WP, θwp), and is expressed in vol%. Normally, it is assumed that at wilting point, pF = 4.2 (h = -16,000 cm). Available soil water (Sa) is the volume of water that is available to the plant in the soil profile. It is the difference between the water content at Field Capacity and at Wilting Point. Sa is preferably expressed in mm/m: the amount of water available per meter soil profile. As a general indication, Sa for heavy textured soils is around 200 mm/m; for medium textured soils around 140 mm/m; and for coarse textured soils it is around 60 mm/m. The table below provides some more detailed values for Sa. See also figures A1 and A2. Table A1: Some typical examples of available soil water (Sa) for various textural classes of
soils (Source: Agricultural Compendium 1981: 75 table 2.3/7) FC (pF=2) WP (pF=4.2) Sa Sa soil vol% vol% vol% mm/m sandy 10-20 4-10 6-10 60-100 sandy loam 15-27 6-12 9-15 90-150 loam 25-36 11-17 14-20 140-200 clay loam 31-41 15-20 16-22 160-220 silty clay 35-46 17-23 18-23 180-230 clay 39-49 19-24 20-25 200-250
Figure A1: Examples of soil moisture characteristics (Source: De Laat, 1996: 29)
Figure A2: Available moisture in a sandy and clayey soil

40
References Agricultural compendium for rural development in the tropics and subtropics. Elsevier,
Amsterdam, 1981 Awulachew, S. B.; Merrey, D. J.; Kamara, A. B.; Van Koppen, B.; Penning de Vries, F.;
Boelee, E.; Makombe, G. 2005. Experiences and opportunities for promoting small–scale/micro irrigation and rainwater harvesting for food security in Ethiopia. IWMI Working paper 98. International Water Management Institute, Colombo
Boserup, E., 1965. The conditions of agricultural growth: the economics of agrarian change under population pressure. Aldine, Chicago.
Brouwer R., 2000. Environmental value transfer: state of the art and future prospects. Ecological Economics 32(1), pp. 137-152.
Brutsaert W., 2005. Hydrology – An introduction. Cambridge University Press, Cambridge; 605 pp.
Chigerwe, J., N. Manjengwa, P. van der Zaag, W. Zhakata and J. Rockström, 2004. Low head drip irrigation kits and treadle pumps for smallholder farmers in Zimbabwe: a technical evaluation based on laboratory tests. Physics and Chemistry of the Earth 29: 1049-1059.
Conway, D., 2005. From headwater tributaries to international river: observing and adapting to climate variability and change in the Nile basin. Global Environmental Change 15, 99-114.
Cooper, P.J.M., J. Dimes, K.P.C. Rao, B. Shapiro, B. Shiferaw, S. Twomlow. 2008. Coping better with current climatic variability in the rain-fed farming systems of sub-Saharan Africa: An essential first step in adapting to future climate change? Agriculture, Ecosystems and Environment 126: 24-35.
Dahlin, T., and R.J.D.S. Owen, 1998. Geophysical investigation of alluvial aquifers in Zimbabwe. In: Proceedings of the 4th EEGS Meeting, Barcelona, Spain.
De Groot R.S., Wilson M.A., Boumans R.M.J., 2002. A typology for the classification, description and valuation of ecosystem functions, goods and services. Ecological Economics 41(3); pp. 393-408.
De Laat, P., 1996. Soil-water-plant relations. Lecture notes. IHE, Delft Droogers, P., D. Seckler and I. Makin, 2001. Estimating the potential of rain-fed agriculture.
IWMI Working Paper 20. International Water Management Institute, Colombo. Enfors, E., and L. Gordon, 2007. Analyzing resilience in dryland agro-ecosystems; a case study
of Makanya catchment in Tanzania over the past 50 years. Accepted in Land Degradation and Development.
Falkenmark, M., 1995, Coping with water scarcity under rapid population growth. Paper presented at the Conference of SADC Water Ministers. Pretoria, 23-24 November 1995.
Falkenmark, M., 2007. Shift in thinking to address the 21st century hunger gap; moving focus from blue to green water management. Water Resources Management 21: 3-18.
Falkenmark, M., and C. Folke, 2002. The ethics of socio-ecohydrological catchment management: towards hydrosolidarity. Hydrology and Earth System Sciences 6(1): 1-9.
Falkenmark, M., and J. Rockström, 2004. Balancing water for humans and nature; the new approach in ecohydrology. Earthscan, London; 247 pp.
FAO, 1977, Crop water requirements. Irrigation and Drainage Paper 24 (revised). FAO, Rome FAO, 1979, Yield response to water. Irrigation and Drainage Paper 33. FAO, Rome FAO, 2006. The state of food insecurity in the world 2006. FAO, Rome. FAO, 2008: The State of Food Insecurity in the World 2008 - High food prices and food
security – threats and opportunities. FAO, Rome; 56pp. Grey, D., and C. Sadoff, 2006. Water for growth and development; a theme document of the 4th
World Water Forum. URL: http://www.worldwaterforum4.org.mx/ Grieg-Gran M., Noel S., Porras I., 2006. Lessons learned from payments from environmental
services. Green Water Credits report no. 2. ISRIC, Wageningen.

41
Hermans L., Hellegers P., 2005. A “new economy” for water for food and ecosystems; synthesis report of E-forum results. FAO/Netherlands International Conference Water for Food and Ecosystems, The Hague 13 January. URL: http://www.fao.org/ag/wfe2005/.
Hess, U., and J. Syroka, 2005. Weather-based insurance in southern Africa; the case of Malawi. Agriculture and Rural Development Discussion Paper 13. World Bank, Washington, DC.
IAC, 2004. Realizing the promise and potential of African agriculture. InterAcademy Council, Amsterdam.
Jansson A., Folke C., Rockström J., Gordon L., 1999. Linking freshwater flows and ecosystem services appropriated by people: The case of the Baltic Sea drainage basin. Ecosystems 2 (4), 351-366.
Kelly, V., 2005. Farmers demand for fertilizer in Sub-Saharan Africa. Unpublished paper. Dept. of Agricultural Economics. Michigan State University, East Lansing, MI.
Kijne, J., 1999. Water for food for Sub-Saharan Africa. Background paper for the FAO internet-email conference on “Water for Food in sub-Saharan Africa”, FAO, Rome. http://www.fao.org/ag/agl/aglw/webpub/watfood.htm
Loomis, R.S., and D.J. Connor, 1992. Crop ecology: productivity and management in agricultural systems. Cambridge University Press, Cambridge; 538pp.
Love, D., S. Twomlow, W. Mupangwa, P. van der Zaag, B. Gumbo, 2006. Implementing the millennium development food security goals – Challenges of the southern African context. Physics and Chemistry of the Earth 31 (15-16): 731-737.
Love, D., P. van der Zaag. S. Uhlenbrook and R. Owen, 2010. A water balance modelling approach to optimising the use of water resources in ephemeral sand rivers. River Research and Applications [doi:10.1002/rra.1408]
Maisiri, N., A. Senzanje, J. Rockström and S.J. Twomlow, 2005. On farm evaluation of the effect of low cost drip irrigation on water and crop productivity compared to conventional surface irrigation system. Physics and Chemistry of the Earth 30, 783-791.
Merrey. D.J. and H. Sally, 2006. Micro-Agricultural Water Management Technologies For Food Security In Southern Africa: Part Of The Solution Or A Red Herring? Invited paper presented at the 7th WaterNet/WARFSA/GWP-SA Symposium on “Mainstreaming IWRM in the Development Process”. Lilongwe, 1-3 November.
Morris, M., V.A. Kelly, R.J. Kopicki, and D. Byerlee, 2008. Fertilizer Use in African Agriculture - Lessons Learned and Good Practice Guidelines. The World Bank, Washington DC.; 144pp
Motsi, K.E., E. Chuma and B.B. Mukamuri, 2004. Rainwater harvesting for sustainable agriculture in communal lands of Zimbabwe. Physics and Chemistry of the Earth, 29, 1069-1073.
Moyce, W., P. Mangeya, D. Love and R. Owen, 2006. Alluvial aquifers in the Mzingwane Catchment: their distribution, properties, current usage and potential expansion and risk. Physics and Chemistry of the Earth 31, 988-994.
Moyo, R., D. Love, M. Mul, W. Mupangwa and S. Twomlow, 2006. Impact and sustainability of low-head drip irrigation kits, in the semi-arid Gwanda and Beitbridge Districts, Mzingwane Catchment, Limpopo Basin, Zimbabwe. Physics and Chemistry of the Earth 31, 885-892.
Mupangwa, W., D. Love and S. Twomlow, 2006. Soil-water conservation and rainwater harvesting strategies in the semi-arid Mzingwane Catchment, Limpopo Basin, Zimbabwe. Physics and Chemistry of the Earth 31 (15-16), pp. 893-900.
NEPAD, 2002. Comprehensive Africa Agriculture Development Programme. New Partnership for Africa's Development (NEPAD). FAO, Rome.
Pagiola S., Arcenas A., Platais G., 2005. Can payments for environmental services help reduce poverty? An exploration of the issues and the evidence to date from Latin America. World Development 33 (2), 237-253.
Pazvakawambwa, G., and P. van der Zaag, 2000. The value of irrigation water in Nyanyadzi smallholder irrigation scheme, Zimbabwe. Proceedings of the 1st WARFSA/WaterNet Symposium 'Sustainable Use of Water Resources'. Maputo, 1-2 November.
Polak, P., 2005. The big potential of small farms. Scientific American September pp. 62-69.

42
Reij, C., I. Scoones and C.Toulmin, 1996. Sustaining the soil, indigenous soil and water conservation in Africa. Earthscan, London.
Reij, C., G. Tappan and A. Belemvire, 2005. Changing land management practices and vegetation on the Central Plateau of Burkina Faso (1968-2002). Journal of Arid Environments 63 (3), pp. 642-659.
Rijsberman, F., 2004. Sanitation and access to clean water. Chapter 9 in B. Lomborg (ed.), Global Crises, Global Solutions. Cambridge University Press, Cambridge; pp. 498-527.
Rijsberman, F.R., 2006. Water scarcity: fact or fiction? Agricultural Water Management 80: 5-22.
Rockström, J., 2000, Water resources management in smallholder farms in Eastern and Southern Africa: an overview. Physics and Chemistry of the Earth (B) 25(3): 275-283
Rockström, J., 2003, Water for food and nature in drought-prone tropics: vapour shift in rain-fed agriculture. Phil. Trans. R. Soc. Lond. B 358,1997-2009
Rockström, J., A. Kitalyi and P. Mwalley, 1999, Conservation tillage and integrated land management: field experiences and extension approaches. Paper presented at the ATNESA/SANAT International Workshop on Empowering Farmers through Animal Traction into the 21st Century. South Africa, September 20-24
Rockström, J., and M. Falkenmark, 2000. Semi-arid crop production from a hydrological perspective – Gap between potential and actual yields. Critical Rev. Plant Sc., 19 (4): 319 –346.
Rockström, J., and M. Falkenmark, 2004, Balancing water for humans and nature; the new approach in ecohydrology. Earthscan, London; 247 pp.
Rockström, J., J. Barron and P. Fox, 2001, Water productivity in rainfed agriculture: challenges and opportunities for smallholder farmers in drought-prone tropical agro-ecosystems. IWMI Workshop on Water Productivity in Agriculture. Colombo, November 12-14
Sadoff C.W., Grey D., 2002. Beyond the river: the benefits of cooperation on international rivers. Water Policy 4: 389-403.
Savenije, H.H.G., 1998. How do we feed a growing world population in a situation of water scarcity?. 8th Stockholm Symposium “Water - The Key to Socio-economic Development and Quality of Life”. SIWI, Stockholm, pp.49-58.
Savenije, H.H.G., 1999. The role of Green Water in food production in Sub-Saharan Africa. Background paper for the FAO internet-email conference on “Water for Food in sub-Saharan Africa. FAO, Rome. http://www.fao.org/ag/agl/aglw/webpub/greenwat.htm
Schouwenaars, J.M., 1988. Rainfall irregularity and sowing strategies in southern Mozambique. Agricultural Water Management 13, 49-64.
Sivapalan M., Takeuchi K., Franks S.W., Gupta V.K., Karambiri H., Lakshmi V., Liang X.X., McDonnell J.J., Mendiondo E.M., O’Connell P.E., Oki T., Pomeroy J.W., Schertzer D., Uhlenbrook S., Zehe E., 2003: IAHS Decade on Predictions in Ungauged Basins (PUB), 2003-2012: Shaping an Exciting Future for the Hydrological Sciences. Hydrological Sciences Journal, 48, 6, 857-880.
Smith M, De Groot D., Perrot-Maître D., Bergkamp G. (eds.), 2006. Pay – Establishing payments for watershed services. IUCN, Gland; 109 pp.
Swallow B.M., Garrity D.P., Van Noordwijlk M., 2001. The effects of scales, flows and filters on property rights and collective action in watershed management. Water Policy 3: 457-474.
Temesgen Leye, M., 2007. Conservation tillage systems and water productivity implications for smallholder farmers in semi-arid Ethiopia. PhD thesis. UNESCO-IHE Institute for Water Education, Delft and Delft University of Technology, Delft.
Tiffin, M., M. Mortimer, and F. Gichuki, 1994. More people less erosion – environmental recovery in Kenya. Kenya: Acts Press, Nairobi.
Twomlow, S.J., and P.M.C. Bruneau, 2000. The influence of tillage on semi-arid soil-water regimes in Zimbabwe. Geoderma 95, 33-51.
Twomlow, S.J., D. Rohrbach, J. Dimes et al., 2008. Micro-dosing as a pathway to Africa’s Green Revolution: evidence from broad-scale on-farm trials. Nutr. Cycl. Agroecosyst DOI: 10.1007/s10705-008-9200-4

43
Uhlenbrook S., 2006: Catchment hydrology — a science in which all processes are preferential. Hydrological Processes, HPToday, 20, 16, 3581–3585, DOI: 10.1002/hyp.6564.
UN, 2011. Millennium Development Goals Report 2011. United Nations, New York. Van der Zaag, P., 2003. The bench terrace between invention and intervention. In: A. Bolding,
J. Mutimba and P. van der Zaag (eds.), Agricultural intervention in Zimbabwe; new perspectives on extension. University of Zimbabwe Publications, Harare; pp. 184-205.
Van der Zaag, P., 2007. Asymmetry and equity in water resources management; critical governance issues for Southern Africa. Water Resources Management 21 (12): 1993-2004.
Van der Zaag, P., 2010. Viewpoint – Water variability, soil nutrient heterogeneity and market volatility – Why sub-Saharan Africa’s Green Revolution will be location-specific and knowledge-intensive. Water Alternatives 3(1): 154-160. [Available online http://www.water-alternatives.org]
Vishnudas, S., 2006. Technology development for a sustainable rural habitat in Kerala with special reference to watershed management. PhD dissertation. Delft University of Technology, Delft.
Vlek, P.L.G., 2005. Nothing begets nothing; the creeping disaster of land degradation. Intersections No. 1. Institute for environment and Human Security, UNU-EHS, Bonn.
World Bank, 2005. Managing agricultural production risk; innovations in developing countries. Report no. 32727-GLB. World Bank, Washington DC.
Yilma, T., Berg, E. and Berger, T., 2004. Prospects and challenges of Agricultural Technology-Market Linkage under Liberalisation in Ghana: Evidence from micro-data. African Development and Poverty Reduction: The Micro-Linkage. Forum Paper 2004.