Embed Size (px)
Citation preview
Software Pipeline for RFI Excision from Pulsar DataHasanain Alsabonchi, Dr. Vishal Gajjar, Dr. Dan Werthimer
Santa Monica College, UC Berkeley Space Science Laboratory
AbstractThe work reported here is on a Python-based pipeline to remove radio frequency interference (RFI) from pulsar data. The program is intended to read the data recorded from a radio telescope and then to calculate various
statistics. A predefined threshold is applied (median ±2 × STD for time-domain and median ± 2 × MAD for frequency domain) to identify outliers in the data, to be then replaced with Gaussian noise from overall
measured statistics. Such replacement helps us improve the signal-to-noise ratio of the pulsar profiles.
Introduction
With this project the UC Berkeley team is aiming to observe the Crab
pulsar using the Leuschner radio telescope (Figure1) for at least a year in the
frequency range 1.25-2.5 GHz. The Crab pulsar is known to occasionally emit
giant pulses whose flux density is hypothesized to be a power law distribution.
In order to detect these giant pulses, one must remove interference from the
radio frequency data. Radio Frequency Interference (RFI) comes from signals
of man-made artifacts. These can occur at the same frequency as the
astronomical signals, which is a daunting task to truly differentiate them. In his
project a Python pipeline (Figure 2) was developed to automatically remove
the RFI from the data.
Methods
Results
Conclusion
References
Acknowledgements
The ASSURE program was funded by National Science Foundation under grant AGS-1461277.
I would like to thank Siuling Pau, Mohammad Shams,Guillaume Shippee, Chenhui Niu,
Deepthi Gorthi, and the Assure program for their valuable support in overcoming the many
obstacles I encountered in the making of this project and this poster.
Figure 1: Leuschner observatory
Figure 4: Algorithm to remove RFI
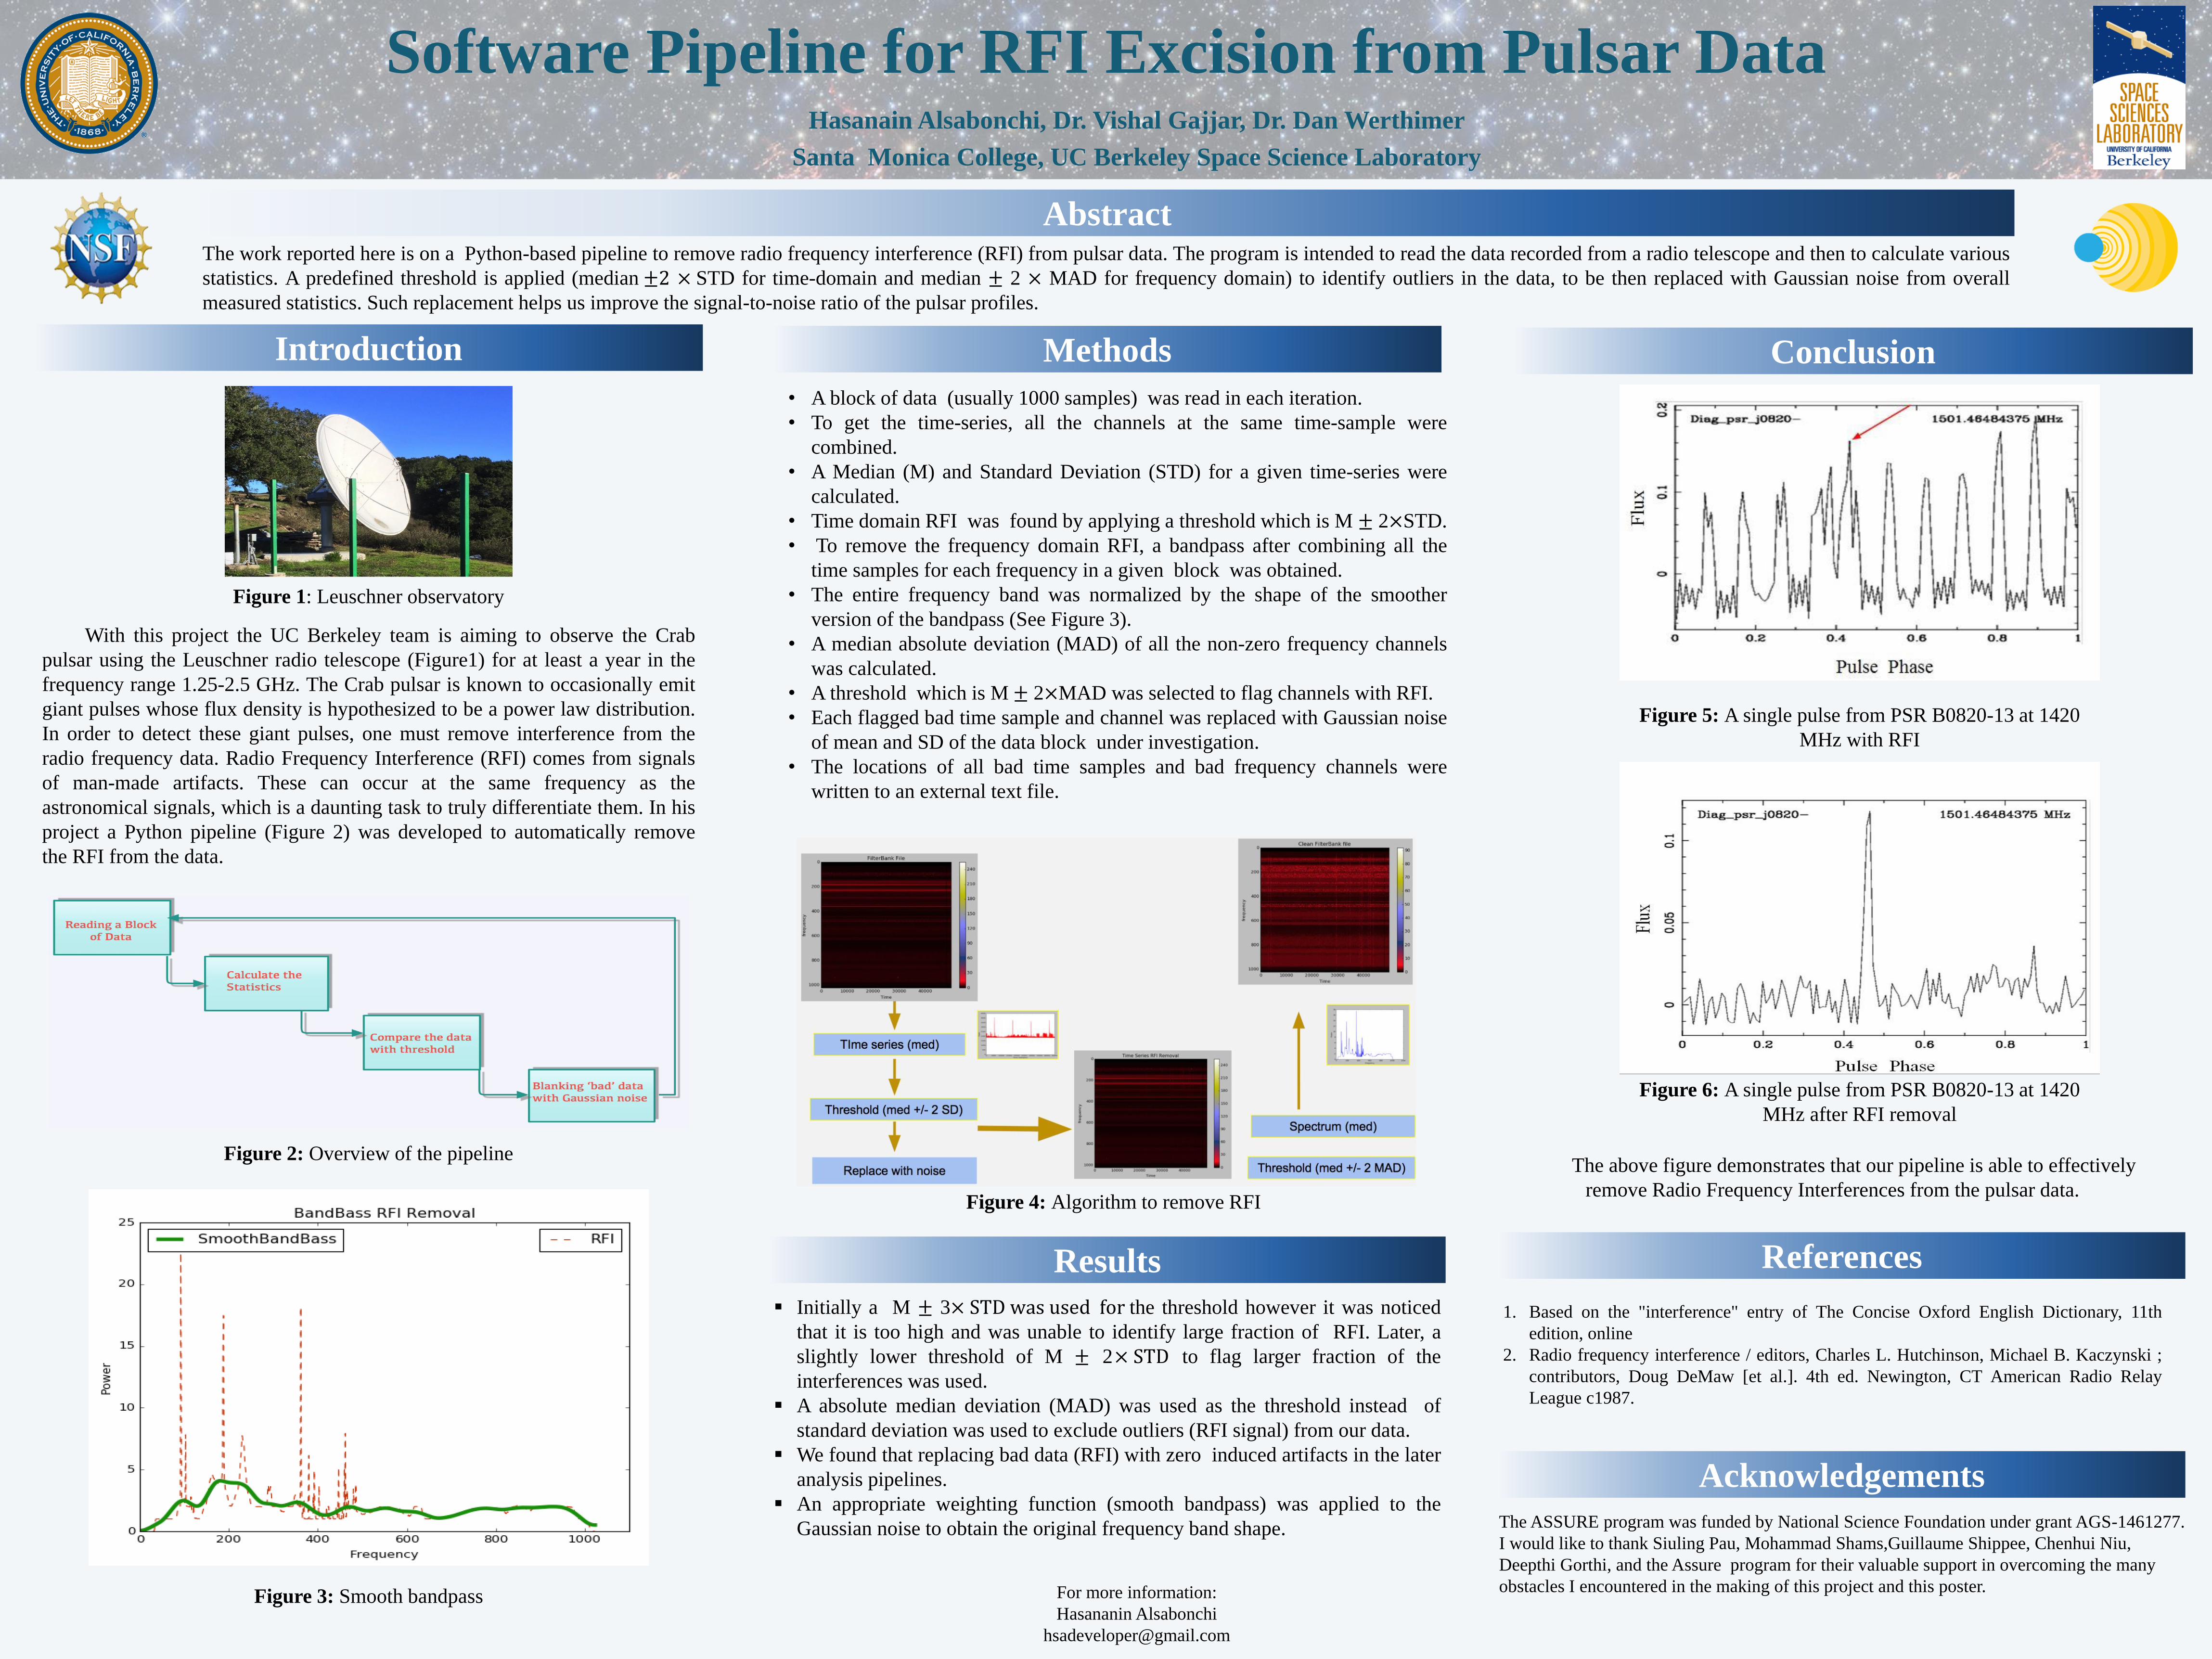
Figure 5: A single pulse from PSR B0820-13 at 1420
MHz with RFI
Figure 6: A single pulse from PSR B0820-13 at 1420
MHz after RFI removal
• A block of data (usually 1000 samples) was read in each iteration.
• To get the time-series, all the channels at the same time-sample were
combined.
• A Median (M) and Standard Deviation (STD) for a given time-series were
calculated.
• Time domain RFI was found by applying a threshold which is M ± 2×STD.
• To remove the frequency domain RFI, a bandpass after combining all the
time samples for each frequency in a given block was obtained.
• The entire frequency band was normalized by the shape of the smoother
version of the bandpass (See Figure 3).
• A median absolute deviation (MAD) of all the non-zero frequency channels
was calculated.
• A threshold which is M ± 2×MAD was selected to flag channels with RFI.
• Each flagged bad time sample and channel was replaced with Gaussian noise
of mean and SD of the data block under investigation.
• The locations of all bad time samples and bad frequency channels were
written to an external text file.
▪ Initially a M ± 3× STD was used for the threshold however it was noticed
that it is too high and was unable to identify large fraction of RFI. Later, a
slightly lower threshold of M ± 2× STD to flag larger fraction of the
interferences was used.
▪ A absolute median deviation (MAD) was used as the threshold instead of
standard deviation was used to exclude outliers (RFI signal) from our data.
▪ We found that replacing bad data (RFI) with zero induced artifacts in the later
analysis pipelines.
▪ An appropriate weighting function (smooth bandpass) was applied to the
Gaussian noise to obtain the original frequency band shape.
1. Based on the "interference" entry of The Concise Oxford English Dictionary, 11th
edition, online
2. Radio frequency interference / editors, Charles L. Hutchinson, Michael B. Kaczynski ;
contributors, Doug DeMaw [et al.]. 4th ed. Newington, CT American Radio Relay
League c1987.
Figure 3: Smooth bandpass
Figure 2: Overview of the pipeline
For more information:
Hasananin Alsabonchi
The above figure demonstrates that our pipeline is able to effectively
remove Radio Frequency Interferences from the pulsar data.