Embed Size (px)
Citation preview

Soft X-ray microscopy with a cryo scanning transmissionX-ray microscope: II. Tomography
Y. WANG 1, C. JACOBSEN, J. MASER1 & A. OSANNA
Department of Physics and Astronomy, State University of New York at Stony Brook, Stony Brook,
NY 11794-3800, U.S.A.
Key words. frozen hydrated, soft X-ray microscopy, synchrotron radiation,
tomography, zone plates.
Summary
Using a cryo scanning transmission X-ray microscope
(Maser, et al. (2000) Soft X-ray microscopy with a cryo
scanning transmission X-ray microscope: I. Instrumenta-
tion, imaging and spectroscopy. J. Microsc. 197, 68±79), we
have obtained tomographic data-sets of frozen hydrated
mouse 3T3 ®broblasts. The ice thickess was several
micrometres throughout the reconstruction volume, pre-
cluding cryo electron tomography. Projections were
acquired within the depth of focus of the focusing optics,
and the three-dimensional reconstruction was obtained
using an algebraic reconstruction technique. In this ®rst
demonstration, 100 nm lateral and 250 nm longitudinal
resolution was obtained in images of unlabelled cells, with
potential for substantial further gains in resolution. Future
efforts towards tomography of spectroscopically highlighted
subcellular components in whole cells are discussed.
Introduction
Three-dimensional imaging plays a growing role in
investigations of biological structure, where it is often
important to understand the relationship between compo-
nents in a cell that may be distributed in depth. Ideally this
is done on a specimen which is minimally modi®ed from its
living state. We describe here the use of soft X-ray
microscopy to record tomographic data sets of eukaryotic
cells which have been removed from cell culture medium
and rapidly plunge-frozen with no intermediate preparation
steps except for removal of medium in excess of about
10 mm in thickness. Specimens of this thickness are likely to
have many overlapping structures, so some form of 3D
imaging becomes highly desirable to resolve the complexity.
Good contrast of many subcellular structures is obtained
without labelling, at 100 nm transverse and 250 nm
longitudinal resolution in this ®rst demonstration. It is
feasible to improve the resolution to 50 nm or better in all
three dimensions, and it is also possible to highlight speci®c
structures based on their intrinsic chemistry using X-ray
near-absorption-edge resonances.
Soft X-ray tomography has been demonstrated at sub-
100 nm resolution on microfabricated test objects Haddad
et al. (1994), and on dry, mineralized sheaths of soil
bacteria (Lehr, 1997). However, we are not aware of
previous demonstrations of soft X-ray tomography of
hydrated specimens. The use of X-ray near-absorption-
edge resonances is well established in studies of dehydrated
(Ade et al., 1992; Zhang et al., 1996; Buckley et al., 1997)
and some hydrated (NeuhaÈusler et al., 1999) specimens and
efforts towards spectromicroscopy of frozen hydrated speci-
mens are underway (Maser et al., 2000).
Optical microscopy is the most widely used method for
3D imaging of cells. Using approaches such as confocal and
two-photon confocal microscopy (Hell et al., 1997),
through-focus deconvolution methods (Agard & Sedat,
1983; Carrington et al., 1995), or interferometric methods
(Gustafsson et al., 1999), images of eukaryotic cells have
been obtained with a resolution as high as 100 nm in all
three dimensions. Living specimens have been examined in
some cases, although it is more common to study
chemically ®xed specimens. An element to all of these
approaches is the use of ¯uorescent labels because the
resulting incoherent emission process is key to the method.
This is frequently of great advantage in selectively imaging
identi®able subcellular components, and sometimes multi-
ple ¯uorophores can be used simultaneously. However, it is
not generally possible to also image the unlabelled features
in 3D at the same resolution.
Electron microscopy has also been used with great
success for 3D imaging of biological structures. For speci-
mens which have been ®xed, embedded and dried, serial
sections can be cut and their images assembled to obtain a
Journal of Microscopy, Vol. 197, Pt 1, January 2000, pp. 80±93.
Received 10 February 1999; accepted 30 May 1999
q 2000 The Royal Microscopical Society80
Correspondence to: Chris Jacobsen.1Present address: Advanced Photon Source, Argonne National Laboratory,
Argonne, IL 60439, U.S.A.

3D reconstruction, or thick single sections can be rotated to
collect a tomographic data set. A more recent development
is the use of cryo methods to allow tomography with rapidly
plunge-frozen prokaryotic cells at 10 nm resolution (Grimm
et al., 1998). This method avoids the signi®cant biochemical
(Coetzee & van der Merwe, 1984) and structural (O'Toole
et al., 1993) changes associated with the usual preparation
techniques for electron microscopy of dehydrated speci-
mens. However, electron tomography of frozen hydrated
specimens is ultimately limited by the electron mean free
path for inelastic scattering in ice (even if energy ®ltering is
used (Grimm et al., 1998; Jacobsen et al., 1998)), such that
thicknesses greater than about 400 nm at 120 keV or 1 mm
at 400 keV become exceedingly challenging.
We therefore believe that X-ray microscopy complements
the capabilities of other approaches for 3D imaging of cells.
Because of radiation damage (Bennett et al., 1993; Williams
et al., 1993; Kirz et al., 1995), we believe it will not be
possible for soft X-ray microscopy to match the capabilities
of optical microscopy to study living specimens. However,
the resolution in this particular demonstration of soft X-ray
tomography is comparable to that of 3D optical microscopy,
and can be expected to improve towards the 30 nm level, as
demonstrated in other X-ray microscopy experiments
(Spector et al., 1997; Schneider, 1998). Labelling methods
are only in their infancy in X-ray microscopy (Jacobsen et al.,
1993; Chapman et al., 1996; Moronne, 1999), yet it is
useful in many cases to be able to observe unlabelled
structures in 3D as well (especially to understand the 3D
relationships between different structures in a cell). Finally,
500 eV soft X-rays are able to penetrate through 10 mm
layers of ice with good contrast for small features, whereas
electron microscopy of unsectioned frozen hydrated eukaryotic
cells faces severe challenges because of specimen thickness.
Tomographic data recording with a cryo scanningtransmission X-ray microscope
Soft X-rays have properties which make them well suited for
tomographic imaging of cells. By operating at a photon
energy # 540 eV (the oxygen K absorption edge), the 1/e
penetration distance in water/ice is about 9 mm. At the same
time, for high resolution tomography one would like to have
strong contrast for thin organic structures. This is
accomplished by operating at an energy above 284 eV (the
carbon K absorption edge), where , 5 nm thick layers of
protein can be expected to give about 1% absorption
contrast. Because X-ray interactions are dominated by
photoelectric absorption with very little atomic elastic or
inelastic scattering (Kirz et al., 1995; Hubbell et al., 1980),
multiple scattering effects are negligible and quantitative
image interpretation is simpli®ed.
Strong absorption of ionizing radiation implies high
radiation dose; the radiation dose delivered to a hydrated
biological specimen in the course of acquiring a single
50 nm resolution image with a signal-to-noise ratio of 5 : 1
is about 100 Mrad or 106 Gray (Sayre et al., 1977). Even if
one were to lower the dose (e.g. by using phase contrast,
which can lower the dose by as much as an order of
magnitude (Schmahl et al., 1994)), radiation damage would
lead to changes in the specimen during the collection of a
3D data set unless one were to consider schemes involving
multiple beams from a single, fast-pulse X-ray source
(Howells et al., 1994). This is true both of living specimens,
and also of chemically ®xed specimens at room temperature.
One solution is to use the cryo methods developed in the
electron microscopy community (Taylor & Glaeser, 1974;
Dubochet et al., 1988), where the sample is rapidly frozen to
liquid nitrogen temperatures so as to obtain ice in an
amorphous state and thereby avoid ice crystal artefacts.
Using the cryo technique, it has been shown that frozen
hydrated cells can be imaged with no apparent change to
the specimen at the ,50 nm resolution level following doses
as high as 1010 Gray (Schneider et al., 1995; Maser et al.,
1998; Schneider & Niemann, 1998; Maser et al., 2000).
Therefore, the specimen appears stable to doses of about 104
times the required single-image dose, which is suf®cient for
tomography. It should be noted that the exposure require-
ment for tomography is in principle only modestly higher
than that for 2D imaging (Hegerl & Hoppe, 1976; McEwen
et al., 1995) in order to achieve the same signal-to-noise
ratio.
X-ray focusing
The highest resolution optics currently available for soft X-
ray focusing are Fresnel zone plates and the highest
resolution zone plates at present have been fabricated by
electron beam lithography (Schneider et al., 1995; Spector
et al., 1997). With suf®cient care in electron beam
lithography, zone plates can be fabricated with negligible
aberrations. In a scanning transmission X-ray microscope,
one seeks to illuminate the zone plate with suf®cient
coherence so that a diffraction limited probe is formed with
X-rays of wavelength l. For zone plates with more than
about 100 zones (Michette, 1986), the light amplitude is
distributed according to the well known Airy pattern
A�2J1(n)/n, where n�1´22p is the location of the ®rst
amplitude zero-crossing at a radius of (1´22/2)l/NA from
the optical axis, with NA denoting the numerical aperture.
One then has a transverse resolution dt of
dt � 0:61l
NA�1�
and a longitudinal resolution (Born & Wolf, 1980) of
dl � 1:22l
NA2: �2�
q 2000 The Royal Microscopical Society, Journal of Microscopy, 197, 80±93
SOFT X-RAY MICROSCOPY WITH A CRYO STXM 81

The numerical aperture of a Fresnel zone plate is
determined by diffraction from the outermost zones which
have a half-period or width of drN, giving NA� l/(2drN). We
can therefore write
dt � 1:22drN�3�
dl � 4:88drN
drN
l� 4dt
drN
l: �4�
The zone plate used in the experiments reported here had
an outermost zone width drN �60 nm and was used at a
wavelength of l�2´4 nm; using Rayleigh criteria its
theoretical transverse resolution is dt �73 nm, and its
longitudinal resolution is dl �7´3 mm. We therefore see
that the longitudinal resolution is poor compared to the
transverse resolution, so that with X-ray microscopy it is
not favourable to attempt optical sectioning or through-
focus deconvolution as is done in visible light microscopy.
Instead, poor longitudinal resolution translates into large
depth of focus, so that a better approach for 3D imaging is
to rotate the specimen through the focus and acquire
projection images such as is needed for tomography
(Haddad et al., 1994; Lehr, 1997).
How much is the resolution spoiled at the edges of the
depth of focus? The Airy pattern describes the amplitude at
the plane of focus; because a coherent probe is formed, one
can calculate the amplitude at other planes by propagating
the Airy pattern A(r, 0). Free-space propagation of a
wave®eld with wavelength l by a distance z involves
convolution with a kernel h� exp[±ipr2/(lz)] (Goodman,
1968). This can be written as
A�r; z� � A�r;0� � h �r; z�
� Bÿ1�B �A�B�h�� �5�
where * means convolution, and B is a Fourier±Bessel
transform (the cylindrical coordinates equivalent of a 2D
Fourier transform). Because this calculation involves a
simple integration over one variable, it can be rapidly
calculated with a very ®ne grid spacing.
For a scanning transmission microscope with large
detector aperture and a specimen with no phase contrast,
the image is formed by a convolution of the probe intensity
jA(r,z)j2 with the specimen absorption distribution. One can
then calculate the modulation transfer function MTF from
the Fourier transform of the probe intensity at various
distances z (Fig. 1 left). We can also calculate the image of a
simple absorption object by convolution with the probe
intensity at various distances z (Fig. 1 right). From these
simulations we see that we can obtain good contrast for
high resolution features throughout a longitudinal distance
of 2dl, or 14 mm for the example considered here. These
®gures can be scaled to other choices of outermost zone
Fig. 1. High resolution projections of specimens several micrometres thick can be obtained in a soft X-ray microscope. We show here the
optical performance versus defocus calculated at a wavelength l�2´5 nm for a drN �45 nm zone plate with a central stop over 44% of
its diameter. (Such a zone plate has a theoretical Rayleigh resolution of dt �55 nm, a spatial frequency cutoff of 1/(2 ´ 22´5 nm) or
22 mmÿ1.) On the left is shown a shaded contour plot of the modulation transfer function versus spatial frequency and defocus; the MTF
applies only to a purely absorptive object. On the right is shown a simulated defocus image series of bars of width 33, 71, and 148 nm.
One-dimensional lines were extracted from two-dimensional calculations at each defocus image to make up the representation shown.
These calculations can be scaled to other choices of X-ray wavelength l and zone plate outermost zone width drN by scaling transverse dimen-
sions by drN, and longitudinal dimensions by drN2/l, and a depth of focus of 2dl �7´9 mm.
82 Y. WANG ET AL.
q 2000 The Royal Microscopical Society, Journal of Microscopy, 197, 80±93

q 2000 The Royal Microscopical Society, Journal of Microscopy, 197, 80±93
Fig. 2. An experimental demonstration of the depth of ®eld in our cryo STXM. This image shows not the usual x-y representation of the
specimen but rather an x-z representation; that is, the horizontal scan direction is in the object's plane as usual, while the vertical scan direc-
tion represents defocus. The object was a microfabricated test pattern with a variable grating pattern. The depth of ®eld for this image with a
drN �45 nm zone plate at a wavelength of l�2´4 nm is consistent with the calculated value of 2dl �8´2 mm.
Fig. 3. A simpli®ed schematic of the optical system of the microscope. Soft X-rays from an undulator at the National Synchrotron Light
Source are delivered by a grating monochromator in the X1A beamline (Winn et al., 1996) with horizontal and vertical foci coinciding
at the exit slit. This beam then coherently illuminates a Fresnel zone plate objective lens to produce a high resolution focus (isolated
using an OSA) through which the specimen is scanned; the transmitted ¯ux is detected by a phosphor/photomultiplier detector.
SOFT X-RAY MICROSCOPY WITH A CRYO STXM 83

width drN and wavelength l by scaling the transverse spatial
frequencies or distances with drN, and the longitudinal
distances with drN2/l.
The above considerations can be veri®ed experimentally
by taking images where the horizontal image direction
corresponds to a transverse position, and the vertical image
direction corresponds to a longitudinal position. In images
of this type, a pinhole gives an hourglass-type appearance
as the in-focus plane is located at the `neck' where the
image is the narrowest and sharpest. In practice, it is
usually straightforward to determine the proper focus and
estimate the depth of focus from such images. An image of
this type acquired using a drN�45 nm zone plate at
l�2´4 nm is shown in Fig. 2, which shows a depth of
focus of about 8 mm when Eq. (4) predicts 8´2 mm.
Specimen tilt in a cryo scanning transmission X-raymicroscope
We have recorded tomographic data using a cryo scanning
transmission X-ray microscope (cryo STXM). The micro-
scope is built around transmission electron microscope type
cryo specimen holders (E. A. Fischione, Inc. and Oxford
Instruments) which are scanned by a combination of piezo
transducers and stepping motors for high resolution and
large range (Maser et al., 2000). The specimen holder is
inserted into an airlock for rapid pumpout, and then
inserted into the microscope chamber which is maintained
at a vacuum of 10ÿ6 to 10ÿ7 Torr. The airlock can be driven
manually to rotate the specimen holder about a single tilt
axis, and a dial is used to indicate the tilt angle to a
precision of about 0´58.
A spatially coherent, tunable X-ray beam with an
adjustable energy resolving power of E/(DE)�1000±
5000 is focused by a Fresnel zone plate to a point focus
through which the specimen is scanned (see Fig. 3). For the
experiments reported here, a Fresnel zone plate with a
diameter of d�160 mm and an outermost zone width of
drN�60 nm was used. The zone plate had a 80 mm diameter
central stop, so that to isolate the focused light in the ®rst
diffractive order we placed a 70 mm pinhole as an order
sorting aperture (OSA) at a distance of 0´6 focal lengths from
the zone plate. The OSA was fabricated on a 4 ´ 0´5 mm
aperture mount orientated with its long axis parallel to the
specimen holder, thereby minimizing interference at high tilt
angles. For the experiments reported here, the X-ray energy
was 516 eV so that the focal length of the zone plate was
f�4´00 mm. A schematic of how the specimen was able to
tilt about the zone plate is shown in Fig. 4. Further work on
this general approach with appropriately modi®ed cryo
specimen holders should allow us to obtain a tilt range of
6 608 with zone plate focal lengths as short as 1´5 mm.
Specimen preparation for cryo tomography
For our ®rst demonstration experiments of tomography in
a cryo STXM, we used mouse 3T3 ®broblasts. They were
grown directly on 200 mesh gold electron microscope
grids with formvar support ®lm (EMS). The cells were
cultured in a medium consisting of 90% Dulbecco modi®ed
Eagle medium, 9% Hyclone bovine serum, and 1%
antibiotics; the cultures were maintained at 37 8C in a
saturated humidity atmosphere with 5% CO2. The cells
typically reached a near-con¯uent state 2±3 days after
being plated, although coating the EM grids with
®bronectin or poly-L-lysine improved cell attachment and
marginally reduced the growth time. When the cell density
on a grid reached a sub-con¯uent level, the grids were
removed from the culture medium with a ®ne-point forceps
and the forceps were mounted on a plunge-freezing
Fig. 4. Geometry of the zone plate, OSA, and sample when the sample holder is tilted by 458. A thin strip OSA is used so that the sample
holder can tilt around it, thereby increasing the angular tilt range.
84 Y. WANG ET AL.
q 2000 The Royal Microscopical Society, Journal of Microscopy, 197, 80±93

workstation. The excess culture medium on the grid was
carefully blotted by draining from the edges with ®lter
paper. The forceps holding the grid were then propelled by a
preloaded spring into liquid ethane at about 3 m sÿ1 entry
speed, following a procedure known to produce vitri®ed
specimens for cryo electron microscopy (Dubochet et al.,
1988; Echlin, 1992). The frozen grid was then mounted in
the cryo specimen holder and maintained in a cryogenic
state for imaging. Note that in this procedure, the cells were
not intentionally modi®ed until they were rapidly frozen so
that the frozen state should resemble near-physiological
conditions. After a sample grid was loaded into the
specimen holder, the holder was inserted into the micro-
scope for imaging. Images could be taken within 15 min of
cell freezing. A rapid evaluation of the three-dimensional
character of a specimen could be obtained by acquiring and
examining a stereo pair, such as is shown in Fig. 5.
Image acquisition and alignment
To acquire a tomographic dataset, we ®rst took an image at
08 tilt, followed by images from ÿ458 to �45 tilt at 58
increments, and then tilt angles beyond 6 458. This
procedure was used so that a full data set with restricted
tilt range could be obtained before running the risk of
having the sample holder bump into optics at larger tilt
angles. At each tilt angle, the centring and focus of the
image was evaluated by the microscope operator and
adjusted manually prior to imaging. A ®eld size of
400 ´ 300 pixels of 100 nm size was chosen to allow the
entire cell to be contained within a subsequently cropped
350 ´ 256 pixel ®eld (Nyquist sampling at the spatial
frequency cutoff of the drN �60 nm zone plate used would
require 15 nm step size, but such a data set would
overwhelm the computational facilities we had available).
This sampling allowed us to use well optimized fast Fourier
transform algorithms on 256 pixel slices, and a
350 ´ 256 ´ 256 pixel volume (involving 92 Mb of 32-bit
¯oating point numbers) could be accommodated within our
available computational facilities. For these ®rst experi-
ments, we used a per-pixel dwell time of 20 msec, so that
acquiring each image took approximately half an hour.
Collection of the entire data set took over 24 h, although we
expect this time to be reduced in the future.
The acquisition procedure described above yielded a set of
24 images to be processed (Fig. 6). Because each image was
manually aligned during data acquisition, there was a
considerable shift in position from one image to the next.
We therefore identi®ed a single, highly absorbing, 2-mm-
diameter vesicle which was clearly visible near the vertical
centre of all images and used it as an alignment marker. The
sub-region about this vesicle was selected from each image
A, and the relative shift of an image Ai�1 compared to its
predecessor Ai was calculated by determining the location of
q 2000 The Royal Microscopical Society, Journal of Microscopy, 197, 80±93
Fig. 5. A stereo pair of a chemically ®xed and frozen hydrated mouse 3T3 cell at the M-phase of its division. The ®xation was carried out with
3´7% paraformadehyde at room temperature for 15 min prior to plunge-freezing and imaging. Each image consists of 300 ´ 400 pixels at
100 nm step size and the angular separation between the two images is 208.
SOFT X-RAY MICROSCOPY WITH A CRYO STXM 85

the peak of the cross correlation function F ÿ1|( FA i�1)
( FAi)*|, where F refers to a fast Fourier transform and *
denotes the complex conjugate. This shift was subsequently
corrected, yielding a set of images with a tilt axis de®ned to
pass through the chosen vesicle. Using this method, two
consecutive images can be aligned to 1 pixel, or 100 nm
accuracy (we also plan to use gold beads for alignment
assistance in the future when the complexity of the specimen
structure is increased). For tomographic reconstruction, the
images should represent linear maps of the total overlapping
material in each projection. The Lambert±Beer law of X-ray
absorption by a ®lm of thickness t can be written as
I � I0 exp ÿ2lre
NA
Af2� rt�
� �; �6�
where l is the wavelength, re �2´818 ´ 10ÿ15 m is the
classical radius of the electron, NA �6´02 ´ 1023 is Avoga-
dro's number, A is the atomic weight, f2 is an X-ray optical
coef®cient which is tabulated for all elements (Henke et al.,
1993), and r is the density. If the density varies as r(z) along
a distance z, the net transmission is given by
I � I0 exp ÿ2lre
NA
Af2
� z
0r�z 0
�dz 0� �
: �7�
We therefore see that to obtain a linear mapping propor-
tional to the total material�
z0 r(z0) dz0 in a projection column
such as is required for tomography, we must take the
logarithm of the normalized data log[I/I0]. Projections of
log-normalized data were then cropped about the reference
marker to an array size of 350 slices of 256 pixels about the
rotation axis.
Fig. 6. A series of 24 images of a frozen
hydrated mouse 3T3 ®broblast obtained
over a tilt range between ÿ558 to �608
in 58 tilt intervals. Each image contains
400 ´ 300 pixels at 100 nm step size.
86 Y. WANG ET AL.
q 2000 The Royal Microscopical Society, Journal of Microscopy, 197, 80±93

Tomographic reconstruction of the cell dataset
Reconstruction has been attempted using both ®ltered
backprojection (FBP) (Bracewell & Riddle, 1967) and
algebraic reconstruction techniques (ART) (Kaczmarz,
1937; Tanabe, 1971). Figure 7 shows a comparison between
reconstructions with the two methods using simulated data
projected from a Shepp±Logan (Shepp & Logan, 1974)
phantom. With the type of limited tilt data acquired in our
experiment, reconstructions using ART show higher contrast
and better ®delity to the original data, especially in the
direction of missing projection data. In future work, we
expect to be able to reduce the data acquisition time and take
advantage of dose fractionation in data recording (Hegerl &
Hoppe, 1976; McEwen et al., 1995). In this case, the
improved signal-to-noise ratio shown by ART for limited
photon statistics data will also become useful (see Fig. 7).
The computing time cost of using ART rather than FPB is
increased from about 30 min to about 10 h (using a 200-
MHz Pentium Pro processor) on our 24 projections of
350 ´ 256 pixels when 25 ART iterations are computed.
Convergence in ART is reached typically after 15±20
iterations with our data set.
The ART reconstruction of the 3T3 ®broblast projection
data provides a three-dimensional view of the map of
absorption coef®cient times density f2r in the frozen hydrated
cell. Our convention is that in the 08 projection, the X-ray
beam travels towards the viewer in the�z direction, and that
the horizontal and vertical axes in a 08 projection are in
q 2000 The Royal Microscopical Society, Journal of Microscopy, 197, 80±93
Fig. 7. Reconstruction using simulated pro-
jections from a Shepp±Logan phantom
(Shepp & Logan, 1974) indicate that alge-
braic reconstruction techniques (ART)
give better reconstructions than ®ltered
backprojection (FBP) on projection data
sets with the characteristics described
here. At the top are shown reconstructions
using 25 projections in 58 intervals over a
ÿ608 to �608 angular range, similar to
that of Fig. 6. The results from the ®ltered
backprojection method show slightly
higher resolution in the directions with
®lled Fourier components, while ART repro-
duce features in the un®led Fourier space
better and show higher overall contrast.
At the bottom are shown reconstructions
from simulated projection data with noise
added using ®ltered backprojection and
ART, respectively. The added Gaussian
noise was signal independent with a peak-
to-peak signal-to-noise ratio of 20 : 1. In
this case, 37 simulated projections were
used with 58 increments over a ÿ908 to
�908 range. The ART reconstructions
were calculated with 25 iterations.
Fig. 8. Schematic representation of how the ®broblast grew on an
electron microscope grid. One end of the cell body attached to the
top surface of the grid bars, while another end attached to the sup-
port membrane below. The directions of the x, y and z axes are
shown.
SOFT X-RAY MICROSCOPY WITH A CRYO STXM 87

the�x and �y directions, respectively. It is easiest to ®rst
view the reconstruction by examining slices at speci®c y
planes, with horizontal and vertical axes in the�x and �z
directions, respectively (see Fig. 9). These slices reveal that
the left side of the cell is located high up in the reconstruction
volume, while the `tail' of the cell at the right side is located at
the bottom of the reconstruction volume (see Fig. 8). The cell
was attached to the formvar support ®lm at right, and to the
tops of the grid bars (13 mm away) above the `well' at left. (At
the point of cell attachment to the formvar ®lm, one can see a
void in the mass density; see especially the x�27´4 mm slice
in Fig. 10.) The general orientation of the cell is also shown
in the x plane slices of Fig. 10, where the cell body can be
seen to move towards the bottom of the reconstruction
volume (larger values of z along the beam axis) as slices are
taken further to the right. This can also been seen in the
original projection data of Fig. 6. Another interesting feature
visible at large positive tilt angles in Fig. 6 is a small `tentacle'
at the upper edge of the cell. This `tentacle' can be observed
in the reconstruction volume in Fig. 11 at the slices
z�17´6 mm and z�20´0 mm, and in Fig. 9 at the slices
y�17´2 mm and y�18´1 mm.
In the reconstruction volume, one can see a number of
small vesicles which overlap in the z direction and therefore
are impossible to identify as being separate when looking
only at the 08 projection (see especially the x�5´8 mm slice
in Fig. 10 and the y�15´6 mm slice in Fig. 9). These vesicles
are presumably round, so their oblong appearance in the
reconstruction volume provides a means of estimating the z
resolution to be about 250 nm, along with 100 nm in the x
and y directions. We believe this is the highest resolution
three-dimensional reconstruction of unlabelled features in
an unsectioned, hydrated eucaryotic cell.
Discussion
In the demonstration reported here, the maximum tilt angle
was 608. As can be seen in Fig. 4, this is limited by the short
working distance of the zone plate optics used, and by the
thickness of the cryo specimen holder. To increase the
working distance with improved resolution zone plates,
larger zone plate diameters will be required (the electron
beam lithography machine used for zone plate fabrication
has a laser intereferometer for large ®eld positioning, so this
should not present a problem). It may be possible to thin the
cryo holder further; alternative schemes which could be
developed include systems like the Philips Compustage and
the Gatan ultra high tilt holder, or mounting a specimen at
the end of a cold pipette.
With a tomographic reconstruction such as is shown in
Figs 9±11, it should be possible to measure the volume and
mass of various components of cells. In ¯uorescence
microscopy, the task is made somewhat easier since one
can set an intensity threshold to determine where the
¯uorophore is present. In Fig. 12, we show a rendering of
the cell reconstruction using a threshold to attempt to
highlight the large dense vesicles present in the reconstruc-
tion of Figs 9±11. Reconstructions of objects with the
complexity of a cell will bene®t from the application of
more sophisticated methods of object identi®cation and
segmentation.
Because the cryo STXM is operated at a synchrotron
Fig. 9. Reconstruction slices in the y plane. On the left is shown the 08 projection image (shown also in Fig. 6), with the horizontal and ver-
tical axes indicated in the x and y directions, respectively. In this projection, the�z direction goes into the paper away from the viewer. White
lines are shown at the location of slices in the y direction, which are then shown on the right; these slices are through the reconstruction
volume with horizontal and vertical axes in the x and z directions, respectively.
88 Y. WANG ET AL.
q 2000 The Royal Microscopical Society, Journal of Microscopy, 197, 80±93

radiation beamline with an energy resolution of , 0´1 eV, it
should also be possible to combine tomography with X-ray
absorption spectroscopy. Images can be obtained on both
side of X-ray absorption edges of certain low-Z elements
such as carbon and calcium and used to map the
concentration of this element, provided it is present at a
local concentration of about 1% or more (EngstroÈm, 1946;
Bigler et al., 1983). In addition, X-ray absorption near-edge
structure (XANES) resonances appear at X-ray energies
within a few eV of the elemental absorption edge, and can be
used to map different regions with high concentrations of
certain chemical states of an element. The intrinsic width of
such XANES peaks is , 0´2 eV, so that cryo TXM systems
(Schneider, 1998) with an energy resolution of 1±2 eV are
less well suited to their exploitation. In a scanning
transmission X-ray microscope, XANES imaging has been
used to map protein and DNA in sperm (Zhang et al., 1996)
and collagen and apatite in bone (Buckley et al., 1997), and
to map phase separation in polymer blends (Ade et al.,
1992). Such contrast mechanisms could be exploited in
q 2000 The Royal Microscopical Society, Journal of Microscopy, 197, 80±93
Fig. 10. Reconstruction slices in the x plane. At the top is shown the 08 projection image (shown also in Fig. 6), with the horizontal and
vertical axes indicated in the x and y directions, respectively. White lines are shown at the location of slices in the x direction, which are
then shown at right; these slices are through the reconstruction volume with horizontal and vertical axes in the y and z directions,
respectively.
SOFT X-RAY MICROSCOPY WITH A CRYO STXM 89
tomography by taking two or more images at different
photon energies at each projection, and then carrying out
spectroscopic analysis on the reconstructed volume mea-
surements of X-ray absorption coef®cient. While we have
shown that mass loss in frozen hydrated specimens is not
signi®cant at the radiation dose levels required for
tomography (Maser et al., 2000), it may be that XANES
peaks (which represent bond strength rather than overall
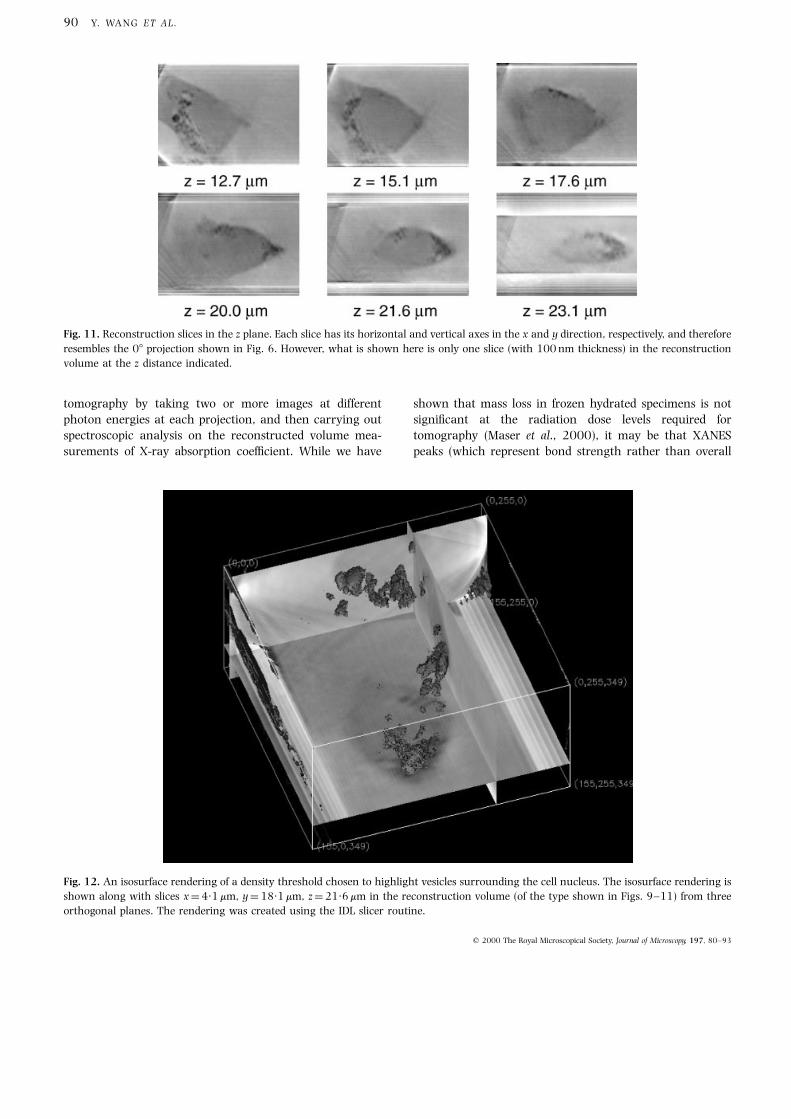
Fig. 11. Reconstruction slices in the z plane. Each slice has its horizontal and vertical axes in the x and y direction, respectively, and therefore
resembles the 08 projection shown in Fig. 6. However, what is shown here is only one slice (with 100 nm thickness) in the reconstruction
volume at the z distance indicated.
Fig. 12. An isosurface rendering of a density threshold chosen to highlight vesicles surrounding the cell nucleus. The isosurface rendering is
shown along with slices x�4´1 mm, y�18´1 mm, z�21´6 mm in the reconstruction volume (of the type shown in Figs. 9±11) from three
orthogonal planes. The rendering was created using the IDL slicer routine.
90 Y. WANG ET AL.
q 2000 The Royal Microscopical Society, Journal of Microscopy, 197, 80±93

electron density) will prove more sensitive; we plan to
address this question in future work. The same resonances
can also be exploited by electron energy loss spectroscopy
(EELS) at signi®cantly higher spatial resolution. However,
EELS analysis requires # 100 nm thick specimens and is
therefore incompatible with electron tomography; further-
more, most EELS instruments have lower energy resolution,
and the energy-loss near-edge structure appears on top of a
large plural inelastic scattering background.
This ®rst demonstration of tomography on a frozen
hydrated eucaryotic cell required considerable operator
attention to tilt, centre and focus for each projection. The
time required to acquire each projection was about 45 min
to one hour. We expect this to be reduced considerably, in
part due to the use of more ef®cient zone plates and
detectors that are under development in our laboratory.
Finally, we are aware of the considerable success that the
electron microscope community has had in automating the
acquisition of tomographic data (Dierksen et al., 1992;
Koster et al., 1992) and efforts towards more automated
tomography dataset acquisition with cryo STXM are underway.
Some challenges arise as the spatial resolution is
improved. From Eq. (4), we see that improvements in
transverse resolution by decreasing the zone plate outer-
most zone width drN lead to decreases in the depth of ®eld,
which scales as drN2. For a drN�30 nm zone plate at
l�2´4 nm, the depth of focus becomes only 2dl �3´7 mm.
This would suggest the adoption of 3D imaging techniques
used in optical microscopy such as the recording of a
through-focus image set followed by 3D deconvolution
(Agard & Sedat, 1983; Fay et al., 1989). However, these
approaches exploit the fact that ¯uorescence microscopy is
an intrinsically incoherent imaging process, and dyes
¯uoresce only according to the intensity of the illumination.
In X-ray microscopy, most specimens exhibit both absorp-
tion and phase contrast (Schmahl et al., 1994); in-focus
incoherent bright®eld images map only the absorption
contrast of the specimen, but out-of-focus planes are imaged
with a defocus-dependent mix of absorption and phase
contrast (furthermore the image intensity is not strictly
proportional to the phase). We believe that the solution lies
in the recording of holograms at each rotation angle, and
processing the data according to the methods of diffraction
tomography (Devaney, 1986; Maleki & Devaney, 1994), and
preliminary experiments have been carried out towards this
goal.
Conclusion
We have performed tomography experiments with a cryo
scanning transmission X-ray microscope, and a three-
dimensional reconstruction of a mouse 3T3 ®broblast
with 100 nm transverse resolution and 250 nm long-
itudinal resolution was obtained. The use of cryo methods
allows the full data set to be recorded without observable
specimen changes from radiation damage. The specimen
thickness greatly exceeds that which can be studied in
electron tomography, so that whole eukaryotic cells can be
studied. Efforts are being made to combine tomography
with the elemental and chemical state mapping capabilities
of the X-ray microscope to identify features of sample in
three dimensions. Further re®nements are being made
to improve the ef®ciency and user-friendliness of the
instrument for tomographic data acquisition.
Acknowledgements
We thank Raymond Fliller, Konstantin Kaznacheyev, Janos
Kirz, Steve Spector, Don Tennant, Jan Warnking, Matthias
Weigel and Sue Wirick for their contributions to cryo STXM,
and Azeddine Ibrahimi for his help with cell culture. We
especially thank Barry Winn for his involvement in
additional tomography experiments not reported here, and
for his help with Fig. 2. We gratefully acknowledge support
from the Of®ce of Biological and Environmental Research,
US DoE under contract DE-FG02-89ER60858, the National
Science Foundation under grants DBI-9605045 and ECS-
9510499, and the Alexander von Humboldt-Foundation
(Feodor-Lynen Fellowship, JM). This work was carried out at
the National Synchrotron Light Source at Brookhaven
National Laboratory, which is supported by the US
Department of Energy.
References
Ade, H., Zhang, X., Cameron, S., Costello, C., Kirz, J. & Williams, S.
(1992) Chemical contrast in X-ray microscopy and spatially
resolved XANES spectroscopy of organic specimens. Science, 258,
972±975.
Agard, D. & Sedat, J. (1983) Three-dimensional architecture of a
polytene nucleus. Nature, 302, 676±681.
Bennett, P.M., Foster, G.F., Buckley, C.J. & Burge, R.E. (1993) The
effect of soft X-radiation on myo®brils. J. Microsc. 172, 109±119.
Bigler, E., Polack, F. & Lowenthal, S. (1983) Quantitative mapping
of atomic species by X-ray absorption spectroscopy and contact
microradiography. Nucl. Instrum. Meth. Phys. Res. 208, 387±
392.
Born, M. & Wolf, E. (1980) Principles of Optics, 6th edn. Pergamon
Press, Oxford.
Bracewell, R.N. & Riddle, A.C. (1967) Inversion of fan-beam scans
in radio astronomy. Astrophys. J. 150, 427±434.
Buckley, C.J., Khaleque, N., Bellamy, S.J., Robins, M. & Zhang, X.
(1997) Mapping the organic and inorganic components of tissue
using NEXAFS. J. Physique, IV 7 (C2 Part 1), 83±90.
Carrington, W.A., Lynch, R.M., Moore, E.D.W., Isenberg, G.,
Fogarty, K.E. & Fay, F.S. (1995) Superresolution three-dimen-
sional images of ¯uorescence in cells with minimal light
exposure. Science, 268, 1483±1487.
Chapman, H.N., Fu, J., Jacobsen, C. & Williams, S. (1996) Dark-
®eld X-ray microscopy of immunogold-labeled cells. J. Microsc.
Soc. Am. 2 (2), 53±62.
q 2000 The Royal Microscopical Society, Journal of Microscopy, 197, 80±93
SOFT X-RAY MICROSCOPY WITH A CRYO STXM 91

Coetzee, J. & van der Merwe, C.F. (1984) Extraction of substances
during glutaraldehyde ®xation of plant cells. J. Microsc. 135,
147±158.
Devaney, A.J. (1986) Reconstructive tomography with diffracting
wave®elds. Inverse Problems, 2, 161±183.
Dierksen, K., Typke, D., Gegerl, R., Koster, A.J. & Baumeister, W.
(1992) Towards automatic electron tomography. Ultramicro-
scopy, 40, 71±87.
Dubochet, J., Adrian, M., Chang, J.J., Homo, J.-C., Lepault, J.,
McDowell, A.W. & Schultz, P. (1988) Cryo-electron microscopy of
vitri®ed specimens. Q. Rev. Biophys. 21, 129±228.
Echlin, P. (1992) Low-Temperature Microscopy and Analysis. Plenum,
New York.
EngstroÈm, A. (1946) Quantitative micro- and histochemical
elementary analysis by Roentgen absorption spectrography.
Acta Radiologica (Supplement), 63, 1±106.
Fay, F.S., Carrington, W. & Fogarty, K.E. (1989) Three-dimensional
molecular distribution in single cells using the digital imaging
microscope. J. Microsc. 153, 133±149.
Goodman, J.W. (1968) An Introduction to Fourier Optics. McGraw-
Hill, San Francisco.
Grimm, R., Singh, H., Rachel, R., Typke, D., Zillig, W. & Baumeister,
W. (1998) Electron tomography of ice-embedded prokaryotic
cells. Biophys. J. 74, 1031±1042.
Gustafsson, M.G.L., Agard, D.A. & Sedat, J.W. (1996) 15M: 3D
wide®eld light microscopy with better than 100 nm axial
resolution. J. Microsc. 195, 10±16.
Haddad, W.S., McNulty, I., Trebes, J.E., Anderson, E.H., Levesque,
R.A. & Yang, L. (1994) Ultra high resolution X-ray tomography.
Science, 266, 1213±1215.
Hegerl, R. & Hoppe, W. (1976) In¯uence of electron noise on three-
dimensional image reconstruction. Z. Naturforsch. 31a, 1717±
1721.
Hell, S.W., Schrader, M. & van der Voort, H.T.M. (1997) Far-®eld
¯uorescence microscopy with three dimensional resolution in
the 100-nm range. J. Microsc. 187, 1±7.
Henke, B.L., Gullikson, E.M. & Davis, J.C. (1993) X±ray interac-
tions: photoabsorption, scattering, transmission and re¯ection at
E�50±30 000 eV, Z�1±92. Atomic Data Nuclear Data Tables,
54, 181±342.
Howells, M.R., Jacobsen, C.J. & Lindaas, S. (1994) Possibility for
one-shot tomography using a high-gain free-electron laser.
Proceedings of the Workshop on Scienti®c Applications of Coherent
X-Rays, number NTIS CONF-940250, Washington, D.C.,
February 1994 (ed. by J. Arthur, G. Materlik and H. Winick).
National Technical Information Service. SLAC-SSRL 0066,
Stanford, California.
Hubbell, J.H., Gimm, H.A. & YÈ verbù, I. (1980) Pair, triplet and total
atomic cross sections (and mass attenuation coef®cients) for
1 MeV±100 GeV photons in elements Z�1±100. J. Phys. Chem.
Ref. Data, 9, 1023±1147.
Jacobsen, C., Medenwaldt, R. & Williams, S. (1998) A perspective
on biological x-ray and electron microscopy. X-ray Microscopy
and Spectromicroscopy (ed. by J. Thieme, G. Schmahl, E. Umbach
and D. Rudolph), pp. II-93±102. Springer-Verlag, Berlin.
Jacobsen, C., Lindaas, S., Williams, S. & Zhang, X. (1993) Scanning
luminescence X-ray microscopy: imaging ¯uorescence dyes at
suboptical resolution. J. Microsc. 172, 121±129.
Kaczmarz, S. (1937) Angenaherte Au¯osung von systemen
linearer Gleichungen. Bull. Acad. Polon. Sci. Lett. A, 1937,
355±357.
Kirz, J., Jacobsen, C. & Howells, M. (1995) Soft X-ray microscopes
and their biological applications. Q. Rev. Biophys. 28 (1), 33±
130. Also available as Lawrence Berkeley Laboratory report
LBL±36371.
Koster, A.J., Chen, H., Sedat, J.W. & Agard, D.A. (1992) Automated
microscopy for electron tomography. Ultramicroscopy, 46, 207±
227.
Lehr, J. (1997) 3D X-ray microscopy: tomographic imaging of
mineral sheaths of bacteria Leptothrix ochracea with the
GoÈttingen X-ray microscope at BESSY. Optik, 104(4), 166±170.
Maleki, M.H. & Devaney, A.J. (1994) Noniterative reconstruction of
complex-valued objects from two intensity measurements. Opt.
Eng. 33 (10), 3243±3253.
Maser, J., Jacobsen, C., Kirz, J., Osanna, A., Spector, S., Wang, S. &
Warnking, J. (1998) Development of a cryo scanning X-ray
microscope at the NSLS. X-ray Microscopy and Spectromicroscopy
(ed. by J. Thieme, G. Schmahl, E. Umbach and D. Rudolph), pp. I-
35±44. Springer-Verlag, Berlin.
Maser, J., Osanna, A., Wang, Y., Jacobsen, C., Kirz, J., Spector, S.,
Winn, B. & Tennant, D. (2000) Soft X-ray microscopy with a
cryo STXM: I. Instrumentation, imaging and spectroscopy. J.
Microsc. 197, 68±79.
McEwen, B.F., Downing, K.H. & Glaeser, R.M. (1995) The relevance
of dose-fractionation in tomography of radiation-sensitive speci-
mens. Ultramicroscopy, 60, 357±373.
Michette, A.G. (1986) Optical Systems for Soft X-rays. Plenum, New
York.
Moronne, M.M. (1999) Development of X-ray excitable lumines-
cent probes for scanning X-ray microscopy. Ultramicroscopy, 77,
23±36.
NeuhaÈusler, U., Jacobsen, C., Schulze, D., Stott, D. & Abend, S.
(1999) A specimen chamber for soft X-ray spectromicroscopy on
aqueous and liquid samples. J. Synchrotron Radiat. in press.
O'Toole, E., Wray, G., Kremer, J. & McIntosh, J.R. (1993) High
voltage cryomicroscopy of human blood platelets. J. Struct. Biol.
110, 55±66.
Sayre, D., Kirz, J., Feder, R., Kim, D.M. & Spiller, E. (1977) Potential
operating region for ultrasoft X-ray microscopy of biological
specimens. Science, 196, 1339±1340.
Schmahl, G., Rudolph, D., Schneider, G., Guttmann, P. & Niemann,
B. (1994) Phase contrast X-ray microscopy studies. Optik, 97,
181±182.
Schneider, G. (1998) Cryo X-ray microscopy with high spatial
resolution in amplitude and phase contrast. Ultramicroscopy, 75,
85±104.
Schneider, G., Schliebe, T. & Aschoff, H. (1995) Cross-linked polymers
for nanofabrication of high-resolution zone plates in nickel and
germanium. J. Vac. Sci. Technol., B, 13(6), 2809±2812.
Schneider, G. & Niemann, B. (1998) Cryo x-ray microscopy
experiments with the x-ray microscope at BESSY. X-ray Microscopy
and Spectromicroscopy (ed. by J. Thieme, G. Schmahl, E. Umbach
and D. Rudolph), pp. I-25±34. Springer-Verlag, Berlin.
Schneider, G., Niemann, B., Guttmann, P., Rudolph, D. & Schmahl,
G. (1995) Cryo X-ray microscopy. Synchrotron Radiation News, 8
(3), 19±28.
92 Y. WANG ET AL.
q 2000 The Royal Microscopical Society, Journal of Microscopy, 197, 80±93

Shepp, L.A. & Logan, B.F. (1974) The Fourier reconstruction of a
head section. IEEE Trans. Nucl. Sci. NS-21, 21±43.
Spector, S., Jacobsen, C., Tennant, D. (1997) Process optimization
for production of sub-20 nm soft X-ray zone plates. J. Vac. Sci.
Technol., B, 15 (6), 2872±2876.
Tanabe, K. (1971) Projection method for solving a singular system.
Numer. Math. 17, 203±214.
Taylor, K. & Glaeser, R. (1974) Electron diffraction of frozen,
hydrated protein crystals. Science, 106, 1036±1037.
Williams, S., Zhang, X., Jacobsen, C., Kirz, J., Lindaas, S., van'tHof,
J. & Lamm, S.S. (1993) Measurements of wet metaphase
chromosomes in the scanning transmission X-ray microscope.
J. Microsc. 170, 155±165.
Winn, B., Ade, H., Buckley, C., Howells, M., Hulbert, S., Jacobsen,
C., Kirz, J., McNulty, I., Miao, J., Oversluizen, T., Pogorelsky, I. &
Wirick, S. (1996) X1A: second generation undulator beamlines
serving soft X-ray spectromicroscopy experiments at the NSLS.
Rev. Sci. Instrum. 67 (9), 1±4, Paper A31.
Zhang, X., Balhorn, R., Mazrimas, J. & Kirz, J. (1996) Mapping and
measuring DNA to protein ratios in mammalian sperm head by
XANES imaging. J. Struct. Biol. 116, 335±344.
q 2000 The Royal Microscopical Society, Journal of Microscopy, 197, 80±93
SOFT X-RAY MICROSCOPY WITH A CRYO STXM 93