Embed Size (px)
Citation preview

Social/Behavioral Skills and the Gender Gap in Early
Educational Achievement
Thomas A. DiPrete
Columbia University
Jennifer L. Jennings
Columbia University
February 23, 2009
An earlier version of this paper was presented at the 2008 Annual Meetings of the American
Sociological Association in Boston. This research was supported by grants from the Spencer
Foundation and from the American Educational Research Association. The authors analyzed
restricted data from the ECLS-K under terms of a license between DiPrete and the National
Center for Education Statistics. Direct all correspondence to: Thomas A. DiPrete, Columbia
University Department of Sociology, 1180 Amsterdam Avenue, 413 Fayerweather Hall, New
York, NY, 10027. Email: [email protected].

Abstract
Though many studies have suggested that social and behavioral skills play a central
role in gender stratification processes, we know little about the extent to which these
skills affect gender gaps in academic achievement. Analyzing data from the Early Child
Longitudinal Study-Kindergarten Cohort, we demonstrate that social and behavioral skills
have substantively important effects on academic outcomesfrom kindergarten through
fifth grade. Gender differences in the acquisition of these skills, moreover, explain a con-
siderable fraction of the gender gap in academic outcomes during early elementary school.
Boys get roughly the same academic return to social and behavioral skills as their female
peers, but girls retain an advantage both because they beginschool with more advanced
social and behavioral skills, and because their skill advantage grows over time. While part
of the effect may reflect an evaluation process that rewards students who better conform to
school norms, our results imply that the acquisition of social and behavioral skills enhances
learning as well. Our results call for a reconsideration of the family and school-level pro-
cesses that produce gender gaps in social/behavioral skills and the advantages they confer
for academic and later success.
Introduction
Social and behavioral skills (also known as “non-cognitiveskills”) have assumed a central role
in explaining persistent differences in school performance by socioeconomic status and race
(Bowles and Gintis, 1976; Rosenbaum, 2001; Farkas, 2003; Lareau, 2003). Bowles and Gin-
tis argued that differential socialization by class (lateroften summarized under the rubric of
“cultural capital”) played a central role in the reproduction of class over generations by affect-
ing both school and occupational outcomes. Just as Duncan, Featherman, and Duncan (1972)
argued that the content of IQ came to be those skills which aremost highly demanded in high-
status occupations, so Bowles and Gintis and later Bourdieu(1984) and Lareau (2003) argued
that teachers and employers rewarded those whose socialization reproduced the cultural be-
haviors associated with the professional and upper classes. Farkas et al. (1990) has shown that
test scores and such noncognitive behaviors as student workhabits, disruptiveness, and absen-
teeism almost completely explained differences in course grades by gender, race/ethnicity, and
poverty status for middle school students. Rosenbaum (2001) made a similar demonstration
that test scores and non-cognitive factors measured on highschool seniors can explain most
of the differences by gender, race/ethnicity and class in high school grades and subsequent
educational attainment.
The theoretical mechanism behind these explanations has focused on the reproduction of
social class. In 1990, Farkas et al. (1990) could write about“teacher bias” as arising in part
from teacher perceptions and in part from the effects of self-fulfilling prophecies on student per-
formance. Teacher perceptual bias arose –they argued– when“teachersperceive lower levels
of performance when evaluating poor, African-Americanor female students [emphasis ours],
and give lower grades even when the students actual performance is no different from that of
other children (p 128).” In 1990, Farkas et al. could argue that the evidence on whether girls
perform better than boys, net of aptitude, was “mixed.” Twenty years later, in contrast, there
is consensus in the literature that girls generally outperform boys in both reading and math
courses (Duckworth and Seligman, 2005; Perkins et al., 2004), both in absolute terms and after
1
achievement tests are controlled (Entwisle et al., 2007). These gender differences in academic
performance carry forward to high school and to college, andappear to play a central role in
producing the increasingly prominent gender gap in favor ofwomen in educational attainment
in the U.S. (Buchmann and DiPrete, 2006; Buchmann et al., 2008)
Largely because of the growing gender gap in educational attainment in favor of women, the
question of whether gender differences in social and behavioral skills plays a role in the rising
gender advantage in educational attainment has gained new salience. Why do these gender dif-
ferences in school performance exist? Class-based theories of socialization and cultural capital
do not readily explain gender differences in culturally desirable behaviors because daughters
and sons are evenly distributed across class boundaries. Efforts to preserve a cultural capital
explanation to account for gender have asserted that teacher bias in schools takes the form of a
pro-female/pro-professional class culture because teachers are professional and largely female
(Entwisle et al., 1997; Entwisle et al., 2007). However, theproblem with this explanation is
that teachers –particularly at the elementary level – have long been professional and female
even when schools were perceived to be neutral or dismissiveof the academic potential of
girls. Furthermore, there is little concrete historical evidence about the relative performance of
girls and boys in schools, particularly as regards to their grades.
Based on analyses of the first six years of elementary school with data from the Early
Child Longitudinal Study–Kindergarten Cohort (ECLS-K), we argue that girls in contemporary
America possess advantages in social and behavioral skillsover boys and perform better on
standardized tests from the start of kindergarten, before there is time for biases in the school
evaluation process to play a role. We further find that socialand behavioral skills are generally
predictive of academic achievement in early elementary school even within groups defined
by race, class, and gender, and that these variables explainrelatively little of the variation
in rated social and behavioral skills in the elementary school population. These facts render
untenable the simple identification of social and behavioral skills with class-based socialization
practices: differences in mean levels of social and behavioral skills by gender are actually
2

larger than are differences by poverty status. At the same time, social and behavioral skills
can clearly be taught, because children from higher socioeconomic backgrounds have more
of them. The contribution of these skills to academic achievement runs partly through their
continuing effects on cognitive test scores. They provide an even greater advantage in teacher-
based academic evaluation, which, we argue, arises not so much because of “teacher bias” as
because teachers generally use “well-rounded” performance evaluations that take account of
the production of assignments and the full participation inthe school process that is enhanced
by social and behavioral skills. Our results call for a reconsideration of the family and school-
level processes that produce these skills and the advantages they confer for academic and later
success.
Social/Behavioral Skills, Academic Achievement, and Gender
A large and growing literature has documented the impact of social and behavioral skills (ab-
breviated below as “social/behavioral skills”) on cognitive outcomes, on educational attain-
ment, and on labor market success. The term “non-cognitive skills” illustrates the lack of
specificity in conceptualizing as well as measuring these skills. Duncan et al. (2007) note
that psychologists classify many of these skills under the categories of either “cognitive self-
regulation” or “emotional self-regulation.” “Cognitive self-regulation” includes planning, sus-
taining attention, effortful control of attention or action, task persistence, and inhibition of im-
pulsive responses. “Emotional self-regulation” includesthe ability to control anger, sadness,
joy, and other emotional reactions, which predict both externalizing and internalizing problem
behaviors. The lack of standard terminology reflects the multidimensional character of these
skills as well as the multidisciplinary collection of scholars who study these skills and their
consequences.
Though many studies have shown that social and behavioral skills are associated with aca-
demic achievement and attainment (Alexander et al., 2003; Ladd, Birch, and Buhs, 1999; Nor-
3
mandeau and Guay, 1998; Raver et al., 2005; Trzesniewski et al., 2006), scholars continue
to debate the specific skills that matter, the size of their effects, and the extent to which they
explain gaps in educational achievement by race, class, andgender (Bowles, Gintis, and Os-
borne, 2001; Borghans et al., 2008; Murnane, Willett, and Levy, 1995). In a series of papers,
Heckman and colleagues argue that parents influence the development of social and behavioral
as well as cognitive skills, and that interventions such as enriched child-care centers (e.g., the
Perry preschool program) boosted social and behavioral skills of children, and improved aca-
demic performance through this vehicle (Heckman and Rubenstein, 2001; Cawley, Heckman,
and Vytlacil, 2001; Carneiro and Heckman, 2003; Cunha et al., 2006; Heckman and Masterov,
2007; Heckman, Stixrud, and Urzua, 2006; Urzua, 2006).
A second body of studies derived from interventions intended to buttress specific skills has
drawn its focus more narrowly. Many of these studies find a stronger relationship between
reading and social skills than between math and social skills. For example, Coie and Krehbiel
(1984) found that low-achieving socially rejected 4th graders who were assigned to an intensive
social and academic skills training intervention gained inreading, but not in math; similar
results were obtained by the MTA Cooperative Group, 1999, which focused on children with
attention deficit and hyperactivity disorder (ADHD). Some studies in this literature provide
evidence that only a subset of social and behavioral skills affect academic outcomes. For
example, Dolan et al. (1993) report no cross-over effects ofbehavioral training on reading
gains even though aggressive and shy behavior diminished.
Meanwhile, cultural capital researchers contend that a broad array of cultural skills af-
fect educational attainment primarily through their impact on the evaluation process in school
(Bourdieu, 1984; Lareau, 2003). Research suggests that social and behavioral skills have par-
ticularly strong effects on teacher-rated academic achievement, especially at the start of ele-
mentary school (Ladd et al., 1999; Lin, Lawrence, and Gorrell, 2003). Duncan et al. (2007)
argue this is because early elementary teachers evaluate student progress on a broader set of
tasks that includes turning in assignments on time, gettingalong with others, and showing
4
involvement in classroom activities.
Given these findings, social and behavioral skills are a prime suspect in producing gender
differences in educational outcomes. Abundant literaturereports that boys have greater devel-
opment problems than girls (Buchmann, DiPrete, and McDaniel, 2008). Boys have higher rates
of antisocial behavior, attention disorders, reading disabilities, mental retardation, stuttering,
delayed speech, and other related phenomena (Halpern, 1997; Muter, 2003; Rutter et al., 2004).
The lower rate of antisocial behavior of girls in early childhood persists into the pre-school and
elementary years, where they exhibit less disruptive conduct than do boys. Several studies have
demonstrated stronger tendencies towards externalizing behavior by boys (Entwisle, Alexan-
der, and Olson, 2005; Raffaelli, Crockett, and Shen, 2005).Gilliam (2005) reports that boys are
five times as likely as girls to be expelled from pre-kindergarten. In early elementary school
they continue to be more disruptive than girls, and they alsoare less engaged in classroom
learning (Ready et al., 2005; Zill and West, 2000). These gender differences persist through
high school (Downey and Vogt Yuan, 2005; Dumais, 2005).
In addition, a growing literature documents academic performance differences between
girls and boys. Entwisle et al. (2007) find that the gender gapemerges relatively late in the
elementary school experience. Other research, however, shows that girls have better reading
skills than boys in kindergarten (Chatterji, 2006; Tach andFarkas, 2006; West, Denton, and
Reaney, 2000), and that this advantage persists throughoutelementary school (Trzesniewski
et al., 2006; U.S. Department of Education, 2006).1 Some scholars have found generally simi-
lar performance of girls and boys in mathematics and readingtests in the early grades, though
their trajectories are different: boys gain in mathematicsachievement relative to girls during
elementary school (Penner and Paret, 2009 (forthcoming)),while girls gain in reading achieve-
ment relative to boys (Maccoby and Jacklin, 1974; Willingham and Cole, 1997).
1Trzesniewski et al. (2006) found that the correlation between anti-social behavior and reading was signifi-cantly stronger for boys than for girls in the E-Risk Longitudinal Twin Study. Environmental rather than geneticfactors explain most of the correlation between these variables. They further found that antisocial behavior mayhave a causal impact on reading for both genders, but that thereciprocal effect (poor reading leading to antisocialbehavior) appears to apply only to boys.
5

The extent to which gender differences stem from biologicaldifferences, from differences
in the ways that boys and girls are raised, or from an interaction between biology and cultural
practices is difficult to determine, because these differences emerge slowly through time, dur-
ing which they may experience different treatment in the social environment (Dehaene, 1997;
Halpern, 2000; Spelke, 2005; Spelke and Newport, 1998).2 This fact draws attention to the
crucial question of the early life course trajectory of gender differences as well as the factors
that produce them.
Gender-based family socialization processes appear to play an important role in creating
the gender gap. Entwisle et al. (1994, 1997) argue that families typically give young boys
more independence than young girls. They argue that the greater time spent playing in the
neighborhood with other boys in complex and spatially demanding games could be a source
of the male mathematics advantage. Nancy Lopez’s (2003) ethnographic study of low-income,
second generation Dominican, West Indian and Haitians similarly produced evidence that par-
ents give more independence to boys and exert more social control on girls. Interaction with
other children outside the nuclear family may strengthen alternative norms for male behavior
that are more likely to be at odds with adult standards for behavior and therefore are treated as
undesirable by both parents and teachers.
Schools may also play an important role. Entwisle and Alexander (1989; see also Entwisle
et al., 1997) argue that the transition into full-time schooling constitutes a “critical period.”
During this critical period, children must adapt to new forms of social control over daily activ-
ities and a new process of formal teaching and learning. Girls are typically at a different point
in their mental and physical development than boys at this age. Schools and teachers provide
educational climates that may advantage students in the adjustment process who have the par-
ticular behavioral skills that young girls have in greater abundance than young boys. Schools
and teachers could provide educational climates that maintain or enhance the social and behav-
ioral advantages of girls. They could provide direct rewards for these skills in the evaluation
2Thus, Entwisle et al. (2007) note that parents have lower reading expectations for boys than for girls, thoughsuch differences may themselves be conditioned by biological differences between the genders.
6
process. Or they could discriminate against students presumed to have fewer of these skills
in either the learning or the evaluation process. However, this link is produced, Downey and
Vogt Yuan (2005) and Rosenbaum (2001) have found that genderdifferences in behavior are
an important part of the explanation for gender differencesin high school grades.
The gender gap in behavior and achievement may also arise from processes linked to social
class. Using data from the Baltimore Beginning School Study(BSS), Alexander et al. (2003)
determined that the gender gap in retention rates was largerfor poor children (i.e. those el-
igible for free or reduced price lunch) than for non-poor children. Other scholars have also
found a social class component to the gender gap in reading (Bianchi, 1984; Burbridge, 1991;
Mickelson, 2003). Entwisle et al. (2007) report that significant gender gap in conduct marks,
in retention, and in reading scores and reading score growthfrom first to fifth grade for poor
children, though all these gaps are negligible for non-poorchildren. In their data, 44% of the
female advantage in reading gain for poor children by fifth grade was explained by teacher
conduct marks in years 2 and 4, even as conduct has no relationship with reading gain for
non-poor children. Entwisle et al. explain the pattern of conduct marks as a consequence of fa-
voritism by elementary school teachers who themselves are overwhelmingly middle class and
female (Entwisle et al., 1997; Entwisle et al., 2007). Processes that link social class and gender
in early childhood may be related to the class component in the growing female advantage in
educational attainment in recent decades Buchmann and DiPrete (2006).
Finally, abundant evidence identifies a racial component tothe gender gap, though its size
(at least with respect to educational attainment) has changed considerably over time (DiPrete,
McDaniel, Buchmann, and Shwed, 2009). Davis (2003) and Mandara (2006) draw attention
to the large literature on the underachievement of black boys at all levels of education (see
also Fan and Chen, 2001; Steinberg, Dornbusch, and Brown, 1992). Much of this litera-
ture is framed in terms of the presence or absence of an “oppositional culture” that differ-
entially affects black youth, and particularly black males, though scholars disagree sharply as
to whether black males experience more peer opposition to school effort than do white males
7
either in general or in specific school contexts (Davis, 2003; Farkas, 1996; Farkas et al., 2002;
Ainsworth-Darnell, 1998; Flashman, 2008). Mandara has argued that family parenting styles
in the African-American family concerning the form of discipline, racial socialization, and the
level of parental involvement in education may also play a role in the black gender gap in
academic performance.
A broad literature in sociology takes a social constructivist perspective on gender differ-
ences in education, particularly on the issue of social development (Davis, 2003). From a
social constructivist perspective (which parallels in many respects the cultural capital tradition
of Bourdieu, 1984 and more recently Lareau, 2003), differences in measured social and be-
havioral skills arise from parental and school environments that express different expectations
for girls and boys, and perhaps for African-American boys inparticular (Jackson and Moore,
2008). Entwisle et al. (2007), for example, see gender bias by teachers and parents in favor
of girls as the main cause of the growth in the gender gap in disadvantaged children (as op-
erationalized by the receipt of subsidized lunch). They argue that girls have better social and
behavioral ratings not so much because of differences in maturation rates but rather because
“they find the student role more compatible than boys do” (p. 134).3 As further evidence of
this bias, they find that social and behavioral skills affectacademic achievement differently for
boys and girls; in particular, they report that boys with poor conduct grades were more likely
to be retained in first grade than were girls. This finding parallels Farkas et al. (1990), who
reported from their Southwestern City School District datathat boys apparently suffered lower
course grades for being disruptive, while girls did not.
The social constructivist perspective is coherent, but inherent measurement problems make
it difficult to fully evaluate its validity. For example, thefindings from Entwisle et al’s Begin-
ning School Study support the conclusion that teachers evaluate girls more favorably than boys
because of gender bias, but they are equally consistent withthe contrary hypothesis that par-
ents and teachers accurately observe gender differences inbehavior, which affect both learning
3Some scholars go so far as to characterize school-based standards for behavior as “feminine” and irrelevantto the masculine sense of self of black youth (Holland, 1992;Noguera, 2003; Watson and Hodges, 1991).
8
itself and the production of materials (like homework, reports and presentations) that factor
into the academic evaluation process. Similarly, class-based gender disparities in educational
outcomes could imply that the environment of lower-class children — including parental so-
cialization and neighborhood influences — differentially encourages boys to behave in ways
that inhibit academic achievement. It could also imply thatparents of lower-class children do
not work as effectively to compensate for biologically-based gender differences in behavioral
propensities that would otherwise disadvantage the performance of their boys. Entwisle et al.
(2007) provide evidence that parents of poor children are more likely to have gender-traditional
orientations toward sex roles than do non-poor children, which accords with a broader literature
that shows lower-status adults to be more traditional in their sex-role orientations (Buchmann
and DiPrete, 2006; Lackey, 1989; White and Brinkerhoff, 1981). However, other evidence sug-
gests that the relationship between class and orientationstowards sex roles may have changed
during the latter decades of the 20th century (Brewster and Padavic, 2000).
A second challenge to our conceptions about the links between gender, class, behavior,
and academic achievement comes from the recent and well publicized study by Duncan et al.
(2007). Based on their re-analysis of multiple sources of data on children in early elementary
school, Duncan et al. argue that cognitive attention problems are the main factor accounting
for the correlation between aggression or other behavior problems and academic achievement
(Barriga et al., 2002; Frick, 1991). Though the media characterized Duncan et al.’s findings to
mean that “early behavior problems don’t matter,” Duncan etal. actually argued that “attention
skills” were associated with subsequent achievement, but were weaker predictors than early
reading and math skills. However, they also argued that the remainder of what they called
“socioemotional” skills “were generally insignificant predictors of later academic performance,
even among children with relatively high levels of problem behaviors” (Duncan et al. 2007, p.
1428). While not definitive, their results call for a reconsideration of the link between social
and behavioral skills and early educational outcomes, and in particular whether behavioral
differences constitute a plausible explanation for genderdifferences in early elementary school
9

performance.4
The next sections assess the role of behavior in producing anacademic performance gap
between boys and girls in elementary school with data from the ECLS-K. We examine whether
the gender gap in social and behavioral skills is class-specific, and assess its impact on aca-
demic achievement over the first five grades of elementary school. We also reconsider the
claim that gender differences in early academic outcomes stem from gender bias in the eval-
uation process that results from from the better conformityof girls than boys to the student
role. In doing so, we contribute to the growing body of literature on the effects of social and
behavioral skills on social stratification processes.
Data and Methods
The ECLS-K is a study of a nationally representative sample of 21,260 kindergartners that
attended kindergarten in the 1998-1999 school year;11,820have now been followed through
fifth grade.5 These data provide parent reports on the socioeconomic and demographic char-
acteristics of the children, teacher and parent reports of their social and behavioral skills, cog-
nitive assessments, and measures of teacher and school characteristics. The ECLS-K began
as a multilevel study, in which data were collected on multiple kindergarten children in the
same school, some of whom share the same teacher. The first data collection was at the start
of kindergarten. Major followups took place at the end of kindergarten, the end of first grade,
the end of third grade, and the end of fifth grade, during whichtime the students have diffused
into new schools and to different teachers in the same school. In each of these followups, in-
formation was obtained from the parents about the family situation and home behaviors of the
children. Teachers were queried about classroom activities and the focal child’s performance
4With the exception of the Early Child Longitudinal Study-Kindergarten (ECLS-K), the six datasets theyconsidered have relatively small sample sizes and lack parallel measures of social and behavioral skills. The 1970British cohort study has a large sample size, but Duncan et al. report analyses only for the 10% subsample thathave prior measures of cognitive and social/behavioral skills.
5In keeping with NCES requirements when analyzing restricted data, all sample size numbers reported in thispaper have been rounded to the nearest 10.
10
in academic subjects and on a variety of social and behavioral dimensions. School administra-
tors provided information about a variety of school, community, and teacher characteristics. In
addition, the sample children were given cognitive tests onreading, mathematics and general
knowledge in each of these data collection waves.
Our analyses make use of students’ test scores in reading andmath at the beginning and
end of kindergarten, the end of first grade, the end of third grade, and the end of fifth grade,
plus teacher assessments of academic achievement and retention in grade after kindergarten,
first grade, and third grade. Duncan et al’s (2007) recent meta-analysis of six datasets included
analyses of the impact of social and behavioral skills in kindergarten on academic outcomes in
third grade with the ECLS-K sample using this same set of dependent variables. Their focus is
neither on gender differences in social and behavioral skills nor of the impact of gender differ-
ences in social and behavioral skills on gender differencesin academic outcomes. Nonetheless,
it is important to note the distinctions between their models and the strategy that we employed.
After describing our methodology, we briefly discuss the differences between our approach
and their approach, and later return to a discussion of differences in results for those parts of
the analysis that overlap.
The ECLS math and reading tests use item response theory (IRT) to place students on a
common scale for mathematics and reading. NCES cautions against the estimation of absolute
change in test scores because of the possibility that the metrics at different areas of the test
score distribution are not comparable. We therefore measure reading and math achievement
using within-panel standard deviation scores, where the standardization is done relative to the
estimated population distribution. The use of standardized measures also facilitates the inter-
pretation of the effects of social and behavioral skills, which we also measure as within-panel
standardized scores. It should be noted, however, that our use of standardized scores implies
that “growth” in reading and math refers to changes in the distribution of scores at each grade,
relative to the other students in the population corresponding to the ECLS-K sample. To test
the robustness of our results, we have also estimated modelsusing the IRT scores as dependent
11

variables and obtained similar results (which are available upon request).
Teachers in the ECLS-K study also rated student progress in language and literacy, general
knowledge in science and social studies, and mathematical thinking in each year. According to
the NCES (Westat and Educational Testing Service, 1998), the academic rating scales (ARS)
are indirect cognitive assessments that differ in two principal respects from the direct cognitive
assessments provided by the cognitive tests. First, the ARSmeasured both the “process” and
the “products” of children’s learning in school, where “process” included “the strategies they
[the students] used to read, solve math problems, or investigate a scientific phenomenon.” In
contrast, the tests only measure the “products” of learning. Second, while the tests were con-
strained by a standardized testing format, the ARS was intended to “reflect a broader sampling
of the most recent curriculum standards and guidelines” anda “broader curriculum content.”
They differed in a third obvious respect as well in that they are teacher ratings of academic
progress as opposed to measures from standardized tests.
Teachers were asked to rate five dimensions of student socialand behavioral skills at the
beginning and end of kindergarten, the end of first grade, theend of third grade, and the end
of fifth grade. The Approaches to Learning Scale rates the child’s attentiveness, task persis-
tence, eagerness to learn, learning independence, flexibility, and organization. The Self-Control
Scale indicates the child’s ability to control behavior by respecting the property rights of oth-
ers, controlling temper, accepting peer ideas for group activities, and responding appropriately
to pressure from peers. The Interpersonal Skills scale rates the child’s skill in forming and
maintaining friendships, getting along with people who aredifferent, comforting or helping
other children, expressing feelings, ideas and opinions inpositive ways, and showing sensitiv-
ity to the feelings of others (National Center for EducationStatistics, 2007). The Externalizing
Problem Behaviors scale includes acting out behaviors suchas the frequency with which a
child argues, fights, gets angry, acts impulsively, and disturbs ongoing activities. The Inter-
nalizing Problem Behaviors Scale rates the student on the apparent presence of anxiety, low
self-esteem, loneliness, and sadness. The internalizing behavioral measure is empirically less
12
stable from year to year, which may suggest that it is more sensitive to the temporary effects of
shocks in the student’s life. Supplementary analyses (available from the authors upon request)
also demonstrate that externalizing and internalizing behaviors have a weaker relationship to
academic outcomes than do approaches to learning, self-control, and interpersonal skills. For
these reasons, we focus our attention in this paper on these three factors in particular.
Of the 11820 students still in the study in 5th grade, 90 students were added to the study
in 1st grade to freshen the sample, and thus lacked any kindergarten measures; 430 students
were not first-time kindergartners in 1998-99; 5390 students were missing at least one test
score or social rating between K and 5; and 1010 were missing covariates.6 Our complete data
sample of 4910 students includes all students with non-missing data for the variables listed in
Table 1 and our control variables. Because a considerable number of cases were dropped by
these criteria, we used multiple imputation to fill in missing data for cases who have at least
one kindergarten observation and who are still part of the study in 5th grade. The imputed
sample size is 11300. 1690 (of the 11300 students total) lived in households whose home
language was not English and were given a special "Oral Language Development Screener"
(OLDS). For these students, we included the OLDS in the imputation model and performed
analyses that alternately dropped and included them as described further below. We estimated
models both using the complete data sample, and also using Rubin and Little’s method for
estimating confidence intervals with multiple imputed data(Little and Rubin, 2002; Carlin
et al., 2008). Our analyses also took the complex sample design of the ECLS-K into account
in the computation of standard errors.7
In order to establish the best way to measure social and behavioral skills with the three
ECLS-K factors, we used covariance structure analysis. We specified a covariance structure
6We note again that all sample size numbers are rounded to the nearest 10 to conform to NCES requirements.As a result the subtotals may not sum to the grand total.
7Population sampling units (PSUs) were drawn within geographic clusters, and schools were drawn from thesePSUs stratified on the basis of private and public status. Within sampled schools, up to twenty-four students weresampled with unequal probabilities based on race. We used information about the geographic strata, PSU, andprobability sampling weights to estimate standard errors,facilitated by advice from NCES. In some cases, theECLS-K sample had only one PSU within a given stratum for cases that fell within our sample. In these cases,we combined this stratum with an adjacent stratum in order toinclude these cases in our estimation.
13
model that treats the three social/behavioral scales (approaches to learning, self-control, and
interpersonal skills) as indicators of a single latent factor, and specified reading at the end of
first grade to be a function of the latent social factor, the reading score at the end of first grade,
and a number of covariates.8 A satisfactory fit for this model required the inclusion of a direct
effect of the residual on the orientation to learning scale on the end of first grade reading score
(see Figure 1). With this specification, both the social/behavioral skills factor and the resid-
ual effect of orientation to learning had significant effects on end of first grade reading. In an
alternative specification, we allowed orientation to learning to be a separate factor, and speci-
fied self-control and interpersonal skills to be indicatorsof a second latent social development
factor. This alternative specification required the inclusion of a covariance between orientation
to learning and the latent social development factor, and the overall fit of the model was not
as good as in the first case. Students’ orientation to learning is clearly related to the other two
social/behavioral scales even as it has an independent effect that cannot be fully captured by a
single latent factor. Consequently, in the work that follows, we used two orthogonal social fac-
tors as our measures of social development in this paper: the“social/behavioral factor,” which
is indicated by all three scales,9 and the orthogonal “approaches to learning residual” that was
not accounted for by the common factor. We will refer to the two variables together as “social
and behavioral skills” (equivalently, “social/behavioral skills”) in the text below.10
[Figure 1 about here.]
We first determined the extent to which social background factors can account for gender
differences in social and behavioral skills, and then used avariety of estimation strategies to
estimate the impact of social and behavioral skills on the growth of academic skills. We began
with OLS regressions of reading and math test scores on lagged reading and math test scores
8Because the underlying items used by NCES to construct its five scales of social development are proprietary,we were not able to perform our factor analysis on the underlying items themselves, which certainly would havebeen preferable from a scientific perspective.
9The factor weights were 0.759 for approaches to learning, 0.832 for self-control, and 0.861 for interpersonalskills.
10Supplementary analyses which include the internalizing and externalizing problem behavior scales are avail-able from the authors upon request.
14

and lagged social/behavioral skills for each wave of the ECLS-K. To address potential endo-
geneity issues (including measurement error), we used instrumental variables (IV) regressions
with lagged (or, depending on the model, further lagged) test scores and social/behavioral
skills ratings as the instruments. We also estimated these models separately for males and
females, and estimated a joint model that included interaction effects between gender and so-
cial/behavioral skills. As a further control for unmeasured stable student-specific attributes, we
estimated fixed effects models. Finally, we estimated the extent to which gender differences
in social development from kindergarten through 5th grade can explain gender differences in
math and reading over the early years of elementary education.
We control for variables that have been associated with students’ academic and social and
behavioral skills in previous research. These variables include race, gender, socioeconomic
status, family structure and changes in family structure, the presence of a biological or non-
biological father, and whether a student has been retained.Because “academic red-shirting”
(the practice of delaying the start of school) is more commonfor boys than for girls (Graue and
DiPerna, 2000; Malone et al., 2006), we also control for the child’s age at the wave when the
outcome variable was measured.11
The results presented in the paper are “analysis of covariance” models rather than “change
score” models. As Morgan and Winship (2007) recently noted,these alternative approaches
make different assumptions within a “causal modeling” framework: in the “change score”
context, one implicitly assumes that the baseline (“untreated”) difference between the “treated”
and “control” samples (adjusted for observed covariates) does not vary by age, while in the
“analysis of covariance” framework, one implicitly assumes that this baseline is shrinking with
age. We think the assumption underlying the “analysis of covariance” model is reasonable
in this case, i.e., it reasonable to assume that the counterfactual “untreated” differences in
reading and math growth between a matched-on-observables treatment and control sample are
11In supplementary analyses, we also added mother and father’s education, family income, mother and father’soccupation, number of siblings, preschool child care, mother ever worked, maternal depression, parent expecta-tions, public assistance and the racial and socioeconomic composition of the school. The inclusion of this largerset of controls did not alter our results.
15

becoming more similar at older ages.12 For statistical reasons, we estimate the OLS and fixed
effects models using one-panel lagged social and behavioral skills, though because the spacing
of the panels is wide relative to the age of the respondents, we expect statistical estimates
based on lags to underestimate the true effect net of other issues.13 As noted above, we address
potential endogeneity in the analysis of covariance modelsby using instrumental variables
regression, and we estimate IV regression models using bothinstrumented contemporaneous
and lagged measures of social/behavioral skills.
Duncan et al. (2007) also used the analysis of covariance strategy to estimate models for the
effects of academic and social/behavioral outcomes on academic outcomes as of first and third
grade, using both multiple-imputed and non-multiple imputed estimation strategies, as we did.
Duncan et al. used OLS, reliability corrected OLS, and OLS with fixed effects at the teacher
(not student) level. The use of teacher (as opposed to student) fixed effects is problematic to
the extent that students are not randomly assigned to kindergarten classrooms (we would argue
that students are not randomly assigned to kindergartens inthe U.S.).14 Duncan et al used
a very large (over 100) number of covariates as control variables, including, in some cases,
variables (such as parental educational expectations, or how often parents read to the child)
12The counterfactual untreated differences are the differences in reading or math score growth between other-wise matched samples if the “treated” sample had not experienced an additional increment of social/behavioralskills relative to the “control” sample.
13The spacing of the ECLS-K panels is large (one to two years) relative to the age of the children being studied.If the effects of changes in social/behavioral skills on changes in reading or math competencies occur with shortlags, then the impact of “shocks” to social/behavioral within the course of a period as long as a school year wouldgo undetected through the use of lags measured more than a year in the past. In addition, some of the ratings areimputed, which removes the ability of the statistical modelto estimate the impact of developmental shocks. Thesefacts, when combined with the short panels available for each student, reduce the power of the student-level fixedeffects models to measure the potential impact of within-student changes in social/behavioral skills on changes inacademic outcomes.
14Duncan et al. write in their appendix that “since the ECLS-K sample was clustered by classroom, and thesame teachers often rated more than one child, we also control in these second models for teacher fixed effects.”The problem that arises from clustered errors is taken into account by using estimates that take the complexsurvey sampling design into account. The clustering by kindergarten classroom in the ECLS-K breaks downas the children diffuse into different schools and classrooms as they get older, but continues to be dealt withappropriately by the use of the geographic clustering and stratification variables supplied by NCES for each waveof the panel. As a practical matter, the Duncan et al. fixed effects estimates did not differ much from their OLSestimates; using teacher fixed effects reduced the magnitude of the most important single dimension of social andbehavioral skills – approaches to learning – on third grade reading test scores and increased its magnitude on thirdgrade math scores.
16

that may be endogenous to the child’s behavior. We instead estimated a student-level fixed
effects model to take account of all unmeasured stable characteristics of the student. We also
employed a different treatment of the five social/behavioral dimensions than did Duncan et al.
As justified above, we used a two-dimensional measure of social and behavioral skills in the
models we present in this paper. In contrast, Duncan et al. simultaneously entered all five
social/behavioral factors into their models and report coefficients and standard errors for these
coefficients for each of these scales, net of the effects of the other four.
Our analyses allow a reconsideration of the class pattern ofgender differences that ap-
pear in the Baltimore BSS. The ECLS-K data have two major advantages over the BSS data,
namely national representation and a much larger sample size (11,300 vs. an analysis sam-
ple size of 403 for the BSS). A third important difference between the ECLS-K and the BSS
data concerns the historical context; the BSS data concern asample of children who were in
elementary school in the early 1980s, while the ECLS-K children are in elementary school in
year 2000 and beyond. The profound change in the relative educational attainment of women
and men (Buchmann et al., 2008) begs the important question of whether and how the relative
educational experiences of females and males has changed atearlier ages.
Results
Gender Differences in Social/Behavioral Skills
In Table 1, we present the means of our social and behavioral measures by gender, race, and
socioeconomic status for the multiple imputed sample. Girls lead boys by nearly 0.4 standard
deviations at the start of kindergarten on the social/behavioral factor and by a similar amount
on the approaches to learning scale.15 From kindergarten to the end of fifth grade, boys fall
further behind girls, lagging by 0.53 standard deviations on social/behavioral skills and 0.58
15Descriptive information about the approaches to learning scale refer to the scale itself, not the orthogonalresidual to the social/behavioral factor that is used as a covariate in our statistical models.
17

on approaches to learning by the end of fifth grade. In every year, the rated gap in social and
behavioral skills between girls and boys was considerably larger than was the gap between
children in poverty vs. nonpoverty families, where povertyis measured based on the prelimi-
nary Census poverty thresholds for 1998 (Westat and Educational Testing Service, 1998). The
black-white gap in social/behavioral skills was about the same size as the poverty gap and is
smaller than the gender gap. Asian students received higheraverage ratings than did the other
racial/ethnic groups; in particular, the Asian-black gap in rated social and behavioral skills is
larger than the gender gap.
[Table 1 about here.]
To what extent is the large difference in social and behavioral skills explained by family
background variables? Controlling for ethnicity, family background, age, and reading and
math skills reduces the baseline gender gap by only a small amount. Table 2 shows that the
female advantage in social and behavioral skills continuesto grow from the end of kindergarten
through fifth grade even with the additional controls for lagged social/behavioral and academic
skills. Social and behavioral skills have a significant relationship with reading and math skills,
socioeconomic status, and the presence of a biological father in the household. Net of other
factors, Asian students and students from homes where English is not the primary language are
rated as having relatively high social and behavioral skills.
Entwisle et al. (2007) only found a gender gap in conduct among poor children in the BSS
data. In contrast to Entwisle et al’s, we find no significant gender-socioeconomic status inter-
action effects on social/behavioral skills in the much larger and more samples available from
the ECLS-K study. The estimated interactions remain insignificant regardless of whether so-
cioeconomic status is modeled as a continuous variable, as SES quartiles, or as a dichotomous
poverty variable (see Appendix Table A1).
[Table 2 about here.]
18

Academic Achievement
Mean reading and math achievement are presented in Table 1 for each panel of the ECLS-K.
Overall, the female advantage on the reading test remains roughly constant at about .14 stan-
dard deviations from the beginning of kindergarten to the end of fifth grade.16 Kindergarten
boys have a slight lead on girls on the math test (.04 standarddeviations) at the start of kinder-
garten, and this gap grows to about 1/4 of a standard deviation by the end of fifth grade. By
way of comparison, Entwisle et al. (2007) report no gender difference in reading scores in their
BSS sample in first grade and an average difference in fifth grade of about 1/4 of a standard
deviation (18 points on the reading CAT relative to a standard deviation of 73; see Entwisle
et al. (2007), Tables 1 and A1), which is 80% larger than what we find in the ECLS-K. They
further report no gender gap in reading even in fifth grade forstudents who were not on lunch
subsidy. In the ECLS-K, in contrast, there is a persistent gender gap in reading scores from
kindergarten through fifth grade. Except at the start of kindergarten (where the gender gap is
smaller for children from poverty families), there are no significant differences in the gender
gap for either reading or math scores in the ECLS-K (see Appendix Table A2).
Table 3 reports the estimated effects of social and behavioral skills on reading and math
growth based on four different modeling strategies: OLS models with lagged social/behavioral
skills effects, IV regression with (instrumented) contemporaneous social/behavioral effects,
and fixed effects regression with alternatively contemporaneous and lagged social/behavioral
effects. For clarity, Table 3 only presents the coefficientsfor social and behavioral skills; the
full set of OLS estimated model coefficients are presented inAppendix Table A3 (the same set
of covariates is used in the IV regression and fixed effects models as well and the full set of
estimates are available upon request). Net of background factors, the contemporaneously mea-
sured social/behavioral factor and the approaches to learning residual have a strong relation-
16The gender gap in reading is stable at .14 standard deviations regardless of whether we compare respondentswho have nonmissing reading scores at the start of kindergarten and the end of fifth grade (using panel weights)or if we compare the full samples who have reading scores at the beginning of kindergarten with the full samplewho have reading scores at the end of fifth grade (in each case using cross-sectional weights).
19

ship to reading and math performance at the beginning of kindergarten. The size of the effect is
smaller in subsequent waves, which use one-panel lagged measures for social/behavioral skills
and controls for lagged reading and math scores. However, even in these models, both the so-
cial/behavioral factor and the approaches to learning residual have a significant positive effect
on both reading and math test performance. The general pattern of the coefficients is similar
for the IV and OLS estimates. Unlike Entwisle et al. (2007), we find no significant difference
between the academic returns to social and behavioral skills for girls and for boys.Appendix
Table A4 shows statistical tests for gender differences in the effects of social/behavioral skills
on reading and math test scores, academic rating scales, andretention. In every case, we can-
not reject the hypothesis of no difference using the full setof dependent variables as in our
other analyses.Because the effects do not vary significantly by gender, we restrict attention to
main-effects models for the rest of this paper.
A more stringent test of the effects of social/behavioral skills on academic outcomes is
afforded by the use of student-level fixed effects models. These models remove all stable in-
dividual characteristics including any stable relationship between social/behavioral skills and
academic outcomes from the calculation under the (strong) assumption that the effect of growth
in social/behavioral skills does not vary by grade. There isa highly significant contemporane-
ous relationship between (relative) growth in social/behavioral skills and growth in cognitive
skills. This is doubtless an overestimate of the causal effect of social/behavioral skills on aca-
demic growth; the contemporaneous relationship might be due to effects of academic skill
growth on improved social/behavioral skills, or somethingelse about the student (biological
events, the death of a loved one, etc.) which causes both social/behavioral and cognitive mea-
sures to change in the same direction. On the other hand, the one-period lagged fixed effects
models probably underestimate the effects of social/behavioral skills on academic outcomes
(see footnote 13). The contemporaneous fixed effect estimates are larger than the IV contem-
poraneous effect estimates in fifth grade but generally smaller than the effect estimates for
other grades. The fixed effects lagged estimates are between40% and 2/3 the magnitude of the
20
contemporaneous estimates for social/behavioral skills,with the effect remaining significant
for math outcomes but not for reading.
[Table 3 about here.]
Next, we address the total contribution of social and behavioral skills to the gender gaps in
math and reading between fifth grade and the beginning of kindergarten, the end of first grade,
and the end of third grade, respectively.17 The results that we obtain are very similar regardless
of whether we use OLS or IV regression. Based on the OLS results, we obtained as a point
estimate that the female advantage in social development atthe start of kindergarten accounts
for 46% of the female advantage in reading at the end of fifth grade, and that the math gap
would be 28% larger but for the female advantage in social/behavioral skills. If we instead base
the calculations on IV regression estimates from the end of kindergarten, we obtain similar but
slightly smaller contributions of social and behavioral skills to cognitive achievement (34%
for reading, 21% for math). The closer in time we move to fifth grade, the smaller is the
contribution of social and behavioral skills as more of thiseffect becomes indirect through its
impact on intermediate academic outcomes. These decomposition results, to repeat, are based
on OLS and IV estimates. The fixed effects models concern the evolution of within-student
trajectories, but there is no clear upward trend in reading test scores for girls relative to boys
between kindergarten and fifth grade. The math test score gender gap, in contrast, develops
between the start of kindergarten and the end of fifth grade. The lagged and contemporaneous
fixed effects results imply the math gap would be 21% and 38% larger respectively but for the
female advantage in social/behavioral skills between the start of kindergarten and the end of
fifth; these results bracket the OLS estimates for the same period of time.
[Table 4 about here.]
17In light of the general lack of significant interactions between gender and the other variables in our models,we computed the decomposition based on a pooled regression over both genders (Neumark, 1988; Jann, 2008).
21

Social/Behavioral Skills, Retention, and Teacher Academic Ratings
Measures of social and behavioral skills are strongly related to other outcomes besides test
scores, and they statistically account for a considerable portion of gender differences on these
outcomes. One such important outcome is retention in grade.In the ECLS-K, 16.4% of boys
vs. 12.2% of girls have been retained by the start of 5th grade, with particularly large gender
differences in retention for kindergarten and first grade.We estimated instrumental variables
probit regressions where we instrumented the spring social/behavioral measures and test scores
based on measures from earlier points in time.18 These results (see Table 6) show that low
social and behavioral scores strongly predict retention. Net of social/behavioral and academic
scores, girls are significantly less likely to be retained inkindergarten than are boys. However,
at the end of first grade, the gender difference in retention rates is entirely explained by gender
differences in social/behavioral scores and in reading. Bythe end of third grade, the male
disadvantage in retention has disappeared, but social and behavioral skills continue to strongly
predict the probability of retention.
[Table 5 about here.]
[Table 6 about here.]
A second teacher-rated set of academic outcome measures arethe academic rating scales
(ARS). Unlike with reading scores, the gender gap in readingARS scores continues to grow
between kindergarten and fifth grade (from .22 to .32 standard deviations), and as with math test
scores, the math ARS trend is favorable to boys, though it only brings them from a deficit of .15
standard deviations in kindergarten to parity in fifth grade(results not shown). Table 7 shows
the average outcomes of girls and boys in the ECLS on standardized math and reading tests, on
standardized teacher evaluations of math and reading competencies, and on their standardized
social and behavioral skills as reported two years earlier by their third grade teachers. While
18For statistical reasons, we estimated these models using multiple imputation on unweighted samples. Theresults are very similar to what we obtain when we estimated these models with instrumental variables regressionusing weights, stratification, and clustering information.
22

fifth grade teacher evaluations are not the same as formal grades, the results in Table 7 mirror
other results (Entwisle et al., 1997; Entwisle et al., 2007)in showing that the gender gaps in
teacher evaluations of reading and math achievement are notably larger (in favor of girls) than
are the gender gaps in reading and math test scores. Table 7 also shows predicted teacher
fifth grade evaluations based on a set of background variables, fifth grade reading and math
test scores, and the evaluations two years earlier of the student’s social and behavioral skills.19
Finally, Table 7 reports the predicted evaluations that boys would have if they had received
the same average social/behavioral ratings as girls two years later. The gender gap in social
and behavioral skills is large enough to explain almost the entire additional gender gap in
teacher reading evaluations over reading test scores, and it also explains most of the difference
between the considerable male advantage in math test scoresand the virtual gender tie on
teacher evaluations of mathematics performance.
[Table 7 about here.]
Discussion
Our results demonstrate that social and behavioral skills are an important resource for school
success in elementary school, both as measured on cognitivetests and even more so by teacher
evaluations. Girls have a considerable lead over boys in these skills, and they extend this lead
further over the first six years of schooling. This female advantage in social and behavioral
skills accounts for an important component of the gender academic advantage in elementary
school. Other research shows that the female advantage in academic achievement persists into
middle school, high school, and college, and may be the single most important factor underly-
ing the significant lead that women have over men in rates of college completion (Buchmann
and DiPrete, 2006). The reason for the growing gender gap maylie in changes over the past
forty years in labor market opportunities for women, in changing life course risks for marriage
19These predictions were made using instrumental variables regression with lagged instruments for both testscores and social/behavioral skills.
23

and divorce, and in the changing connection between these risks and education. But given
the current environment, the production of female educational advantage appears to begin at
the very start of the school career, when girls and boys enterthe school systems with average
differences in social and behavioral skills that are largerthan the differences we find between
children who live in poverty and those who do not. Thus, whilesocial and behavioral skills
used to function like other skills in creating a life course advantage for children born to upper
middle class households, they now have a double effect, of preserving advantage for one popu-
lation even as they allow another historically disadvantaged group – women – to overtake men
in the acquisition of the single most important resource in the stratification system of a modern
industrial country, namely education.
Duncan et al. (2007) recently argued that early test scores have much bigger effects on
subsequent test scores than do social and behavioral skills. We agree with this conclusion,
but this does not undermine the importance of these skills for the size of the gender gap. The
apparent tension between our conclusions and those of Duncan et al partly stems from our focus
on gender instead of individual-level differences and partly (we believe) from the way they
interpret coefficients. As noted earlier, Duncan et al. makea strong distinction between what
they call “attention” skills and what they call “socioemotional” skills. They find that “ability
to pay attention” effect are moderate in size but that the effects of “socioemotional skills” are
rarely significant. However, the ECLS-K does not have a pure measure of “attention” skills as
opposed to “socioemotional” skills. Instead, the “approaches to learning” scale consists of a
series of questions about “the child’s attentiveness, taskpersistence, eagerness to learn, learning
independence, flexibility, and organization” and two otherscales (self-control and interpersonal
skills) jointly concern “respecting the property rights ofothers, controlling temper, accepting
peer ideas for group activities, responding appropriatelyto pressure from peers, skill in forming
and maintaining friendships, getting along with people whoare different, comforting or helping
other children, expressing feelings, ideas and opinions inpositive ways, and showing sensitivity
to the feelings of others.” Several of the items in “approaches to learning” do not involve
24
“ability to pay attention,” and some items within the “approaches to learning” scale do involve
“socioemotional skills,” as do items on the self-control and interpersonal skills scales. Even
“ability to pay attention” is partly determined by one’s level of emotional self-regulation. As a
statistical matter, we find that approaches to learning is correlated with the other two scales and
so we prefer the two-dimensional solution that we used in ourmodels. As a theoretical matter,
it is important to disentangle the skills that allow some children to bring a mental organization,
an eagerness to learn (including to please the teacher through the quality of one’s work), a
drive to follow instructions, an ability to participate effectively in class and (in the process) to
“get along” with the teacher as well as with the other students in the classroom. This broad
set of skills certainly involves more than “cognitive attention,” but establishing the full set of
dimensions that underlie this complex of skills will require more research with better data.20
Our results are consistent with those of Entwisle et al. (2007) in demonstrating that behavior
plays a strong role in producing gender differences in educational outcomes. Our results differ
from theirs in two important ways. First, while Entwisle et al. found that the gender gap
in reading test scores emerged late in elementary school andis characteristic only of poor
children, we find gender gaps in both reading and math test scores across the socioeconomic
distribution that are present as early as the beginning of kindergarten and that do not vary by
socioeconomic status. Second, while Entwisle et al. reportthat gender gaps in social and
behavioral skills were limited to poor children, we find gapsbetween male and female social
and behavioral skills across the socioeconomic spectrum. The difference between our results
and theirs may be a function of the BSS study’s focus on Baltimore, or of the earlier time
period (the 1980s) in which the data were collected. Certainly the gender-specific link between
class and educational attainment has varied enormously in the past sixty years (Buchmann and
DiPrete, 2006), and this historically-varying relationship might manifest itself in elementary
school as well as in late adolescence.
The social constructivist perspective largely sees unequal social/behavioral scores by race,
20In this context, it is unfortunate that the NCES is not able torelease the items underlying the five so-cial/behavioral scales to allow a more thorough study of this issue.
25

class, and gender as evidence of teacher favoritism, that schools have different expectations
for girls and boys, and that –to again quote Entwisle et al. (2007) – girls “find the student
role more compatible than boys do” (p. 134). Based on our results, we conclude that the
social constructivist treatment of social/behavioral skill differences primarily as evidence of
differences in teacher evaluation criteria – i.e., teacherbias – needs to be questioned. Only
a very small (about 5%) of the variance in rated social/behavioral skills is between gender,
and gender, race/ethnicity and poverty status together account for 10% or less of the variance.
Moreover, the effects of social/behavioral skills on teacher ratings are statistically indistin-
guishable between boys and girls (see Table A4) and (as we findin supplementary analyses)
between poverty and nonpoverty children in the ECLS-K. In other words, students with higher
social and behavioral skills than others of their same gender, class, and race generally score
higher on achievement tests and receive higher teacher academic evaluations. Social and be-
havioral skills are not simply a proxy for gender, class, or race differences, even if the school
environment itself is shaped in part by cultural forces related to gender, class, and race. Even
within groups defined by gender, class, and race, children who find the (socially constructed)
student role to be highly “compatible” seem to be placed in a more advantageous position to
learn in school relative to their peers.
Our results imply the need to distinguish analytically between three theoretically distinct
aspects of the education and evaluational process:
1. Conduct-dependent grading. Conduct-dependent gradingwould occur when teachers
give better grades to students whose behavior conforms better to their expectations, net
of their academic performance. This corresponds to what other scholars have termed
“teacher bias” (Alexander et al., 1987; Farkas et al., 1990).
2. “Well-rounded” (as opposed to narrow) academic evaluation criteria. Well-rounded cri-
teria involve academic evaluation that gives greater credit to neatly done homework that
is turned in on time, to class participation, and to other aspects of performance that may
be differentially enhanced through better social/behavioral skills. Narrow evaluation, in
26
contrast, gives greater or total weight to performance on tests.
3. A socially-enhanced (as opposed to socially neutral) learning environment. A socially-
enhanced learning environment is one where the classroom isorganized in such a way
that learning (even as measured narrowly by objective tests) is materially enhanced for
those who behave in a way that is maximally compatible with the institutionalized stu-
dent role. Such an environment may involve the teacher focusing more attention on
students who display a greater eagerness to learn or greateraffection for the teacher or a
greater willingness to obey the classroom conduct rules. Itcould instead involve the use
of group-learning environments where a willingness to participate actively or otherwise
show engagement in the group produces enhanced learning.
All three of these aspects of the education process – the question of conduct-dependent grad-
ing, the breadth of the academic evaluation criteria, and the nature of the learning environment–
will strengthen the correlation between a student’s conduct and that student’s grades. All three
aspects, moreover, can involve feedback loops. When the feedback runs from teacher bias to
lowered self-evaluation, reduced effort and subsequent lower academic performance, the loop
involves what Farkas et al termed a “self-fulfilling prophecy” and which in the more recent liter-
ature has been termed a “stereotype threat” (Spencer et al.,1999). When the feedback instead
runs through a heightened ability to perform in a “socially-enhanced learning environment”
that uses “well-rounded” academic evaluation criteria, the mechanism is the “cumulative ex-
posure” form of a cumulative advantage process (DiPrete andEirich, 2006). All three of these
aspects, finally, factor into what Farkas et al. (1990) referred to as the “double reward” for
school attendance and work habits: social/behavioral skills can factor directly into the evalu-
ation process because grading is conduct-dependent, indirectly because teachers grade based
on “well-rounded” criteria, and indirectly because the typical classroom learning environment
produces higher learning for students who have requisite conduct and work habits.
Teacher academic ratings are even more strongly affected bysocial and behavioral skills
than are test scores. Because social and behavioral skills are also “evaluated” by the teachers
27

(quite literally so in the ECLS-K), it is possible that the teacher’s evaluations of academic
achievement are biased upward for students that they evaluate as being well adjusted to the
school environment. However, it is equally possible that educationally committed and well-
behaved students gain an advantage from the use of “well-rounded” evaluation criteria as well
as from the better fit of their skills with the learning environment of the classroom.
This advantage can readily be seen in the criteria that teachers are asked to use when con-
structing their academic rating in the ECLS-K. Fifth grade teachers were specifically asked to
rate reading achievement on criteria that include the presentation of oral reports using logically
organized outlines, the ability to use vocal inflection, facial expression and appropriate pacing
to increase listener interest, the use of multiple sources to gain information, the taking of good
notes when collecting information for reports, the writingof well-organized reports, and the
revising of writing to improve organization, increase clarity, and correct errors. These behav-
iors would readily seem to be more consistently produced by students who have higher levels
of commitment to learning, better organization, stronger interpersonal skills, and better ability
to accept feedback without getting angry. More direct evidence is supplied from the litera-
ture on elementary school grading, which makes clear that elementary teachers typically take
into account student effort, the production of homework, and broader types of performance as-
sessment than multiple choice tests when assigning grades (McMillan et al., 2002; Brookhart,
1993).
In our opinion, the “pure bias” explanation was more plausible when the conduct penalty
centered on boys of lower socioeconomic status. But in the ECLS-K data, class plays a com-
paratively minor role in the link between social/behavioral skills and academic outcomes, and
the gender gap in performance is readily apparent for middleclass children as well as disadvan-
taged children. The ECLS-K data also reveal a social/behavioral skill gap between Asian and
other students, and even (net of other factors) between students whose language at home was
not English and other factors. The parsimonious story that middle-class female teachers tend to
favor students like themselves (i.e., middle class girls) does not carry over well to the pattern of
28

differences in rated social/behavioral skills found in theECLS-K. We do not deny the existence
of teacher bias, but read the results to suggest that the linkbetween social/behavioral skills and
academic outcomes (particularly teacher academic evaluations) is flowing largely through a
direct connection between social/behavioral skills and learning, and through the link between
social/behavioral skills and more diligent production of homework and other classroom exer-
cises that factor into the teacher’s evaluation. The superior social and behavioral skills of girls
would therefore produce a stronger female advantage in course grades determined through the
use of “well-rounded” academic evaluative criteria. Indeed, Hoxby (2000) used exogenous
variation in classroom composition to show that boys as wellas girls gain on both math and
reading achievement from having more girls in the classroom, while Whitmore (2005) ob-
tains similar findings for first and second grades using data from the Tennessee Project STAR
experiment. If the greater social and behavioral skills of girls produce spillover effects on stan-
dardized tests for both girls and boys, it would seem that thegains that students (whether boy
or girl) with high social and behavioral skills produce for themselves are something more than
pure bias in teacher evaluation.
Should teachers use “well-rounded” as opposed to “narrow” criteria when they evaluate stu-
dents? In some historical contexts, evaluative criteria have clearly been manipulated in order
to produce an intended result; thus, the Harvard, Yale, and Princeton modified their admis-
sions criteria early in the 20th century to favor “well-rounded” applicants in order to reduce
the number of Jewish and other ethnic students who would gainadmission (Karabel, 2005).
Evaluation criteria may instead be shaped either consciously or unconsciously to match antic-
ipated skill-demands on students in future roles. Thus (as noted above), Duncan, Featherman,
and Duncan (1972) argued that the content of IQ tests was designed to closely approximate the
cognitive skills needed to perform well in high status occupations. Specialized (and highly gen-
dered) evaluation criteria may have been applied in highly sex-segregated high school classes
in cooking or home economics early in the 20th century. Indeed, to the extent that teachers
believe that the teaching of social and behavioral skills – especially in early elementary grades
29
– is an important part of their job, then social and behavioral skills would be expected to play
an important role in the overall evaluation process. These considerations suggest that the im-
pact of social and behavioral skills on academic performance as well as the size of the gender
gap in academic performance is historically variable, a product of the particular institutional
environment of the time. This does not make the connections between social/behavioral skills
and academics any less real, but it does point to the importance of better understanding how
and why these connections exist.
Our results also highlight the subtle interconnections between inequalities based on social
class, race, and gender. The linkage between class and gender differences found in the Bal-
timore Beginning School Study are largely absent in the ECLS-K. This would seem to be a
puzzle in light of the apparent connection between class andthe gender gap in educational
attainment (King, 2000). However, Buchmann and DiPrete (2006) found that a large social
class component to the gender-specifictrend in attainment did not imply that the gender gap
was equally strongly structured by class at every cohort. The ECLS-K results could imply that
when cohorts born in the middle 1990s finish their schooling,we may see (if current trends
continue) even a larger gender gap in educational attainment than we see at present, but rela-
tively modest differences in this gender gap across the socioeconomic spectrum. Alternatively,
it could be that a relatively small gender gap at the top of thesocioeconomic spectrum will be
maintained through other mechanisms than class-specific gender differences in the production
of social and behavioral skills. Additional data from cohort studies at older ages are needed to
answer this question.
The large and growing gender gap in education is almost certainly lowering the level of
gender inequality in American society, but at the same time,it may indicate a deficient cohort-
level supply of educational skills, which would both retardeconomic growth and heighten
economic inequality. To the extent that stagnant levels of educational attainment by successive
cohorts of American males are related to their distributionof social and behavioral as well as
cognitive skills, the determination of strategies by whichboth schools and families can increase
30

the prevalence of these skills should be an important goal for sociological research.
[Table 8 about here.]
[Table 9 about here.]
[Table 10 about here.]
[Table 11 about here.]
31
References
Ainsworth-Darnell, J. 1998. “Assessing the Oppositional Culture Explanation for Racial/Ethnic
Differences in School Performance.”American Sociological Review 63:536–553.
Alexander, Karl L., Doris R. Entwisle, and Susan L. Dauber. 2003. On the Success of Failure:
A Reassessment of the Effects of Retention in the Early Grades. New York: Cambridge
University Press.
Alexander, Karl L., Doris R Entwisle, and Maxine S. Thompson. 1987. “School Performance,
Status Relations, and the Structure of Sentiment: Bringingthe Teacher Back In.”American
Sociological Review 52:665–82.
Barriga, A.Q., J.W. Doran, S.B. Newell, E.M. Morrison, V. Barbetti, and B. Dean Robbins.
2002. “Relationships Between Problem Behaviors and Academic Achievement in Adoles-
cents: The Unique Role of Attention Problems.”Journal of Emotional and Behavioral
Disorders 10:233–240.
Bianchi, Suzanne M. 1984. “Children’s Progress through School: A Research Note.”Sociology
of Education 57:184–92.
Borghans, Lex, Angela L. Duckworth, James J. Heckman, and Bas Ter Weel. 2008. “The
Economics and Psychology of Cognitive and Non-Cognitive Traits.” Journal of Human
Resources .
Bourdieu, Pierre. 1984.Distinction: A Social Critique of the Judgement of Taste. Cambridge,
MA: Harvard University Press.
Bowles, S. and H. Gintis. 1976.Schooling in Capitalist America: Educational Reform and the
Contradictions of Economic Life. New York: Basic Books.
Bowles, S., H. Gintis, and M. Osborne. 2001. “The Determinants of Earnings: A Behavioral
Approach.”Journal of Economic Literature 39:1137–1176.
32
Brewster, K.L. and I. Padavic. 2000. “Change in Gender-Ideology, 1977-1996: The Contri-
butions of Intracohort Change and Population Turnover.”Journal of Marriage and Family
62:477–487.
Brookhart, Susan M. 1993. “Teachers’Grading Practices: Meaning and Values.”Journal of
Educational Measurement 30:123–142.
Buchmann, Claudia and Thomas A. DiPrete. 2006. “The GrowingFemale Advantage in Col-
lege Completion: The Role of Family Background and AcademicAchievement.”American
Sociological Review 71:515–541.
Buchmann, Claudia, Thomas A. DiPrete, and Anne McDaniel. 2008. “Gender Inequalities in
Education.”Annual Review of Sociology 34:319–337.
Burbridge, Lynn C. 1991. “The Interaction of Race, Gender, and Socioeconomic Status in
Education Outcomes.” Wellesley: Wellesley College Centerfor Research on Women.
Carlin, John B., John C. Galati, and Patrick Royston. 2008. “A new framework for managing
and analyzing multiply imputed data in Stata.”Stata Journal 8:49.
Carneiro, Pedro and James J. Heckman. 2003. “Human Capital Policy.” In Inequality in
America: What Role for Human Capital Policies?, edited by J.J. Heckman, A.B. Krueger,
and B.M. Friedman, pp. 77–241. Cambridge, MA: MIT Press.
Cawley, J., J. Heckman, and E. Vytlacil. 2001. “Three observations on wages and measured
cognitive ability.” Labour Economics 8:419–442.
Chatterji, Madhabi. 2006. “Reading Achievement Gaps, Correlates, and Moderators of Early
Reading Achievement: Evidence From the Early Childhood Longitudinal Study (ECLS)
Kindergarten to First Grade Sample.”Journal of Educational Psychology 98:489–507.
Coie, J.D. and G. Krehbiel. 1984. “Effects of Academic Tutoring on the Social Status of Low-
Achieving, Socially Rejected Children.”Child Development 55:1465–78.
33

Cunha, F., J. Heckman, L. Lochner, and D.V. Masterov. 2006. “Interpreting the Evidence on
Lifecycle Skill Formation.” InHandbook of the Economics of Education, edited by E.A.
Hanushek and F. Welch, pp. 697–812. North Holland: Elsevier.
Davis, J. 2003. “Early Schooling and Academic Achievement of African American Males.”
Urban Education .
Dehaene, S. 1997.The Number Sense: How the Mind Creates Mathematics. New York: Oxford
University Press.
DiPrete, T.A. and G.M. Eirich. 2006. “Cumulative Advantageas a Mechanism for Inequality:
A Review of Theoretical and Empirical Developments.”Annual Review of Sociology 32:271.
DiPrete, Thomas A., Anne McDaniel, Claudia Buchmann, and Uri Shwed. 2009. “Race and
the Growing Female Advantage in Educational Attainment: A Trend Comparison.” Working
Paper. Columbia University Population Research Center.
Dolan, LJ, SG Kellam, CH Brown, L. Werthamer-Larsson, GW Rebok, LS Mayer, J. Laudolf,
JS Turkkan, C. Ford, and L. Wheeler. 1993. “The short-term impact of two classroom-based
preventive interventions on aggressive and shy behaviors and poor achievement.”Journal of
Applied Developmental Psychology 14:317–345.
Downey, Douglas B. and A.S. Vogt Yuan. 2005. “Sex differences in school performance during
high school: Puzzling patterns and possible explanations.” Sociological quarterly 46:299–
321.
Duckworth, A.L. and M.E.P. Seligman. 2005. “Self-Discipline Outdoes IQ in Predicting Aca-
demic Performance of Adolescents.”Psychological Science 16:939–944.
Dumais, Susan. 2005. “Accumulating Adversity and Advantage on the Path to Postsecondary
Education: An Application of a Person-Centered Approach.”Social Science Research
34:304–332.
34

Duncan, Greg J., Chantelle J. Dowsett, Amy Claessens, Katherine Magnuson, Aletha C. Hus-
ton, Pamela Klebanov, Linda S. Pagani, Leon Feinstein, MimiEngel, Jeanne Brooks-Gunn,
Holly Sexton, and Kathryn Duckworth. 2007. “School Readiness and Later Achievement.”
Developmental Psychology 43:1428–1446.
Duncan, Otis D., David L. Featherman, and Beverly Duncan. 1972. Socioeconomic Back-
ground and Achievement. New York: Seminar Press.
Entwisle, D.R. and K.L. Alexander. 1989. “Early schooling as a "critical period" phenomenon.”
Sociology of Education and Socialization 8:27–55.
Entwisle, D.R., K.L. Alexander, and L.S. Olson. 2005. “First Grade and Educational Attain-
ment by Age 22: A New Story.”American Journal of Sociology 110:1458–1502.
Entwisle, D.R., K.L. Alexander, and L.S. Olson. 2007. “Early Schooling: The Handicap of
Being Poor and Male.”Sociology of Education 80:114–138.
Entwisle, Doris R., Karl L. Alexander, and Linda Steffel. Olson. 1994. “The gender gap in
math: its possible origins in neighborhood effects.”American Sociological Review 59:822–
838.
Entwisle, Doris R., Karl L. Alexander, and Linda Steffel. Olson. 1997.Children, schools, and
inequality. Boulder, Colo.: Westview Press.
Fan, X. and M. Chen. 2001. “Parental Involvement and Students’ Academic Achievement: A
Meta-Analysis.”Educational Psychology Review 13:1–22.
Farkas, George. 1996.Human Capital or Cultural Capital? Ethnicity and Poverty Groups in
an Urban School District. Hawthorne, NY: Aldine de Gruyter.
Farkas, George. 2003. “Cognitive Skills and Noncognitive Traits and Behaviors in Stratifica-
tion Processes.”Annual Review of Sociology 29:541–562.
35

Farkas, George, Robert Grobe, David Sheehan, and Yuan Shuan. 1990. “Cultural Resources
and School Success: Gender, Ethnicity, and Poverty Groups within an Urban School Dis-
trict.” American Sociological Review 55:127–142.
Farkas, George, C Lleras, S Maczuga, and D. B. Downey. 2002. “Does oppositional culture
exist in minority and poverty peer groups? Authors’ reply.”American Sociological Review
67:148–155.
Flashman, Jennifer. 2008. “Are Black Students Punished for“Acting White”? Race, Aca-
demic Achievement, and Friendship Choices.” Paper Presented at the 2008 Meetings of the
Population Association of America.
Frick, P.J. 1991. “Academic Underachievement and the Disruptive Behavior Disorders.”Jour-
nal of Consulting and Clinical Psychology 59:289–94.
Gilliam, W.S. 2005. “Prekindergarteners Left Behind Expulsion Rates in State Prekindergarten
Systems.”
Graue, M. Elizabeth and James DiPerna. 2000. “Redshirting and Early Retention: Who Gets
the Gift of Time and What are its Outcomes?”American Educational Research Journal
37:509–534.
Halpern, D.F. 1997. “Sex Differences in Intelligence: Implications for Education.”The Amer-
ican Psychologist 52:1091–1101.
Halpern, D.F. 2000.Sex Differences in Cognitive Abilities. Mahwah, NJ: Lawrence Erlbaum
Associates.
Heckman, James J. and D.V. Masterov. 2007. “The Productivity Argument for Investing in
Young Children.”Review of Agricultural Economics 29:446–493.
Heckman, James J. and Y. Rubenstein. 2001. “The Importance of Noncognitive Skills: Lessons
from the GED Testing Program.”American Economic Review 91:145–149.
36

Heckman, James J., J. Stixrud, and S. Urzua. 2006. “The Effects of Cognitive and Noncognitive
Abilities on Labor Market Outcomes and Social Behavior.”Journal of Labor Economics
24:411–482.
Holland, S.H. 1992. “Same Gender Classes in Baltimore: How to Avoid Problems Faced in
Detroit/Milwaukee.”Equity and Excellence pp. 93–.
Hoxby, Caroline M. 2000. “Peer Effects in the Classroom: Learning from Gender and Race
Variation.” NBER Working Paper .
Jackson, James and James III Moore. 2008. “Introduction: The African American Male Crisis
in Education: A Popular Media Infatuation or Needed Public Policy Response.”American
Behavioral Scientist 51:847–853.
Jann, Ben. 2008. “A Stata implementation of the Blinder-Oaxaca decomposition.”Stata Jour-
nal 8:453–480.
Karabel, Jerome. 2005.The Chosen: The Hidden History of Admission and Exclusion at
Harvard, Yale, and Princeton. New York: Houghton Mifflin.
King, Jacqueline E. 2000. “Gender Equity in Higher Education: Are Male Students at a Dis-
advantage?” Washington, D.C.: American Council on Education.
Lackey, P.N. 1989. “Adults’ Attitudes about Assignments ofHousehold Chores to Male and
Female Children.”Sex Roles 20:271–281.
Ladd, G.W., S.H. Birch, and E.S. Buhs. 1999. “Children’s Social and Scholastic Lives in
Kindergarten: Related Spheres of Influence?”Child Development 70:1373–1400.
Lareau, Annette. 2003.Unequal Childhoods: Class, Race, and Family Life. Berkeley: Univer-
sity of California Press.
Lin, H.L., F.R. Lawrence, and J. Gorrell. 2003. “Kindergarten teachers’ views of children’s
readiness for school.”Early Childhood Research Quarterly 18:225–237.
37
Little, Roderick J. A. and Donald B. Rubin. 2002.Statistical Analysis with Missing Data. New
York: Wiley.
Lopez, N. 2003.Hopeful Girls, Troubled Boys: Race and Gender Disparity in Urban Educa-
tion. Routledge.
Maccoby, E.E. and C.N. Jacklin. 1974.The psychology of sex differences. Volume 1. Stanford
University Press.
Malone, Lizabeth M., Jerry West, Kristin Denton Flanagan, and Jen Park. 2006. “The Early
Reading and Mathematics Achievement of Children Who Repeated Kindergarten or Who
Began School a Year Late.” Washington, DC: United States Department of Education Na-
tional Center for Educational Statistics.
Mandara, J. 2006. “The Impact of Family Functioning on African American Males.”Teachers
College Record 108:206–223.
McMillan, J.H., S. Myran, and D. Workman. 2002. “ElementaryTeachers’ Classroom Assess-
ment and Grading Practices.”Journal of Educational Research 95:203–13.
Mickelson, Roslyn A. 2003. “Gender, Bourdieu, and the Anomaly of Women’s Achievement
Redux.” Sociology of Education 76:373–375.
Morgan, S.L. and C. Winship. 2007.Counterfactuals and Causal Inference: Methods and
Principles for Social Research. New York: Cambridge University Press.
MTA Cooperative Group. 1999. “A 14-month randomised clinical trial of treatment strate-
gies for attention-deficit/hyperactivity disorder. The MTA Cooperative Group. Multimodal
Treatment Study of Children with ADHD.”Archives of General Psychiatry 56:1073–1086.
Murnane, Richard J., J.B. Willett, and F.S. Levy. 1995. “TheGrowing Importance of Cognitive
Skills in Wage Determination.”
38

Muter, V. 2003.Early Reading Development and Dyslexia. London: Whurr.
National Center for Education Statistics. 2007.Digest of Education Statistics. Washington,
DC: National Center for Education Statistics.
Neumark, David. 1988. “Employers’ discriminatory behavior and the estimation of wage dis-
crimination.” Journal of Human Resources 23.
Noguera, P.A. 2003. “The Trouble with Black Boys:: The Role and Influence of Environmental
and Cultural Factors on the Academic Performance of AfricanAmerican Males.” Urban
Education 38:431–459.
Normandeau, S. and F. Guay. 1998. “Preschool Behavior and First-Grade School Achieve-
ment: The Mediational Role of Cognitive Self-Control.”Journal of Educational Psychology
90:111–121.
Penner, Andrew M and Marcel Paret. 2009 (forthcoming). “Gender Differences in Mathematics
Achievement: Exploring the Early Grades and the Extremes.”Social Science Research .
Perkins, Robert, Brian Kleiner, Stephen Roey, and Janis Brown. 2004. the High School Tran-
script Study: A Decade of Change in Curricula and Achievement, 1990-2000. Washington,
DC: U.S. Department of Education.
Raffaelli, M., L.J. Crockett, and Y.L. Shen. 2005. “Developmental Stability and Change in Self-
Regulation From Childhood to Adolescence.”The Journal of Genetic Psychology 166:54–
76.
Raver, CC, R. Smith-Donald, T. Hayes, and SM Jones. 2005. “Self-regulation across differing
risk and sociocultural contexts: Preliminary findings fromthe Chicago School Readiness
Project.” Biennial meeting of the Society for Research in Child Development, Atlanta, GA.
Ready, D.D., L.F. LoGerfo, D.T. Burkam, and V.E. Lee. 2005. “Explaining Girls’ Advantage
39

in Kindergarten Literacy Learning: Do Classroom BehaviorsMake a Difference?” The
Elementary School Journal 106:21–38.
Rosenbaum, James E. 2001.Beyond college for all : career paths for the forgotten half . New
York: Russell Sage Foundation.
Rutter, M., A. Caspi, D. Fergusson, L.J. Horwood, R. Goodman, B. Maughan, T.E. Moffitt,
H. Meltzer, and J. Carroll. 2004. “Sex Differences in Developmental Reading Disability New
Findings From 4 Epidemiological Studies.”Journal of the American Medical Association
291:2007–2012.
Spelke, E.S. 2005. “Sex Differences in Intrinsic Aptitude for Mathematics and Science?: A
Critical Review.” American Psychologist 60:950–958.
Spelke, E.S. and E.L. Newport. 1998. “Nativism, empiricism, and the development of knowl-
edge.”Handbook of child psychology 1:275–340.
Spencer, Stephen J., Claude M. Steele, and Diane M. Quinn. 1999. “Stereotype Threat and
Women’s Math Performance.”Journal of Experimental Social Psychology 35:4–28.
Steinberg, L., SM Dornbusch, and BB Brown. 1992. “Ethnic differences in adolescent achieve-
ment. An ecological perspective.”American Psychologist 47:723–9.
Tach, L.M. and G. Farkas. 2006. “Learning-related behaviors, cognitive skills, and ability
grouping when schooling begins.”Social Science Research 35:1048–1079.
Trzesniewski, K.H., T.E. Moffitt, A. Caspi, A. Taylor, and B.Maughan. 2006. “Revisiting the
Association Between Reading Achievement and Antisocial Behavior: New Evidence of an
Environmental Explanation From a Twin Study.”Child Development 77:72–88.
Urzua, S. 2006. “The effects of cognitive and noncognitive skills on racial and ethnic wage
gaps.” Unpublished manuscript, Department of Economics, University of Chicago.
40

U.S. Department of Education. 2006. “Condition of Education.” Technical report, U.S. De-
partment of Education.
Watson, C. and C. Hodges. 1991. “Educational equity and Detroit’s male academies.”Equity
and Excellence 25:90–105.
West, J., K. Denton, and L. Reaney. 2000. “The Kindergarten Year.” Washington, DC: US
Department of Education.
Westat and Educational Testing Service. 1998.ECLS-K Base Year Data Files and Electronic
Codebook. Washington: U.S. Department of Education.
White, L.K. and D.B. Brinkerhoff. 1981. “The Sexual Division of Labor: Evidence from
Childhood.” Social Forces 60:170–181.
Whitmore, D. 2005. “Resource and Peer Impacts on Girls’ Academic Achievement: Evidence
from a Randomized Experiment.”American Economic Review 95:199–203.
Willingham, W.W. and N.S. Cole. 1997.Gender and Fair Assessment. Mahwah, NJ: Lawrence
Erlbaum Associates.
Zill, N. and J. West. 2000. “Entering kindergarten: A portrait of American children when they
begin school: Findings from the Condition of Education, 2000.” Technical report, National
Center for Education Statistics, Washington, D.C.
41

Table 1: Means of Dependent Variables, Kindergarten through Fifth Grade
Boys Girls Poora Not poor Black White Hispanic Asian
ReadingBeginning of K -0.078 0.080 -0.491 0.129 -0.208 0.193 -0.417 0.236
End of K -0.082 0.085 -0.472 0.124 -0.251 0.160 -0.294 0.2581st -0.075 0.077 -0.520 0.141 -0.284 0.179 -0.307 0.2093rd -0.073 0.075 -0.680 0.197 -0.430 0.237 -0.327 0.0915th -0.061 0.063 -0.668 0.183 -0.480 0.244 -0.318 0.098
MathBeginning of K 0.005 -0.005 -0.537 0.141 -0.373 0.249 -0.421 0.131
End of K 0.033 -0.034 -0.512 0.135 -0.436 0.245 -0.367 0.1331st 0.065 -0.067 -0.547 0.148 -0.486 0.241 -0.299 0.0453rd 0.112 -0.116 -0.629 0.182 -0.555 0.252 -0.278 0.1355th 0.114 -0.118 -0.609 0.167 -0.625 0.243 -0.208 0.265
Social/Behavioral FactorBeginning of K -0.203 0.210 -0.241 0.063 -0.249 0.083 -0.039 0.026
End of K -0.199 0.205 -0.247 0.065 -0.291 0.091 -0.042 0.1161st -0.193 0.199 -0.203 0.055 -0.266 0.075 -0.004 0.1073rd -0.203 0.209 -0.281 0.082 -0.334 0.077 0.016 0.3135th -0.247 0.255 -0.276 0.076 -0.323 0.058 0.056 0.402
Approaches to LearningBeginning of K -0.209 0.215 -0.270 0.071 -0.247 0.075 -0.032 0.161
End of K -0.219 0.226 -0.270 0.071 -0.252 0.073 -0.037 0.2231st -0.193 0.198 -0.250 0.068 -0.292 0.080 -0.024 0.1973rd -0.241 0.248 -0.314 0.091 -0.280 0.070 -0.035 0.3875th -0.279 0.287 -0.330 0.090 -0.331 0.074 0.001 0.451N 5430 5440 1970b 8880 1210 6270 2000 900
aMeasured against the U.S. Census Poverty ThresholdsbSample size as of the beginning of kindergarten
42
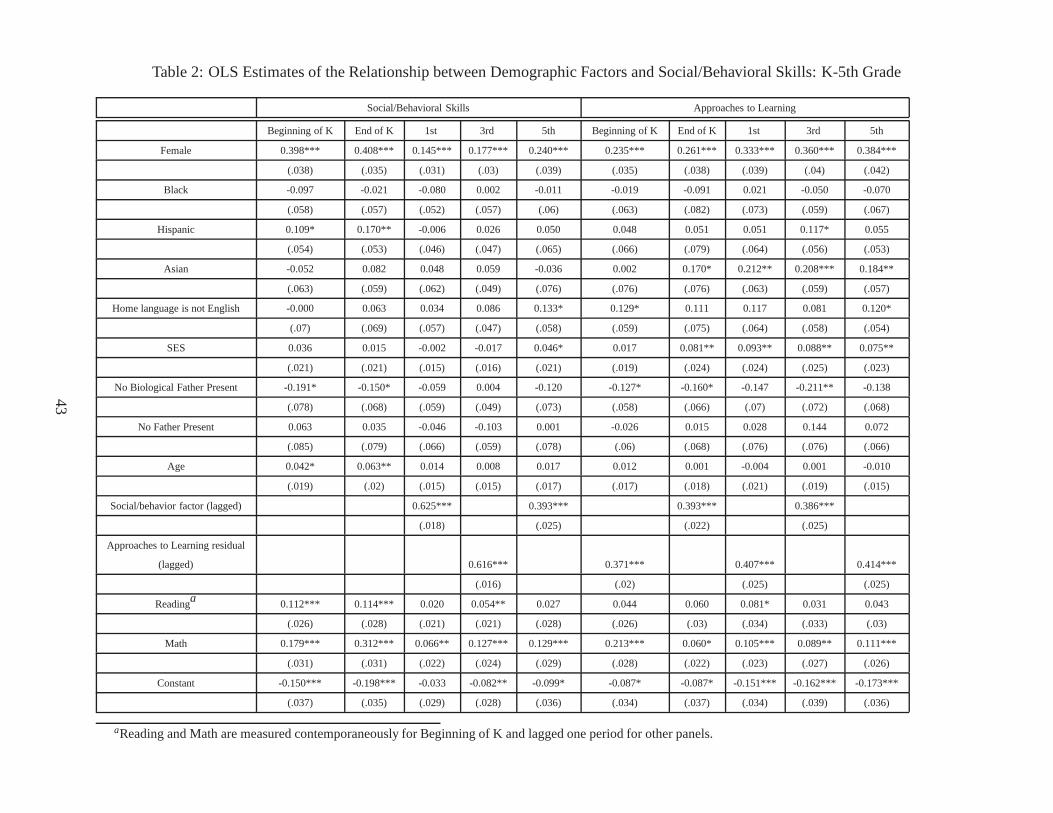
Table 2: OLS Estimates of the Relationship between Demographic Factors and Social/Behavioral Skills: K-5th Grade
Social/Behavioral Skills Approaches to Learning
Beginning of K End of K 1st 3rd 5th Beginning of K End of K 1st 3rd 5th
Female 0.398*** 0.408*** 0.145*** 0.177*** 0.240*** 0.235*** 0.261*** 0.333*** 0.360*** 0.384***
(.038) (.035) (.031) (.03) (.039) (.035) (.038) (.039) (.04) (.042)
Black -0.097 -0.021 -0.080 0.002 -0.011 -0.019 -0.091 0.021 -0.050 -0.070
(.058) (.057) (.052) (.057) (.06) (.063) (.082) (.073) (.059) (.067)
Hispanic 0.109* 0.170** -0.006 0.026 0.050 0.048 0.051 0.051 0.117* 0.055
(.054) (.053) (.046) (.047) (.065) (.066) (.079) (.064) (.056) (.053)
Asian -0.052 0.082 0.048 0.059 -0.036 0.002 0.170* 0.212** 0.208*** 0.184**
(.063) (.059) (.062) (.049) (.076) (.076) (.076) (.063) (.059) (.057)
Home language is not English -0.000 0.063 0.034 0.086 0.133* 0.129* 0.111 0.117 0.081 0.120*
(.07) (.069) (.057) (.047) (.058) (.059) (.075) (.064) (.058) (.054)
SES 0.036 0.015 -0.002 -0.017 0.046* 0.017 0.081** 0.093** 0.088** 0.075**
(.021) (.021) (.015) (.016) (.021) (.019) (.024) (.024) (.025) (.023)
No Biological Father Present -0.191* -0.150* -0.059 0.004 -0.120 -0.127* -0.160* -0.147 -0.211** -0.138
(.078) (.068) (.059) (.049) (.073) (.058) (.066) (.07) (.072) (.068)
No Father Present 0.063 0.035 -0.046 -0.103 0.001 -0.026 0.015 0.028 0.144 0.072
(.085) (.079) (.066) (.059) (.078) (.06) (.068) (.076) (.076) (.066)
Age 0.042* 0.063** 0.014 0.008 0.017 0.012 0.001 -0.004 0.001 -0.010
(.019) (.02) (.015) (.015) (.017) (.017) (.018) (.021) (.019) (.015)
Social/behavior factor (lagged) 0.625*** 0.393*** 0.393*** 0.386***
(.018) (.025) (.022) (.025)
Approaches to Learning residual
(lagged) 0.616*** 0.371*** 0.407*** 0.414***
(.016) (.02) (.025) (.025)
Readinga 0.112*** 0.114*** 0.020 0.054** 0.027 0.044 0.060 0.081* 0.031 0.043
(.026) (.028) (.021) (.021) (.028) (.026) (.03) (.034) (.033) (.03)
Math 0.179*** 0.312*** 0.066** 0.127*** 0.129*** 0.213*** 0.060* 0.105*** 0.089** 0.111***
(.031) (.031) (.022) (.024) (.029) (.028) (.022) (.023) (.027) (.026)
Constant -0.150*** -0.198*** -0.033 -0.082** -0.099* -0.087* -0.087* -0.151*** -0.162*** -0.173***
(.037) (.035) (.029) (.028) (.036) (.034) (.037) (.034) (.039) (.036)
aReading and Math are measured contemporaneously for Beginning of K and lagged one period for other panels.
43

Table 3: Estimated Effects of the Social/Behavioral Factorand the Approaches to LearningResidual on Reading and Math Test Scores, Using Four Different Estimation Methods
OLS IV contemporaneous Fixed Effects
Contemporaneous
Fixed Effects
Lagged
Reading Math Reading Math Reading Math Reading Math
End of kindergarten (same for all panels)
Social/Behavioral 0.029* 0.072*** 0.044* 0.106*** .039*** .032*** .016 .021*
Learning Residual 0.019 0.051*** 0.038 0.099*** .045*** .022* .009 .009
End of First Grade
Social/Behavioral 0.047** 0.067*** 0.057 0.106** .039*** .032*** .016 .021*
Learning Residual 0.082*** 0.094*** 0.174** 0.228*** .045*** .022* .009 .009
End of Third Grade
Social/Behavioral 0.073*** 0.066*** 0.119*** 0.047 .039*** .032*** .016 .021*
Learning Residual 0.054*** 0.080*** 0.107* 0.135* .045*** .022* .009 .009
End of Fifth Grade
Social/Behavioral 0.034*** 0.032** 0.026* 0.032** .039*** .032*** .016 .021*
Learning Residual 0.026* 0.032** 0.043 0.094* .045*** .022* .009 .009
44
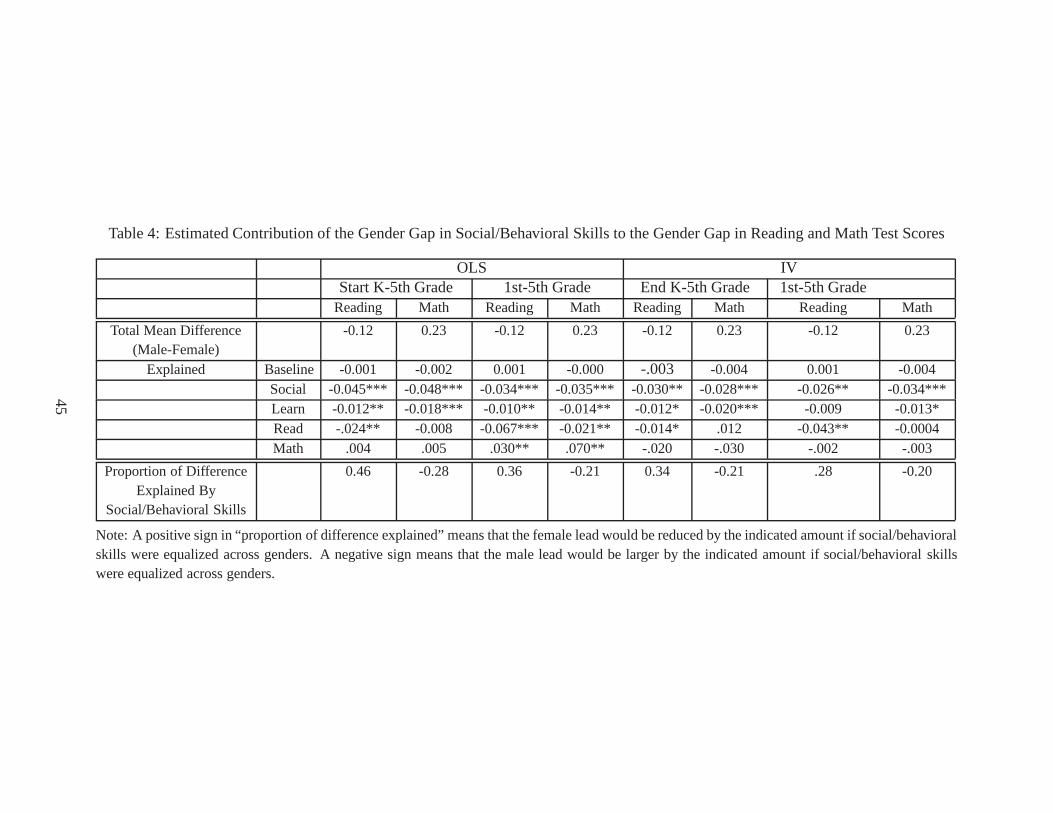
Table 4: Estimated Contribution of the Gender Gap in Social/Behavioral Skills to the Gender Gap in Reading and Math Test Scores
OLS IVStart K-5th Grade 1st-5th Grade End K-5th Grade 1st-5th Grade
Reading Math Reading Math Reading Math Reading Math
Total Mean Difference(Male-Female)
-0.12 0.23 -0.12 0.23 -0.12 0.23 -0.12 0.23
Explained Baseline -0.001 -0.002 0.001 -0.000 -.003 -0.004 0.001 -0.004Social -0.045*** -0.048*** -0.034*** -0.035*** -0.030** -0.028*** -0.026** -0.034***Learn -0.012** -0.018*** -0.010** -0.014** -0.012* -0.020*** -0.009 -0.013*Read -.024** -0.008 -0.067*** -0.021** -0.014* .012 -0.043** -0.0004Math .004 .005 .030** .070** -.020 -.030 -.002 -.003
Proportion of DifferenceExplained By
Social/Behavioral Skills
0.46 -0.28 0.36 -0.21 0.34 -0.21 .28 -0.20
Note: A positive sign in “proportion of difference explained” means that the female lead would be reduced by the indicated amount if social/behavioralskills were equalized across genders. A negative sign meansthat the male lead would be larger by the indicated amount if social/behavioral skillswere equalized across genders.
45

Table 5: Estimated Effects of the Social/Behavioral Factorand the Approaches to LearningResidual on Reading and Math Academic Rating Scales, Using Four Different EstimationMethods
OLS IV contemporaneous Fixed Effects
Contemporaneous
Fixed Effects
Lagged
Reading Math Reading Math Reading Math Reading Math
End of kindergarten (same for all panels)
Social/Behavioral .213*** .246*** .296*** .349*** .297*** .285*** .054*** .041*Learning Residual .163*** .167*** .289*** .294*** .198*** .165*** .026* .016
End of First Grade
Social/Behavioral .116*** .112*** .221** .199** .297*** .285*** .054*** .041*Learning Residual .146*** .128*** .405*** .337** .198*** .165*** .026* .016
End of Third Grade
Social/Behavioral .132*** .098** .177*** .113 .297*** .285*** .054*** .041*Learning Residual .136*** .091*** .435*** .283* .198*** .165*** .026* .016
End of Fifth Grade
Social/Behavioral .168*** .115*** .325*** .210*** .297*** .285*** .054*** .041*Learning Residual .121*** .118*** .340*** .318** .198*** .165*** .026* .016
46
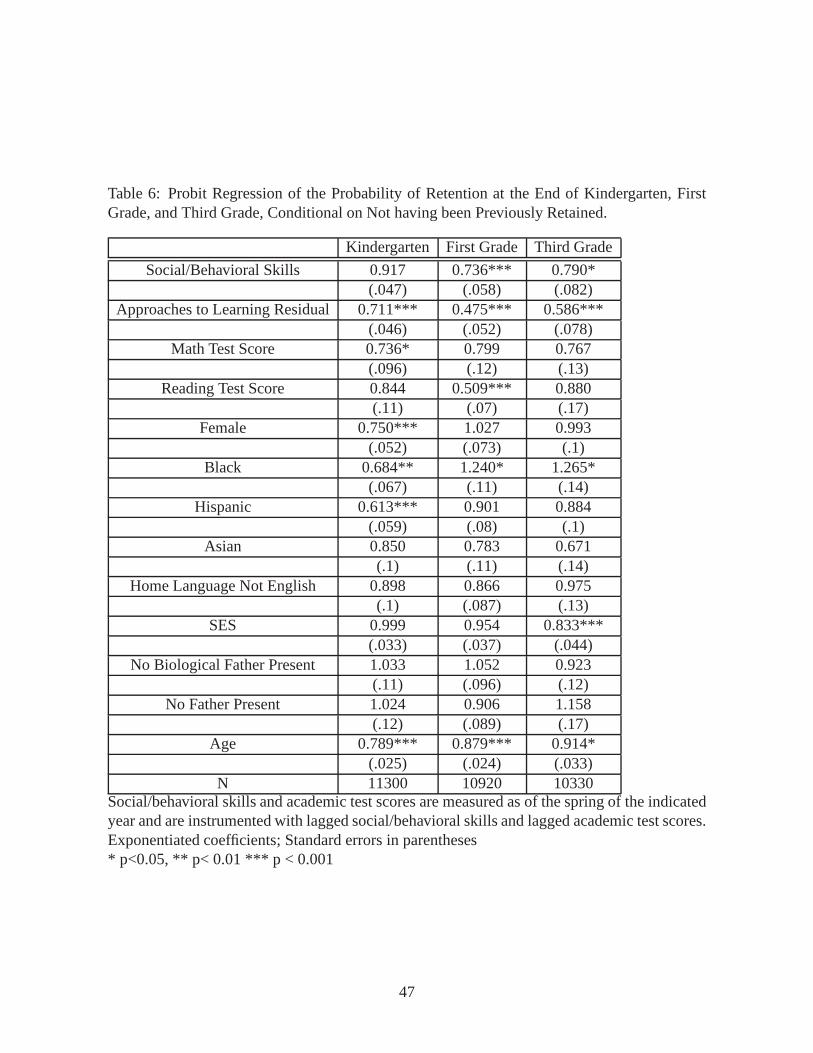
Table 6: Probit Regression of the Probability of Retention at the End of Kindergarten, FirstGrade, and Third Grade, Conditional on Not having been Previously Retained.
Kindergarten First Grade Third Grade
Social/Behavioral Skills 0.917 0.736*** 0.790*(.047) (.058) (.082)
Approaches to Learning Residual 0.711*** 0.475*** 0.586***(.046) (.052) (.078)
Math Test Score 0.736* 0.799 0.767(.096) (.12) (.13)
Reading Test Score 0.844 0.509*** 0.880(.11) (.07) (.17)
Female 0.750*** 1.027 0.993(.052) (.073) (.1)
Black 0.684** 1.240* 1.265*(.067) (.11) (.14)
Hispanic 0.613*** 0.901 0.884(.059) (.08) (.1)
Asian 0.850 0.783 0.671(.1) (.11) (.14)
Home Language Not English 0.898 0.866 0.975(.1) (.087) (.13)
SES 0.999 0.954 0.833***(.033) (.037) (.044)
No Biological Father Present 1.033 1.052 0.923(.11) (.096) (.12)
No Father Present 1.024 0.906 1.158(.12) (.089) (.17)
Age 0.789*** 0.879*** 0.914*(.025) (.024) (.033)
N 11300 10920 10330Social/behavioral skills and academic test scores are measured as of the spring of the indicatedyear and are instrumented with lagged social/behavioral skills and lagged academic test scores.Exponentiated coefficients; Standard errors in parentheses* p<0.05, ** p< 0.01 *** p < 0.001
47
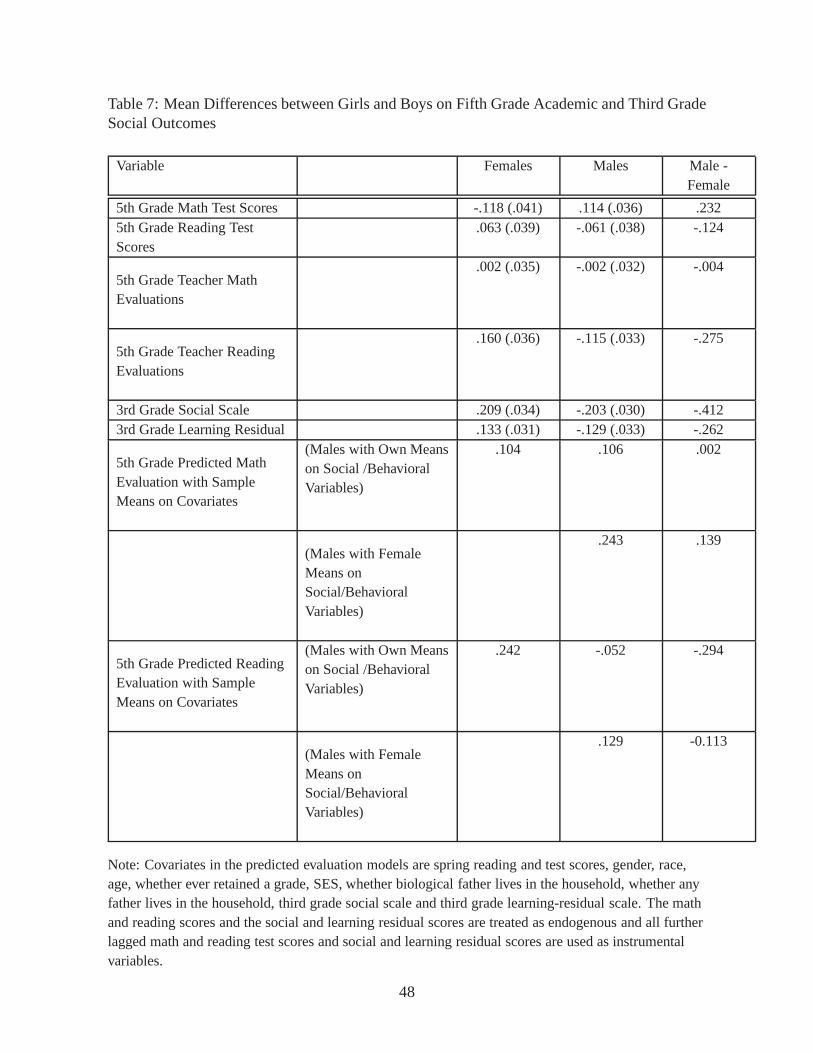
Table 7: Mean Differences between Girls and Boys on Fifth Grade Academic and Third GradeSocial Outcomes
Variable Females Males Male -Female
5th Grade Math Test Scores -.118 (.041) .114 (.036) .2325th Grade Reading TestScores
.063 (.039) -.061 (.038) -.124
5th Grade Teacher MathEvaluations
.002 (.035) -.002 (.032) -.004
5th Grade Teacher ReadingEvaluations
.160 (.036) -.115 (.033) -.275
3rd Grade Social Scale .209 (.034) -.203 (.030) -.4123rd Grade Learning Residual .133 (.031) -.129 (.033) -.262
5th Grade Predicted MathEvaluation with SampleMeans on Covariates
(Males with Own Meanson Social /BehavioralVariables)
.104 .106 .002
(Males with FemaleMeans onSocial/BehavioralVariables)
.243 .139
5th Grade Predicted ReadingEvaluation with SampleMeans on Covariates
(Males with Own Meanson Social /BehavioralVariables)
.242 -.052 -.294
(Males with FemaleMeans onSocial/BehavioralVariables)
.129 -0.113
Note: Covariates in the predicted evaluation models are spring reading and test scores, gender, race,age, whether ever retained a grade, SES, whether biologicalfather lives in the household, whether anyfather lives in the household, third grade social scale and third grade learning-residual scale. The mathand reading scores and the social and learning residual scores are treated as endogenous and all furtherlagged math and reading test scores and social and learning residual scores are used as instrumentalvariables.
48
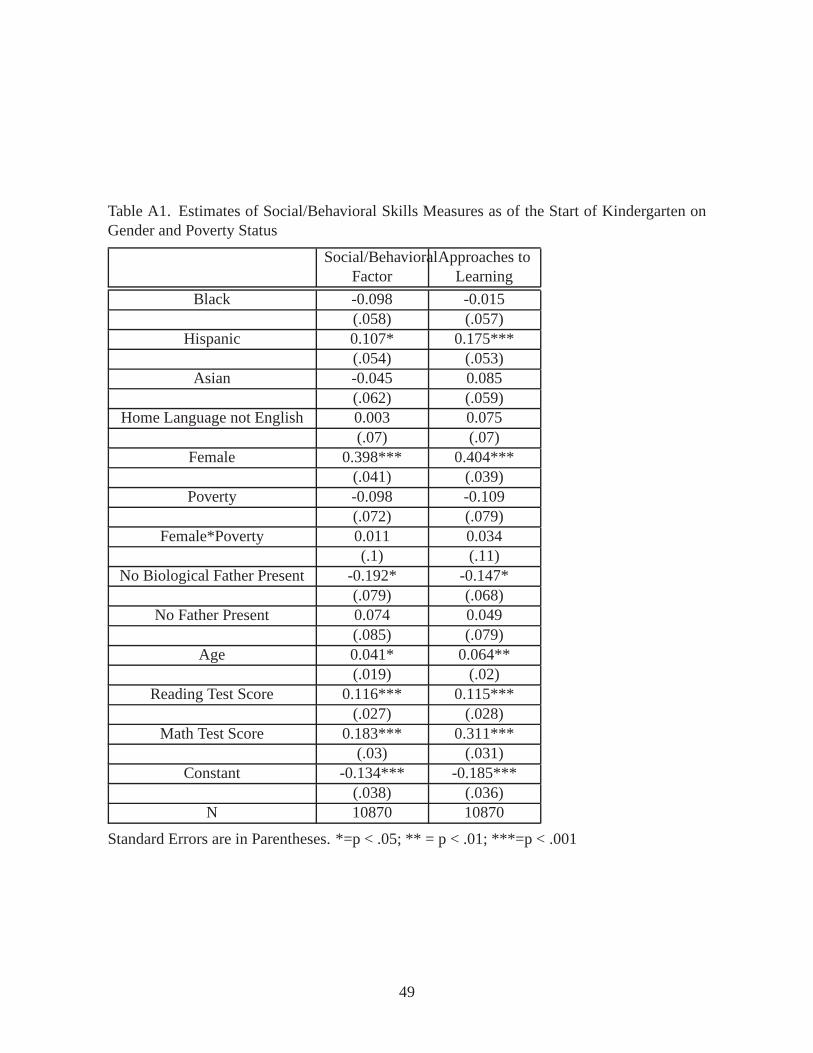
Table A1. Estimates of Social/Behavioral Skills Measures as of the Start of Kindergarten onGender and Poverty Status
Social/BehavioralFactor
Approaches toLearning
Black -0.098 -0.015(.058) (.057)
Hispanic 0.107* 0.175***(.054) (.053)
Asian -0.045 0.085(.062) (.059)
Home Language not English 0.003 0.075(.07) (.07)
Female 0.398*** 0.404***(.041) (.039)
Poverty -0.098 -0.109(.072) (.079)
Female*Poverty 0.011 0.034(.1) (.11)
No Biological Father Present -0.192* -0.147*(.079) (.068)
No Father Present 0.074 0.049(.085) (.079)
Age 0.041* 0.064**(.019) (.02)
Reading Test Score 0.116*** 0.115***(.027) (.028)
Math Test Score 0.183*** 0.311***(.03) (.031)
Constant -0.134*** -0.185***(.038) (.036)
N 10870 10870
Standard Errors are in Parentheses. *=p < .05; ** = p < .01; ***=p < .001
49

Appendix Table A2. Gender Gap in Reading and Math Test Scoresand Social BehavioralSkills, by Poverty Status
Not Poor Poor Difference
Reading Boys Girls Gap Boys Girls GapStart K 0.027 0.239 -0.213 -0.514 -0.471 -0.043 *End K 0.022 0.234 -0.212 -0.519 -0.430 -0.088 NoEnd 1st 0.065 0.222 -0.157 -0.632 -0.418 -0.214 NoEnd 3rd 0.107 0.293 -0.187 -0.738 -0.626 -0.111 NoEnd 5th 0.124 0.246 -0.122 -0.769 -0.573 -0.196 NoMath
Start K 0.127 0.156 -0.029 -0.506 -0.565 0.059 NoEnd K 0.146 0.123 0.023 -0.442 -0.575 0.133 NoEnd 1st 0.215 0.077 0.138 -0.532 -0.560 0.029 NoEnd 3rd 0.287 0.071 0.216 -0.536 -0.714 0.178 NoEnd 5th 0.274 0.054 0.220 -0.498 -0.715 0.217 No
Social/Behavioral FactorStart K -0.146 0.288 -0.434 -0.445 -0.061 -0.384 NoEnd K -0.137 0.282 -0.420 -0.456 -0.062 -0.394 NoEnd 1st -0.131 0.254 -0.386 -0.438 0.011 -0.450 NoEnd 3rd -0.138 0.315 -0.452 -0.445 -0.130 -0.315 NoEnd 5th -0.177 0.341 -0.518 -0.514 -0.047 -0.467 No
Approaches to LearningStart K -0.142 0.300 -0.442 -0.488 -0.077 -0.410 NoEnd K -0.148 0.306 -0.454 -0.516 -0.052 -0.464 NoEnd 1st -0.125 0.273 -0.399 -0.460 -0.057 -0.403 NoEnd 3rd -0.167 0.366 -0.533 -0.513 -0.132 -0.382 NoEnd 5th -0.192 0.387 -0.580 -0.610 -0.061 -0.549 No
* p< .05; ** p < .01; *** p < .001
50
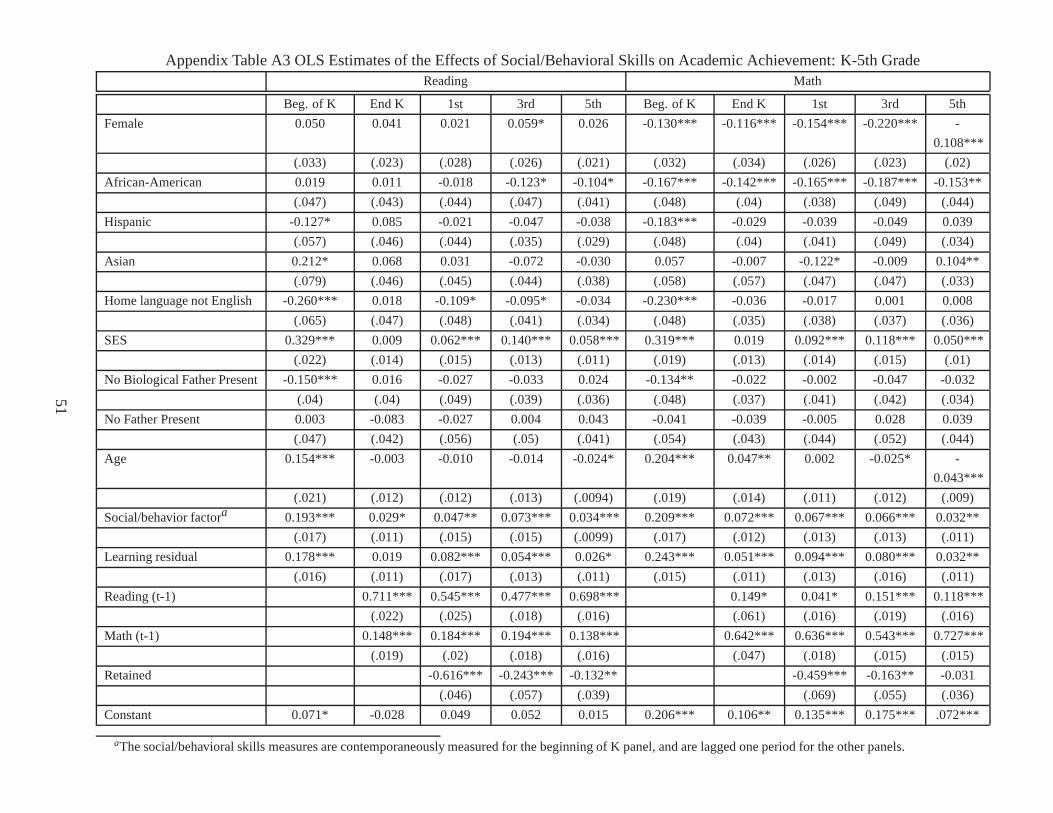
Appendix Table A3 OLS Estimates of the Effects of Social/Behavioral Skills on Academic Achievement: K-5th GradeReading Math
Beg. of K End K 1st 3rd 5th Beg. of K End K 1st 3rd 5th
Female 0.050 0.041 0.021 0.059* 0.026 -0.130*** -0.116*** -0.154*** -0.220*** -
0.108***
(.033) (.023) (.028) (.026) (.021) (.032) (.034) (.026) (.023) (.02)
African-American 0.019 0.011 -0.018 -0.123* -0.104* -0.167*** -0.142*** -0.165*** -0.187*** -0.153**
(.047) (.043) (.044) (.047) (.041) (.048) (.04) (.038) (.049) (.044)
Hispanic -0.127* 0.085 -0.021 -0.047 -0.038 -0.183*** -0.029 -0.039 -0.049 0.039
(.057) (.046) (.044) (.035) (.029) (.048) (.04) (.041) (.049) (.034)
Asian 0.212* 0.068 0.031 -0.072 -0.030 0.057 -0.007 -0.122* -0.009 0.104**
(.079) (.046) (.045) (.044) (.038) (.058) (.057) (.047) (.047) (.033)
Home language not English -0.260*** 0.018 -0.109* -0.095* -0.034 -0.230*** -0.036 -0.017 0.001 0.008
(.065) (.047) (.048) (.041) (.034) (.048) (.035) (.038) (.037) (.036)
SES 0.329*** 0.009 0.062*** 0.140*** 0.058*** 0.319*** 0.019 0.092*** 0.118*** 0.050***
(.022) (.014) (.015) (.013) (.011) (.019) (.013) (.014) (.015) (.01)
No Biological Father Present -0.150*** 0.016 -0.027 -0.033 0.024 -0.134** -0.022 -0.002 -0.047 -0.032
(.04) (.04) (.049) (.039) (.036) (.048) (.037) (.041) (.042) (.034)
No Father Present 0.003 -0.083 -0.027 0.004 0.043 -0.041 -0.039 -0.005 0.028 0.039
(.047) (.042) (.056) (.05) (.041) (.054) (.043) (.044) (.052) (.044)
Age 0.154*** -0.003 -0.010 -0.014 -0.024* 0.204*** 0.047** 0.002 -0.025* -
0.043***
(.021) (.012) (.012) (.013) (.0094) (.019) (.014) (.011) (.012) (.009)
Social/behavior factora 0.193*** 0.029* 0.047** 0.073*** 0.034*** 0.209*** 0.072*** 0.067*** 0.066*** 0.032**
(.017) (.011) (.015) (.015) (.0099) (.017) (.012) (.013) (.013) (.011)
Learning residual 0.178*** 0.019 0.082*** 0.054*** 0.026* 0.243*** 0.051*** 0.094*** 0.080*** 0.032**
(.016) (.011) (.017) (.013) (.011) (.015) (.011) (.013) (.016) (.011)
Reading (t-1) 0.711*** 0.545*** 0.477*** 0.698*** 0.149* 0.041* 0.151*** 0.118***
(.022) (.025) (.018) (.016) (.061) (.016) (.019) (.016)
Math (t-1) 0.148*** 0.184*** 0.194*** 0.138*** 0.642*** 0.636*** 0.543*** 0.727***
(.019) (.02) (.018) (.016) (.047) (.018) (.015) (.015)
Retained -0.616*** -0.243*** -0.132** -0.459*** -0.163** -0.031
(.046) (.057) (.039) (.069) (.055) (.036)
Constant 0.071* -0.028 0.049 0.052 0.015 0.206*** 0.106** 0.135*** 0.175*** .072***
aThe social/behavioral skills measures are contemporaneously measured for the beginning of K panel, and are lagged one period for the other panels.
51
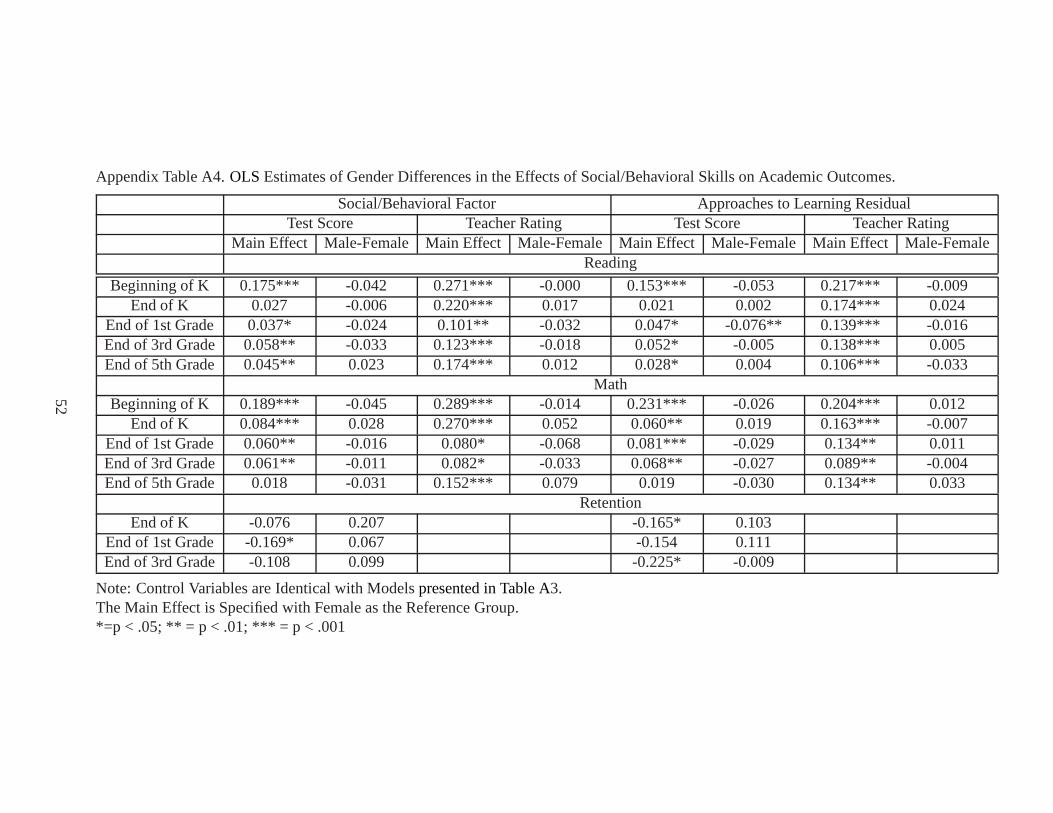
Appendix Table A4.OLSEstimates of Gender Differences in the Effects of Social/Behavioral Skills on Academic Outcomes.
Social/Behavioral Factor Approaches to Learning ResidualTest Score Teacher Rating Test Score Teacher Rating
Main Effect Male-Female Main Effect Male-Female Main Effect Male-Female Main Effect Male-FemaleReading
Beginning of K 0.175*** -0.042 0.271*** -0.000 0.153*** -0.053 0.217*** -0.009End of K 0.027 -0.006 0.220*** 0.017 0.021 0.002 0.174*** 0.024
End of 1st Grade 0.037* -0.024 0.101** -0.032 0.047* -0.076** 0.139*** -0.016End of 3rd Grade 0.058** -0.033 0.123*** -0.018 0.052* -0.005 0.138*** 0.005End of 5th Grade 0.045** 0.023 0.174*** 0.012 0.028* 0.004 0.106*** -0.033
MathBeginning of K 0.189*** -0.045 0.289*** -0.014 0.231*** -0.026 0.204*** 0.012
End of K 0.084*** 0.028 0.270*** 0.052 0.060** 0.019 0.163*** -0.007End of 1st Grade 0.060** -0.016 0.080* -0.068 0.081*** -0.029 0.134** 0.011End of 3rd Grade 0.061** -0.011 0.082* -0.033 0.068** -0.027 0.089** -0.004End of 5th Grade 0.018 -0.031 0.152*** 0.079 0.019 -0.030 0.134** 0.033
RetentionEnd of K -0.076 0.207 -0.165* 0.103
End of 1st Grade -0.169* 0.067 -0.154 0.111End of 3rd Grade -0.108 0.099 -0.225* -0.009
Note: Control Variables are Identical with Modelspresented in Table A3.The Main Effect is Specified with Female as the Reference Group.*=p < .05; ** = p < .01; *** = p < .001
52

Figure 1: Covariance Structure Model for the Effects of Social/Behavioral Skills on ReadingTest Scores
53