Embed Size (px)
Citation preview

Social value briefing: from licence to value

Disclaimer
28 October 2019
Social value briefing
Forward-looking statements
This presentation contains forward-looking statements, including statements which may include: trends in commodity prices and currency exchange rates; demand for commodities; plans; strategies and objectives of management; closure or
divestment of certain operations or facilities (including associated costs); anticipated production or construction commencement dates; capital costs and scheduling; productivity gains; cost reductions; operating costs and shortages of materials and
skilled employees; anticipated productive lives of projects, mines and facilities; provisions and contingent liabilities; tax and regulatory developments.
Forward-looking statements can be identified by the use of terminology such as ‘intend’, ‘aim’, ‘project’, ‘anticipate’, ‘estimate’, ‘plan’, ‘believe’, ‘expect’, ‘may’, ‘should’, ‘will’, ‘continue’, ‘annualised’ or similar words. These statements discuss future
expectations concerning the results of operations or financial condition, or the operating environment or provide other forward-looking statements.
These forward-looking statements are not guarantees or predictions of future performance or circumstances, and involve known and unknown risks, uncertainties and other factors, many of which are beyond our control, and which may cause actual
results or conditions to differ materially from those expressed in the statements contained in this presentation. Readers are cautioned not to put undue reliance on forward-looking statements.
For example, future revenues from our operations, projects or mines, if described in this presentation, will be based, in part, upon the market price of the minerals, metals or petroleum produced, which may vary significantly from current levels. These
variations, if materially adverse, may affect the timing or the feasibility of the development of a particular project, the expansion of certain facilities or mines, or the continuation of existing operations.
Other factors that may affect the actual construction or production commencement dates, costs or production output and anticipated lives of operations, mines or facilities include our ability to profitably produce and transport the minerals, petroleum
and/or metals extracted to applicable markets; the impact of foreign currency exchange rates on the market prices of the minerals, petroleum or metals we produce; activities of government authorities in some of the countries where we are exploring
or developing these projects, facilities or mines, including increases in taxes, changes in environmental and other regulations and political uncertainty; labour unrest; and other factors identified in the risk factors discussed in BHP’s filings with the US
Securities and Exchange Commission (the ‘SEC’) (including in Annual Reports on Form 20-F) which are available on the SEC’s website at www.sec.gov.
Except as required by applicable regulations or by law, the Group does not undertake any obligation to publicly update or review any forward-looking statements, whether as a result of new information or future events.
Past performance cannot be relied on as a guide to future performance.
Non-IFRS and other financial information
BHP results are reported under International Financial Reporting Standards (IFRS). This presentation may also include certain non-IFRS (also referred to as alternate performance measures) and other measures including Underlying attributable
profit, Underlying EBITDA (all references to EBITDA refer to Underlying EBITDA), Underlying EBIT, Adjusted effective tax rate, Controllable cash costs, Free cash flow, Gearing ratio, Net debt, Net operating assets, Operating assets free cash flow,
Principal factors that affect Underlying EBITDA, Underlying basic earnings/(loss) per share, Underlying EBITDA margin, Underlying return on capital employed (ROCE) (all references to return on capital employed refer to Underlying return on capital
employed), and Underlying return on invested capital (ROIC). These measures are used internally by management to assess the performance of our business and segments, make decisions on the allocation of our resources and assess operational
management. Non-IFRS and other measures have not been subject to audit or review and should not be considered as an indication of or alternative to an IFRS measure of profitability, financial performance or liquidity.
Presentation of data
Unless specified otherwise: value represents BHP share of risked discounted cash flows at consensus prices; copper equivalent production based on 2019 financial year average realised prices (as published in BHP’s Results for the year ended 30
June 2019 on 20 August 2019); data from subsidiaries are shown on a 100 per cent basis and data from equity accounted investments and other operations are presented reflecting BHP’s share; medium term refers to our five year plan.
Queensland Coal comprises the BHP Mitsubishi Alliance (BMA) asset, jointly operated with Mitsubishi, and the BHP Mitsui Coal (BMC) asset, operated by BHP. Numbers presented may not add up precisely to the totals provided due to rounding.
Any references to disciplined supply refer to lower levels of investment across the industry. All footnote content (except in the Annexures) is contained on slide 33.
No offer of securities
Nothing in this presentation should be construed as either an offer or a solicitation of an offer to buy or sell BHP securities in any jurisdiction, or be treated or relied upon as a recommendation or advice by BHP.
Reliance on third party information
The views expressed in this presentation contain information that has been derived from publicly available sources that have not been independently verified. No representation or warranty is made as to the accuracy, completeness or reliability of
the information. This presentation should not be relied upon as a recommendation or forecast by BHP.
BHP and its subsidiaries
In this presentation, the terms ‘BHP’, the ‘Company’, the ‘Group’, ‘our business’, ‘organisation’, ‘we’, ‘us’, ‘our’ and ‘ourselves’ are used to refer to BHP Group Limited, BHP Group Plc and, except where the context otherwise requires, their respective
subsidiaries as defined in note 13 ‘Related undertaking of the Group’ in section 5.2 of BHP’s Annual Report on Form 20-F. Notwithstanding that this presentation may include production, financial and other information from non-operated assets,
those terms do not include non-operated assets and statements regarding our operations, assets and values apply only to our operated assets unless otherwise stated.

Social value underpins everything we do
8 October 2019
Social value briefing
Today’s briefing follows our capital allocation briefing in November 2018 and strategic briefing in May 2019
• Our Strategy defines our portfolio
focus and the culture and capabilities
we require to maximise value and
returns
• Our Capital Allocation Framework
provides a rigorous and transparent
process for cash prioritisation
• Social value embeds a holistic
approach to decision making to benefit
all stakeholders and drive better
business outcomes
3
Today

Social value briefing: from licence to valueGeoff Healy
Chief External Affairs Officer

We start with our purpose
8 October 2019
Social value briefing
5
Our new purposeTo bring people and resources together to build a better world
A strong sense of purpose drives better outcomes for all stakeholders

The materials we provide are central to modern life
8 October 2019
Social value briefing
6
We constantly evolve our approach so we can deliver them sustainably into the future
$4bnwages, salaries and
employee incentives
$2bnpayments to local suppliers
$15bnpayments to suppliers (incl.
local) for goods and services
$9.1bntaxes, royalties and other
$18bndividends and interest
Our people Customers and suppliersCommunities Society Investors and lenders
Met
Coal
Copper
Potash
Iron ore
Nickel Energy
FY2019
(US$)

We take a long-term view
8 October 2019
Social value briefing
7
Operated assets
Non-operated assets
>30
Regional
towns
~US$3.5billion
Average
capital employed
per asset1
19
Native title
parties2
55%
Revenue
from China
200MtCu Eq
Multi-decade
reserves
72,000
Employees &
contractors
Our commitment to regions and communities is measured in decades – local engagement is critical
Note: Mineral Assets - Reserve base (100 per cent basis) is converted to copper equivalent tonnes using FY2019 average realised prices and does not include Petroleum Reserves; refer to disclaimer on slide 34
19Closed sites
67Tailings dams at our
operated assets
14.7 Mt CO2-eScope 1 & 2 emissions
+10 millionHectares of land and
sea owned or managed
~20 yearsFrom exploration to
mine optimisation

We have a strong record of responsible business practice
8 October 2019
Social value briefing
8
~36,000Employee views of fatal
investigation reports
since 2016
Engagement Female participation
The health and safety of our people and the wellbeing of our communities is essential
Our people
FY15 Current
Female new hires
~3x
10 Deserts Project to build the largest
Indigenous-led conservation
network on Earth
BHP Foundation
US$1.7bn Spent on social investment
in the last 10 years
Social investment
Communities
Note: The BHP Foundation is a charitable organisation funded by BHP
Social value briefing
up to 67%Improvement in safety at BHP’s
most inclusive and diverse sites
since FY20173
SafetyHigh potential injury
FY16 Current
High potential injury events
>40% 341Scholarships awarded to
Indigenous students in FY2019
Education
14%Of procurement spend directed
to suppliers in the communities in
which we operate in FY2019
Local spend

We have a strong record of responsible business practice
8 October 2019
Social value briefing
9
1990sWe started setting
public targets to reduce
GHG emissions
Public targets
Climate
>440,000hectares
Of biodiversity conservation
projects since 2011 – more than
3x our disturbed land footprint
Land
Our focus on action, risk management and transparency across multiple issues demonstrate our commitment
Environment
~40,000Employees completed
Business Conduct training
Business conduct
“A” ratingOnly company in sector to
achieve this rating for climate
disclosures (CDP)
Disclosure
44.7%Effective tax and royalty rate in
FY2019 – two decades of
transparent tax reporting
Contributions
17 yearsCEO remuneration has been
linked to safety performance
Governance
Ethics and transparency
FY17 FY18 FY19
Scope 1 & 2 GHG emissions millionsof tonnes of CO2-e
FY19
14.7Mt
CO2-e
Water
FY17 FY18 FY19
Freshwater withdrawal megalitres
1%
reduction
from
FY17

But the world is changing
8 October 2019
Social value briefing
10
To remain competitive we must adapt; we consider these emerging opportunities and threats in our scenario analysis
Communities
21%Income disparity between
non-metropolitan and
metropolitan areas7
2020The year Indonesia will
cease exports of all
nickel ore9
Resource nationalism
5xIncrease in number of
populists in power globally
between 1990-20184
Populist politics
40%Of SMEs claim large
companies are the worst
offenders for late payment5
SME pressure
65%Reduction in steel emissions
required to align with IEA
2°C scenario by 205010
Decarbonisation
47People projected to enrol in
mining engineering courses
in Australia in 202011
Failure to attract talent
67%Of employees seek
employers who advocate on
social issues6
Advocacy
80%Of asset managers consider
ESG when making
investment decisions8
Changing register
61%Of fund managers believe
evidence of ESG execution
to be very important13
Investor scrutiny
Corporations are facing heightened societal expectations…
The resources sector faces significantly greater challenges than other industries
68%Believe the best days of
the mining industry are in
the past12
Increasing concern

Social value: licence to operate is not enough
What is social value
• Social value is an essential precondition to shareholder
value
• It is our contribution to society – to our people, partners,
shareholders, the economy, the environment and local
communities
• By embedding social value into our business processes
– we make better business decisions
• We build social value through deep and authentic
relationships with local, regional and global
stakeholders
• To deliver sustainable financial value, our stakeholders
must be ‘better off’ for our presence, beyond the
economic contributions we make
8 October 2019
Social value briefing
11
Society profits when we do(Example: water management approach)
We are now focused on creating social value to grow shareholder value and returns
PHILANTHROPY(Low business motive)
COMPLIANCE SOCIAL LICENCE(Preservation)
SOCIAL VALUE(Collaborative growth)
Water permits
obtained
Avoid water
discharge breach
Desalination
Global Water
Stewardship
BHP Foundation
So
cia
l va
lue
Shareholder value

Social value creation drives our competitive advantage
8 October 2019
Social value briefing
12
Social value protects our business today and positions us to take advantage of future opportunities
S
O
C
I
A
L
V
A
L
U
E
Best
commodities
Best assets
Best culture and
capabilities
Access to resource
Obtain and retain rights to operate and expand our current asset base
Be partner-of-choice to governments and communities in new and existing jurisdictions
Access to markets
Be the supplier of choice for the best customers
Sell our products into the widest range of countries
Access to best talent
Attract best-in-class talent to our Company
Develop skills in our workforce to drive productivity gains
Access to best partners
Secure our choice of commercial partners to drive value creation
Form strong local community partnerships in support of our assets for the long term
Access to capital
Achieve widest access to equity and debt capital markets

We are embedding social value at every level of BHP
8 October 2019
Social value briefing
13
We are hardwiring our approach into our structures, processes and culture
Our CharterOur Code
of Conduct
Our
Requirements
Our Purpose
Board and management
Our planning
Reporting
Remuneration and incentives
• In our Charter and our Board governance
• In our Executive Leadership Team meeting agendas
• In Group targets, policies and investments
• In our Corporate Alignment Planning
• In our risk management approach
• In the Company scorecard
• In internal and external reporting (GRI, ICMM, TCFD)
• In our Group, asset and functional scorecards
• In personal KPIs – e.g. 25% of CEO pay tied to HSEC
• All our people are accountable for creating social value
• Through our Forum of Corporate Responsibility
Organisationstructure
External forum and sources

Ground-up: each asset has a social value plan
8 October 2019
Social value briefing
14
Social value considerations are now embedded in asset planning cycle – drives local ownership and accountability
Social value
assessment
Stakeholder input
Ability to influence
Materiality
Timing
Social value
assessment
Life of
Asset plans
Social value
planningApproval
Measure ReviewReport
Community dialogue
Employee surveys
UN Sustainable Development Goals
BHP Forum on Corporate
Responsibility
Investor feedback
ExecuteInitiate and measure
progress to inform
future actions
PrioritiseEstablish focus
areas
EngageFrequent and broad
engagement
PlanIncorporate into core
planning cycle
1 2
34

Action PlansEconomic empowerment, advocacy, culture
Top-down: a global focus on the issues that matter most
8 October 2019
Social value briefing
15
Our priorities reflect those areas that can make the greatest positive difference to our stakeholders and our business
People Environment Community
ZeroWork-related fatalities
Keeping people safe at work
50%Gender balance by 2025
Attracting the best talent
Indigenous Action Plans – supporting economic
empowerment, advocacy, culture
Respecting Indigenous peoples
Net zero (Scope 1 & 2)Operational emissions by 2050
Scope 3 goals to be set in 2020
Positioning for decarbonisation
2030 Target date for implementing UN SDG water
objective
Protecting critical resources
at least 1% Pre-tax profits invested every year
Building stronger communities
Transparency
Over 72,000 employees and contractors globally >80% of our products emit significant CO2 in use All mines on or adjacent to Indigenous peoples’ land
Inclusive and diverse sites are safer and more productive 64% of assets in medium-high water sensitive areas We are part of the communities where we operate

Our Climate Investment Program
8 October 2019
Social value briefing
16
Overview
Challenge Our scenario analysis indicates significant financial
exposure to both operational and value-chain GHG
emissions
Capital US$400 million over five years
Mandate To develop options to reduce emissions from our own
operations (Scope 1 & 2), and those generated from our
value chain (Scope 3), and generate carbon offsets
Approach • Managed on a portfolio-basis to maximise impact
• Financial, emissions and other value criteria applied
Investable
universe
Global mandate, covering:
• Internal initiatives
• Direct investments in emerging companies
• Industry and academic partnerships
• Co-development of new technologies
Process and
governance
• Dedicated team with appropriate skillsets
• Individual investments subject to rigor of Investment
Committee approval
Our US$400 million CIP is targeted at reducing our operational greenhouse gas (GHG) emissions and supporting long-term demand
for our products by working with customers, suppliers and other value chain participants to help them lower their GHG emissions
Operational emissions
Collaboration with vehicle vendors to
convert site vehicles from diesel to
electric
CCS: Industrial application
Steel sector CCS roadmap in China,
investigating the policy, technical and
economic barriers to wide-scale
deployment
Nature-based solutions
Commitment to Alto Mayo in Peru,
managed by Conservation
International and protecting around
182,000 hectares of threatened forest
Example investment types
Our Samarco response
8 October 2019
Social value briefing
17
Challenge Rehabilitating social and environmental impacts and
supporting the affected people and communities
Capital US$872 million spent on Renova programs, with provision
for further US$1.65 billion
Approach Execute through the Renova Foundation:
• 530 employees, supported by 6,200 contractors
• 42 remediation and compensatory programs
• Overseen by representatives from government, local
municipalities, environmental agencies, impacted
communities who monitor, guide and assess Renova’s
progress
BHP Tailings
Taskforce
• Team of BHP technical experts to oversee improvement
and assurance for our operated tailings dams
• Reports to the Executive Leadership Team and Board
• Assists ICMM Tailings Working Group to contribute to
improvements in tailings management across the industry
Committed to remediation and compensation through the Renova Foundation
Overview Example investment types
Resettlement - Bento Rodrigues
Constructing more than 230 houses, plus
school and public infrastructure (at a
community selected location)
Compensation
Paid compensation and financial aid of
US$425 million, including:
• US$244 million in emergency financial
aid to over 13,000 families
• ~9,000 families fully compensated
• ~268,000 people compensated for
water damages
Sustainable tailings management
Reducing tailings dam failure risk by
accelerating technology for safer, more
sustainable tailings management
Note: All spend is at 30 June 2019

Permanent employment offers for
traditional contract labour roles
• Improves safety outcomes by up to 50 per
cent and productivity by 20 per cent
• Reduces high turnover rates prevalent in
contract workforce
• Increases employment opportunities and
provides greater stability for local
communities
Modified shift cycles to attract local
‘stay at home’ parents back to work
• Increases female representation
• Ensures greater local community
participation in the workforce
• Delivers productivity benefits from a more
stable local workforce
People
8 October 2019
Social value briefing
18
WAIO Apprenticeships Saraji Crib Relief Operations Services
203 apprenticeships
in WAIO
• Provides employment pathways and
prepares our workforce for the future
• Focuses on diversity: 40 per cent female; 23
per cent indigenous and multiple age
demographics
• Targets candidates via local recruitment
centres in Port Hedland and Newman

Transitioning to desalinated water
and renewable power
• Sets industry standard in Chile
• Supports cessation of groundwater use
by 2030
• Reduces Scope 2 emissions at Escondida
• Potential for material cost savings
• Underpins higher throughput to offset grade
decline
World's first bulk carrier tender for
LNG-fuelled transport
• Supports reduction of BHP’s shipping CO2
footprint by 20 per cent
• Provides a competitive advantage through
lower freight costs relative to peers
Dust abatement and management
activities within and beyond the gate
• Enables increased throughput while reducing
dust events and meeting regulatory targets
• Strengthens relationships with Port Hedland
Industries Council and the community
Environment
8 October 2019
Social value briefing
19
Escondida water and power Sustainable shipping Port Hedland dust management
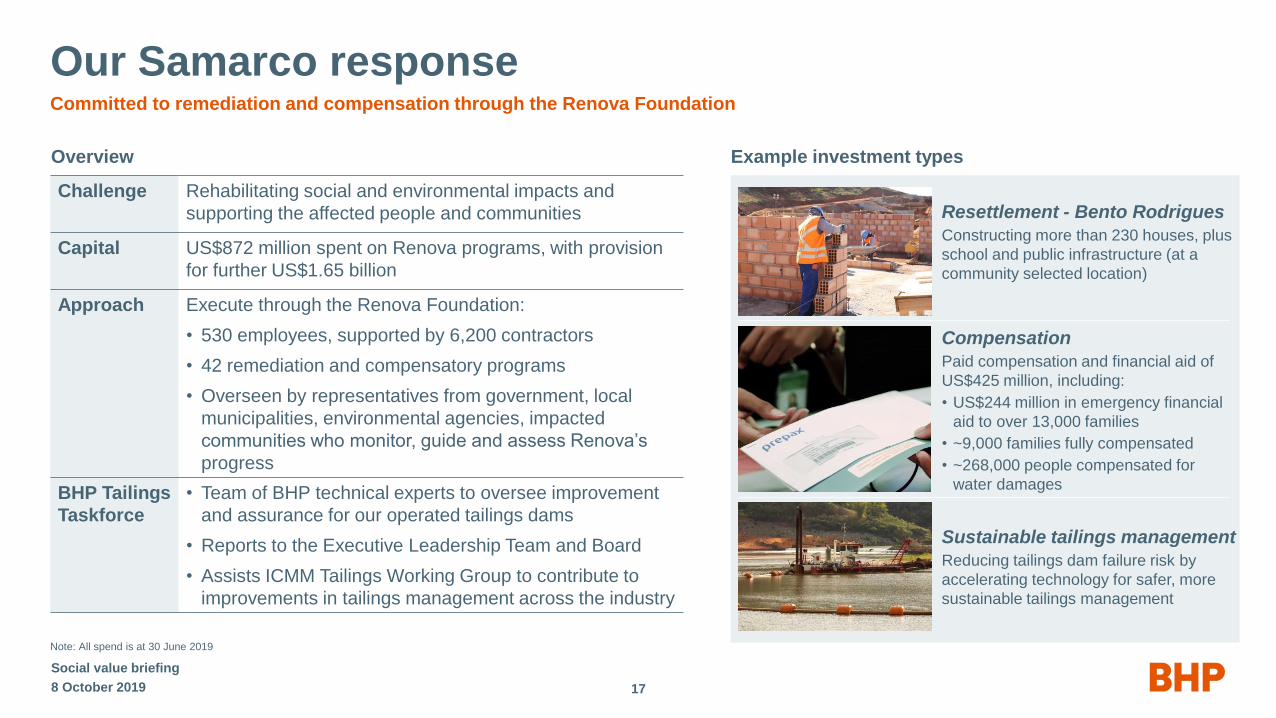
Mutually beneficial relationship with
Nickel West Traditional Land Owners
• Underpins nickel strategy by providing
certainty to operate and expand over the
life of mine
• Delivers value to the Tjiwarl people through
financial benefits, employment outcomes,
procurement opportunities and cultural
security for areas of special significance
Investing not less than one per cent
of pre-tax profits in communities
• Makes a positive contribution to communities
and complements our broader business
priorities
• Delivers outcomes based on local needs
assessments
• Maps to UN Sustainable Development Goals
Supporting regional economies and
strengthening local relationships
• More than A$330 million spent with over
1,000 small local suppliers on less than 21
day payment terms since 2012
• Builds community trust and improves state
government and other local relations
Communities
8 October 2019
Social value briefing
20
Tjiwarl Land Use Agreement Social investment Local Buying Program

37%
54%
30
40
50
60
Social value looks outward, not inward
8 October 2019
Social value briefing
21
In a break with the past, we decided in 2017 to tell our story – through targeted local and national campaigns – with results
Note: All measures are based off the total sample.
BHP corporate reputation metrics: Australian favourability
Favourability(%)
CY16 CY17 CY18 CY19
↑

Our sector delivers resources essential for progress – but sometimes with significant environmental and societal impact
We monitor, measure and assess these impacts and have a strong record in sustainable business practices
Stakeholder expectations are evolving – we are transitioning from ‘social licence’ (tolerance and acceptance) to ‘social value’
(trust and partnership)
Social value embeds a holistic approach to decision-making to drive better business outcomes
We have a rigorous framework for embedding social value considerations – locally tailored, globally consistent
We will be transparent and judged on results – by creating value for all our stakeholders, we will deliver better outcomes
for shareholders
Social value briefing: from licence to value
8 October 2019
Social value briefing
22

Health, safetyand environmentRob Telford
Group Health, Safety and Environment Officer

HSE performance provides the base to create social value
24
• Tragically, one of our colleagues suffered a fatal injury at the BHP Mitsubishi Alliance’s Saraji Mine (December 2018)
• Our investigation identified several areas for improvement – we are sharing the learnings across BHP and the industry
• Field Leadership achieved a new record number of safety engagements during the year, up by 29 per cent on FY2018
• The frequency of high potential injuries (HPI) decreased by 20 per cent
8 October 2019
Social value briefing
Our priorities
Zero work-
related fatalities
Physical and
mental wellness
Environmental
performance
Our FY2019 performance
• We continuously monitor and evaluate occupational exposure limits (OELs) for diesel particulate matter (DPM), silica,
coal mine dust and other exposures
• Exposure reduction projects across the Group has seen number of exposures above our OELs decrease by 28 per cent
in FY2019
• Mental wellness has been trending up over the last three years – FY2016 EPS 75 per cent favourable – FY2019 EPS 77
per cent favourable
• Rehabilitation and closure strategies delivered just under 20,000 hectares of rehabilitated land in FY2019 in Australia
• Scope 1 & 2 GHG emissions three per cent below FY2017 baseline
• Freshwater withdrawal one per cent below FY2017 baseline and on track to deliver a 15 per cent reduction by end of
FY2022

Sustainability is a core Charter value
• Further embedding Field Leadership to drive towards a more
sustainable and safer operating environment
• Introducing an integrated global contractor management
framework that defines how we engage with our contractors to
deliver safe, productive outcomes
• Empowering leaders through global sharing of best practice in
real time and a company-wide approach to management and
measurement of key risks
• Maintaining our momentum in minimising DPM, Coal mine dust
and silica exposures
• Maintaining the focus on the mental health of our people – driving
awareness up, stigma down and resilience for all
• Recognising the increasing challenges for biodiversity and
creating the framework to measure the effectiveness of our actions
• Implementing integrated closure plans to minimise risk over the
life of asset
8 October 2019
Social value briefing
25
We continue to set ourselves challenging targets and strive to meet them

Our approach to water stewardship
8 October 2019
Social value briefing
26
Drivers
Watersecurity
Socialvalue
Environmentalresilience
Businessresilience
Outcomes
Water Stewardship Position Statement:
Water secure world by 2030
Water Stewardship Strategy:
Value, Collective Action, Risk, Technology, Disclosure
2030 longer-term supporting integrated water resource management
FY2022 withdrawal reduction target
Asset-level, context-based targets (in development)
Contributing to improved water governance through transparency,
collaboration and knowledge and innovation
Environment &
Climate Change
Our Requirements
Water
Management
Standards
Other Group-wide
standards
e.g. risk, planning
Our vision
Our strategy
Our progress
Our standards
Beyond our operations
Waterscarcity
Waterexcess
Societalrisk
Businessrisk
Climatechange

Climate change
Dr Fiona Wild
VP, Sustainability and Climate Change

Our approach to climate change
Climate change is a global challenge that requires a
collaborative response
• Expectations of the role that industry should play in contributing
to international climate commitments and delivering the transition
to a lower carbon economy are increasing
• Responding to climate change is a priority governance and
strategic issue for BHP
• We have been taking action since the 1990s, starting with
measuring and reporting our operational emissions, setting
reduction targets and investing in low emissions technologies
• We regularly review our approach in response to emerging
scientific knowledge, changes in global climate policy,
developments in low emissions technologies and evolving
stakeholder expectations
288 October 2019
Social value briefing

Climate change strategy
We have an integrated approach to managing climate-related risk
• Reducing operational emissions
• Addressing emissions in our value chain
• Adapting to the physical impacts of climate change
• Evaluating resilience of our portfolio to the low carbon transition
• Supporting development of effective climate and energy policy
• Promoting market mechanisms to reduce global emissions
• Transparent reporting and disclosure
298 October 2019
Social value briefing

Continuing to evolve our approach
We can and will do more to address climate change
• We will:
– set a new, medium-term, science-based target to help
bridge between our short-term target and long-term goal
– set goals to address Scope 3 emissions
– clarify and strengthen the link between performance against
commitments and executive remuneration
– release an updated Portfolio Analysis, including a ‘well
below 2 degrees’ scenario
– invest US$400 million in solutions to reduce emissions
across our operations and value chain and through nature-
based solutions that generate offsets
308 October 2019
Social value briefing

US$400m over 5 years
Climate Investment Program – Capital allocation
31
Applied now in
Assets
Future technology
optionalityCarbon offsets
Applied to support value chain
emissions reduction nowFuture portfolio opportunity
Renewable energy
Fuel switching
Energy efficiency
Electrification
Diesel displacement
Mineral carbonation
Blue carbon
REDD+
BHP land projects
CCS
Shipping
Direct air capture
Future steel-making technologies
Enhanced battery materials
Broad-scale carbon utilisation
Potential focus areas
Investment toolkit
Scope 1 & 2 Offsets Scope 3
Internal innovation and activity
Industry partnerships
Customer and supplier
partnerships
Direct equity investments
Other
8 October 2019
Social value briefing


Footnotes1. Slide 7: Average capital employed per asset excludes non-operated mineral assets and includes non-operated conventional petroleum assets
2. Slide 7: To date, BHP has entered into native title agreements in Australia with approximately 19 native title parties. There is wide variation in the nature and significance of these agreements.
3. Slide 8: Up to 67% increase in safety refers to the total recordable injury frequency (TRIF) statistics
4. Slide 10: (an increase of 4 to 20) Tony Blair Institute for Global Change, Populists in Power Around the World, 2018: https://institute.global/insight/renewing-centre/populists-power-around-world
5. Slide 10: BACS, Cost of Collecting Late Payments, 2018: https://www.bacs.co.uk/NewsCentre/PressReleases/Pages/CostOfCollectingLatePaymentsRockets.aspx
6. Slide 10: Edelman Trust Barometer, 2019: https://www.edelman.com/news-awards/2019-edelman-trust-barometer-reveals-my-employer-most-trusted-institution
7. Slide 10 OECD, Regions and Cities at a Glance, 2018: https://read.oecd-ilibrary.org/governance/oecd-regions-and-cities-at-a-glance-2018_reg_cit_glance-2018-en#page12
8. Slide 10: Harvard Business School, How and Why Investors use ESG Information, 2018: https://www.hbs.edu/faculty/Pages/item.aspx?num=54146
9. Slide 10: FT, Nickel Prices Hit Four-Year High on Indonesia Export Ban, 2019: https://www.ft.com/content/1709b318-cb26-11e9-a1f4-3669401ba76f
10. Slide 10: CDP, (compared to 2014 levels) Melting Point, July 2019: https://6fefcbb86e61af1b2fc4-
c70d8ead6ced550b4d987d7c03fcdd1d.ssl.cf3.rackcdn.com/cms/reports/documents/000/004/659/original/CDP_Steel_2019_Executive_summary.pdf?1564490803
11. Slide 10: Deloitte, Tracking the Trends Report, 2019: https://www2.deloitte.com/content/dam/Deloitte/cn/Documents/energy-resources/deloitte-er-tracking-the-trends-2019-en-190129.pdf
12. Slide 10: Brunswick Research, Mining Industry Perceptions 2018
13. Slide 10: PERE ESG Investor Survey, 2019: https://www.lasalle.com/images/uploads/PERE_ESG_Investor_Survey_2019.pdf
8 October 2019
Social value briefing
33

Ore Reserves and Competent Persons statementCompetent Person Statement
The information in this presentation that relates to the FY2019 Ore Reserves as were first reported by BHP in accordance with the Australian Securities Exchange Listing Rules Chapter 5 2014 and Australasian Code for Reporting of Exploration
Results, Mineral Resources and Ore Reserves, December 2012 (JORC Code) in the 2019 BHP Annual Report, available online at www.bhp.com.
The detailed breakdown of Ore Reserves for all deposits are shown in the 2019 Annual Report on 100% basis, with corresponding BHP interest. Ore Reserves from the 2019 Annual Report have been compiled in this presentation to provide a
portfolio overview.
The Company confirms that it is not aware of any new information or data, including assumptions and technical parameters used in determining Ore Reserves that materially affects the Ore Reserves as included in the 2019 Annual Report. The
Company confirms that the form and context in which the Competent Persons’ findings are presented have not been materially modified from the original market announcement.
The information in this presentation that relates to Ore or Marketable Reserves is based on information compiled by: P Kumar Chhajer (MAusIMM) for Western Australia Iron Ore (WAIO); R Macpherson (MAIG) for Mt Arthur Coal, Metallurgical Coal
Operations - Queensland CQCA-JV and BHP Mitsui Coal; C Barclay (MAusIMM) for Nickel West Operations; M Hamilton (MAusIMM) for Olympic Dam and M Williams (MAusIMM) for Escondida, Spence, Cerro Colorado, Antamina and Cerrejón.
All of the people listed above are full-time employees of BHP and have sufficient experience relevant to the style of mineralisation and type of deposit under consideration and to the activity which they are undertaking to qualify as Competent
Persons as defined in the JORC Code 2012 and consent to the inclusion in the presentation of the matters based on this information in the form and context in which it appears.
Ore Reserves and metal equivalent calculations
Ore Reserves are converted to copper equivalent (Cueq) tonnes using recoveries provided in the 2019 BHP Annual Report for each deposit with the exception of Spence molybdenum recovery of 56% based on metallurgical test work. FY2019
average realised prices as reported in the BHP Operational Review for the Year Ended 30 June 2019 have been used for Metallurgical Coal, Energy Coal, Iron Ore, Copper and Nickel while commodity prices for U3O8, Au, Ag, Mo and Zn have been
sourced from the BHP 2019 US Securities and Exchange Commission Form 20-F. All reports are available to view on www.bhp.com.
The calculation of Ore Reserves in terms of copper equivalent tonnes for Metallurgical Coal, Energy Coal and Iron Ore applied the formula listed below:
Cueq= (commodity recoverable tonnes x commodity price/copper price)
The calculation of Ore Reserves in terms of copper equivalent tonnes for the metallic deposits applied the formula listed below:
Cueq= ∑(contained metal per element x recovery x element price/copper price), for each elements reported for the deposits Olympic Dam, Spence, Antamina and Nickel West.
It is the Company’s opinion that all elements included in the metal equivalent calculation have a reasonable potential to be recovered and sold.
348 October 2019
Social value briefing

Tailings facilities in the portfolio1
Social value briefing
35
Location and operational status of operated tailings facilities
32
2112
US and Canada
Chile
Inactive2Active
8 October 2019
Australia
1. Includes facilities within BHP operations and Non-operated Joint Ventures. The number of tailings storage facilities is calculated based on the definition agreed by the International Council on Mining and Metals Tailings Advisory Group in
response to the Church of England information request which differs to the definition applied to our February disclosure. We keep this definition under review. The reduction in number of facilities in this disclosure compared to the February
disclosure is primarily due to the aggregation of individual dams into (integrated) facilities. The majority of these changes are associated with the North American Closed Sites.
2. Inactive includes facilities not in operational use, under reclamation, reclaimed, closed and/or in post-closure care and maintenance.
1 121 12
For further details on tailings facilities within the portfolio please see our more detailed disclosure on our website at bhp.com
Inactive includes facilities not in operational use, under reclamation, reclaimed, closed and/or in post-closure care and maintenance.
1
1
217
US
Colombia
Peru Brazil
4
1
Canada
Location and operational status of non-operated facilities
Within the tailings facilities portfolio there are 67 operated and 9 non-operated tailings facilities

Tailings facilities in the portfolio1
Social value briefing
36
Australia
Location and CDA Classification of operated tailings facilities2
SignificantLow High Very high Extreme
US
Canada
Chile 10 15
3 3
2
510
1
3
14
3
1. Includes facilities within BHP operations and Non-operated Joint Ventures. The number of tailings storage facilities is calculated based on the definition agreed by the International Council on Mining and Metals Tailings Advisory Group in
response to the Church of England information request which differs to the definition applied to our February disclosure. We keep this definition under review. The reduction in number of facilities in this disclosure compared to the February
disclosure is primarily due to the aggregation of individual dams into (integrated) facilities. The majority of these changes are associated with the North American Closed Sites.
2. The classification of the tailings facilities is based on the most recent classification of the facilities by the Engineer of Record. This is subject to change as ongoing reviews are conducted. For the purposes of this chart, ANCOLD and other
classifications have been converted to their CDA equivalent. Two tailings facilities are not considered dams and therefore not subject to classification (labelled Not applicable): Hamburgo TSF at Escondida is an inactive facility where tailings
were deposited into a natural depression ; and Island Copper TSF in Canada, acquired in the 1980s, also an inactive facility. Tailings at Island Copper were deposited in the ocean under an approved license and environmental impact
assessment. This historic practice ceased in the 1990s. BHP has since committed to not dispose of mine waste rock or tailings in river or marine environments.
3. The classification of the tailings facilities is based on the most recent classification of the facilities provided by the operator. The operator is responsible for determining classification in accordance with its internal policies and local guidelines. For
the purposes of this chart, the operator’s classifications have been converted to their CDA equivalent. This is subject to change as ongoing reviews are conducted by the operator.
2
1
2
Not applicable
11
Classification is based on the modelled, hypothetical most significant failure mode without controls – not on the current physical stability of the dam.
US
Canada
1
12
Colombia
Peru Brazil
1
22
Location and CDA Classification of non-operated facilities3
8 October 2019
Within the tailings facilities portfolio there are 67 operated and 9 non-operated tailings facilities
For further details on tailings facilities within the portfolio please see our more detailed disclosure on our website at bhp.com

Approach to dam risk management at BHP operations1
BHP’s approach to dam risk management at our operated dams
is integrated into our standard approach to risk management,
assurance and continuous improvement with particular focus on
four key areas:
1. Maintenance of dam integrity;
2. Governance of dam facilities;
3. Monitoring, surveillance and review; and
4. Emergency preparedness and response.
Supporting this approach to dam risk management at our
operated assets are Group-wide processes of technical support
and oversight.
Social value briefing
37
Group-level oversight and assurance
Maintaining dam integrity requires appropriate engineering design, quality construction, ongoing operating discipline and effective
governance processes
1. This approach applies only to BHP-operated dams with the specific details commensurate with risk.
1. Dam integrity
2. Dam governance
3. Monitoring, surveillance and review
4. Emergency preparedness and response
8 October 2019

BHP Tailings taskforce
BHP has now established a Tailings Taskforce.
• The Taskforce is particularly focused on:
• delivering short term risk mitigating outcomes;
• delivering longer term outcomes to eliminate or significantly
reduce tailings risk;
• improving the management of controls and governance of
tailings storage facilities; and
• working with external stakeholders to raise the standard of:
– tailings storage facilities management practices by actively
supporting and contributing to the International Council on
Mining and Metals’ (ICMM) independent review to
establish an international standard for the safe
management of tailings dams; and
– transparency of tailings management to promote the
application of consistent disclosure that informs better
tailings dam stewardship.
Prior to Brumadinho we already had a significant focus on looking at how we could deliver a step change reduction in tailings risk.
Brumadinho however has further strengthened our resolve.
Social value briefing
8 October 2019 38

More information
8 October 2019
Social value briefing
39
Presentations
Annual Reporting
Strategy briefing
22 May 2019
Tailings dams briefing
7 and 10 June 2019
Capital allocation briefing
21 November 2018
Prospects
BHP blog
Annual
Report 2019
Sustainability
Report 2019
(including Water Report)
Economic
Contribution
Report 2019