Embed Size (px)
Citation preview

Social Security and Private Saving: Theory and Historical Evidence
by Selig D. Lesnoy and Dean R. Leimer*
This article is a nontechnical presentation of the debate that has gone on during the past decade over whether the U.S. social security system has depressed private saving in the economy. The heart of the article is an assessment of economist Martin Feldstein’s original evidence, presentation of the alternative evidence that concluded that currently available historical data do not support the proposition that social security reduces private saving, and an evaluation of the contradictory evidence presented by Feldstein in response to the alternative evidence. The article concludes that, although the total body of evidence is inconclusive, the historical evidence fails to support the hypothesis that social security has reduced private saving.
The Office of Research, Statistics, and International Policy, as part of its ongoing research mission, investigates the interre- lationship between social security and the economy. This article presents an examination of one of several aspects of this rela- tionship relevant to public policy considerations and is intended to make previously published technical papers available to a broader audience.
During the past decade, debate has focused on whether or not the United States social security system has depressed private saving in the economy. I In the context of concern about low levels of saving and capital formation and the consequent impact on pro- ductivity growth and output, the issue is clearly impor- tant.
In a pioneer article, Martin Feldstein (1974) 2 esti- mated that the introduction of the social security system has reduced personal saving in the United States by 50 percent. Subsequent empirical studies by Alicia Munnell (1974), Robert Barro (1978), and Michael Darby (1979) presented estimates variously supporting and contra- dicting Feldstein’s conclusions. Less technical guides to the early debate are provided by Selig Lesnoy and John Hambor (1975) and Louis Esposito (1978).
The debate entered a new phase when, at the 1980 an- nual meeting of the American Economic Association, Dean Leimer and Selig Lesnoy of the Social Security Administration presented new evidence that cast doubt on Feldstein’s conclusion that social security had re-
* Division of Economic Research, Office of Research, Statistics, and International Policy, Office of Policy, Social Security Adminis- tration.
t This debate is concerned only with the effect of old-age retirement and survivor benefits on private saving.
2 Source documents cited in text refer to author and year of publica- tion. The full citations are grouped under References at the end of this article.
duced private saving in the United States (Leimer and Lesnoy, 1980, 1982). A second paper reexamining the Barro, Darby, and Munnell studies was presented at the 1981 meeting of the Western Economic Association. The hypothesis that social security has reduced personal saving was not supported (Lesnoy and Leimer, 1981). Responding to these studies, Feldstein (1982) presented new evidence supporting his original conclusion. Leimer and Lesnoy (1983) provides an evaluation of Feldstein’s new evidence.
This article is a nontechnical presentation of the argu- ments and evidence, which have previously appeared in the economic literature. After a review of the theoretical arguments, the discussion turns to Feldstein’s original empirical evidence, which led him to conclude that so- cial security has significantly reduced private saving, and how this evidence was flawed by a computer pro- gramming error. The core of the article is a discussion of subsequent evidence indicating that currently avail- able historical data do not support the proposition that social security reduces private saving. A discussion and critical evaluation of Feldstein’s response to this evi- dence follows, along with a very brief discussion of studies based on international data and household sur- vey data. The final section presents the conclusion that although the total body of evidence-studies based on historical data, international data, and household sur- vey data-is inconclusive, the historical evidence fails to
14 Social Security Bulletin, January 1985/Vol. 48, No. 1

support the hypothesis that social security has reduced private saving.
Theoretical Considerations Argument for Social Security Reducing Saving
Saving for retirement. The proposition that social se- curity reduces private saving is based on the view that al- though people save for many reasons-to provide for contingencies, to build up an estate, and to finance children’s education, for example-the primary reason for saving is to provide resources for retirement. That is, workers consciously recognize that not only will they be unable or prefer not to work when they are older, but that (in the absence of a social security system) their consumption during retirement will depend on their own individual resources. During their working years, they therefore build up savings in the form of real assets (such as housing) and financial assets (such as stocks and bonds). These savings are then drawn down toward zero during retirement to finance consumption. This de- scription of household behavior is referred to as the life- cycle model of saving.
Aggregate saving in a growing economy. The rela- tionship of aggregate saving to individual saving is not simple. Since active workers save and retired workers dissave (consume more than their income), aggregate saving in the economy depends on the balance between saving and dissaving. In a growing economy, each suc- ceeding generation of workers is generally larger and, because it is richer, saves more than the generations that preceded it. Saving by active workers therefore exceeds dissaving by retired workers, who are both fewer in number and poorer. Thus aggregate saving is positive in a growing economy.
Substitution of social security wealth for ordinary wealth. How does the situation change if a social se- curity system is introduced into this world in which people save only to finance retirement? Workers con- tribute during their working years and receive retire- ment benefits when they stop working. Instead of ac- cumulating retirement wealth in the form of “ordinary wealth”-real and financial assets-workers accumu- late retirement wealth in the form of “social security wealth”-the accumulated value of rights to future social security benefits. This social security wealth is measured by the preserit value of expected benefits.less the present value of contributions still to be made. 3 (If the rate of return on contributions happens to equal the
3 The present value of a series of payments to be received in the fu- ture is that amount which if placed in an interest-bearing account to- day would just permit withdrawal of the future series of payments, and would be drawn down to zero after the final payment. For exam- ple, the present value, at 4 percent interest per year, of a series of 10 payments of $100 per year, to be paid at the end of each year, is $81 I .09. This amount, if placed in an account paying 4 percent inter- est per year, would permit withdrawal of $100 at the end of each year.
rate of return on private saving, the value of social se- curity wealth can also be measured by the accumulated value of contributions.) Under this scenario, workers substitute social security wealth for ordinary wealth in their portfolios of retirement assets-that is, workers save less for retirement in anticipation of promised future social security benefits. This reduction in saving is referred to as the asset substitution effect.
Impact of pay-as-you-go financing. How is aggregate saving affected by social security under this scenario? The private saving of each worker is used directly or in- directly to purchase capital assets-for example, stocks and bonds that ultimately finance the purchase of new equipment, buildings, and inventories. Corresponding- ly, dissaving requires the sale of capital assets. The re- sult for a fully funded social security system-one that holds assets equal to the value of social security wealth owned by workers participating in the social security system-would be similar provided that, directly or in- directly, contributions flow into the private capital mar- ket (see Digression 1). Contributions would be used to purchase securities. Benefits would be financed by sell- ing securities.
But aside from a small contingency fund, the U.S. so- cial security system is financed on a pay-as-you-go basis: contributions do not flow into the capital market; they are used to pay for the cost of current benefits.4 Thus, if individuals save less for retirement in anticipation of promised future benefits, social security will reduce private saving. Total saving will also be less because the social security system does not use the con- tributions to accumulate assets equal in value to promised future benefits. Over time, lower saving re- sults in a lower capital stock, so that aggregate income also will be lower.
Qualifications to Argument
Saving effect of inducement to retire earlier. The rate at which workers save during their working years de- pends on their desired level of consumption in retire- ment and expected age of retirement. The younger the expected retirement age, the higher the planned saving rate-that is, the earlier the worker expects to retire, the longer the anticipated period of retirement to be fi- nanced by accumulated savings, and the shorter the available working period in which to accumulate these savings.
Social security benefits are conditional on retirement. This fact may induce earlier retirement, resulting in a shorter workspan and a longer retirement period. Workers’ likely response would be to increase the rate
4 Since the social security system has not accumulated assets equal to the liability of promised future benefits, the social security wealth that individuals hold represehts a claim against the earnings of future generations rather than a claim against existing real assets. No real capital corresponds to social security wealth.
Social Security Bulletin, January 1985/Vol. 48, No. 1 15

Digression 1
Capital market effects require surpluses in the unified budget
If the social security system were autonomous, linkage of social security funding to the capital markets could be achieved by the purchase and sale of private securities. In actual practice, the U.S. social security system can only hold U.S. securities; additionally, social security financing is included in the unified budget. (Technically, the 1983 Amendments to the Social Security Act remove social security financing from the unified budget effective with fiscal year 1992. From an economic standpoint, the Government will have to continue considering social security revenues and expenditures as if they were included in the unified budget.)
A fully funded social security system would result in real capital formation only if any surplus in the social security fund was associated with a corresponding surplus (or smaller deficit) in the unified budget. This situation would enable the Treasury to buy outstanding debt. Private sellers of Government debt could then use the proceeds to invest in private capital. Each $1 of U.S. securi- ties held by the social security system would corre- spond to $1 of private real capital. However, if any surplus in the social security fund was offset by a corresponding deficit (or smaller surplus) in the general budget, the unified budget would remain unchanged. The Treasury would not redeem outstanding debt and thereby free private sector capital funds. Although the social security system would appear funded in the sense that it would hold a large fund of U.S. securities, there would be no additional real capital corresponding to this fund. The net effect on capital formation would not differ substantially from that resulting from pay-as-you-go financing.
of saving during their working years. In the aggregate, this retirement effect of social security would tend to in- crease the rate of saving and capital formation.S
Thus, the asset substitution effect of social security tends to reduce the rate of private saving in the econo- my; the retirement effect of social security tends to in- crease that rate. In principle, depending on the relative
5 The effect on aggregate saving of an earlier retirement age is com- plex. Suppose, for example, that the retirement age is reduced from age 70 to 65. Active workers will save more until retirement. But from age 65 to age 70, they will be dissaving during a period in which for- merly they would have been saving. The effect on aggregate saving de- pends on the balance of additional saving by workers versus dissaving by retirees. It is generally assumed that aggregate saving will increase if the retirement age is reduced.
strength of these opposing forces, saving may increase,
decrease, or be unchanged as a result of the introduction of a social security program. For most economists, the conventional wisdom had been that the asset substitu- tion effect probably outweighs the retirement effect, im- plying that, on balance, retirement saving is reduced by social security.
Other motives for saving. Most economists agree that the life-cycle model has a role in explaining saving be- havior. However, increasing concern exists that the role of saving for retirement has been overemphasized and the role of saving to meet contingencies or to leave a be- quest has been underemphasized.
The effect of social security on saving for contingen- cies is unclear. On the one hand, social security provides retirement income in the form of a joint-and-survivor annuity, and since 1972 benefits have been indexed to the price level.6 It therefore reduces the worker’s need to save in order to protect against the contingencies of the worker or spouse outliving retirement resources or of inflation eroding such resources. On the other hand, unlike ordinary savings, social security wealth is totally illiquid and provides no protection against emergencies occurring during the working years. Therefore, it is not clear whether social security increases or decreases sav- ing for contingencies.
The effect of social security on saving for bequests appears clearer. Social security wealth cannot be be- queathed. If the worker wants to leave a bequest, he or she must continue saving for this purpose. Indeed, if the worker under social security retires at an earlier age, the rate of such saving will be increased somewhat.
The main impact of social security-if such an effect exists-is therefore likely to be on saving for retirement. The impact on total saving will then depend both on how social security affects retirement saving and on how important retirement saving is relative to saving for con- tingencies, bequests, and other purposes. For purposes of illustration, suppose that social security reduces re- tirement saving by 40 percent. If retirement saving is 70 percent of total saving, total saving will be reduced by 28 percent; if retirement saving is 30 percent of total saving, total saving will be reduced by 12 percent. Thus, if social security does reduce retirement saving, the magnitude of the reduction in total saving is still uncer- tain.
Limitations of life-cycle model. The life-cycle model assumes that individuals have a definite, conscious vision of their economic future-lifetime earnings, in- terest rates, family composition, and tastes for con- sumption-and make rational, conscious, and complex decisions in developing and modifying a lifetime plan of spending and saving. Many social scientists are skeptical
6After retirement, the benefit amount is adjusted each year for the increase in the Consumer Price Index (CPI). For example, if the CPI has increased by 4 percent in the past year, the benefit is increased by 4 percent.
Social Security Bulletin, January 1985/Vol. 48, No. 1

that individuals are willing or able to make such deci- sions. The fact that before-and even since-the intro- duction of the U.S. social security program, many workers entered retirement with inadequate resources suggests that workers tend to be shortsighted in their re- tirement planning decisions or are simply unable to save adequately during their working years. Indeed, this situation was an important reason for the establishment of the U.S. system. Clearly, if in the absence of a social security system workers would accumulate only small amounts of ordinary retirement assets, a dollar-for-dol- lar substitution of social security wealth for ordinary wealth could not occur.
Further, some social scientists have hypothesized that social security may increase retirement saving. In two separate studies completed in the mid-1960’s, it was found that persons covered by pensions saved more than those not covered. One author (Katona, 1965) hy- pothesized that by making retirement feasible, pension plan participation induced workers to intensify their personal saving efforts to reach their retirement goal. This explanation implies that workers’ preferences for spending and saving are not independent of their re- sources, a view that is inconsistent with the traditional economic model of behavior underlying the life-cycle hypothesis. The second author (Cagan, 1965) hypothe- sized that by participating in a pension plan, workers recognized what their needs would be in retirement and increased their saving; that is, pension plans have a demonstration effect. The life-cycle model does not gen- erally incorporate such learning phenomena. To the ex- tent that saving behavior is not explained by the life-cy- cle model, the model cannot be used to predict the effect of social security on saving.
Private voluntary intergenerational transfers. To this point, it has been assumed that, in the absence of social security, workers would have to finance their retirement out of their own resources. But before the advent of so- cial security, many retired workers were supported by their children, who in turn expected to be supported by their children. Thus, the introduction of social security may simply substitute a system of mandatory public transfers from young to old for voluntary private trans- fers from young to old (see Digression 2). Alternatively, if, on balance, parents make lifetime transfers to chil- dren, they may increase such transfers to compensate for the taxes their children pay to finance the retirement benefits of the older generation. If such transfers are made in the form of financial bequests, workers save less for retirement but more for bequests. Total saving may be unchanged. If such transfers are made in the form of expenditures for education and health, saving for retirement is reduced and spending for education and health is increased. Measured saving will decrease, but in fact there is a change in the composition of capi- tal formation, not its level: more human capital is cre-
Digression 2
Rationale for social security
The question may be raised “Why have a social security system if it simply replaces a private voluntary system with a public system?” One possible rationale is the political judgment that the private voluntary system is too small. In that case, the public system does not simply substitute for the private system. A second rationale is that the public system has an element of insurance not pos- sible in the private system. For the private system, families with few children or suffering unemploy- ment or low earnings may be unable to support retired parents. For the public system, such adverse situations are averaged out. On the other hand, there is the “moral hazard” that workers under social security may be induced to work less or have fewer children, which immediately or over time decreases the support available to retired workers.
ated-better educated and healthier workers-and less ordinary capital-buildings, machines, and inventories.
The foregoing “private voluntary intergenerational transfer model” of social security was most fully devel- oped by Robert Barro (1974, 1978). Clearly, to the ex- tent that this model explains the spending, saving, and giving behavior of workers over the life cycle, the effect of social security on private saving is reduced.
Ambiguity of Effect of Social Security
To summarize the theoretical arguments concerning the effect of social security on private saving:
l If workers finance retirement out of accumulated . savings and if the age at which workers retire is not affected by participation in a social security pro- gram, then the introduction of a pay-as-you-go so- cial security system will unambiguously reduce aggregate saving. Workers will substitute social security wealth for ordinary wealth as they accu- mulate assets for retirement, while the pay-as- you-go social security system will not accumulate assets to offset this reduction in private saving.
l If workers finance retirement expenditures out of accumulated savings but are induced to retire earli- er by social security, the asset substitution effect may be offset. By retiring earlier than anticipated, workers will have fewer working years to accumu- late savings and more retirement years to dissave, requiring more saving.
l If workers finance retirement spending out of ac- cumulated savings but also have other motives for saving, such as providing for contingencies or leav- ing a bequest, then even if saving for retirement is
Social Security Bulletin, January 1985/Vol. 48, No. 1 17

reduced, the effect on total private saving is di- luted.
l If providing for retirement is a major motive for saving, but workers have only vague expectations about the future, or do not make conscious, ra- tional decisions about saving, it is less likely that they will change their saving patterns in response to social security, and, if they do, the direction of change may be counter to economic intuition.
l To the extent that workers finance consumption in retirement out of voluntary transfers from chil- dren, not out of accumulated savings, partici- pation in social security does not reduce private saving. A similar conclusion is reached if par- ents increase their bequests to children in order to offset the tax burden imposed on the younger generation by the social security system.
All in all, theoretical considerations do not unam- biguously predict the effect of social security on pri- vate saving. It is theoretically possible that social security increases, has no effect, or decreases saving for retirement. Even if social security reduces such sav- ing, the effect on total saving depends on how im- portant retirement saving is relative to total saving. To measure the existence and size of any effect of so- cial security on saving, the empirical evidence must be examined.
Empirical Approach
Historical Pattern
How does one evaluate the hypothesis that the social security system has reduced aggregate saving in the United States? One approach is to examine the histori- cal evidence.
A simple-some would say simplistic-approach is to examine the pattern of the private saving ratio over time. Chart 1 plots the ratio of personal saving to per- sonal disposable income, averaged over business cycles, for the period 1919-82. (Personal disposable income is income that is available to be consumed or saved.) Over this period, the saving ratio has varied with no discerni- ble trend around an average of about 7 percent. This pattern does not suggest that social security has reduced saving.
Although chart 1 is suggestive, the possibility remains that the stability of the saving ratio is an historical acci- dent resulting from the offsetting effects of different factors, including social security, that influence saving. A more rigorous approach that controls for these vari- ous factors is required.
Econometric Modeling
The approach taken by most investigators is to speci- fy and estimate an equation explaining consumption (re- ferred to as a consumption function). This equation
Chart l.-Personal saving as a percent of disposable in- come
Saving Ratio’
15-
- Post-
World
t Great Depression
i920 1930 1940 1950 1960 1970 1960
Year
*Ratios are averaged over business cycles measured from trough to trough.
includes a variable that measures the influence of so- cial security. Theory tells us that consumption depends on permanent income (expected income over the indi- vidual’s lifetime) and wealth. Further, households hold their wealth in the form of ordinary wealth (real and financial assets) and social security wealth. The assumed relationship is:
where C is consumption expenditures, Y is permanent income, W is ordinary wealth, and SSW is social securi- ty wealth. fi,, flz, and fiJ are coefficients (multipliers) of unknown magnitude. They are estimated by using mul- tiple regression analysis to statistically fit the specified equation to samples of data. This article focuses on samples consisting of historical data for the aggregate U.S. economy. Such data are referred to as aggregate “time-series” data.
Interpreting a Coefficient Estimate
The critical coefficient value is lj3, the coefficient of social security wealth. One important question is “How large is fil?” For example, assume the average values for the variables are (in billions of dollars): C = $915, Y = $1,000, W = $3,000, and SSW = $2,000. Suppose the estimated value of p3 is 0.02. This estimated value im- plies that for each additional dollar of social security wealth, consumption increases by $0.02. Given the as- sumed value of SSW, consumption is $40 (0.02 multi- plied by $2,000) billion higher than it would be in the absence of social security. Because consumption and saving sum to income, saving is $40 billion less than it would otherwise be. In this example, social security re- duces current saving by about one-third: saving with social security would be $85 ($1,000 minus $915) billion,
18 Social Security Bulletin, January 1985/Vol. 48, No. 1

while saving without social security would be $125 ($85 plus $40) billion.
A second important question is “How sure is one about the estimated size of /j3?” Estimates based on his- torical samples, like other samples, are imprecise due to sampling variability (see Digression 3). The statistical measure of imprecision generally used is the standard error of the estimate. The precision of an estimated co- efficient is evaluated by comparing it with its standard error. This comparison can be made in two ways.
One approach is to answer the question “What is the
Digression 3
History as a sample
If a time-series study uses all available historical data, how can the set of data be regarded as a sample? The answer is that the particular set of historical values observed is only one of many potential histories that might have occurred.
The world that generated the observed sequence of consumption values is extremely complex. The major variables used to explain consumption are permanent income, ordinary wealth, and social security wealth. A host of unknown variables that influence consumption, including random compo- nents of behavior, have been omitted. It is assumed that all of these influencing variables can be represented by a composite variable that influ- ences consumption in a random way.
Consider an “urn of history” containing a large number of balls of different values representing this composite variable. If history draws a ball labeled +6, for example, consumption is $6 bil- lion higher than explained by the set of variables; if history draws a ball labeled - 33, consumption is $33 billion less than explained by the set of vari- ables; and so on. The sample of recorded histor- ical observations is the result of a particular sequence of actual draws from the urn of history. For the particular history observed, the value of fi3 is estimated and a unique value, say 0.02, is ob- tained. A different history of draws from the urn can be conceived that would have yielded a differ- ent time series of observed values. And for this hypothetical sample, it is possible to imagine es- timating the value of /33, which will likely be a different value. If in this conceptual experiment the balls are replaced each time, this experiment can be repeated over and over, each time obtain- ing a different estimate of 113. In principle, then, the estimate of p3 is a sample estimate, one of many that conceptually might be estimated.
interval that one can be reasonably sure includes the true value?” The conventional interpretation of rea- sonably sure is 95-percent sure.
The second approach, emphasized in this article, an- swers the question “What is the probability that the esti- mated coefficient was obtained by chance if the true coefficient really is zero?” If this probability is less than some critical value, the proposition that the true coefficient is not zero is accepted and the estimate is referred to as statistically significant. If the probability is greater than the critical value, the estimate fails the test and is referred to as statistically insignificant. The critical value is typically set at 5 percent-l chance in 20.’ The accepted approach is to place the burden of proof on the hypothesis that social security affects consumption (hence saving)-that is, that /3, is not zero.
For example, suppose the estimate of /3, is 0.020 and its standard error is 0.016. The first approach is to com- pute the interval that one is 95-percent sure contains the true coefficient. In this example, that interval ranges from - 0.012 to +0.052-a very large interval. Since the estimated standard error is large relative to the esti- mated value of the coefficient, one is very uncertain about its true value. Alternatively, applying the second approach to this example indicates about 2 chances in 10 of getting a coefficient of 0.02 if the true coefficient is really zero: Since this is much larger than the critical value of 1 chance in 20, the conclusion is that the esti- mated coefficient is statistically insignificant.
On the other hand, suppose the standard error were 0.008 in this example. The 95-percent-sure interval would then range from 0.004 to 0.036. Although the estimate remains imprecise, the range of uncertainty is reduced. Further, there is now only 1 chance in 100 of getting an estimated coefficient of 0.02 if the true coeffi- cient is zero. The conclusion now would be that the co- efficient is statistically significant.
Early Evidence
Initial Evidence
Martin Feldstein presented the initial evidence in an important article in the Journal of Political Economy in 1974. To flesh out the specification of the equation, Feldstein measured permanent income (which cannot be directly observed) by current disposable income, the previous year’s disposable income, and undistributed corporate profits. But the unique and important con- tribution of the study was the measurement of social se- curity wealth. Two measures of social security wealth
’ In practice, the ratio of the coefficient estimate to its standard er- ror-referred to as the sample “t-ratio” or “t-statistic”-is com- puted and compared to its critical value. If the critical probability value is set at 5 percent; the critical value of the t-ratio is approximate- ly 2 for reasonably large samples.
Social Security Bulletin, January 19851Vol. 48, No. 1 19

were constructed: (1) gross social security wealth, the estimated actuarial value of future benefits expected by individuals, and (2) net social security wealth, defined as gross social security wealth less the estimated actuarial value of future payroll taxes that individuals expect to
pay.* Although Feldstein presented a number of results, he
focused on the equation using the gross social security wealth concept with the sample period 1929-71.9 For this period, the estimated coefficient of social security wealth was 0.021, and the estimated standard error was 0.006. Since there is less than 1 chance in 1,000 of ob- taining a coefficient this large if the true coefficient is zero, the estimated coefficient is clearly statistically sig- nificant. Based on this coefficient, Feldstein estimated that in 1971 social security had reduced personal saving by 50 percent.
Confirmation from 1978 Update
In 1978, Feldstein reestimated his specification of the consumption function using revised and improved esti- mates of national income and its components (Feld- stein, 1978, 1979). The terminal year of the period of estimation was extended from 1971 to 1974 and the ini- tial year was changed from 1929 to 1930. The results were quite close to those Feldstein obtained in his 1974 paper. The estimated coefficient of social security wealth was 0.024 and, with a standard error of 0.009, is clearly statistically significant. This result appeared to confirm Feldstein’s original conclusion.
Questions about Postwar Results
Results were much weaker when the period of estima- tion was limited to the postwar period beginning in 1947. In his 1974 study, for the period 1947-71, Feld- stein’s estimate of the social security wealth coefficient was 0.014 with a standard error of 0.030. The probabili- ty of obtaining a coefficient this large by chance is about 65 percent, so high that the estimate is considered statis- tically insignificant. Results for the 1947-74 period were even weaker.tO The coefficient of social security wealth was 0.004 with a standard error of 0.042. The probabili- ty of obtaining a coefficient of this size by chance is more than 90 percent. Again, the coefficient is statisti- cally insignificant.
Feldstein has consistently discounted results based on the postwar period. He argues that there is insufficient independent variation in the variables over the postwar period to statistically discriminate among competing hy-
8 A detailed discussion of the construction of these variables can be found in Leimer and Lesnoy (1980).
9The years around World War II, 1941-46, are excluded. The post- war period begins with 1947.
to Postwar coefficients were estimated by the authors. Feldstein did not publish postwar results in his 1978 study.
potheses (Feldstein, 1979, page 39). This controversial position is examined more carefully below.
Other Time-Series Evidence
Feldstein’s article spawned a number of other time- series studies, including those by Alicia Munnell (1974a, 1974b), Robert Barro (1978), and Michael Darby (1979). These studies differed primarily in the specifica- tion of the consumption function-that is, in the vari- ables used to explain consumption. The results differed considerably.
Alicia Munnell (1974) used a specification that incor- porated the unemployment rate, and, most important, a separate variable to measure the retirement effect of so- cial security.” The estimated social security wealth co- efficient implied a negative asset substitution effect of social security on saving; the coefficient of the retire- ment variable implied a positive retirement effect of so- cial security on saving. On balance, social security was estimated to have a negative effect on saving, but con- siderably less than estimated by Feldstein.
The consumption function specified by Barro (1978) includes both the unemployment rate and the govern- ment surplus (revenues less expenditures) as additional explanatory variables. The estimated coefficient of so- cial security wealth was positive but insignificant for both the postwar years and a longer period that included the prewar years. Barro concluded that although the time-series evidence could not rule out economically important effects of social security on private saving, the evidence did not provide statistical support for the hypothesis that social security reduced private saving.
The specification of the consumption function used by Darby (1979) is somewhat different. First, perma- nent income is estimated as a weighted average of past incomes, with the weights declining exponentially. Second, to explain expenditures on consumer durable goods (automobiles and furniture, for example), Darby includes as explanatory variables the stock of consumer durable goods, the stock of real money balances (the money stock adjusted for changes in the price level), the relative price of durable and nondurable consumer goods, and the interest rate.
For a sample period including both prewar and post- war years, the coefficient of social security wealth esti- mated by Darby was positive but insignificant. For the postwar period, the estimated coefficient was sometimes positive, sometimes negative, but insignificant. Darby concluded that the results may be interpreted as either supporting or denying the hypothesis that social security has had an economically important effect on private saving.
tt Unlike other authors, Munnell used saving as the variable to be explained. The saving variable was derived from national wealth ac- counts. The consumer expenditures variable used by other authors was based on the National Income and Product Accounts.
Social Security Bulletin, January 1985/Vol. 48, No. 1

New Evidence In two papers presented in 1980 and 1981, the authors
presented new evidence that cast doubt on the conclu- sions of Feldstein’s studies and other studies using the social security wealth variable constructed by Feldstein. The first paper (Leimer and Lesnoy, 1980), presented at the 1980 Annual Meeting of the American Economic Association, reexamined the studies by Martin Feld- stein.i2 The new evidence had three parts: (1) the demonstration that the original evidence had been flawed by a serious programming error in the construc- tion of the key data series, social security wealth; (2) the presentation of empirical estimates using alternative measures of social security wealth; and (3) an exam- ination of the sensitivity of results to alternative periods of estimation. The second paper (Lesnoy and Leimer, 1981), delivered at the 1981 Annual Conference of the Western Economic Association, presented a similar reexamination of the studies by Alicia Munnell, Robert Barro, and Michael Darby.
Error in Original Evidence
An attempt by the authors to replicate Feldstein’s construction of social security wealth revealed that his series was incorrect. Feldstein acknowledged that a computer programming error had been made in in- corporating the widows’ benefits provisions of the 1956 Amendments to the Social Security Act. As a result of this error, his social security wealth series grew too rapidly after 1957. By 1974, the series was 37 percent larger than the correct value.
The estimated coefficient of social security wealth is quite different when a correctly programmed replica Feldstein variable is used instead of the incorrect orig- inal Feldstein variable.13 For the period 1930-74, the estimated coefficient is 0.011 with a standard error of 0.011. The probability of obtaining a coefficient this large by chance is about 30 percent. By conventional standards, this coefficient is not significantly different from zero. The result for the postwar period, 1947-74, is more striking. The estimated coefficient of the replica variable is minus 0.060 (implying that social security in- creases saving) with a standard error of 0.020. The probability of obtaining a coefficient this large (in abso- lute value) by chance is about 3 in 1,000. The negative
12 Leimer and Lesnoy (1982) presents a shortened published version of this paper.
13 Since the authors’ original presentation, Feldstein has corrected and revised his variable. To minimize confusion, his original incorrect variable will be referred to as the original Feldstein variable, the same variable with the programming error corrected will be referred to as the corrected Feldstein variable, and his variable with the program- ming error corrected and with revised assumptions will be referred to as the revised Feldstein variable. The variable called the replica Feld- stein variable is the authors’ version of the corrected Feldstein variable and yields essentially identical results. To facilitate comparisons with the authors’ other estimates, the replica variable is used.
coefficient is therefore statistically significant. One should not give much weight to the numerical size of this estimate, however. The coefficient implies that, in the absence of social security, personal saving would have been $115 billion lower in 1974. Actual personal saving in 1974 was $73 billion. In the absence of social security, personal saving under this calculation would have been negative, which is highly unlikely. Nonethe- less, this result is clearly inconsistent with the hypothesis that social security reduces personal saving.
Unknown Correct Measure
The discovery of a computer programming error in an important economic study attracted much professional and public attention, so much so that the main points of the authors’ studies are frequently lost. In particular, the studies demonstrate that the estimated effect of social security wealth on personal saving varies depend- ing on the measure of wealth used. This concept is important because the correct measure of social security wealth is not known.
Economists generally agree that anticipated retire- ment benefits represent a form of wealth, but little agreement is found about how to measure such wealth. Unlike ordinary wealth-stocks, bonds, and houses, for example-no objective market value exists for social security wealth. A “best guess” of the value that indi- viduals place on social security wealth has to be made and that entails making a best guess about how individ- uals project future benefits and taxes.
Perception of Benefits and Taxes
It is not known how-or even whether-people project future social security benefits and taxes. The procedure developed by Martin Feldstein (and followed by the authors with important modifications) for calcu- lating social security wealth assumes that a representa- tive worker acts as if he or she makes two projections. First, the worker projects what the expected income per person will be in some future year. The second projec- tion is what the ratio of average benefits to income- referred to as the benefit-income ratio-will be for that future year. The projected benefit is found by multiply- ing the expected benefit-income ratio by projected in- come. The projected social security tax for future years is found similarly by projecting the ratio of average tax to income per person-referred to as the tax-income ratio. For example, suppose the representative worker was age 45 in 1975. Real income (income adjusted for changes in the price level) per person in that year was $4,051. Suppose that worker expected real income per person to grow at 2 percent per year. Then real income per person would be expected to reach $6,020 by the time the worker attains age 65. If the anticipated bene- fit-income ratio was 40 percent, then the projected bene-
Social Security Bulletin, January 19851Vol. 48, No. 1 21

fit at age 65 would be 40 percent of $6,020, or $2,408. The critical question is “Given the observed history
of benefit-income ratios, how does the worker project future ratios?” Feldstein assumed that all workers present and past have expected the same benefit-income ratio to prevail for all time. In effect, workers were as- sumed to ignore changes in current social security bene- fit provisions and changes in the benefit-income ratio during periods between benefit adjustments. Feldstein rationalized this assumption by arguing that workers be- lieved Congress has always intended to amend the benefit formula with some regularity to maintain a fairly constant benefit-income ratio.
The authors view this assumption as overly restric- tive. Chart 2 depicts the history of benefit-income ratios for beneficiaries currently receiving monthly benefits. The generally declining ratios between benefit formula changes are explained in part by the fact that the benefit formula is progressive and average earnings increase over time. Thus, for a given benefit schedule, as average earnings increase, the ratio of benefits to earnings (income) declines. In addition, benefit levels were not automatically adjusted for inflation until after the 1972 Amendments to the Social Security Act. It seems clear from chart 2 that sufficient historic variation has oc- curred in the benefit-income ratio to raise doubts about an assumption that all workers present and past have ex- pected the same benefit-income ratio to hold for all time. The next sections examine some alternative assumptions.
Alternative Perceptions
No one knows the correct perception of social security benefits. The authors’ approach was to examine
Chart 2.-Ratio of benefits- per beneficiary to dispos- able income per capita
Ratio .7 r + l
01 ’ I I 1 I 1 I I I 1940 1945 1950 1955 1960 1965 1970 1975 1980
Year
*~eara in which benefit formula was changed
a number of alternatives to see if the results were sensi- tive to the particular assumption adopted. As examples, consider the following five possibilities.
First, following Feldstein, assume that all individuals present and past expected the same benefit-income ratio (based on a prediction of the average benefit-income ratio over the period 1940-71). This projection is referred to as the constant ratio or original Feldstein perception.
Second, assume that individuals are shortsighted and simply expect continuation of the current ratio into the future. This projection is referred to as the current ratio perception.
Third, assume that individuals use the most recent ob- served ratio to modify their previous projection of the benefit-income ratio. This projection is referred to as the adaptive expectations perception.
Fourth, assume that individuals base their projections on the best available published information, namely SSA actuarial studies. This projection is referred to as the best information perception.
Finally, assume that individuals are prescient and within observed history were able to perfectly forecast the future course of benefit-income ratios. This projec- tion is referred to as the perfect forecast perception. (This perception is considered in part because it parallels the assumption Feldstein makes in projecting tax- income ratios when he computes net social security wealth.)
Estimates of the social security wealth coefficient based on these alternative perceptions are shown in table 1. The period of estimation is 1930-76 (excluding the years around World War II, 1941-46); alternative
periods of estimation are considered below. All of the estimated coefficients suggest that if social
security has reduced private saving, the reduction was considerably less than Feldstein estimated. In 1971 (the year Feldstein used to estimate the effect of social security on saving), for example, the largest estimated reduction-associated with the perfect forecast percep- tion-was 20 percent; the smallest-associated with the current ratio perception-was 0 percent.
More important, the evidence is not strong enough for any perception to reject the hypothesis that social security has no effect on personal saving. Theory sug- gests that the true coefficient may be positive or nega- tive. Given this possibility, the chance of obtaining a coefficient of gross social security wealth as large as esti- mated if the true coefficient is zero ranges from 10 in 20 for the perfect forecast perception to 19 in 20 for the current ratio perception. If the theory is interpreted as implying that the true coefficient may be zero or posi- tive, these probabilities should be halved. In no case is the probability value lower than 1 in 20, which is the generally accepted level of statistical significance. It is important to interpret these results carefully. They do
22 Social Security Bulletin, January 1985/Vol. 48, No. 1
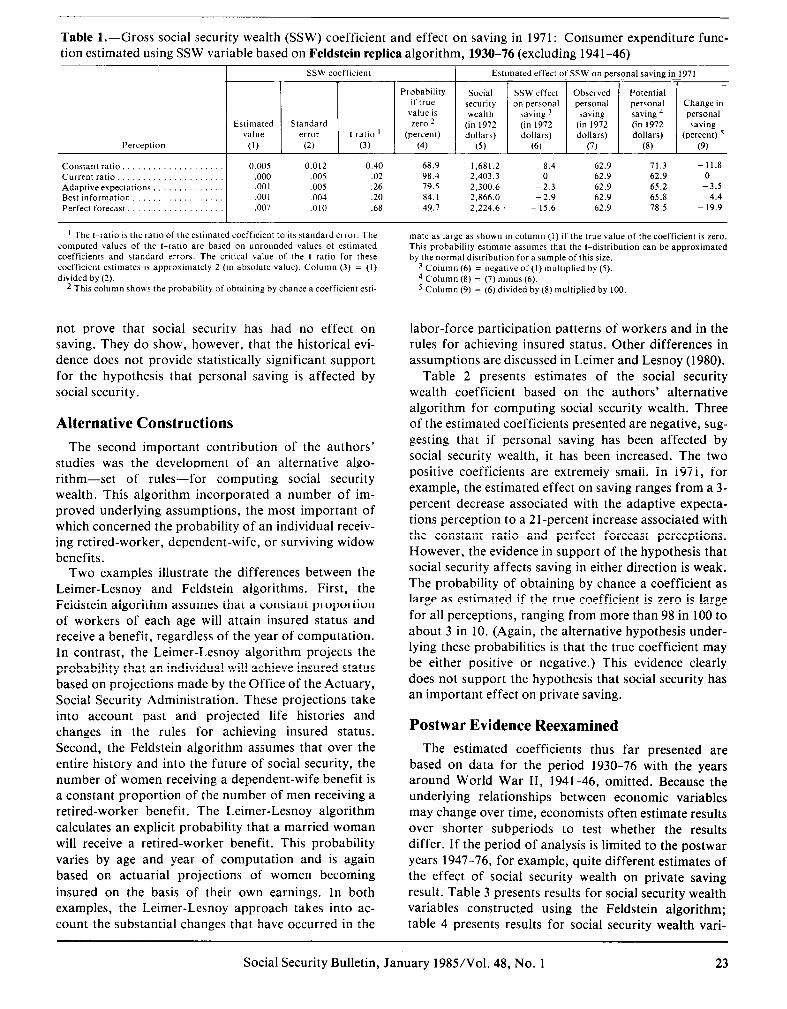
Table I.--Gross social security wealth (SSW) coefficient and effect on saving in 1971: Consumer expenditure func- tion estimated using SSW variable based on Feldstein replica algorithm, 1930-76 (excluding 1941-46)
Perception
Constant ratio. .................. Current ratio,
Adaptive expectations ............. Best information. ................ Perfect forecast. .................
Estimated value
(1)
0.005 ,000 ,001 ,001
,007
L Standard error
(2)
0.012 ,005 ,005 ,004 ,010
SSW coefficient
0.40 68.9 .02 98.4 .26 79.5
.20 84. I
.68 49.7
Social security wealth
(in 1972 dollars)
(5)
1,681.2 8.4 2,403.3 0
2,300.6 -2.3
2,866.0 -2.9 2,224.6 - 15.6
Estimated effect c ,f ssw on pa tonal saving in 1971
Observed personal
saving (in 1972 dollars)
(7)
62.9 62.9 62.9 62.9 62.9
1 L
Potential personal Change in I saving 4 personal (in 1972 saving dollars) (percent) 5
(8) (9)
71.3 -11.8 62.9 0
65.2 -3.5 65.8 -4.4 78.5 - 19.9
t The t-ratio is the ratio of the estimated coefficient to its standard error. The
computed values of the t-ratio are based on unrounded values of estimated coefficients and standard errors. The critical value of the t-ratio for these coefficient estimates is approximately 2 (in absolute value). Column (3) = (I)
divided by (2). 2 This column shows the probability of obtaining by chance a coefficient esti-
not prove that social security has had no effect on saving. They do show, however, that the historical evi- dence does not provide statistically significant support for the hypothesis that personal saving is affected by social security.
Alternative Constructions
The second important contribution of the authors’ studies was the development of an alternative algo- rithm-set of rules-for computing social security wealth. This algorithm incorporated a number of im- proved underlying assumptions, the most important of which concerned the probability of an individual receiv- ing retired-worker, dependent-wife, or surviving widow benefits.
Two examples illustrate the differences between the Leimer-Lesnoy and Feldstein algorithms. First, the Feldstein algorithm assumes that a constant proportion of workers of each age will attain insured status and receive a benefit, regardless of the year of computation. In contrast, the Leimer-Lesnoy algorithm projects the probability that an individual will achieve insured status based on projections made by the Office of the Actuary, Social Security Administration. These projections take into account past and projected life histories and changes in the rules for achieving insured status. Second, the Feldstein algorithm assumes that over the entire history and into the future of social security, the number of women receiving a dependent-wife benefit is a constant proportion of the number of men receiving a retired-worker benefit. The Leimer-Lesnoy algorithm calculates an explicit probability that a married woman will receive a retired-worker benefit. This probability varies by age and year of computation and is again based on actuarial projections of women becoming insured on the basis of their own earnings. In both examples, the Leimer-Lesnoy approach takes into ac- count the substantial changes that have occurred in the
mate as large as shown in column (1) if the true value of the coefficient is zero.
This probability estimate assumes that the t-distribution can be approximated by the normal distribution for a sample of this sire.
3 Column (6) = negative of (I) multiplied by (5).
4 Column (8) = (7) minus (6). 5 Column (9) = (6) divided by (8) multiplied by 100.
labor-force participation patterns of workers and in the rules for achieving insured status. Other differences in assumptions are discussed in Leimer and Lesnoy (1980).
Table 2 presents estimates of the social security wealth coefficient based on the authors’ alternative algorithm for computing social security wealth. Three of the estimated coefficients presented are negative, sug- gesting that if personal saving has been affected by social security wealth, it has been increased. The two positive coefficients are extremely small. In 1971, for example, the estimated effect on saving ranges from a 3- percent decrease associated with the adaptive expecta- tions perception to a 21-percent increase associated with the constant ratio and perfect forecast perceptions. However, the evidence in support of the hypothesis that social security affects saving in either direction is weak. The probability of obtaining by chance a coefficient as large as estimated if the true coefficient is zero is large for all perceptions, ranging from more than 98 in 100 to about 3 in 10. (Again, the alternative hypothesis under- lying these probabilities is that the true coefficient may be either positive or negative.) This evidence clearly does not support the hypothesis that social security has an important effect on private saving.
Postwar Evidence Reexamined
The estimated coefficients thus far presented are based on data for the period 1930-76 with the years around World War II, 1941-46, omitted. Because the underlying relationships between economic variables may change over time, economists often estimate results over shorter subperiods to test whether the results differ. If the period of analysis is limited to the postwar years 1947-76, for example, quite different estimates of the effect of social security wealth on private saving result. Table 3 presents results for social security wealth variables construct.ed using the Feldstein algorithm; table 4 presents results for social security wealth vari-
Social Security Bulletin, January 1985/Vol. 48, No. 1 23

Constant ratio ..................... 0.006
Current ratio. .................... - ,001
Adaptive expectations. ............. ,001
Best information, ................. .ooo
Perfect forecast. .................. - .oos
SSW coefficient Estimated effect of SSW on personal saving in 1971 I I , I t
Probability Social Observed Potential
if true security personal personal Change in
value is wealth saving saving 4 personal
zero 2 (in 1972 (in 1972 (in 1972 saving
(percent) dollars) dollars) dollars) (percent) 5
(4)L (5) (7) (8) (9) -- -
0.006 - 1.01 31.2 I ,849.2 + 11.1 62.9 51.8 +21.4
.005 -.14 88.9 2,258.I + 2.3 62.9 60.6 +3.8
,005 .16 87.3 2,125.J -2.1 62.9 65.0 -3.2
.004 .02 98.4 2,67 1.5 0 62.9 62.9 0
,006 - .I9 43.0 2,224.0 +11.1 62.9 51.8 +21.4
-
Table 2.-Gross social security wealth @SW) coefficient and effect on saving in 1971: Consumer expenditure func- tion estimated using SSW variable based on Leimer-Lesnoy algorithm, 1930-76 (excluding 1941-46)
’ The l-ratio is the ratio of the estimated coefficient to its standard error. The computed values of the t-ratio are based on unrounded values of estimated
coefficients and standard errors. The critical value of the t-ratio for these coefficient estimates is approximately 2 (in absolute value). Column (3) = (1) divided by (2).
2 This column shows the probability of obtaining by chance a coefficient esti-
ables constructed using the Leimer-Lesnoy algorithm. All of the coefficient estimates are negative-that is,
the estimated coefficients of social security wealth imply that social security increases private saving. In 1971, for example, the largest estimated increase was associated with the constant ratio perception based on the Feld- stein replica algorithm; the smallest estimated increase was 18 percent, associated with the adaptive expecta- tions perception and based on the Leimer-Lesnoy algo- rithm.
The estimated coefficients for the constant ratio and perfect forecast perceptions are statistically significant whether based on the Feldstein replica or Leimer- Lesnoy algorithm. In table 3, for example, the probabil- ity of obtaining by chance a coefficient as large as that estimated for the constant ratio social security vari- able-assuming that the true value is zero-is about 5 in 1 ,OOO! Nevertheless, these large negative coefficients should be viewed with considerable skepticism, partic- ularly the constant ratio and perfect forecast coeffi- cients because they imply that personal saving would be negative in the absence of social security. The remaining estimated coefficients in tables 3 and 4 are not statis- tically significant-the chance of obtaining estimates this large if the true coefficient is zero ranges from about 3 in 10 to about 4 in 10. Clearly, the postwar evidence does not support the hypothesis that social security reduces private saving.
Feldstein’s interpretation of postwar evidence. Feld- stein argues that greater weight should be given to the estimates based on the period that includes the prewar years. His position is based on the interpretation of the estimates obtained for the postwar period in his 1974 and 1978 studies. In the 1974 study, for example, the co- efficient of social security wealth estimated for the period 1947-71 was 0.014, somewhat smaller than the estimate of 0.021 obtained for the period 1929-71. But this postwar estimate is very imprecise. The standard
mate as large as shown in column (I) if the true value of the coefficient is zero. This probability estimate assumes that the t-distribution can be approximated
by the normal distribution for a sample of this size.
3 Column (6) = negative of (1) multiplied by (5).
4 Column (8) = (7) minus (6). 5 Column (9) = (6) divided by (8) multiplied by 100.
error is 0.030, more than twice the size of the estimated coefficient. The probability of obtaining an estimate as large as 0.014 by chance if the true coefficient is zero is almost 2 in 3. Alternatively, the interval that would con- tain the true coefficient with 95percent confidence would range from - 0.049 to 0.077!
Feldstein argues that this imprecision is due to a statistical problem called multicollinearity. A basic problem of analyzing time-series data is that variables frequently move together over time (for example, in- come, wealth, and a number of other variables explain- ing consumption all tend to grow over time). Such movement makes it difficult to estimate the coefficients with precision. In particular, the estimated coefficient of a variable that should have explanatory power, but has relatively little independent movement, may have a large standard error. Feldstein argues that this problem occurs if the sample is restricted to the postwar period. Over this period, less independent variation-that is, variation that is not simply proportional to income-is seen in the social security wealth variable. If the prewar years are included, however, more independent vari- ation is observed because social security wealth is zero in a number of years before 1937.
Importance of postwar evidence. In the authors’ view, Feldstein’s argument is not persuasive. The impre- cision of his estimated coefficient of social security wealth for the postwar period is the direct consequence of using the incorrectly programmed social security wealth variable. If the replica Feldstein variable is used to estimate the coefficient of social security wealth for the period 1947-71, a coefficient of minus 0.057 with a standard error of 0.016 is obtained.14 The probability of obtaining an estimate this large by chance if the true co- efficient is zero is less than 1 in 1,000. Indeed, if the co- efficient estimates in tables 1 and 2 are compared with
14 A similar result is obtained if the corrected Feldstein variable is
used (see footnote 13).
24 Social Security Bulletin, January 1985/Vol. 48, No. 1

Table 3.-Gross social security wealth (SSW) coefficient and effect on saving in 1971: Consumer expenditure func- tion estimated using SSW variable based on Feldstein replica algorithm, 1947-76
SSW coefficient Estimated effect of SSW on personal saving in 1971
Standard errOr
(2)
Social ssw effect
security on personal wealth saving 3
(in 1972 (in 1972
dollars) dollars)
_(5) 1 (6)
Observed
personal saving
(in 1972
dollars)
(7)
0.024 -2.83 0.5
,006 - .98 32.7
.006 - .86 39.0
,005 - .74 45.9
.019 -2.14 3.2
1,681.2 + 1’4.3 62.9 -51.4 2,403.3 + 14.4 62.9 48.5 + 29.7 2.300.6 + 11.5 62.9 51.4 +22.4 2,866.0 + 14.3 62.9 48.6 + 29.4
2.224.6 + 93.4 62.9 - 30.5 .
Perception
Constant ratio .................... - 0.068 Current ratio ..................... - ,006
Adaptive expectations .............. - ,005 Best information. ................. - ,005 Perfect forecast. .................. - .042
1 The l-ratio is the ratio of the estimated coefficient to its standard error. The computed values of the t-ratio are based on unrounded values of estimated
coefficients and standard errors. The critical value of the t-ratio for these coefficient estimates is approximately 2 (in absolute value). Column (3) = (1) divided by (2).
2 This column shows the probability of obtaining by chance a coefficientesti-
those in tables 3 and 4, the postwar estimates are more precise (as measured by the t-ratio, the ratio of the coef- ficient to its standard error) for every perception than the estimates for the full period. The contention that less weight should be given to the postwar period esti- mates because of their imprecision is not supported by the evidence.
Moreover, the inclusion of social security wealth data for the prewar years requires considerable caution. The Social Security Act was passed in 1935. Tax collections began in 1937. When did workers begin to form their perception of social security wealth-in 1935 or 1937? Benefits were not scheduled to be paid until 1942, but, as a result of the 1939 Amendments to the Social Security Act, benefit payments began in 1940. The benefit formula differed radically from that passed in 1935. How did workers form their perceptions of future benefits in the period before benefits were first paid? Before the 1939 amendments, did workers base their perceptions on the 1935 Act or were they able to per- ceive that those provisions would be changed? These questions suggest that the social security wealth values computed for the prewar years are especially suspect.
Other Time-Series Studies
As noted earlier, several other studies have been based on time-series data. Each of these studies uses a different specification of the consumption function- that is, different variables, in addition to social security wealth, are included to explain consumption (or saving). To review: Munnell (1974) used different measures of saving and included a variable to explicitly measure the retirement effect of social security. Barro (1978) in- cluded the unemployment rate and government surplus as well as current and previous year’s disposable income and undistributed corporate profits as measures of permanent income. Darby (1979) measured permanent income by a weighted average of past incomes, where
mate as large as shown in column (I) if the true value of the coefficient is zero. This probability estimate assumes that the t-distribution can be approximated
by the normal distribution for a sample of this size.
3 Column (6) = negative of (I) multiplied by (5). 4 Column (8) = (7) minus (6).
5 Column (9) = (6) divided by (8) multiplied by 100.
the weights declined exponentially. He also included the money stock and consumer durables stock among the variables explaining that part of consumer expenditures represented by consumer durables.
The problem with all of these studies is that they use the incorrectly programmed social security wealth vari- able constructed by Feldstein. Thus the published results are no longer meaningful. The paper presented at the Western Economic Association conference (Lesnoy and Leimer, 1981) contained new evidence based on these alternative specifications of the consumption ‘function but with correct social security wealth vari- ables. With some minor exceptions, the authors’ conclu- sions based on the simpler model specified by Feldstein were validated. Although the time-series evidence can- not rule out an economically important effect of social security on private saving, the evidence does not provide statistical support for the hypothesis that social security reduces private saving.
Debate Continues
Feldstein’s New Evidence
In response to the studies refuting his original conclu- sion, Feldstein presented additional, supporting evi- dence (Feldstein, 1980, 1982; Arenson, 1980). He contends that the contradictory evidence “ignores the major Social Security legislation that raised the benefits in 1972 by 20 percent and permanently indexed these higher benefits against inflation.”
He points out that if the computer programming error is corrected and the period of estimation is limited to 1930-71-that is, post-1971 data are excluded-the estimated coefficient of social security wealth is 0.015 with a standard error of 0.010. Although the estimated coefficient is not statistically significant-the probabil- ity of obtaining a coefficient this large by chance is about 11 in 100, which is larger than the critical value of
Social Security Bulletin, January 1985/Vol. 48, No. 1 25

Table 4.-Gross social security wealth (SSW) coefficient and effect on saving in 1971: Consumer expenditure func- tion estimated using SSW variable based on Leimer-Lesnoy algorithm, 1947-76
SSW coefficient Estimated effect of SSW on personal saving in 1971
Probability Social ssw effect if true security on personal
value is wealth saving 7 Estimated Standard zero 2 (in 1972 (in 1972
value error I-ratlo ’ (percent) dollars) dollars) Perception (1) (2) (3) (4) (5) (6)
Constant ratio., -0.022 0.008 - 2.80 0.5 I ,849.2 c40.7 Current ratio. ,006 ,006 1.02 30.8 2,258. I + 13.5 Adaptive expectations - .005 ,006 - .79 43.0 2,125.3 t 10.6 Best information. - ,004 ,005 .85 39.5 2.67 I .5 t 10.7 Perfect forecast. :. . ,019 ,007 -2.57 1.0 2.224.0 t 42.3
62.9 22.2 + 183.3 62.9 49.4 +27.3 62.9 52.3 t20.3 62.9 52.2 + 20.5 62.9 20.6 t 205.3
t The I-ratio is the ratio of the estimated coefficient to its standard error. The
computed values of the t-ratio are based on unrounded values of estimated coefficients and standard errors. The critical value of the t-ratio for these coefficient estimates is approximately 2 (III absolute value). Column (3) = (I) divided by (2).
2 This column shows the probability of obtaining by chance a coefficient esti-
5 in loo-he concludes that the result suggests an eco- nomically meaningful effect of social security on saving.
He further contends that if post-1971 years are in- cluded with the 1972 legislative change taken into account (after correcting the programming error), the results are similar to those reported in his earlier studies. The method he uses to reflect the 1972 legislation is simply to increase the corrected social security wealth series by 20 percent beginning in 1972. (The resulting social security wealth variable is referred to as the re- vised Feldstein variable.) And indeed, using this revised social security wealth variable, Feldstein now estimates that for the period 1930-76 the coefficient of social security wealth is 0.018 with a standard error of 0.009. The probability of obtaining a coefficient this large by chance is approximately 5 in 100, about equal to the critical value. The estimate is therefore judged to be statistically significant, supporting the hypothesis that social security reduces saving. In addition, Feldstein claims that evidence based on international data and on household survey data also support this hypothesis.
Weakness of New Evidence
How much weight should be given to Feldstein’s new evidence? The authors’ research suggests the revised estimates provide very weak statistical support for the proposition that social security reduces private saving. (Leimer and Lesnoy, 1983, thoroughly examines Feld- stein’s new evidence.)
First, if the consumption function is reestimated using recently revised national income data, Feldstein’s results are considerably weaker. For 1930-71, when the revised Feldstein variable is used, the estimated coeffi- cient of social security wealth is 0.013 with a standard error of 0.009. The probability of obtaining a coeffi- cient this large by chance is approximately 18 in 100. For 1930-76, when the revised Feldstein variable is used, the estimated coefficient of the social security
mate as large as shown in column (I) if the true value of the coefficient is zero.
This probability estimate assumes that the I-distribution can be approximated by the normal distribution for a sample of this sire.
3 Column (6) = negative of (I) multiplied by (5). 4 Column (8) = (7) minus (6). 5 Column (9) = (6) divided by (8) multiphed by 100.
wealth variable is 0.014 with a standard error of 0.009. The probability of obtaining a coefficient this large by chance is about 11 in 100. By conventional standards, neither coefficient is statistically significant. On the other hand, the possibility of a substantial effect of social security on private saving cannot be ruled out.
Second, the postwar evidence tells another story. For 1947-71, when the revised Feldstein variable is used, the estimated coefficient is minus 0.057 (which implies that social security increases private saving) with a standard error of 0.016. The probability of observing a coeffi- cient this large by chance is less than 1 in 1,000. Although technically statistically significant, the size of the estimated coefficient is implausibly large because it implies that private saving would be negative in the ab- sence of social security. Nevertheless, the estimate is clearly inconsistent with the proposition that social security reduces private saving. For 1947-76, when the revised Feldstein variable is used, the estimated coeffi- cient of social security wealth is 0.001 with a standard error of 0.013. Since there are 9 chances in 10 of obtain- ing a coefficient this large by chance, the estimated co- efficient is clearly insignificant. The postwar evidence clearly provides no support for the proposition that social security reduces private saving, but it should be recalled that there is disagreement about the interpre- tation of postwar results.
Third, Feldstein’s revised results depend critically on the algorithm used to construct the social security wealth series. If the consumption function is reesti- mated using a revised version of the Leimer-Lesnoy con- stant ratio social security wealth variable-that is, beginning in 1972, the Leimer-Lesnoy constant ratio variable is increased by 20 percent-the results do not support the hypothesis that social security reduces private saving. For 1930-76, the estimated coefficient of social security wealth is 0.001 with a standard error of 0.007. The probability of obtaining a coefficient this large by chance if the true coefficient is zero is almost 90
26 Social Security Bulletin, January 1985/Vol. 48, No. 1

in 100. For 1947-76, the estimated coefficient is - 0.009 with a standard error of 0.008. The probability of ob- serving a coefficient this large by chance is almost 30 in 100. Neither coefficient is significantly different from zero. Thus, the procedure suggested by Feldstein to take the 1972 legislation into account provides weak evidence in support of the proposition that social security reduces private saving if the Feldstein algorithm is used, but none if the Leimer-Lesnoy algorithm is used.
Finally, the evidence based on alternative perceptions (whether in conjunction with the Feldstein algorithm or the Leimer-Lesnoy algorithm) does not support the hypothesis that social security reduces private saving. This highlights a major issue in the debate. Feldstein contends that his revised perception describes individ- uals’ expectations of future benefits better than any of the alternative perceptions that have been suggested. In fact, no one knows how individuals form their expecta- tions of future benefits, and therefore a range of alternative perceptions must be explored.
Influence of Legislation
The most important issue is whether and how both active and retired workers change their expectations of future benefits in response to legislated changes in the benefit formula. As discussed earlier, historically the benefit-income ratio has varied as a result of changes in the social security law and changes in economic factors between legislation. How do workers-both active and retired-react to these changes?
Feldstein’s view is that before 1972 workers ignored the year-to-year variation in the benefit ratio. They anticipated that the benefit formula would be amended with sufficient regularity to maintain a constant ratio of benefits to income. Beginning in 1972, however, workers perceived a major change in the benefit pro- visions and immediately adjusted their expectations upward by 20 percent.
The authors reiterate their view that no one knows whether or how individuals form their expectations of future benefits. Indeed, surveys show that individuals do not have precise expectations about the size of future benefits. It is plausible, however, that individuals are aware of legislated benefit increases and recognize that, before the automatic adjustments in the benefit formula, benefits decreased relative to income in the absence of legislation. Since no one knows how individ- uals form their expectations, a number of alternative perceptions must be considered. Although it is un- realistic to assume that any one of these perceptions captures the diversity of ways in which individuals form their expectations, the conclusions reached in the authors’ research are not sensitive to the particular perceptions considered.
All of the alternative perceptions considered by the authors assume that individuals reacted no differently
to the 1972 amendments than to other legislated changes. A number of earlier amendments were at least as important as the 1972 amendments. The 1939 amend- ments totally revised the 1935 benefit formula. Instead of basing benefits on lifetime earnings, benefits were based on average earnings with a lifetime increment based on years of covered earnings. The 1950 legislation dropped the lifetime increment; modification of the benefit formula increased the benefit-income ratio by 30 percent, compared with the average during 1940-49. The 1954 amendments increased the benefit-income ratio by an additional 20 percent, compared with the 1950-53 average. Following the 1958 amendments, the benefit-income ratio rose an additional 5 percent. Despite legislated benefit increases in 1965 and 1967, the benefit-income ratio fell by about 15 percent during the period 1959-69. The combined effect of the 1969 and 1971 amendments was to increase the benefit-income ratio by about 15 percent, compared with 1969. The effect of the 1972 legislation was to increase the benefit- income ratio by an additional 15 percent. And, begin- ning in 1975, postretirement benefits were indexed to changes in the price level.
The estimated coefficient of social security wealth de- pends on which major legislation is incorporated in the construction of the social security wealth variable. Assume, for example, that in addition to the 1972 legis- lation, both the 1939 and 1950 legislation are incorpo- rated by constructing a social security wealth variable with constant ratios for four (instead of two) periods- 1937-39, 1940-49, 1950-71, and 1972-76. If this revised variable is used to estimate the consumer expenditure function for 1930-76, the estimated coefficient of social security wealth is 0.005 with a standard error of 0.008. The probability of obtaining a coefficient this large by chance is more than 50 in 100. For 1947-76, the esti- mated coefficient is -0.012 with a standard error of 0.012. The probability of obtaining a coefficient this large by chance is about 30 in 100. Neither coefficient is -statistically significant. Thus, if the revised Feldstein variable is revised further to incorporate the 1939 and 1950 amendments, the evidence supports neither the proposition that social security reduces saving nor the proposition that it increases saving.
Further, Feldstein is incorrect in stating that the 1972 legislation was ignored in the authors’ research. It is true that the constant ratio perception (also referred to as the original Feldstein perception) does not reflect the 1972 amendments. This perception was considered, however, both because it was necessary to adopt Feld- stein’s original perceptions in replicating his 1974 and 1978 studies and because the constant ratio perception was considered to be of conceptual interest.t5
I5 Feldstein, in 1974 and again in 1978 and 1979, used the constant ratio perception. The revised perception was developed after the com- puter programming error was brought to Feldstein’s attention (Aren- son, 1980).
Social Security Bulletin, January 1985/Vol. 48, No. 1 27

All the alternative perceptions used in the authors’ research, however, reflect the 1972 legislated increase. Indeed, it should be clear from the earlier discussion that the authors’ research was motivated by skepticism that the constant ratio perception was consistent with the historic variation in the benefit-income ratio asso- ciated with changes in the social security law and declines in the benefit-income ratio between legislation. It was important to test alternative assumptions about how individuals’ perceptions were affected by such changes. This approach differs from Feldstein’s in that these alternative perceptions also reflect all other legis- lated changes in the benefit formula.
Summarizing Time-Series Evidence
The time-series evidence may be summarized as fol- lows: the positive and significant estimate of the revised social security wealth coefficient obtained by Feldstein does somewhat increase the uncertainty about the effect of social security wealth. Certainly it is possible that he is right and that social security has depressed private saving. But, in addition to variants of Feldstein’s re- vised variable, the authors have estimated the coeffi- cient of gross and net social security wealth over two periods-a longer period including both prewar and postwar years, and a shorter period limited to the postwar period-using social security wealth variables based on 10 reasonable perceptions in the context of two alternative sets of assumptions for constructing social security wealth. Some coefficients were positive (implying a reduction in saving) but insignificant; some were negative (implying an increase in saving) and insig- nificant; a few were negative and significant but im- plausibly large. The weight of the time-series evidence does not provide statistical support for the proposition that social security has reduced personal saving in the United States.
Other Evidence
Feldstein contends that analyses of other types of data-cross-country and household-support his con- clusion. These other studies are considered briefly be- low.
International studies in conflict. A number of studies have used samples consisting of observations of sav- ing/income ratios for industrialized countries. Two studies by Feldstein (1977, 1980a) conclude that social security reduces saving. A study by Barro and MacDon- ald (1979) concludes that the estimated effect differs de- pending on how the equation is specified. Kopits and Gotur (1980) conclude that saving is positively related to social security retirement programs but negatively re- lated to other social security programs. Koskela and Viren (1983) find that the social security variables used
in their study have no effect on household saving. Modigliani and Sterling (1983) find it difficult to obtain a reliable estimate of the effect of social security on sav- ing. Clearly no consensus emerges based on this evi- dence concerning the effect of social security on private saving.
Mixed conclusions of household surveys. The other major body of evidence consists of studies using surveys of individual households. Again, the evidence is quite mixed. Feldstein (1983), Feldstein and Pellechio (1979), and Diamond and Hausman (1984) conclude that the evidence supports the hypothesis that social security wealth substitutes for accumulation of private assets. Friedman (1982), Kotlikoff (1979), and Kurz (1981) conclude that the evidence does not support the hypo- thesis that social security wealth substitutes for private wealth accumulation. Blinder, Gordon, and Wise (1983) find that although their model suggests some displace- ment of private savings by social security, the estimated effect is too imprecise and too unstable to draw any con- clusions. These divergent results simply compound the uncertainty surrounding the effect of social security on private saving.
Conclusion At first glance, the argument that social security re-
duces private saving appears quite plausible. But as one delves into the complexity of the saving process-the effect of induced earlier retirement, other motives for saving such as emergencies and bequests, shortsighted planning, demonstration effects, and voluntary trans- fers between generations-it becomes equally plausible that social security may have little or no effect on pri- vate saving, and indeed it may even increase saving.
The authors’ assessment is that if all available empir- ical evidence-time-series, international comparisons, and household surveys-is considered the evidence is in- conclusive. If only time-series data are considered, the evidence fails to support the hypothesis that social secu- rity has reduced saving. Again, it is important to inter- pret these results carefully. These results do not prove that social security has had no effect on private saving. They do show, however, that the time-series data pro- vide little support for the claim that social security has significantly depressed private saving in the United States.
References Aaron, Henry J. (1982), Economic Effects of Social Se-
curity, Washington, D.C.: The Brookings Institu- tion, 1982.
Arenson, Karen W. (1980), “Martin Feldstein’s Com- puter Error,” The New York Times, Sunday, Octo- ber 5, 1980.
Social Security Bulletin, January 1985/Vol. 48, No. 1

Barro, Robert (1974), “Are Government Bonds Net Wealth?” Journal of Political Economy, Novem- ber/December 1974, pages 1095-l 117.
__ (1978), The Impact of Social Security on Private Saving, Washington, D.C.: American Enterprise In- stitute, 1978.
- and Glenn M. MacDonald (1979), “Social Security and Consumer Spending in an International Cross Section,” Journal of Public Economics, June 1979, pages 275-289.
Blinder, Alan S., Roger Gordon, and Donald E. Wise (1983), “Social Security, Bequests, and the Life Cycle Theory of Saving: Cross-sectional Tests,” in The De- terminants of National Saving and Wealth, F. Modig- liani and R. E. Hemming, editors, St. Martin’s Press, 1983, pages 89-122.
Cagan, Phillip (1965), The Effect of Pension Plans on Aggregate Saving, New York: National Bureau of Economic Research, 1965.
Danziger, Sheldon, Robert Haveman, and Robert Plot- nick (1981), “How Income Transfers Affect Work, Savings, and the Income Distribution: A Critical Re- view,” Journal of Economic Literature, September 1981, pages 975-1028.
Darby, Michael R. (1979), The Effects of Social Secur- ity on Income and the Capital Stock, Washington, D.C.: American Enterprise Institute, 1979.
Diamond, Peter A. and Jerry A. Hausman (1984), “Individual Retirement and Savings Behavior,” Journal of Public Economics, February-March, 1984, pages 81-l 14.
Esposito, Louis (1978), “Effect of Social Security on Saving: Review of Studies Using U.S. Time-Series Data,” Social Security Bulletin, May 1974, pages 9-17.
Feldstein, Martin S. (1974), “Social Security, Induced Retirement, and Aggregate Capital Accumulation,” Journal of Political Economy, September/October, 1974, pages 905-926.
- (1977), “Social Security and Private Saving: Inter- national Evidknce in an Extended Life-Cycle Model,” in The Economics of Public Services, M. S. Feldstein and R. Inman, editors, Macmillan Publishing Com- pany, Inc., 1977.
- U97Q “Reply,” in R. J. Barro, The Impact of Social Security on Private Savings, Washington, D.C.: American Enterprise Institute, 1978, pages 37-47.
- (1979), in “Social Security and Private Saving: Another Look,” comments by R. J. Barro, M. R. Darby, M. S. Feldstein, and A. H. Munnell, Social Security Bulletin, May 1979, pages 36-39.
- (1980a), “International Differences in Social Se- curity and Savings,” Journal of Public Economics, October 1980, pages 225-244.
~. (1980b), Social Security, Induced Retirement and
Aggregate Capital Accumulation: A Correction and Updating (Working Paper No. 579), New York: National Bureau of Economic Research, October 1980.
- (19W, “Social Security and Private Saving: Reply,” Journal of Political Economy, June 1982, pages 630-642.
- (1983), “Social Security Benefits and the Accumu- lation of Preretirement Wealth,” in The Determi- nants of National Saving and Wealth, F. Modigliani and R. E. Hemming, editors, St. Martin’s Press, 1983, pages 3-23.
- and Anthony Pellechio (1979), “Social Security and Household Wealth Accumulation: New Micro- economic Evidence,” Review of Economics and Sta- tistics, August 1979, pages 361-368.
Friedman, Joseph (1982), Asset Accumulation and De- pletion Among the Elderly, paper prepared for pre- sentation at The Brookings Institution Conference on Retirement and Aging, October 21-22, 1982.
Katona, George (1965), Private Pensions and Individual Saving, Survey Research Center, Institute for Social Research, University of Michigan, 1965.
Kopits, George and Padma Gotur (1980), “The Influ- ence of Social Security on Household Saving: A Cross-Country Investigation,” International Mone- tary Fund Staff Papers, March 1980, pages 161-190.
Koskela, Erkki and Matti Viren (1983), “Social Security and Household Saving in an International Cross Section,” American Economic Review, March 1983, pages 212-217.
Kotlikoff, Lawrence J. (1979), “Testing the Theory of Social Security and Life Cycle Accumulation,” American Economic Review, June 1979, pages 396-410.
Kurz, Mordecai (198 l), “The Life-Cycle Hypothesis and the Effects of Social Security and Private Pen- sions on Family Saving (Technical Paper No. 335), Institute for Mathematical Studies in the Social Sciences, Stanford University, 1981.
Leimer, Dean R. and Selig D. Lesnoy (1980), Social Se- curity and Private Saving: A Reexamination of the Time-Series Evidence Using Alternative Social Security Wealth Variables (Working Paper No. 19), Office of Research and Statistics, Office of Policy, Social Security Administration, 1980.
- and - (1982), “Social Security and Private Saving: New Time-Series Evidence,” Journal of Political Economy, June 1982, pages 606-629.
- and - (1983), Social Security and Private Saving: An Examination of Feldstein’s New Evidence (Working Paper No. 31), Office of Research, Statis- tics, and International Policy, Office of Policy, Social Security Administration, 1983.
Lesnoy, Selig D. and John C. Hambor (1975), “Social Security, Saving, and Capital Formation,” Social Se-
Social Security Bulletin, January 1985/Vol. 48, No. 1 29
curity Bulletin, July 1975, pages 3 - 15. __ and Dean R. Leimer (1981), Social Security and
Private Saving: New Time-Series Evidence with Al- ternative Specifications (Working Paper No. 22), Of- fice of Research and Statistics, Office of Policy, Social Security Administration, 1981.
Modigliani, Franc0 and Arlie Sterling (1983), “Determinants of Private Saving with Special Refer- ence to the Role of Social Security-Cross-country
Tests,” in The Determinants of National Saving and Wealth, F. Modigliani and R. Hemming, editors, St. Martin’s Press, 1983, pages 24-55.
Munnell, Alicia H. (1974a), The Effect of Social Security on Personal Savings, Ballinger Publishing co., 1974.
- (1974b), “The Impact of Social Security on Per- sonal Saving,” .National Tax Journal, April 1974, pages 553-568.
30 Social Security Bulletin, January 1985/Vol. 48, No. 1