Embed Size (px)
Citation preview
Social and Gender Equity Gauge
Assessing gender equity in the water sector in South Asia
Background
• So far scattered references, impressions and a few studies indicating gender inequities which have not created an impact on policy or intervention
Objectives
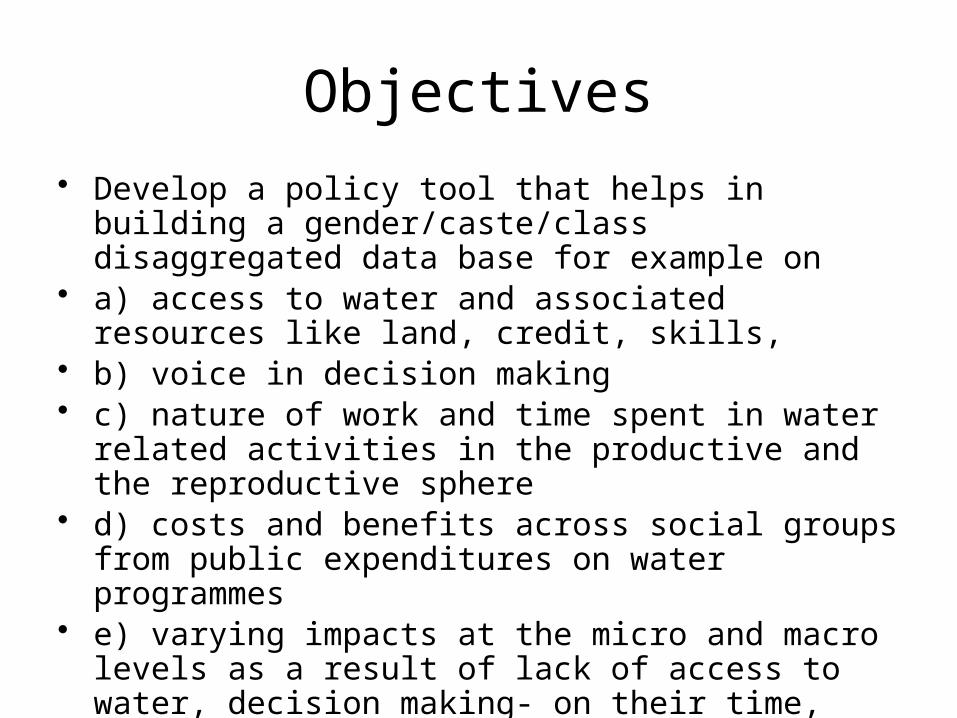
• Develop a policy tool that helps in building a gender/caste/class disaggregated data base for example on
• a) access to water and associated resources like land, credit, skills,
• b) voice in decision making • c) nature of work and time spent in water related
activities in the productive and the reproductive sphere • d) costs and benefits across social groups from public
expenditures on water programmes• e) varying impacts at the micro and macro levels as a
result of lack of access to water, decision making- on their time, health, self esteem etc.
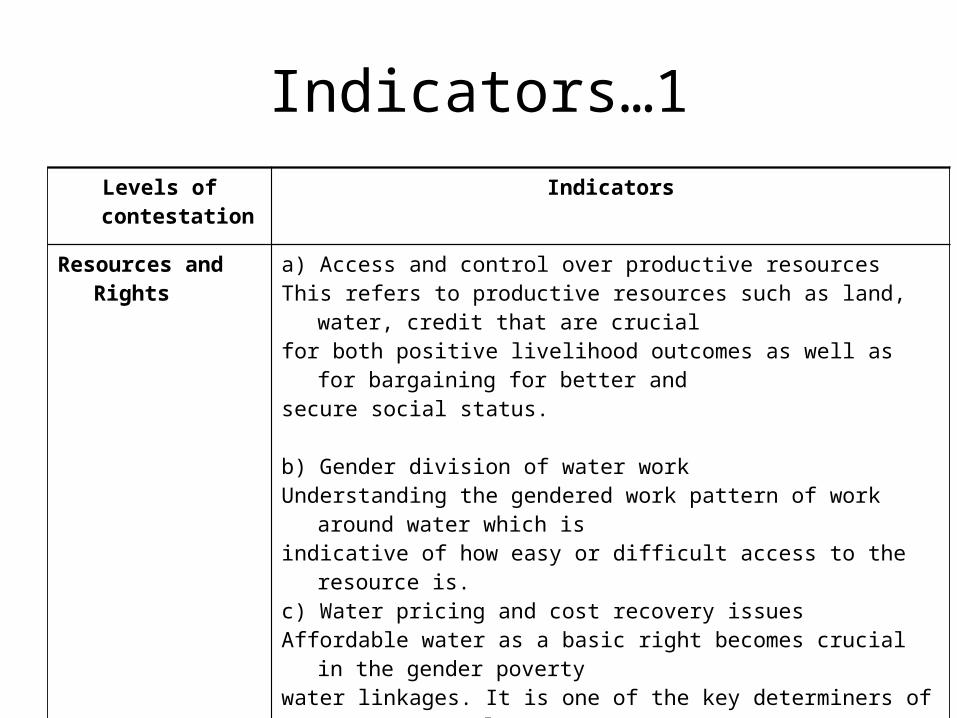
Indicators…1Levels of contestation Indicators
Resources and Rights a) Access and control over productive resourcesThis refers to productive resources such as land, water, credit that are crucialfor both positive livelihood outcomes as well as for bargaining for better andsecure social status.
b) Gender division of water workUnderstanding the gendered work pattern of work around water which isindicative of how easy or difficult access to the resource is.c) Water pricing and cost recovery issuesAffordable water as a basic right becomes crucial in the gender povertywater linkages. It is one of the key determiners of access/control over water
Rules, norms and laws Understanding the water policy contexts, the laws and the informal rules andnorms that govern access to water
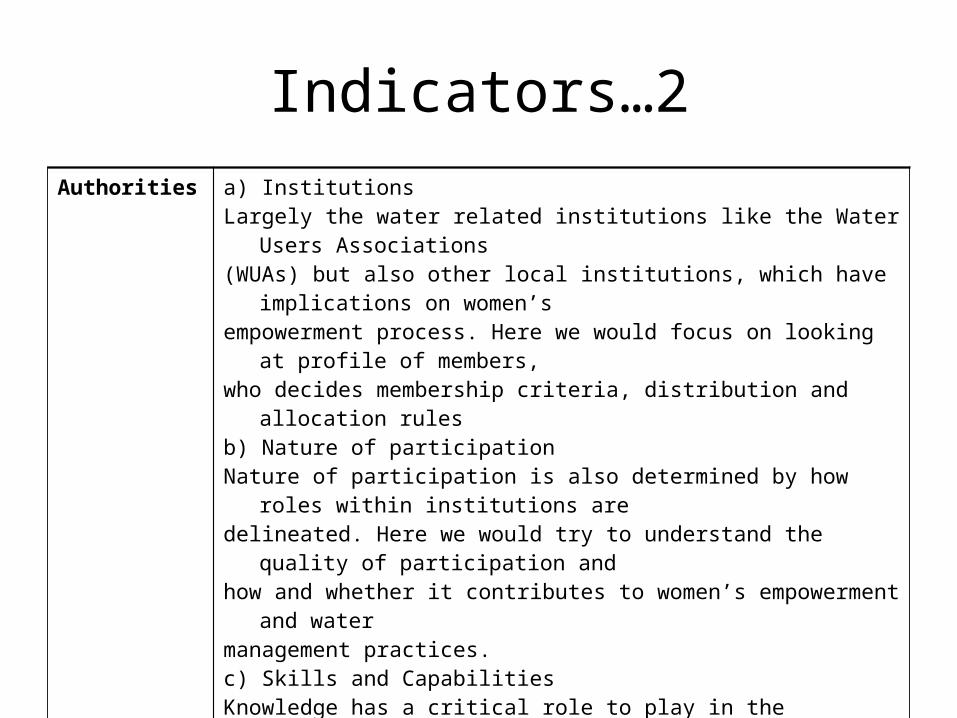
Indicators…2Authorities a) Institutions
Largely the water related institutions like the Water Users Associations(WUAs) but also other local institutions, which have implications on women’sempowerment process. Here we would focus on looking at profile of members,who decides membership criteria, distribution and allocation rulesb) Nature of participationNature of participation is also determined by how roles within institutions aredelineated. Here we would try to understand the quality of participation andhow and whether it contributes to women’s empowerment and watermanagement practices.c) Skills and CapabilitiesKnowledge has a critical role to play in the meaningful use of resources andstrengthening the resource rights. It creates an ability to influence opinionregarding both access as well as decision making around rules and regulations
Knowledge discourses
What shapes the understanding around water? How are policy makersinformed? What governs whether water should be seen as an economic good, ahuman right etc become concerns of ideology

Tools/methods
• Household questionnaire • Focus group discussions• Spatial mapping • Collection of secondary data• Field observations
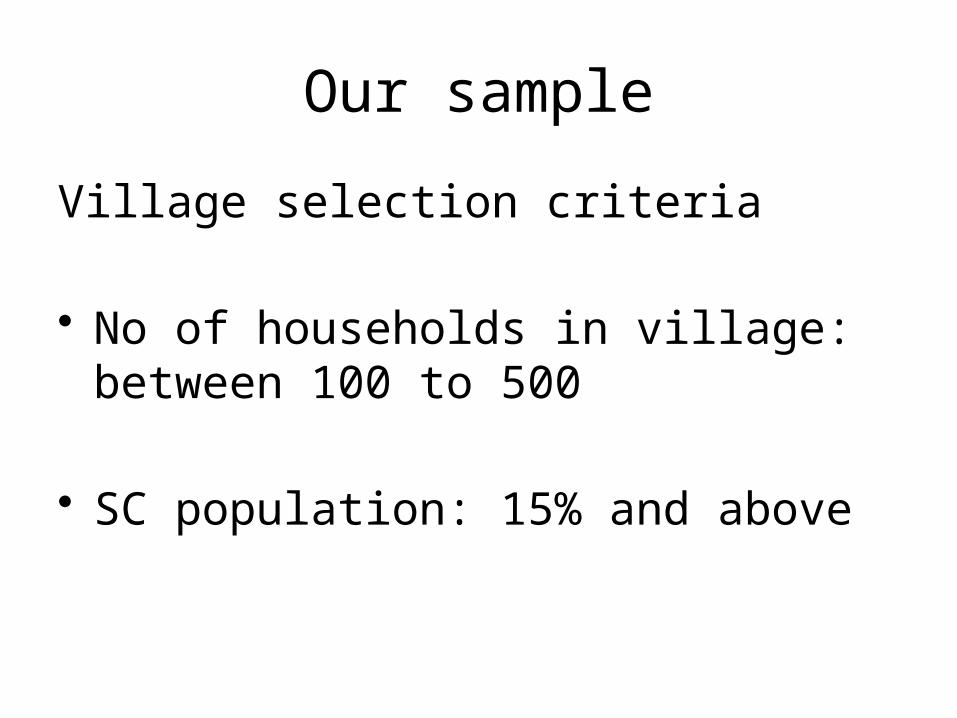
Our sample
Village selection criteria
• No of households in village: between 100 to 500
• SC population: 15% and above
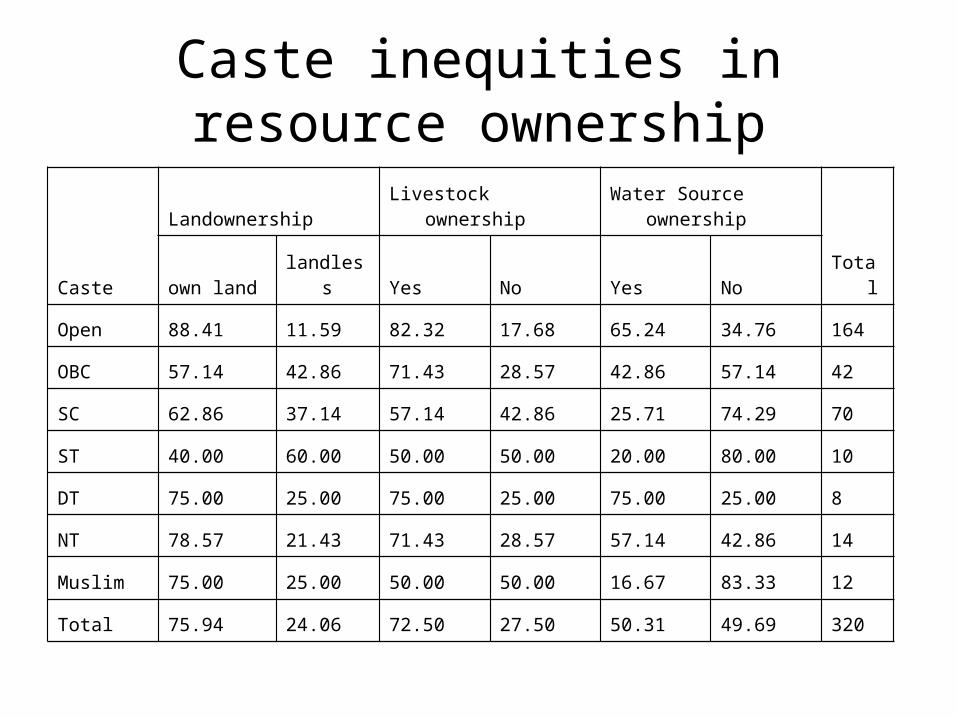
Caste inequities in resource ownership
Caste
Landownership Livestock ownership Water Source ownership
Totalown land landless Yes No Yes No
Open 88.41 11.59 82.32 17.68 65.24 34.76 164
OBC 57.14 42.86 71.43 28.57 42.86 57.14 42
SC 62.86 37.14 57.14 42.86 25.71 74.29 70
ST 40.00 60.00 50.00 50.00 20.00 80.00 10
DT 75.00 25.00 75.00 25.00 75.00 25.00 8
NT 78.57 21.43 71.43 28.57 57.14 42.86 14
Muslim 75.00 25.00 50.00 50.00 16.67 83.33 12
Total 75.94 24.06 72.50 27.50 50.31 49.69 320
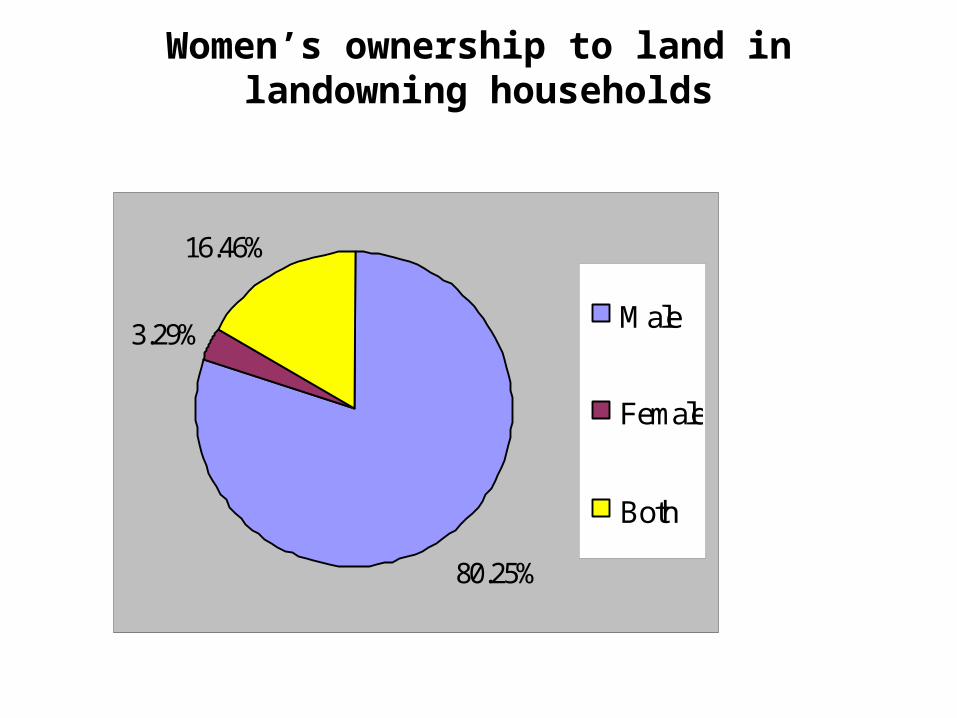
Women’s ownership to land in landowning households
80.25%
3.29%
16.46%
Male
Female
Both
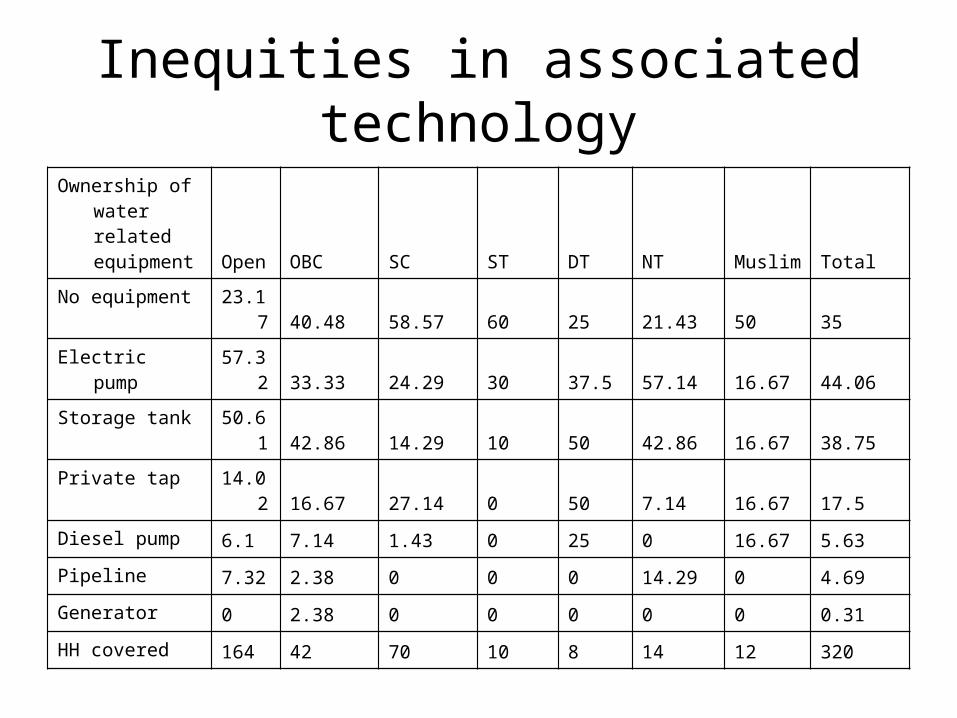
Inequities in associated technology
Ownership of water related equipment
Open OBC SC ST DT NT Muslim Total
No equipment
23.17 40.48 58.57 60 25 21.43 50 35
Electric pump
57.32 33.33 24.29 30 37.5 57.14 16.67 44.06
Storage tank
50.61 42.86 14.29 10 50 42.86 16.67 38.75
Private tap
14.02 16.67 27.14 0 50 7.14 16.67 17.5
Diesel pump 6.1 7.14 1.43 0 25 0 16.67 5.63
Pipeline 7.32 2.38 0 0 0 14.29 0 4.69
Generator 0 2.38 0 0 0 0 0 0.31
HH covered 164 42 70 10 8 14 12 320
Domestic water and sanitation
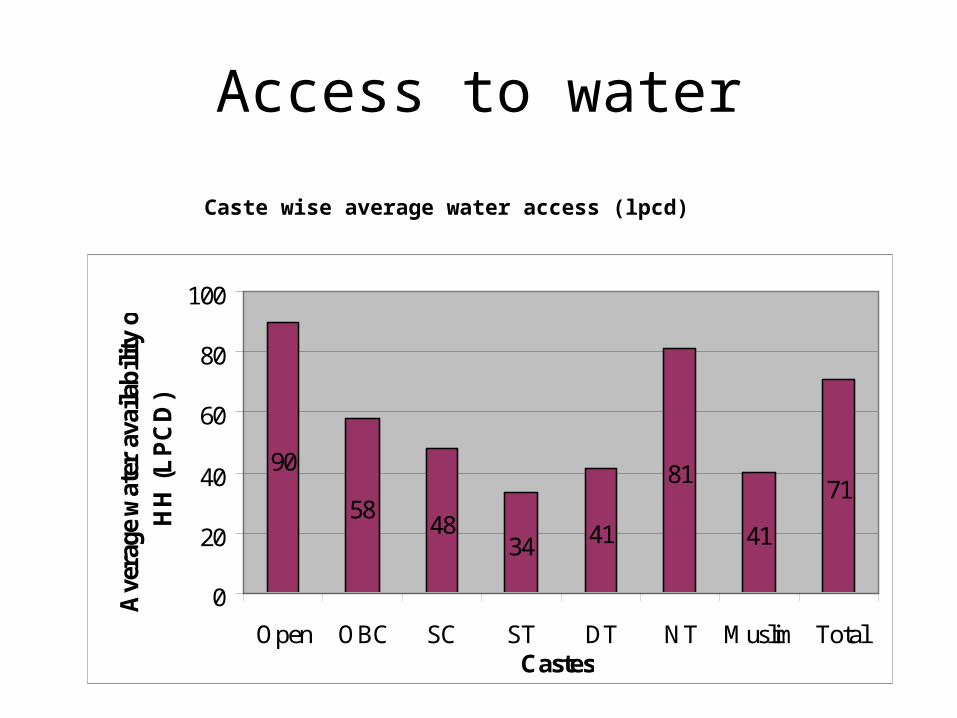
Access to water
Caste wise average water access (lpcd)
90
5848
34 41
81
41
71
0
20
40
60
80
100
Open OBC SC ST DT NT Muslim TotalCastes
Ave
rage
wat
er a
vaila
bili
ty o
f H
H (
LP
CD
)
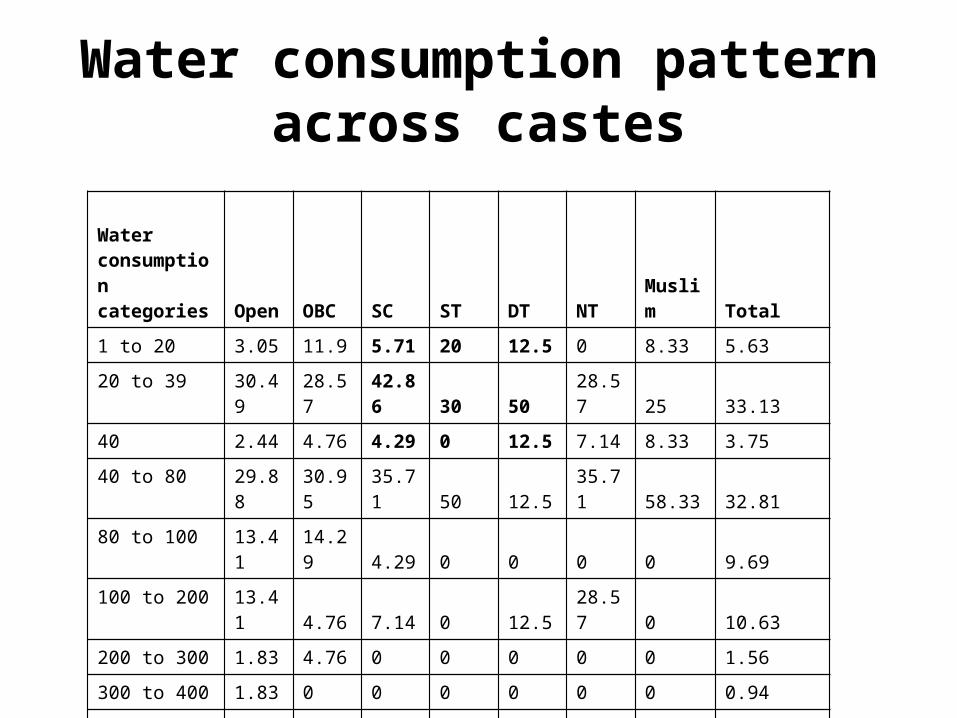
Water consumption pattern across castes
Water consumption categories Open OBC SC ST DT NT
Muslim Total
1 to 20 3.05 11.9 5.71 20 12.5 0 8.33 5.63
20 to 39 30.49 28.57 42.86 30 50 28.57 25 33.13
40 2.44 4.76 4.29 0 12.5 7.14 8.33 3.75
40 to 80 29.88 30.95 35.71 50 12.5 35.71 58.33 32.81
80 to 100 13.41 14.29 4.29 0 0 0 0 9.69
100 to 200 13.41 4.76 7.14 0 12.5 28.57 0 10.63
200 to 300 1.83 4.76 0 0 0 0 0 1.56
300 to 400 1.83 0 0 0 0 0 0 0.94
400 to 500 1.83 0 0 0 0 0 0 0.94
More than 500 1.83 0 0 0 0 0 0 0.94
No of HH covered 164 42 70 10 8 14 12 320
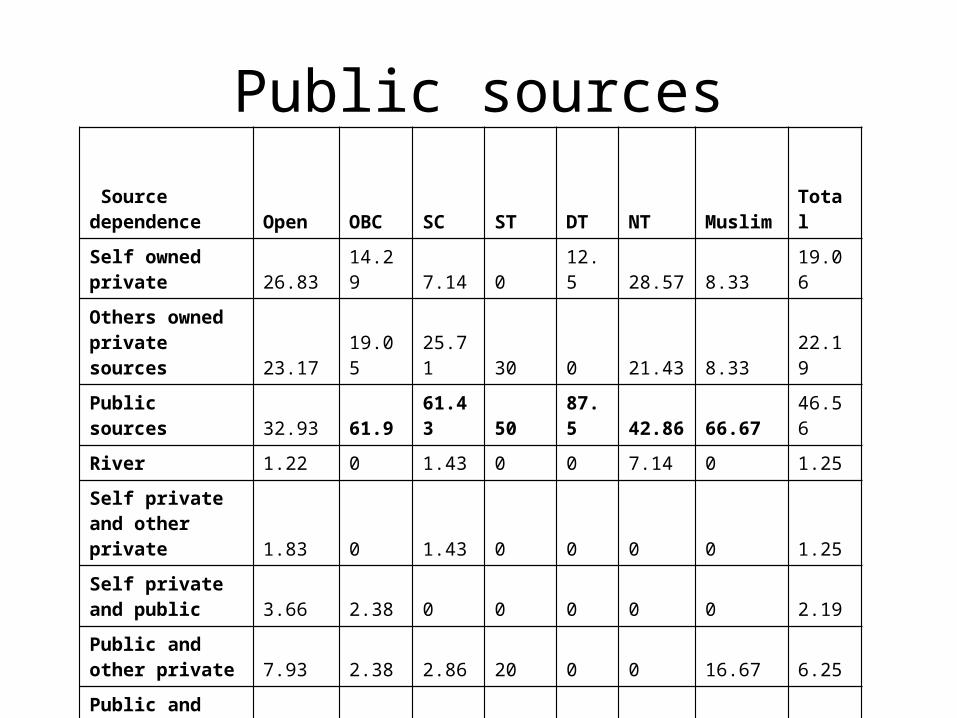
Public sources Source dependence Open OBC SC ST DT NT Muslim Total
Self owned private 26.83 14.29 7.14 0 12.5 28.57 8.33 19.06
Others owned private sources 23.17 19.05 25.71 30 0 21.43 8.33 22.19
Public sources 32.93 61.9 61.43 50 87.5 42.86 66.67 46.56
River 1.22 0 1.43 0 0 7.14 0 1.25
Self private and other private 1.83 0 1.43 0 0 0 0 1.25
Self private and public 3.66 2.38 0 0 0 0 0 2.19
Public and other private 7.93 2.38 2.86 20 0 0 16.67 6.25
Public and river 2.44 0 0 0 0 0 0 1.25
No of HH covered 164 42 70 10 8 14 12 320
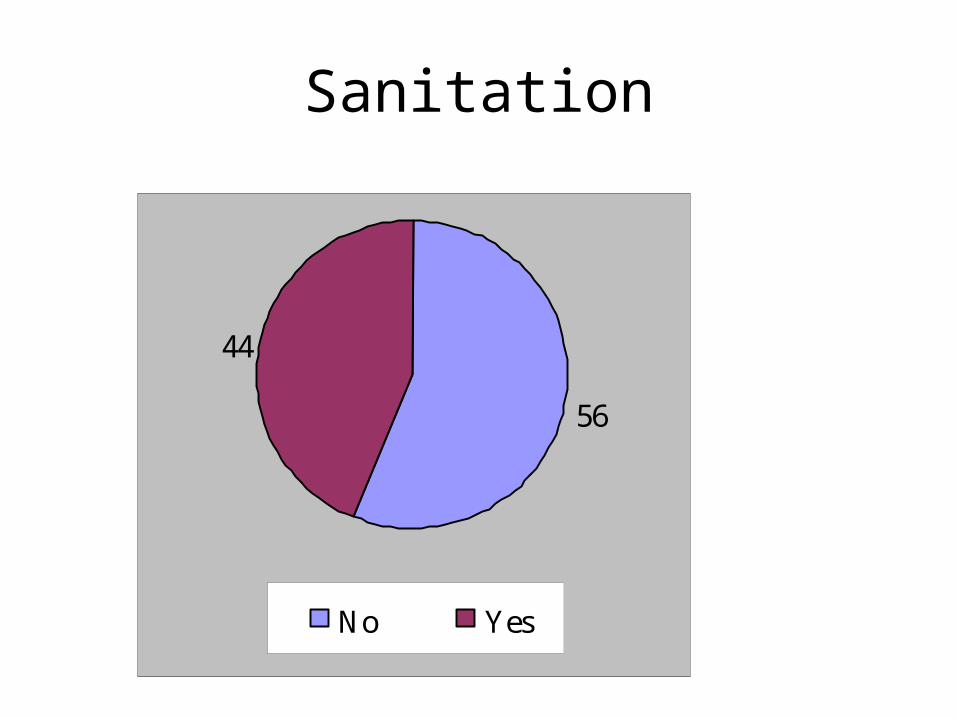
Sanitation
56
44
No Yes
Irrigation
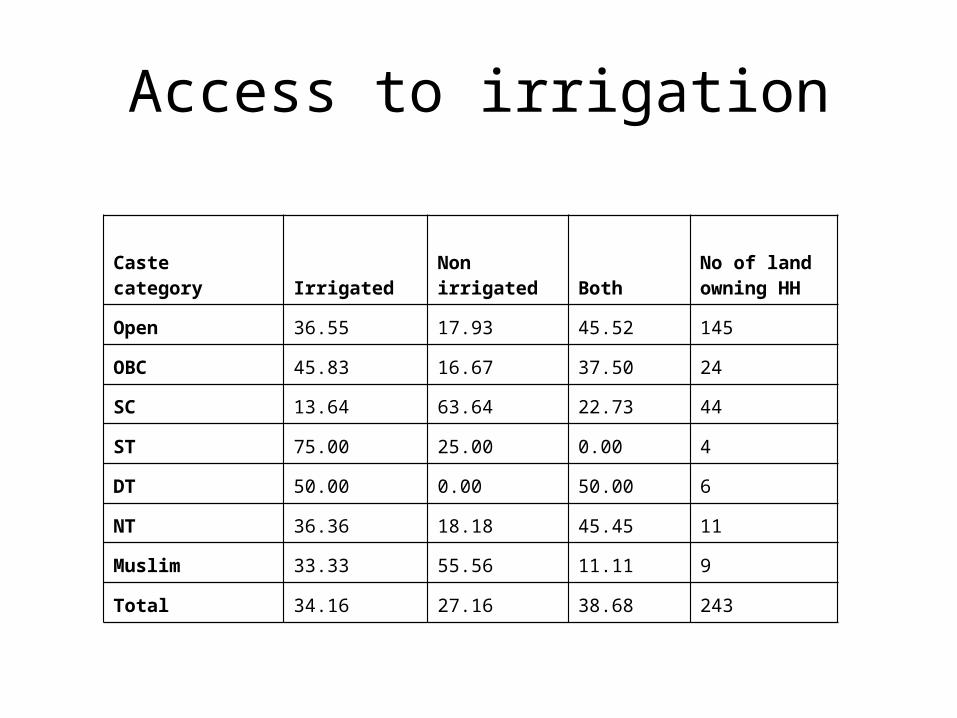
Access to irrigation
Castecategory Irrigated Non irrigated Both
No of land owning HH
Open 36.55 17.93 45.52 145
OBC 45.83 16.67 37.50 24
SC 13.64 63.64 22.73 44
ST 75.00 25.00 0.00 4
DT 50.00 0.00 50.00 6
NT 36.36 18.18 45.45 11
Muslim 33.33 55.56 11.11 9
Total 34.16 27.16 38.68 243


Water related work
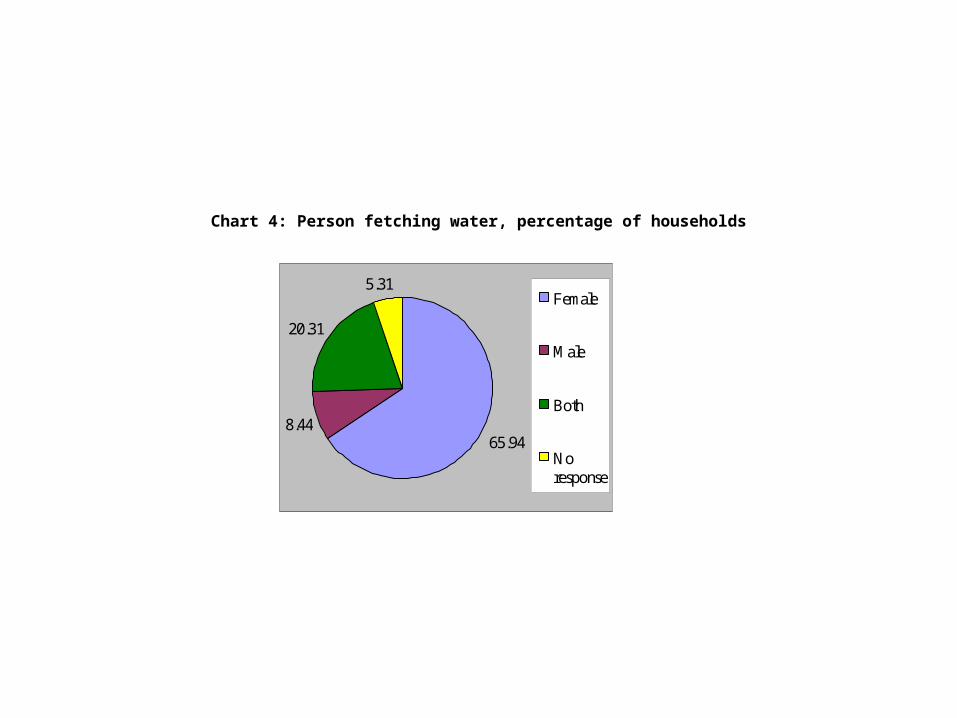
Chart 4: Person fetching water, percentage of households
65.948.44
20.31
5.31Female
Male
Both
Noresponse
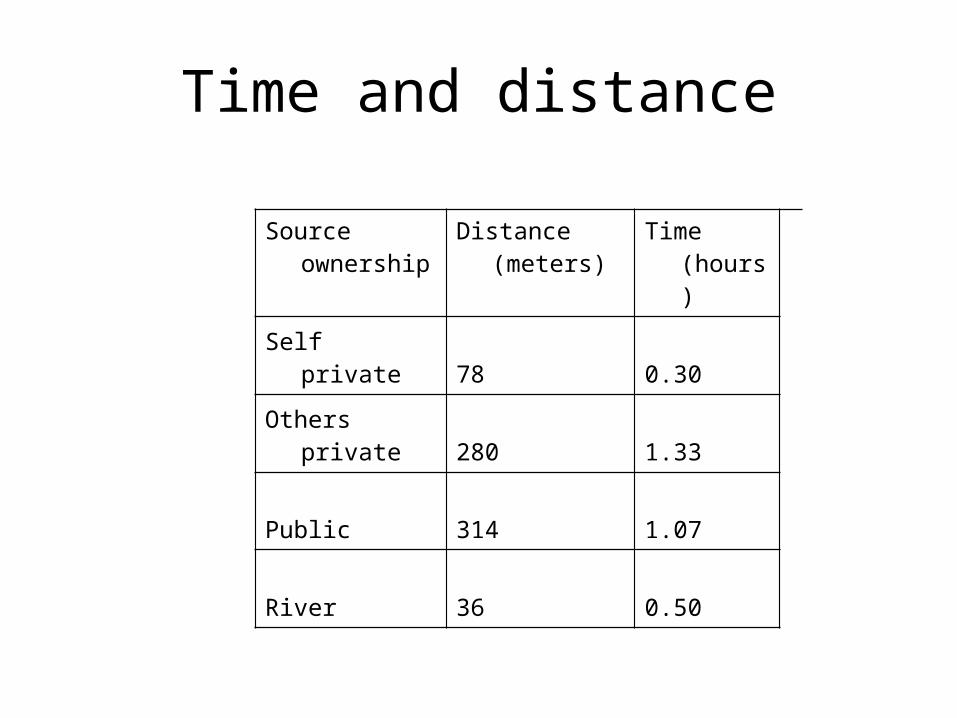
Time and distance
Source ownership Distance (meters)
Time (hours)
Self private 78 0.30
Others private 280 1.33
Public 314 1.07
River 36 0.50
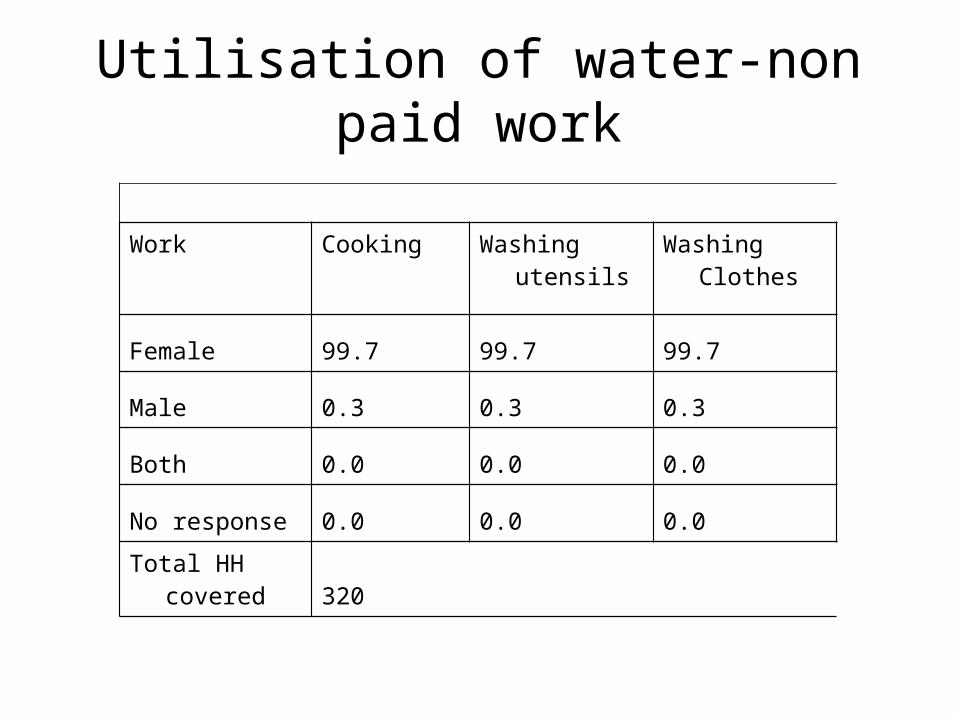
Utilisation of water-non paid work
Work Cooking Washing utensils Washing Clothes
Female 99.7 99.7 99.7
Male 0.3 0.3 0.3
Both 0.0 0.0 0.0
No response 0.0 0.0 0.0
Total HH covered 320

Non paid work: Water for production
Who does the work
Ploughing
Sowing Weeding Harvesting Selling farm products
Supervision of labour
Male 44.03 58.85 1.23 2.88 74.49 29.63
Female 0.00 0.82 69.96 35.80 2.47 27.98
Both 0.41 4.53 20.99 51.85 2.47 11.11
Rent 51.44 31.69 2.88 4.12 0.00 0.00
Not Applicable 4.12 4.12 4.94 5.35 20.58 31.28
Total 100.00 100.00 100.00 100.00 100.00 100.00
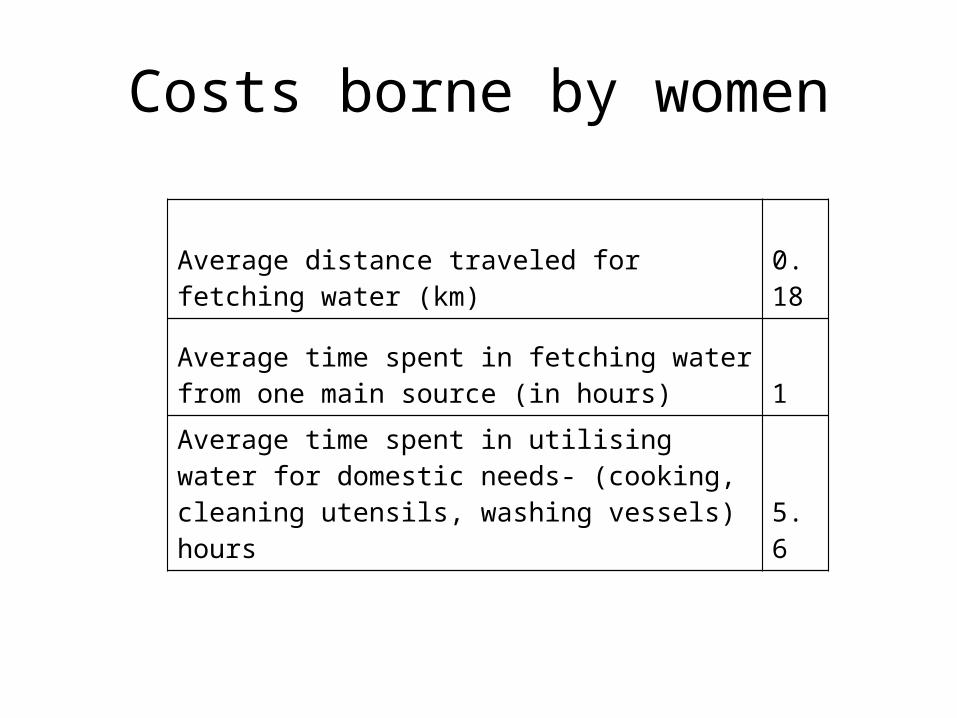
Costs borne by women
Average distance traveled for fetching water (km)0.18
Average time spent in fetching water from one main source (in hours) 1
Average time spent in utilising water for domestic needs- (cooking, cleaning utensils, washing vessels) hours 5.6
Participation in water institutions
• Participation: important as indicator from point of view of access
• In our villages lack of participation among women as well as men
• In all domestic water, irrigation and watershed related institutions
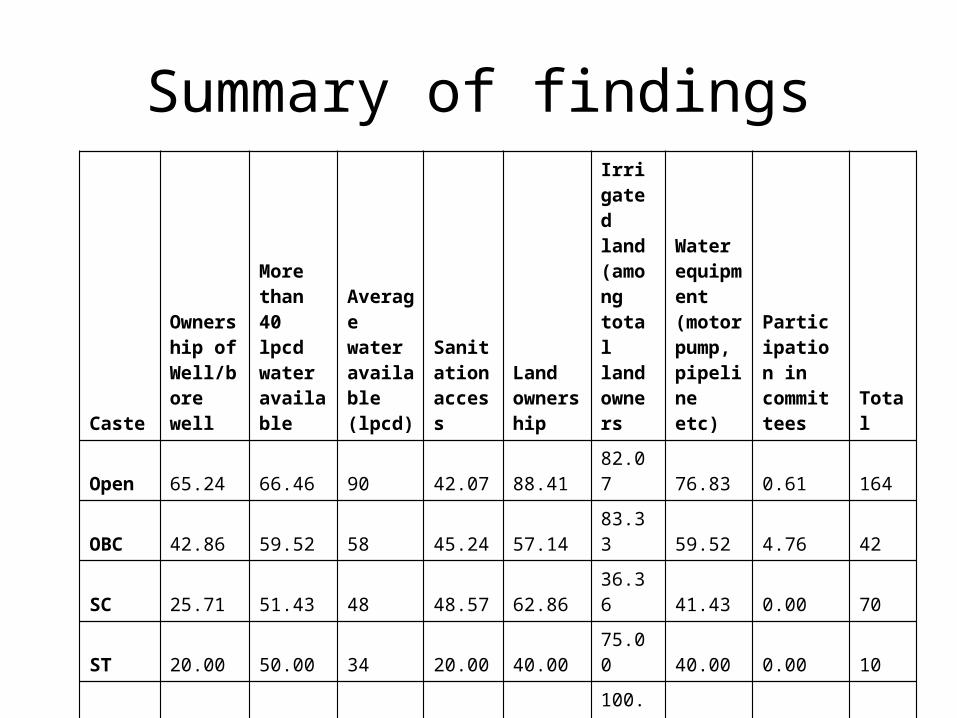
Summary of findings
Caste
Ownership of Well/bore well
More than 40 lpcd water available
Average water available (lpcd)
Sanitation access
Land ownership
Irrigated land (among total landowners
Water equipment (motor pump, pipeline etc)
Participation in committees Total
Open 65.24 66.46 90 42.07 88.41 82.07 76.83 0.61 164
OBC 42.86 59.52 58 45.24 57.14 83.33 59.52 4.76 42
SC 25.71 51.43 48 48.57 62.86 36.36 41.43 0.00 70
ST 20.00 50.00 34 20.00 40.00 75.00 40.00 0.00 10
DT 75.00 37.50 41 62.50 75.00 100.00 75.00 0.00 8
NT 57.14 71.43 81 28.57 78.57 81.82 78.57 0.00 14
Muslim 16.67 66.67 41 58.33 75.00 44.44 50.00 8.33 12
Total 50.31 61.25 71 43.75 75.94 72.84 64.69 1.25 320