Embed Size (px)
Citation preview

Efficiency through technology and collaboration
Smarter Work Zones
Webinar SeriesWebinar #1: Overview of the Smarter Work Zones
Initiative
Jawad Paracha, Martha Kapitanov, Todd Peterson,
W.D. Baldwin, and Neil Boudreau
September 9, 2015
1:00-2:30pm EDT

2
Smarter Work ZonesINTRODUCTION AND TODAY’S SPEAKERS
2

Today’s Speakers
3
Todd Peterson, P.E., PTOETransportation Specialist
FHWA Office of Operations
Martha C. KapitanovTransportation Specialist
FHWA Office of Operations
Neil BoudreauDirector of Traffic and Safety
Massachusetts DOT
W.D. Baldwin, P.E.Northwest Region Traffic Leader
HDR
Jawad ParachaWork Zone Program Manager
FHWA Office of Operations

Smarter Work Zones Webinar Series
• This is the first in a series of Smarter Work
Zones webinars
• Topics based on what matters most to you!
• Upcoming webinars will be announced soon!
– Information will be available on the Work Zone
Safety Clearinghouse website,
https://www.workzonesafety.org/SWZ
4

Purpose of Today’s Webinar
Provide a comprehensive overview of the Smarter Work
Zones (SWZ) initiative to enable a common understanding
of the program, its goals, and implementation
Topics include:
• SWZ initiative and its two strategies
• SWZ implementation plans & funding opportunities
• SWZ resources and technical assistance opportunities
5

6
Smarter Work ZonesOVERVIEW
6

What are Smarter Work Zones (SWZ)?
Innovative strategies designed to optimize work zone safety
and mobility
• Policies and practices used to incrementally and
continuously improve WZ operations
• Tools to reduce WZ crashes and delays
• Tools to enhance WZ management strategies
7

Two Identified SWZ Initiatives:
Deployment of Intelligent Transportation Systems (ITS)
for dynamic management of work zone traffic impacts,
such as queue and speed management
8
Project Coordination
Technology Application
Coordination within a single project and/or among
multiple projects within a corridor, network, or region, and
possibly across agency jurisdictions

SWZ Initiative Goals
• Project Coordination Goal #1– By December 2016, 25 State DOTs have incorporated work zone
project coordination strategies into agency documentation and business processes
– What does this mean? • Review of existing agency project coordination (PC) related
policies and practices to identify strengths and weaknesses
• Review of best practices of other agencies
• Identification of strategies such as
- software-based systems to coordinate right of way construction activities and minimize traffic impacts
- Use of corridor-level transportation management plans (TMPs) to minimize traffic impacts
• Implement PC strategy
• Develop agency documentation and business processes
9

SWZ Initiative Goals
• Project Coordination Goal #2
- By December 2016, 5 State DOTs have volunteered to pilot the
Work Zone Implementation Strategies Estimator (WISE) software
- What does this mean?
• Use WISE tool to optimize project schedules and analyze
mitigation strategies to minimize work zone traffic impacts
• Pilot, evaluate, suggest enhancements, and demonstrate its
value for work zone management
10
Source: TRB
SWZ Initiative Goals
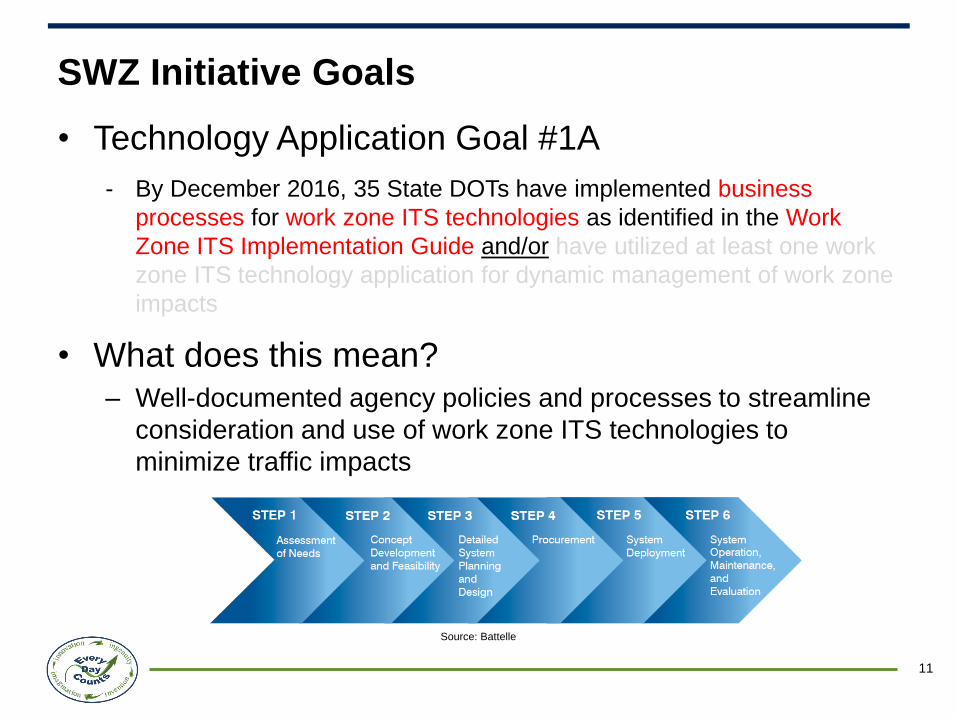
• Technology Application Goal #1A
- By December 2016, 35 State DOTs have implemented business
processes for work zone ITS technologies as identified in the Work
Zone ITS Implementation Guide and/or have utilized at least one work
zone ITS technology application for dynamic management of work zone
impacts
• What does this mean? – Well-documented agency policies and processes to streamline
consideration and use of work zone ITS technologies to
minimize traffic impacts
11
Source: Battelle

SWZ Initiative Goals
• Technology Application Goal #1B
– By December 2016, 35 State DOTs have implemented business
processes for work zone ITS technologies as identified in the Work
Zone ITS Implementation Guide, and/or have utilized at least one work
zone ITS technology application for dynamic management of work zone
impacts
• What does this mean? – Consideration of the six step process explained in work zone ITS
implementation guide to plan and implement ITS strategies
– Identify and use ITS strategy such as speed and/or queue
management on at least one project for dynamic management of
work zone impacts
12

Smarter Work ZonesPROJECT COORDINATION
13

Project Coordination – What is it?
Coordination within a single project and/or among multiple
projects within a corridor, network, or region, and
possibly across agency jurisdictions to minimize work
zone traffic impacts
14
Source: FHWA

Benefits of Project Coordination (1 of 2)
15
• Greater ability to reduce and manage traffic disruptions
from road work
– Set a maximum time delay for work zone area
– Provide alternate routes for drivers
• Earlier identification of project impacts
– Adjust schedule to stay on track or minimize completion delay
• Fewer number of work zones
• Dynamic adjustments to project schedule
• Improved communications within and across agencies

Benefits of Project Coordination (2 of 2)
16
• Reduced numbers of street cuts
• Better quality road surfaces
• Cost savings
• Increased customer satisfaction
• Provide locations in which drivers can select an
alternate route to exit work zone road.

Project Coordination Example #1Software to coordinate right-of-way construction activities
17
Source: DDOT
• Washington, DC: WZ Project Management System
– System includes:• DDOT, Developer, Utility WZ
Projects
• Work Zone Tracking Tool
• Traffic Analysis Tool
– Used to develop annual citywide TMP
– Tracks performance measurement
– Assists in transportation demand management strategies

Project Coordination Example #2Corridor-level TMPs to address traffic-related construction impacts
• Michigan DOT I-94 Corridor
18
• Significant construction
• Three corridors identified
• Corridor-Level TMPs
• Assess corridor traffic impacts
• Define corridor/segment delay thresholds
• Suggest traffic mgmt. strategies
• Discuss implementation plan
Source: Michigan DOT
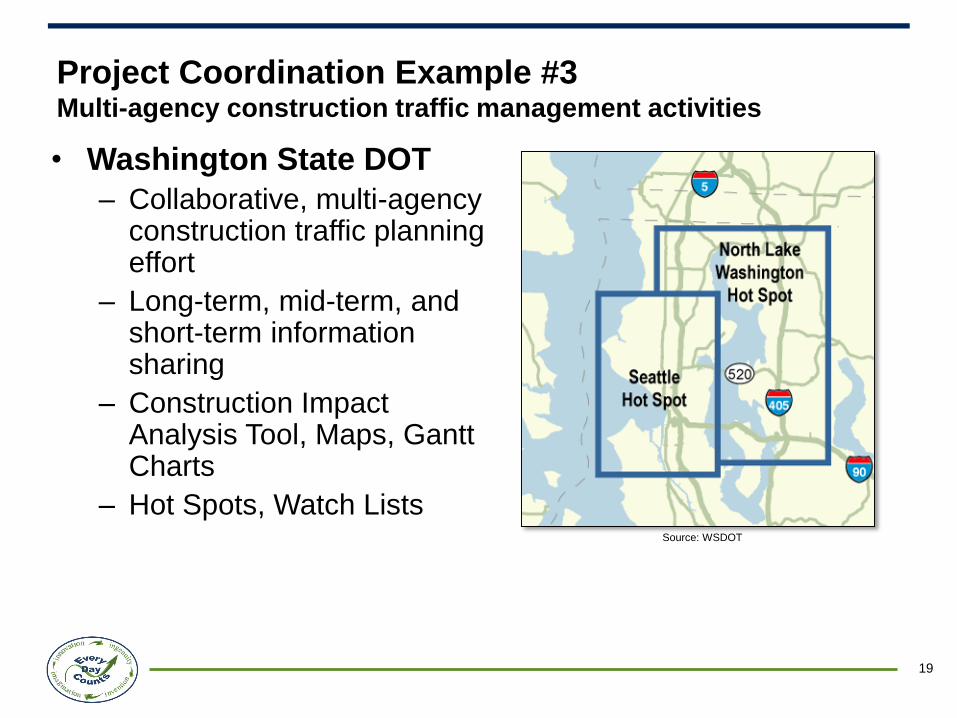
Project Coordination Example #3Multi-agency construction traffic management activities
• Washington State DOT
– Collaborative, multi-agency construction traffic planning effort
– Long-term, mid-term, and short-term information sharing
– Construction Impact Analysis Tool, Maps, Gantt Charts
– Hot Spots, Watch Lists
19
Source: WSDOT

Project Coordination Tool (1 of 2)
Work Zone Implementation Strategies Estimator (WISE)
20
• Developed under the SHRP2 R11 project
• Proactively reduces WZ impacts:
• Effective project coordination upfront in
planning/programming
• Carrying coordination through to project
planning/design decisions
• Made up of two modules:
• Planning Module
• Operation Module

Project Coordination Tool (2 of 2)
Work Zone Implementation Strategies Estimator (WISE)
21
• A grant to pilot the WISE tool was recently awarded to four
states:
• California – Association of Monterey Bay Area
Governments MPO
• Florida – MetroPlan Orlando MPO
• Maryland DOT
• Tennessee DOT
• Tool and documentation available at
http://www.trb.org/Main/Blurbs/168143.aspx

Smarter Work ZonesPROJECT COORDINATION:
CORRIDOR-BASED COORDINATION
22
Lessons from Oregon DOT
OTIA III Statewide Bridge Program

Program Coordination – Corridor-Based
Coordination – Overview
• Establish the Vision for the Corridor
• Develop Details of How the Coordination Occurs
• Educate and Inform Personnel and Stakeholders
• Implement
• Refine the Process
23

OTIA III Repair and Replacement Bridges Locations
24

Establish the Vision for the Corridor or System
• Top Management Directive to Agency
• Buy-in of Stakeholders
25
Mission: Keep Traffic Moving During Construction

Oregon’s Key Mobility Corridors
• Identified critical routes
o N/S, E/W
o Complete one and save as unencumbered route.
o Addressed freight movement.
• Work zone delays
o “Up to 20 minutes” delay standard.
o Result: Additional three hours from California to Portland on I-5.
o Solution: Established delay thresholds.
26

Establish the Vision for the Corridor or System
• Overall Committee made up of decision-makers with
authority to speak for those they represent
– Construction, Maintenance, Design, Operations,
Traffic, Contracting, PI
– May need technical subcommittees to identify and
solve issues
• Development of Overall Guide and Associated
Memorandums
27
Developing Details of How the Coordination Occurs (1 of 2)
• Identify what needs to be managed in the Work Zones?
– Travel Times
– Traffic Volumes/Capacity
– Load Sizes/Hole in the Air
• Develop Tools to Plan, Manage and Monitor
28

Develop Details of How the Coordination Occurs (2 of 2)
• Develop Guidance
– Corridor-Level or Statewide Transportation Management
Plan (TMP)
– Project-Level TMP Guidance Document
• Used to develop the individual Project-Level TMPs
29

Delay Estimation Tool• Delay Thresholds
• Segment 4-C
o Length: 55 miles
o Delay threshold: 7 minutes
30

Delay Estimation Tool
31
Free Flow Threshold: The maximum
sustainable volume that yields average travel
speeds at or near free flow conditions.
• Gather volume/count data
o ODOT data: Multiple, robust
sources
─ Automatic traffic recorders
─ Heavy vehicles
─ Seasonal variations
─ Day of week variations
─ Growth rates
• Identify free-flow threshold
o Compare
− Lane closure chart

Physical Restrictions
• Examples of detours of hundreds of miles
• Maintain access to regions of the state
– E/W and N/S routes
32

Physical Restrictions
• Mandate covers width, height, length, and weight
• Oversize load examples
– Manufactured housing
– Windmill components
33
Educate and Inform Personnel and Stakeholders
• Important for Agency Staff
– Know what is expected
– Know what to do
– Re-educate for updates and staff turnover
• Stakeholders Participation
– Understand what to expect
– Share their perspective
• Train
– Importance of and how to use of tools
– Importance of and how to develop Project-Level
TMPs
34

Implement (1 of 3)
• Tools
• TMPs
• Coordination Meetings
– Sharing information on Process Updates
– Sharing project information between affected
stakeholders (project scope, schedules)
– Identify conflicts
– Work to resolve conflicts
• Escalation Process
35

Implement (2 of 3)
• Coordination Meetings
– Corridor/Regional Meetings of Affected Stakeholders in the
trenches
• Agency: planning, construction, maintenance,
operations, permitting/development, public information
• Other agencies with impacts/project activities
• Tracking Projects through their lives
– Long term plans: general traffic impacts and schedule as
known
– Nearer term plans: refined traffic impacts/staging and
schedule
– Short term and current construction
36

Implement (3 of 3)
• Use and upkeep of tools, especially project tracking tools
37
Refine the Process
• During Early Development: from overall committee and
technical subcommittee
• During Training: Participants spotting challenges
• During Implementation
38

For Additional information:
W.D. BALDWIN
39
NW Area Traffic Leader (HDR)
Project Coordination – Corridor-Based Coordination

Smarter Work ZonesTECHNOLOGY APPLICATION
40

Technology Application – What is it?
Deployment of Intelligent Transportation Systems (ITS)
for dynamic management of work zone traffic impacts,
such as queue and speed management to provide
actionable information to drivers and traffic managers.
41
Source: FHWA
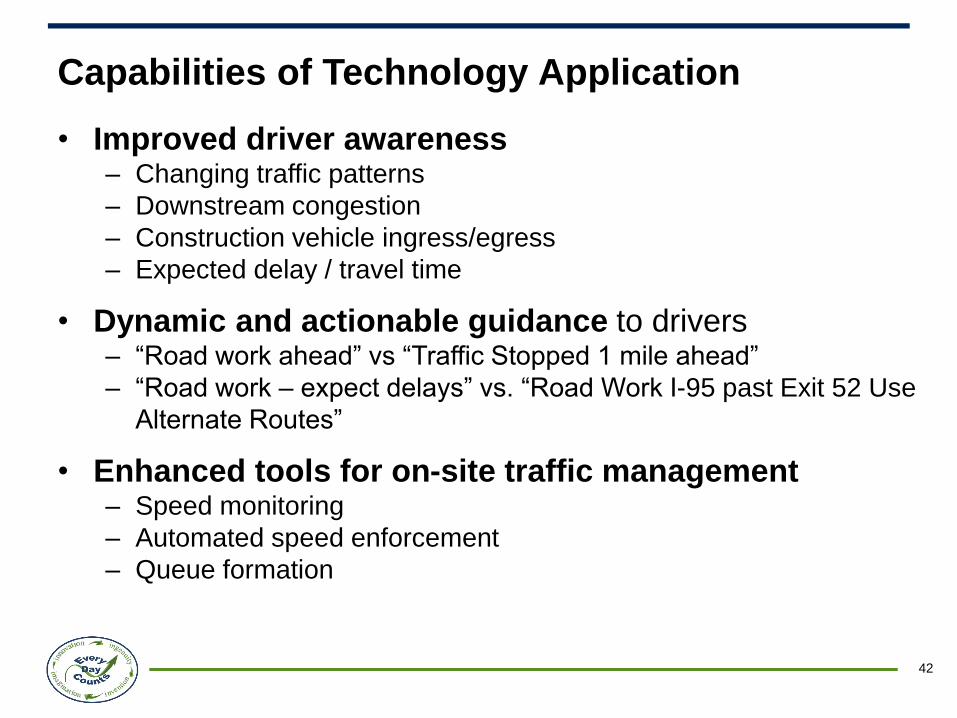
Capabilities of Technology Application
42
• Improved driver awareness– Changing traffic patterns
– Downstream congestion
– Construction vehicle ingress/egress
– Expected delay / travel time
• Dynamic and actionable guidance to drivers– “Road work ahead” vs “Traffic Stopped 1 mile ahead”
– “Road work – expect delays” vs. “Road Work I-95 past Exit 52 Use
Alternate Routes”
• Enhanced tools for on-site traffic management– Speed monitoring
– Automated speed enforcement
– Queue formation

Benefits of Technology Application
43
• Empowers drivers to be proactive in responding to work
zones– Awareness of downstream hazards
– Facilitates real-time decision-making and trip planning
• Streamlines traffic management functions through
partial automation– Speed enforcement
– Data collection
– Performance measurement
• Information increases customer satisfaction– The More you Know…

Technology Application Example:
Queue Warning System (QWS)
44
STOPPED
TRAFFIC
2 MILES
Work ZoneWarning Signs installed
per TCP
Queue Detection ZoneQueue
Warning
Controller
DATA
Zone of advanced work zone awareness
provided by Queue Warning System
DYNAMIC WARNING
MESSAGEPCMS

Technology Application Example:
Variable Speed Limits (VSL)
• Multiple speed trailers in &
approaching work zone
• Each unit monitors prevailing
speed – relays information to
upstream units.
• Posted speed limit
dynamically adjusted to
reduce downstream speed
differential
45
htt
p:/
/ww
w.m
ichig
an.g
ov/d
ocum
ents
/mdot/
MD
OT
_R
esearc
h_R
eport
_R
C1467_2
00
92
4_
7

Technology Application Example:
Dynamic Lane Merge
46
• Early Merge
– In low-volume conditions, it reduces the occurrence of
high-speed margining at the point of lane closure.
• Late Merge
– In high-volume conditions, it reduces the length of the queue.
Source: https://www.workzonesafety.org/fhwa_wz_grant/atssa/atssa_dynamic_lane_merging
Source: https://www.workzonesafety.org/fhwa_wz_grant/atssa/atssa_dynamic_lane_merging
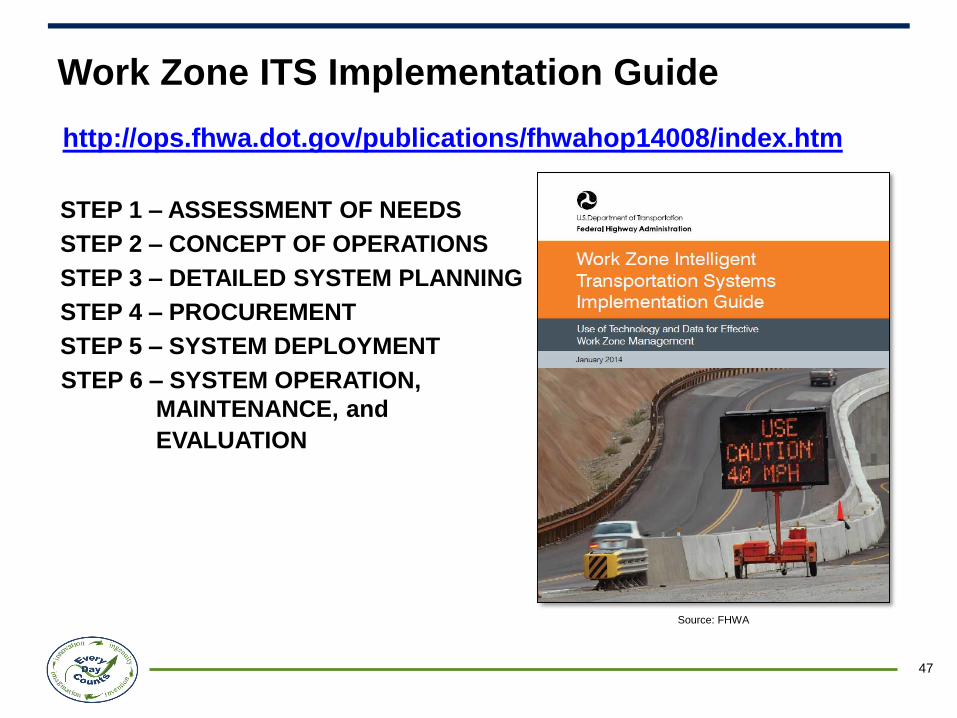
Work Zone ITS Implementation Guide
http://ops.fhwa.dot.gov/publications/fhwahop14008/index.htm
47
Source: FHWA
STEP 1 – ASSESSMENT OF NEEDS
STEP 2 – CONCEPT OF OPERATIONS
STEP 3 – DETAILED SYSTEM PLANNING
STEP 4 – PROCUREMENT
STEP 5 – SYSTEM DEPLOYMENT
STEP 6 – SYSTEM OPERATION,
MAINTENANCE, and
EVALUATION

Smarter Work ZonesTECHNOLOGY APPLICATION
CASE STUDY
48
Massachusetts's Callahan Tunnel
Rehabilitation Project

49
December 2013 to March 2014
Callahan Tunnel Rehabilitation Project
Source: MassDOT

In developing the Traffic Management Plan for the Callahan
Tunnel Project, MassDOT identified a need to provide real-
time traffic conditions to the DOT and our stakeholders in
order to meet the stated goals:
• Mobility: minimize congestion through queue warning,
providing travel/delay times and encouraging traffic diversion
• Safety: minimize the number and severity of traffic-related
incidents, injuries and fatalities in the work zone
• Planning and Monitoring: collect operations data to develop
performance reports, allocate enforcement patrols, refine
allowable working hours, and evaluate throughput capacity
50
Assessment of Needs

Boston Callahan Tunnel Traffic Management
• Had Early Action item to
remove median and realign
travel lanes to address
expected queues
• Upgrades to traffic signal
equipment and timing plans
for traffic progression
• SWZ system concept of
operations identified a need
to monitor and provide
Real-Time feedback about
alternate routes
51
Alternate Routes for Callahan Tunnel Closure
Source: MassDOT

Smarter Work Zone System Design
52
“Real-Time” view of area traffic conditions
Source: MassDOT

SWZ Traffic/Queue Management
53
Message Boards driven by “Delay Threshold” logic
fed by probe vehicle data

SWZ Traffic/Queue Management
54

SWZ Traffic/Queue Management
55

SWZ System Operations
56
Source: MassDOT
SWZ message boards provide route choice suggestions
based on “real time” traffic conditions

SWZ Monitoring Key Locations
57
Source: MassDOT
Source: MassDOT
Monitor key
alternate route
decision points
Use SWZ technology to
foster an Interagency
Partnership through
information sharing

Evaluation of SWZ System
58
Enhanced messaging helps eliminate motorists frustration with construction delays
Stopped traffic notification helps alert motorists on back of queue and prevents crashes
MassDOT construction staff benefit from allowing the SWZ system to manage traffic
Sharing SWZ system access/data with partner agencies helps improve network mobility
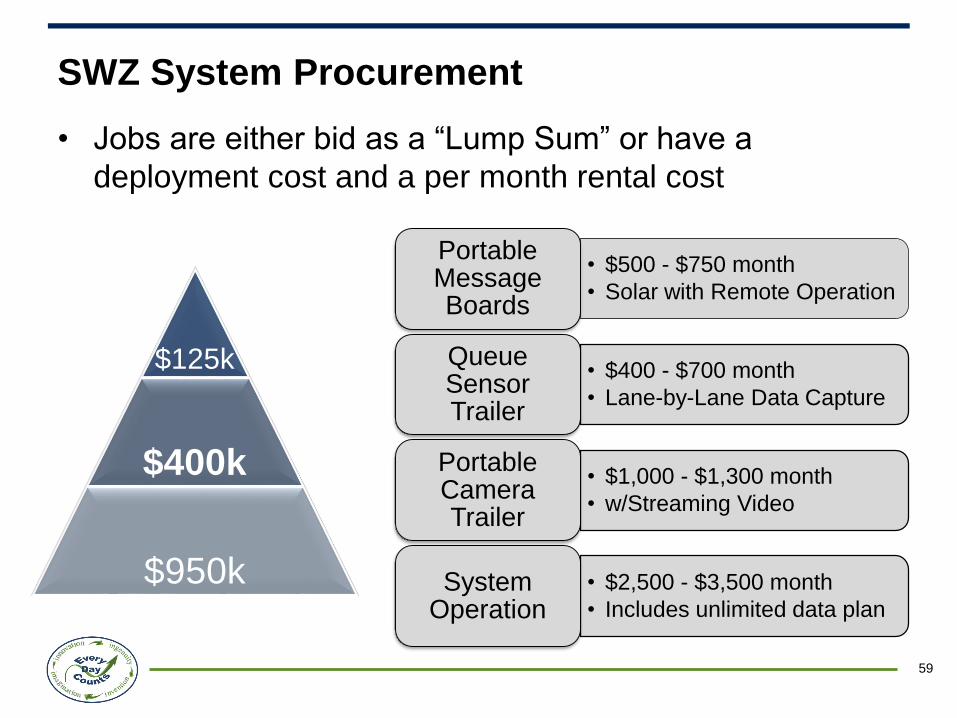
SWZ System Procurement
• Jobs are either bid as a “Lump Sum” or have a
deployment cost and a per month rental cost
59
• $500 - $750 month
• Solar with Remote Operation
Portable Message Boards
• $400 - $700 month
• Lane-by-Lane Data Capture
Queue Sensor Trailer
• $1,000 - $1,300 month
• w/Streaming Video
Portable Camera Trailer
• $2,500 - $3,500 month
• Includes unlimited data planSystem
Operation
$125k
$400k
$950k

SWZ Lessons Learned
• Make use of ITS in work zones part of your traffic management mitigation strategies
• Start planning your Concept of Operations early in project development
60
• Prepare SWZ System Item
Specifications that include
detailed descriptions of the
equipment, system operation
and expected deliverables
• Capture traffic data to
generate performance
measures for SWZ

For Additional information:
NEIL E. BOUDREAU
61
State Traffic Engineer (MassDOT)
Callahan Tunnel Rehabilitation Project - Case Study
Smarter Work ZonesIMPLEMENTATION PLANS and
FUNDING OPPORTUNITIES
62

SWZ State Implementation Plan
• Individual State Implementation Plans
– Use as project management tool by listing activities and
schedule to ensure successful implementation of SWZ
initiative
– Provides a way to better understand agency initiative,
assess any technical assistance needs, and tracking
progress
63
Innovation Deployment Stage Jan 2015
June 2015
Dec 2015
June 2016
Goal
Opt-out: The State is not interested in pursuing [tool or technology]
Development Phase: Collect guidance and best practices, build support with partners and stakeholders, and develop a process necessary for implementation
Demonstration Phase: Testing/piloting [tool or technology]
Assessment Phase: Assess performance and the process for carrying out [tool or technology]. Make adjustments to prepare for full deployment
Institutionalized: [Tool or technology] is adopted by the State’s highway construction industry and used regularly on projects

SWZ State Implementation Plan (continued)
• Implementation Plan Activities
– Provide a list of activities that are planned to progress from
current implementation stage to goal implementation stage
64
Implementation Plan Activities
Activity No.
Description of ActivityTarget
Completion DateSchedule/Status
1
2
3
4

How can States fund these initiatives?
State Transportation Innovation Councils (STIC)
Incentive Program
– Funds activities which turn innovations into standard practices
– All states are eligible
– Up to $100,000 available to each STIC annually
– Can be used to fund multiple initiatives
– Use to pay consultants to develop standards, specifications,
design manuals, evaluations, implementation plans, workshops,
training, and more!
65
www.fhwa.dot.gov/stic

How can States fund these initiatives?
Accelerated Innovation Deployment (AID)
Demonstration Program
– Projects may be any aspect of highway transportation
– Max of $1,000,000 (up to full cost of project)
– Monitoring, assessment, and technology transfer commitments
– Current grants include ABC, high surface friction treatments, and
ATMS/A.
66
https://www.fhwa.dot.gov/accelerating/grants/

Smarter Work Zones
FHWA RESOURCES AND OPPORTUNITIES
67

FHWA Resources and Opportunities
68
• SWZ Outreach Materials• Case studies• Fact Sheets• Resource Toolkit (online and via USB drive)
• Guidelines, presentations, deployment strategies, procurement procedures, and more!
• Virtual and In-person Training Opportunities• Webinars • 1-2 day training workshops
• Virtual and In-person Peer-to-Peer Exchanges• Meet with agencies who have successfully adopted SWZ
strategies

FHWA Resources and Opportunities
69
• Regional Peer Exchange Workshops• Four regional workshops to be attended by agency
representatives and SMEs to discuss SWZ strategies and implementation
• Demonstration Site Visits• See SWZ deployments first-hand across the country.
• Additional Resources• Project Coordination-specific and Technology Application-
specific lists of resources available to download.

SWZ Implementation Core Team
• SWZ Initiative Leads
– Paul Pisano, Team Leader, FHWA Office of Operations
– Jawad Paracha, Work Zone Program Manager, FHWA Office of Operations
• FHWA Smarter Work Zones Team
– Todd Peterson, FHWA Office of Operations
– Martha Kapitanov, FHWA Office of Operations
– Eric Ferron, Lakewood, CO FHWA Resource Center
– Ken Wood, Matteson, IL FHWA Resource Center
– Karen Gilbertson, FHWA Kansas Division Office
• SWZ Subject Mater Experts
– Jerry Ullman, Texas A&M Transportation Institute
– W.D. Baldwin, HDR
• State DOT SWZ Subject Matter Experts
– Neil Boudreau, Massachusetts DOT
– Chris Brookes, Michigan DOT
– Scott McCanna, Oregon DOT
– Michael Fontaine, Virginia Center for Transportation Innovation and Research
70

Thank you for joining us!
71
• Upcoming Events– Webinar #2: Implementing Technology Application Solutions
• Tuesday, September 29, 2015 1:00-2:30pm EDT
– Regional Peer Exchanges
– Check The National Work Zone Safety Information Clearinghouse website for updates
• https://www.workzonesafety.org/SWZ
• Questions or Comments?
– Jawad Paracha (FHWA Operations, WZ Team)
FHWA DFS Region Location Dates
North University of
Massachusetts, Springfield
Week of October 26-30
(exact dates TBD)
South TBD TBD
Mid-America TBD Week of October 19-22
(exact dates TBD)
West TBD TBD