Embed Size (px)
Citation preview

Analysing the drivers of peak demand
Smart Utilities Conference 2012
22 November 2012
Robert Simpson, Demand Management
Overview
1. Energy versus peak demand
2. Seasonal, weather and day type effects
3. Customer segment contributions
4. Peak demand on network assets
5. Summary
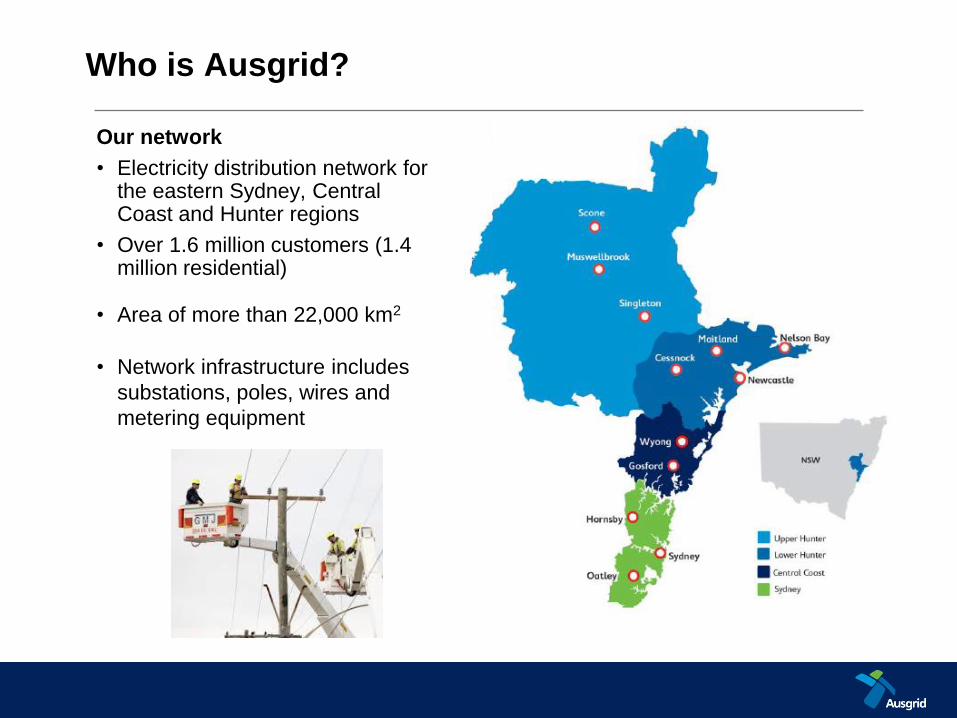
Who is Ausgrid?
Our network
• Electricity distribution network for the eastern Sydney, Central Coast and Hunter regions
• Over 1.6 million customers (1.4 million residential)
• Area of more than 22,000 km2
• Network infrastructure includes
substations, poles, wires and
metering equipment
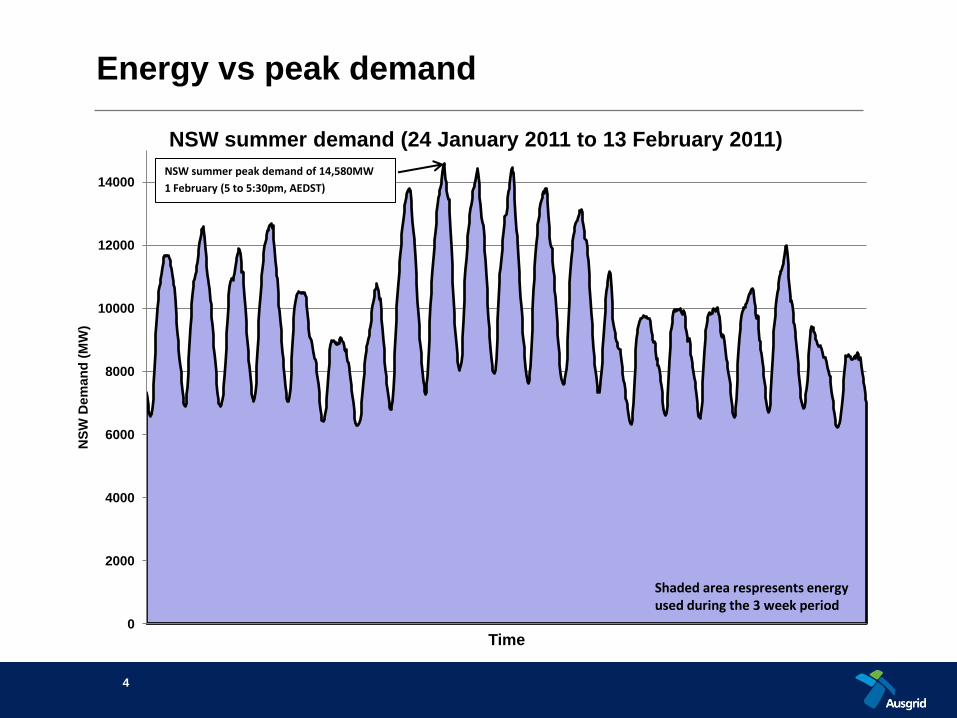
Energy vs peak demand
4
0
2000
4000
6000
8000
10000
12000
14000
NS
W D
em
an
d (
MW
)
Time
NSW summer demand (24 January 2011 to 13 February 2011)
NSW summer peak demand of 14,580MW
1 February (5 to 5:30pm, AEDST)
Shaded area respresents energy used during the 3 week period
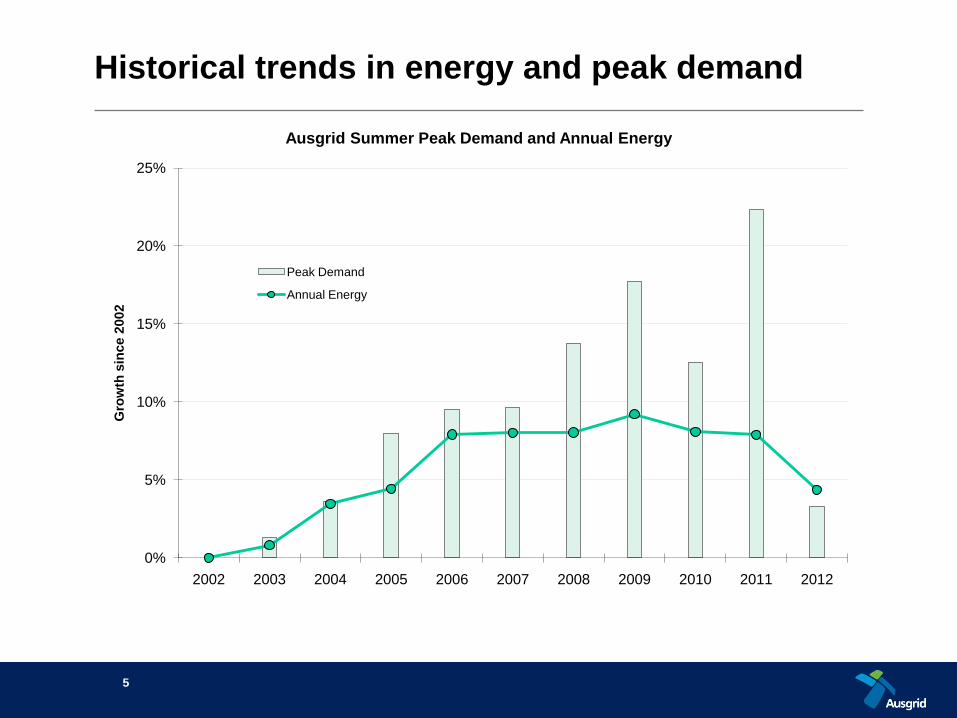
Historical trends in energy and peak demand
5
0%
5%
10%
15%
20%
25%
2002 2003 2004 2005 2006 2007 2008 2009 2010 2011 2012
Gro
wth
sin
ce 2
002
Ausgrid Summer Peak Demand and Annual Energy
Peak Demand
Annual Energy
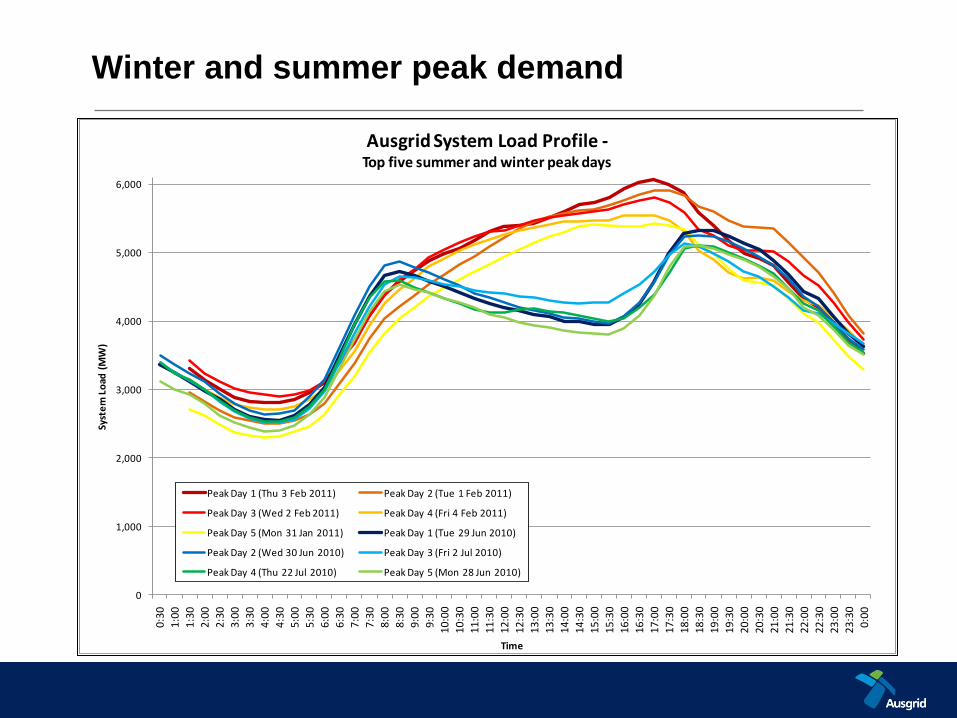
Winter and summer peak demand
0
1,000
2,000
3,000
4,000
5,000
6,000
0:30
1:00
1:30
2:00
2:30
3:00
3:30
4:00
4:30
5:00
5:30
6:00
6:30
7:00
7:30
8:00
8:30
9:00
9:30
10:0
0
10:3
0
11:0
0
11:3
0
12:0
0
12:3
0
13:0
0
13:3
0
14:0
0
14:3
0
15:0
0
15:3
0
16:0
0
16:3
0
17:0
0
17:3
0
18:0
0
18:3
0
19:0
0
19:3
0
20:0
0
20:3
0
21:0
0
21:3
0
22:0
0
22:3
0
23:0
0
23:3
0
0:00
Syst
em
Lo
ad (
MW
)
Time
Ausgrid System Load Profile -Top five summer and winter peak days
Peak Day 1 (Thu 3 Feb 2011) Peak Day 2 (Tue 1 Feb 2011)
Peak Day 3 (Wed 2 Feb 2011) Peak Day 4 (Fri 4 Feb 2011)
Peak Day 5 (Mon 31 Jan 2011) Peak Day 1 (Tue 29 Jun 2010)
Peak Day 2 (Wed 30 Jun 2010) Peak Day 3 (Fri 2 Jul 2010)
Peak Day 4 (Thu 22 Jul 2010) Peak Day 5 (Mon 28 Jun 2010)
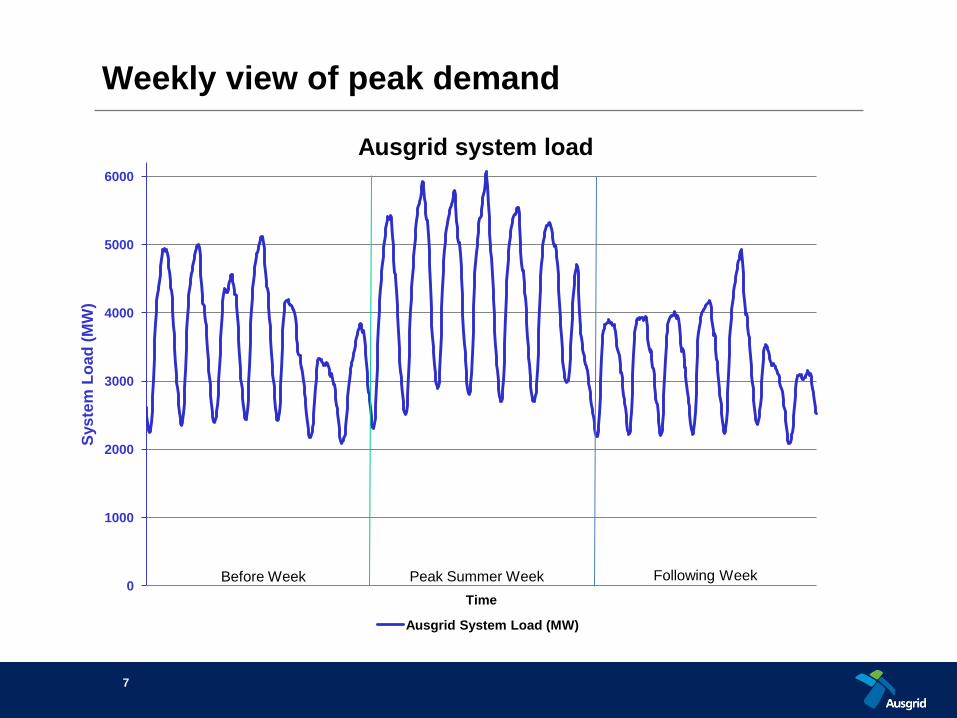
Weekly view of peak demand
7
0
1000
2000
3000
4000
5000
6000
Sys
tem
Lo
ad
(M
W)
Time
Ausgrid system load
Ausgrid System Load (MW)
Peak Summer Week Following WeekBefore Week
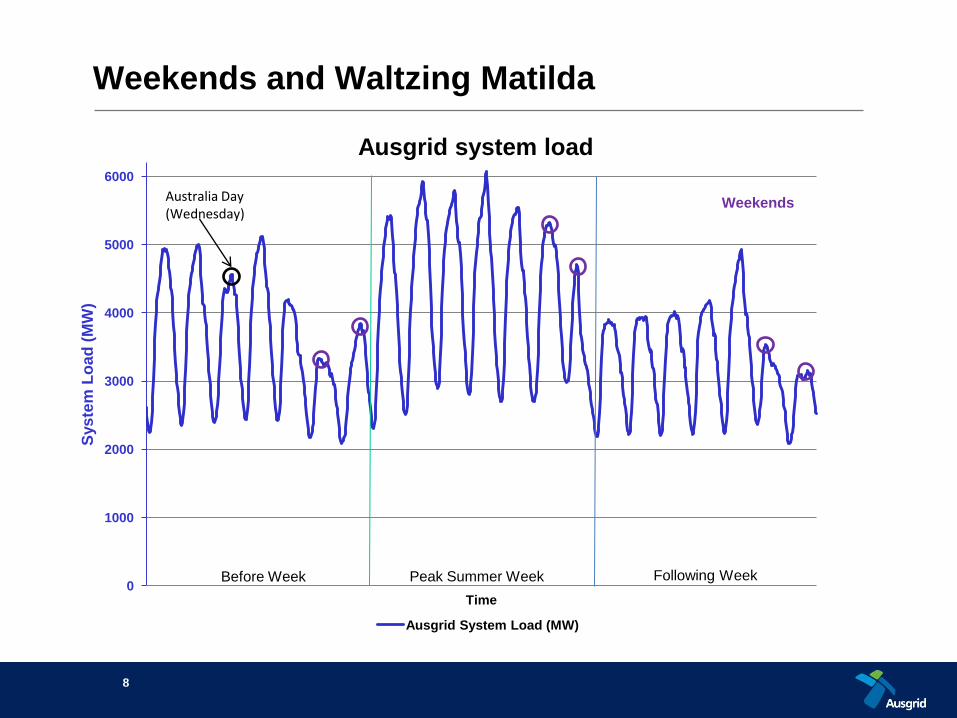
Weekends and Waltzing Matilda
8
0
1000
2000
3000
4000
5000
6000
Sys
tem
Lo
ad
(M
W)
Time
Ausgrid system load
Ausgrid System Load (MW)
Peak Summer Week Following WeekBefore Week
Australia Day (Wednesday)
Weekends
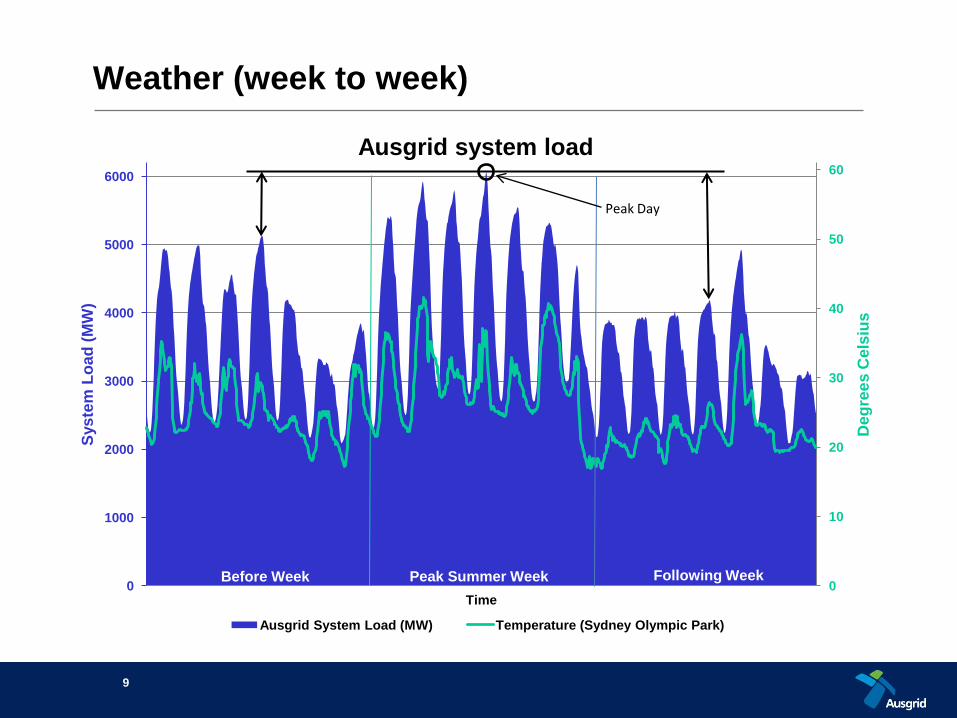
Weather (week to week)
9
0
10
20
30
40
50
60
0
1000
2000
3000
4000
5000
6000
Deg
ree
s C
els
ius
Sys
tem
Lo
ad
(M
W)
Time
Ausgrid system load
Ausgrid System Load (MW) Temperature (Sydney Olympic Park)
Peak Summer Week Following WeekBefore Week
Peak Day
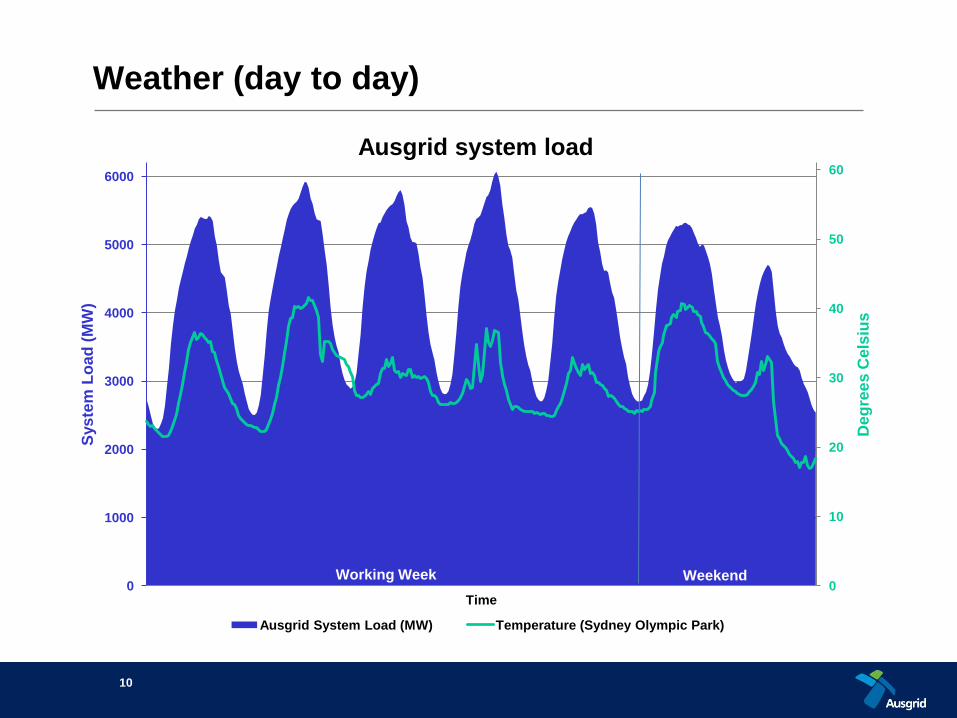
Weather (day to day)
10
0
10
20
30
40
50
60
0
1000
2000
3000
4000
5000
6000
Deg
ree
s C
els
ius
Sys
tem
Lo
ad
(M
W)
Time
Ausgrid system load
Ausgrid System Load (MW) Temperature (Sydney Olympic Park)
WeekendWorking Week
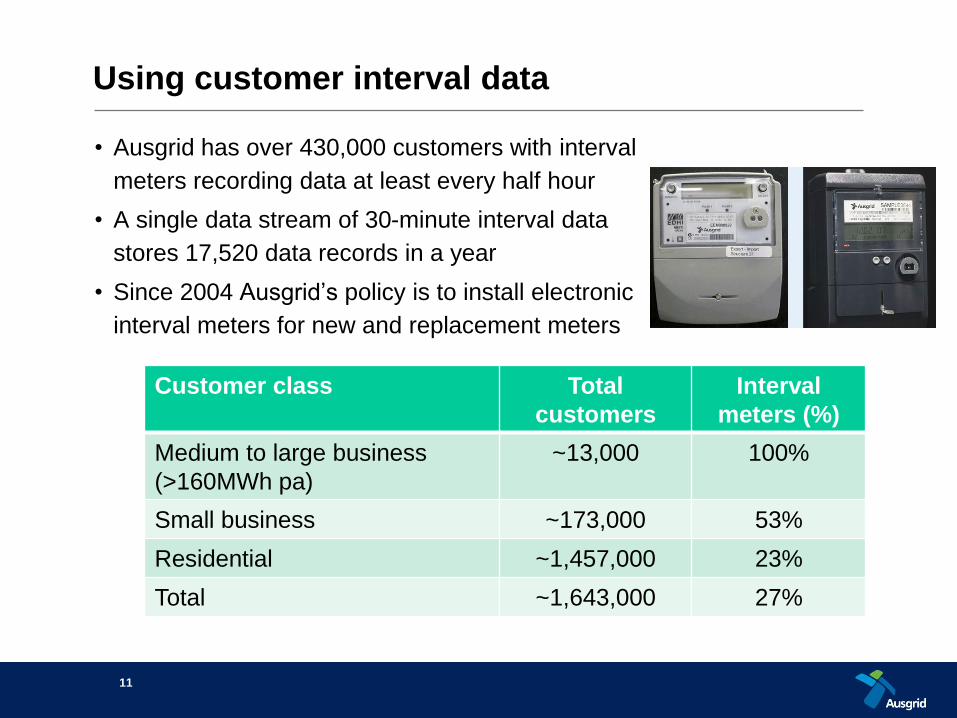
Using customer interval data
• Ausgrid has over 430,000 customers with interval
meters recording data at least every half hour
• A single data stream of 30-minute interval data
stores 17,520 data records in a year
• Since 2004 Ausgrid’s policy is to install electronic
interval meters for new and replacement meters
11
Customer class Total
customers
Interval
meters (%)
Medium to large business
(>160MWh pa)
~13,000 100%
Small business ~173,000 53%
Residential ~1,457,000 23%
Total ~1,643,000 27%
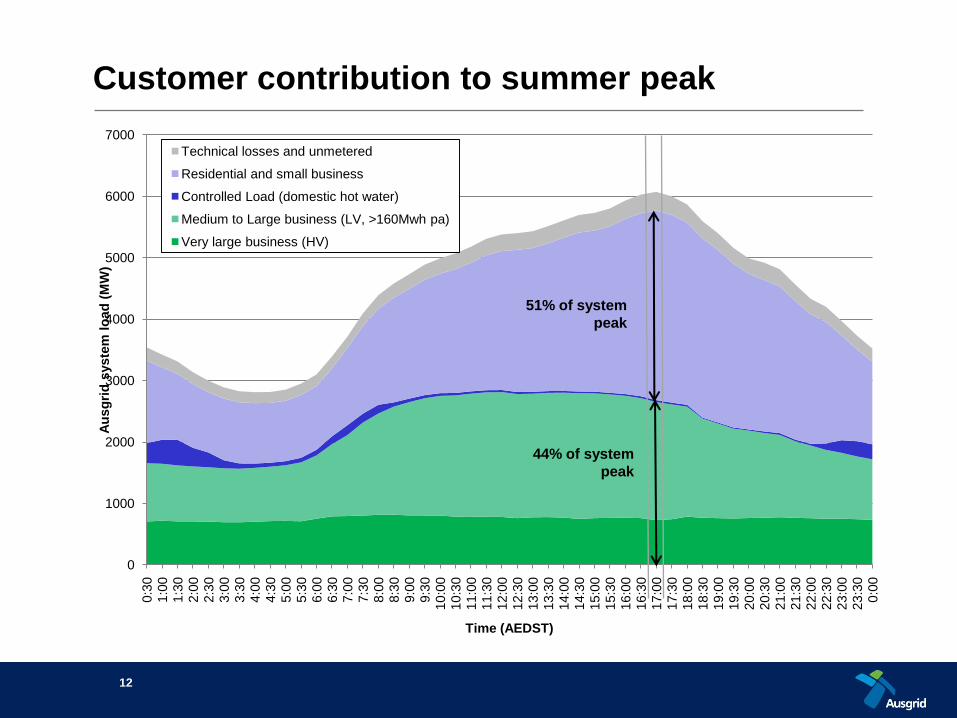
Customer contribution to summer peak
12
0
1000
2000
3000
4000
5000
6000
70000:3
01:0
01:3
02:0
02:3
03:0
03:3
04:0
04:3
05:0
05:3
06:0
06:3
07:0
07:3
08:0
08:3
09:0
09:3
010:0
010:3
011:0
011:3
012:0
012:3
013:0
013:3
014:0
014:3
015:0
015:3
016:0
016:3
017:0
017:3
018:0
018:3
019:0
019:3
020:0
020:3
021:0
021:3
022:0
022:3
023:0
023:3
00:0
0
Au
sg
rid
syste
m l
oad
(M
W)
Time (AEDST)
Technical losses and unmetered
Residential and small business
Controlled Load (domestic hot water)
Medium to Large business (LV, >160Mwh pa)
Very large business (HV)
44% of system
peak
51% of system
peak
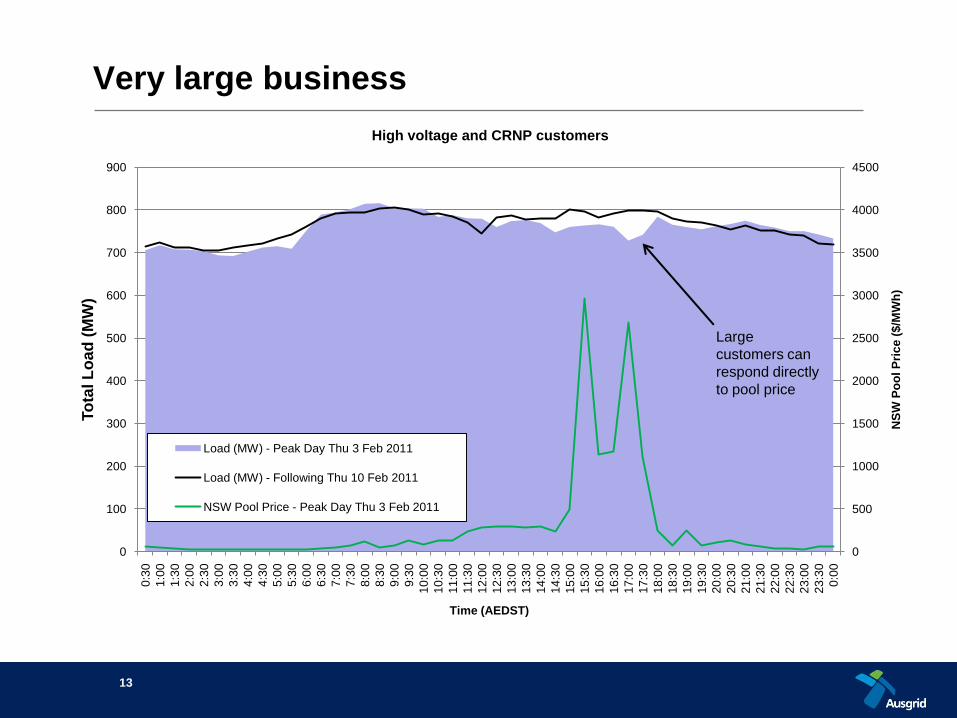
Very large business
13
0
500
1000
1500
2000
2500
3000
3500
4000
4500
0
100
200
300
400
500
600
700
800
900
0:3
0
1:0
0
1:3
0
2:0
0
2:3
0
3:0
0
3:3
0
4:0
0
4:3
0
5:0
0
5:3
0
6:0
0
6:3
0
7:0
0
7:3
0
8:0
0
8:3
0
9:0
0
9:3
0
10
:00
10
:30
11
:00
11
:30
12
:00
12
:30
13
:00
13
:30
14
:00
14
:30
15
:00
15
:30
16
:00
16
:30
17
:00
17
:30
18
:00
18
:30
19
:00
19
:30
20
:00
20
:30
21
:00
21
:30
22
:00
22
:30
23
:00
23
:30
0:0
0
NS
W P
oo
l P
ric
e (
$/M
Wh
)
To
tal L
oad
(M
W)
Time (AEDST)
High voltage and CRNP customers
Load (MW) - Peak Day Thu 3 Feb 2011
Load (MW) - Following Thu 10 Feb 2011
NSW Pool Price - Peak Day Thu 3 Feb 2011
Large
customers can
respond directly
to pool price
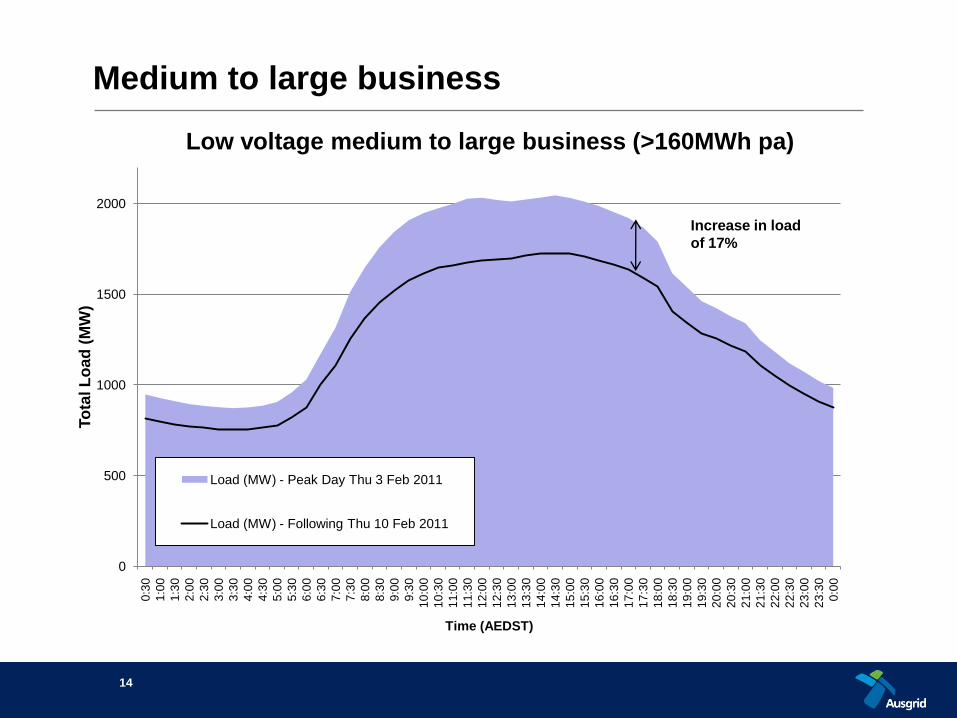
Medium to large business
14
0
500
1000
1500
2000
0:3
0
1:0
0
1:3
0
2:0
0
2:3
0
3:0
0
3:3
0
4:0
0
4:3
0
5:0
0
5:3
0
6:0
0
6:3
0
7:0
0
7:3
0
8:0
0
8:3
0
9:0
0
9:3
0
10
:00
10
:30
11
:00
11
:30
12
:00
12
:30
13
:00
13
:30
14
:00
14
:30
15
:00
15
:30
16
:00
16
:30
17
:00
17
:30
18
:00
18
:30
19
:00
19
:30
20
:00
20
:30
21
:00
21
:30
22
:00
22
:30
23
:00
23
:30
0:0
0
To
tal L
oad
(M
W)
Time (AEDST)
Low voltage medium to large business (>160MWh pa)
Load (MW) - Peak Day Thu 3 Feb 2011
Load (MW) - Following Thu 10 Feb 2011
Increase in load
of 17%
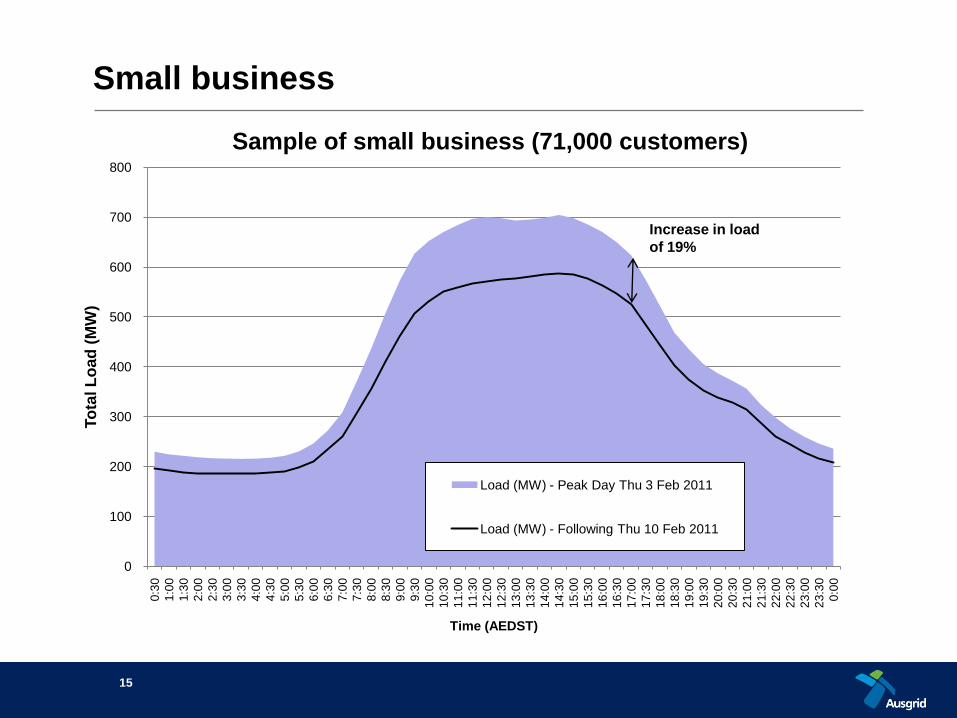
Small business
15
0
100
200
300
400
500
600
700
800 0
:30
1:0
0
1:3
0
2:0
0
2:3
0
3:0
0
3:3
0
4:0
0
4:3
0
5:0
0
5:3
0
6:0
0
6:3
0
7:0
0
7:3
0
8:0
0
8:3
0
9:0
0
9:3
0
10
:00
10
:30
11
:00
11
:30
12
:00
12
:30
13
:00
13
:30
14
:00
14
:30
15
:00
15
:30
16
:00
16
:30
17
:00
17
:30
18
:00
18
:30
19
:00
19
:30
20
:00
20
:30
21
:00
21
:30
22
:00
22
:30
23
:00
23
:30
0:0
0
To
tal L
oad
(M
W)
Time (AEDST)
Sample of small business (71,000 customers)
Load (MW) - Peak Day Thu 3 Feb 2011
Load (MW) - Following Thu 10 Feb 2011
Increase in load
of 19%
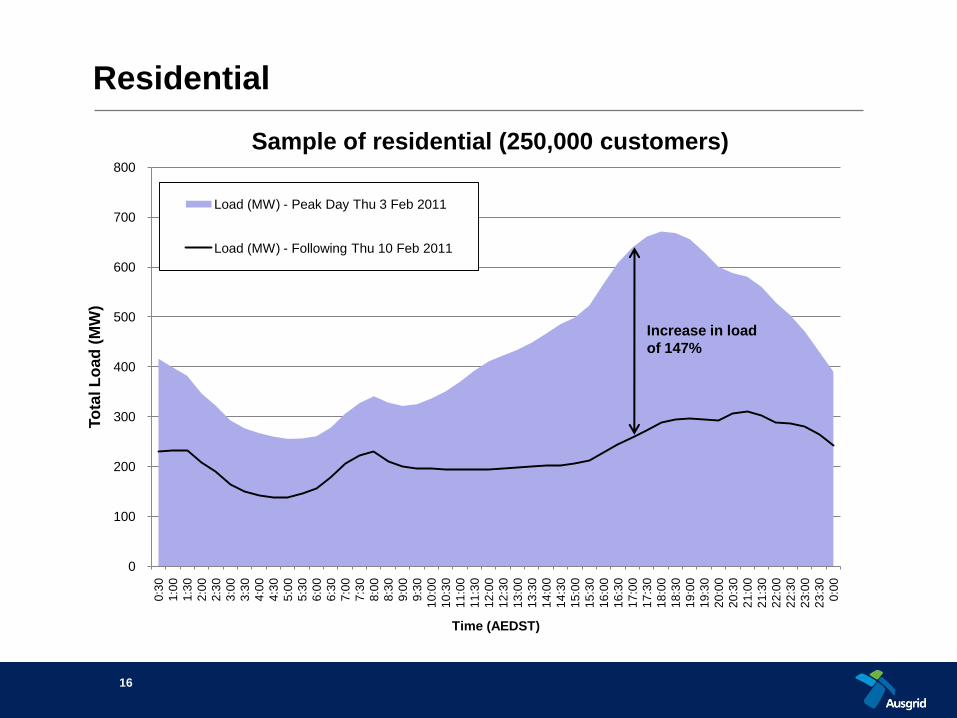
Residential
16
0
100
200
300
400
500
600
700
800 0
:30
1:0
0
1:3
0
2:0
0
2:3
0
3:0
0
3:3
0
4:0
0
4:3
0
5:0
0
5:3
0
6:0
0
6:3
0
7:0
0
7:3
0
8:0
0
8:3
0
9:0
0
9:3
0
10
:00
10
:30
11
:00
11
:30
12
:00
12
:30
13
:00
13
:30
14
:00
14
:30
15
:00
15
:30
16
:00
16
:30
17
:00
17
:30
18
:00
18
:30
19
:00
19
:30
20
:00
20
:30
21
:00
21
:30
22
:00
22
:30
23
:00
23
:30
0:0
0
To
tal L
oad
(M
W)
Time (AEDST)
Sample of residential (250,000 customers)
Load (MW) - Peak Day Thu 3 Feb 2011
Load (MW) - Following Thu 10 Feb 2011
Increase in load
of 147%
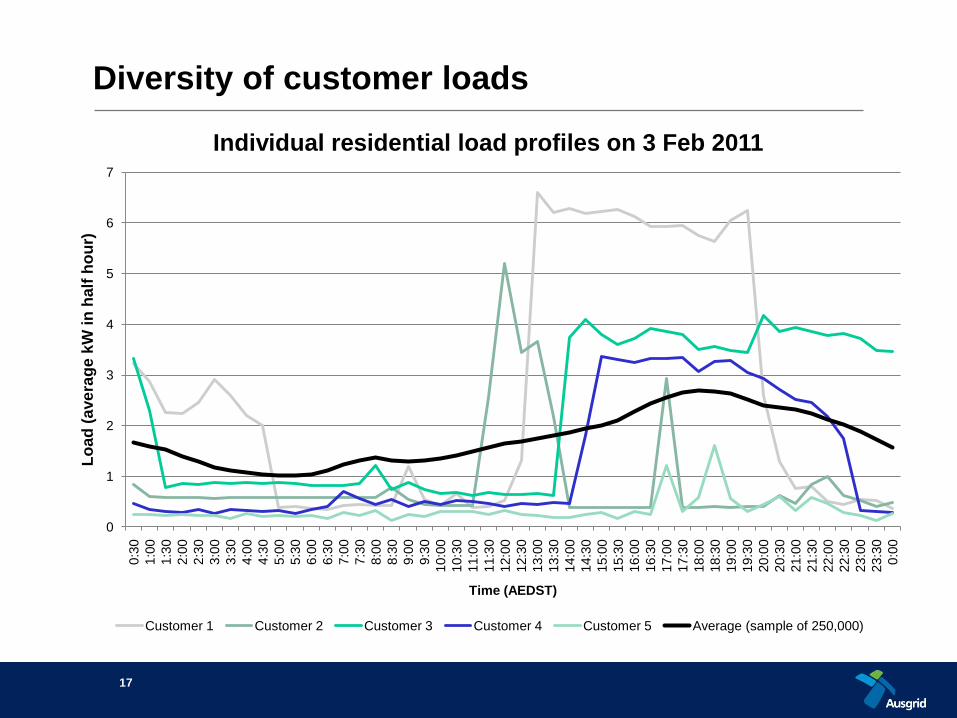
Diversity of customer loads
17
0
1
2
3
4
5
6
7
0:3
0
1:0
0
1:3
0
2:0
0
2:3
0
3:0
0
3:3
0
4:0
0
4:3
0
5:0
0
5:3
0
6:0
0
6:3
0
7:0
0
7:3
0
8:0
0
8:3
0
9:0
0
9:3
0
10:0
0
10:3
0
11:0
0
11:3
0
12:0
0
12:3
0
13:0
0
13:3
0
14:0
0
14:3
0
15:0
0
15:3
0
16:0
0
16:3
0
17:0
0
17:3
0
18:0
0
18:3
0
19:0
0
19:3
0
20:0
0
20:3
0
21:0
0
21:3
0
22:0
0
22:3
0
23:0
0
23:3
0
0:0
0
Lo
ad
(ave
rag
e k
W in
half
ho
ur)
Time (AEDST)
Individual residential load profiles on 3 Feb 2011
Customer 1 Customer 2 Customer 3 Customer 4 Customer 5 Average (sample of 250,000)
Residential air conditioners
18
0
10
20
30
40
50
60
70
80
90
100
19
74
/75
19
76
/77
19
78
/79
19
80
/81
19
82
/83
19
84
/85
19
86
/87
19
88
/89
19
90
-91
19
92
-93
19
94
-95
19
96
-97
19
98
-99
20
00
-01
20
02
-03
20
04
-05
20
06
-07
20
08
-09
20
10
-11
20
12
-13
20
14
-15
20
17
-18
20
19
-20
Pen
etr
ati
on
%
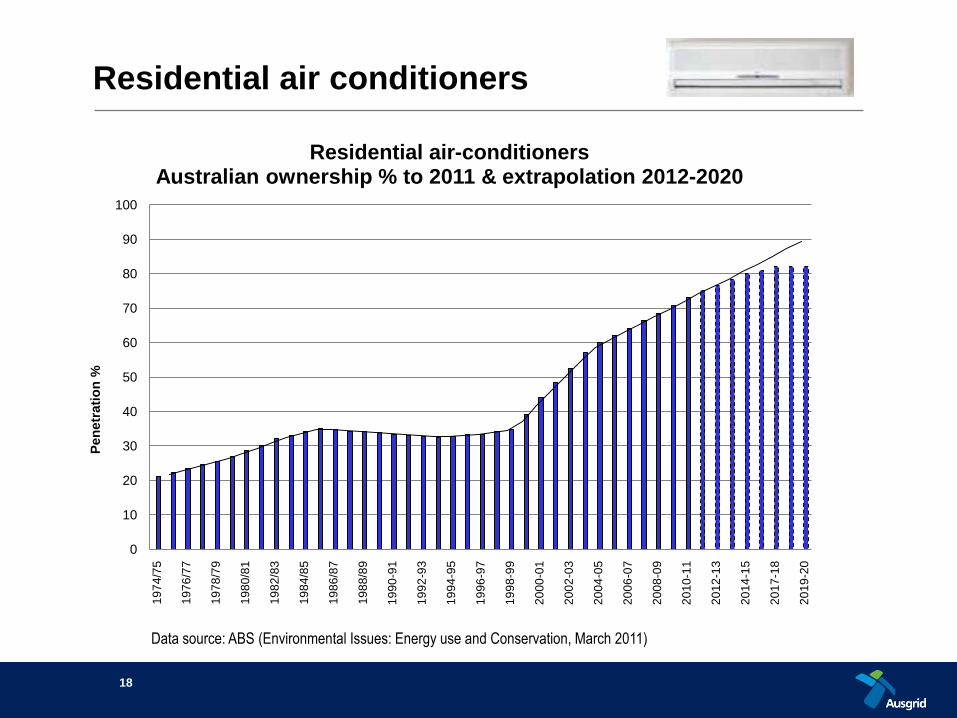
Residential air-conditioners Australian ownership % to 2011 & extrapolation 2012-2020
Data source: ABS (Environmental Issues: Energy use and Conservation, March 2011)
Residential air conditioners
19
0.0
0.5
1.0
1.5
2.0
2.5
3.0
3.5
4.0
4.5
5.0
0:3
0
1:0
0
1:3
0
2:0
0
2:3
0
3:0
0
3:3
0
4:0
0
4:3
0
5:0
0
5:3
0
6:0
0
6:3
0
7:0
0
7:3
0
8:0
0
8:3
0
9:0
0
9:3
0
10
:00
10
:30
11
:00
11
:30
12
:00
12
:30
13
:00
13
:30
14
:00
14
:30
15
:00
15
:30
16
:00
16
:30
17
:00
17
:30
18
:00
18
:30
19
:00
19
:30
20
:00
20
:30
21
:00
21
:30
22
:00
22
:30
23
:00
23
:30
0:0
0
Time (AEDST)
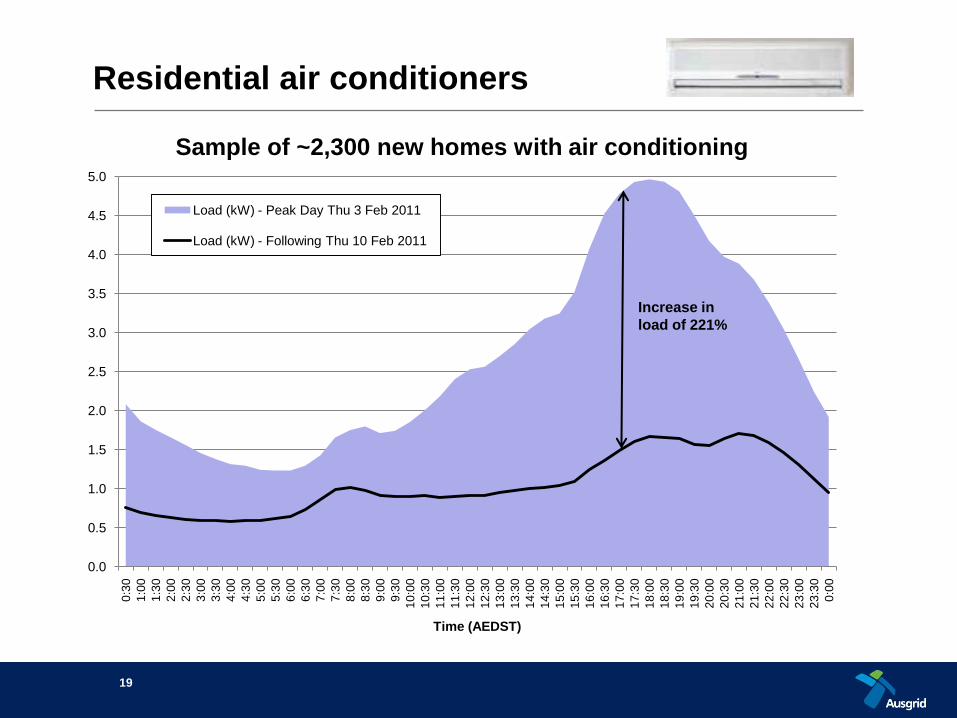
Sample of ~2,300 new homes with air conditioning
Load (kW) - Peak Day Thu 3 Feb 2011
Load (kW) - Following Thu 10 Feb 2011
Increase in
load of 221%
Network investment drivers
20
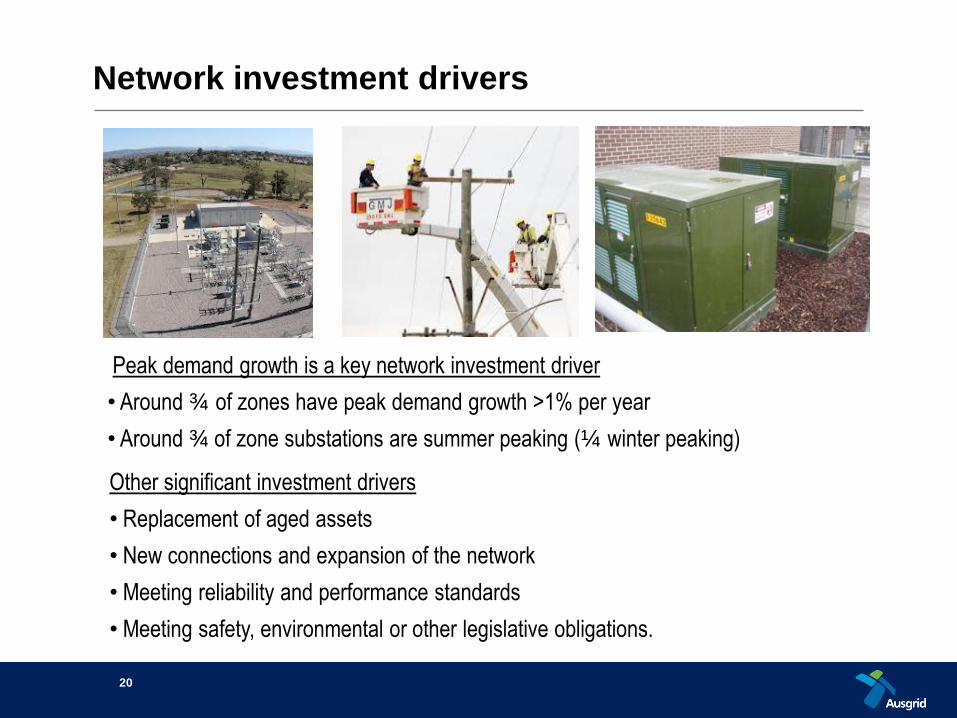
Peak demand growth is a key network investment driver
• Around ¾ of zones have peak demand growth >1% per year
• Around ¾ of zone substations are summer peaking (¼ winter peaking)
Other significant investment drivers
• Replacement of aged assets
• New connections and expansion of the network
• Meeting reliability and performance standards
• Meeting safety, environmental or other legislative obligations.
Zone substation diversity
21
1:0
0
2:0
0
3:0
0
4:0
0
5:0
0
6:0
0
7:0
0
8:0
0
9:0
0
10:0
0
11:0
0
12:0
0
13:0
0
14:0
0
15:0
0
16:0
0
17:0
0
18:0
0
19:0
0
20:0
0
21:0
0
22:0
0
23:0
0
0:0
0
Lo
ad
Time
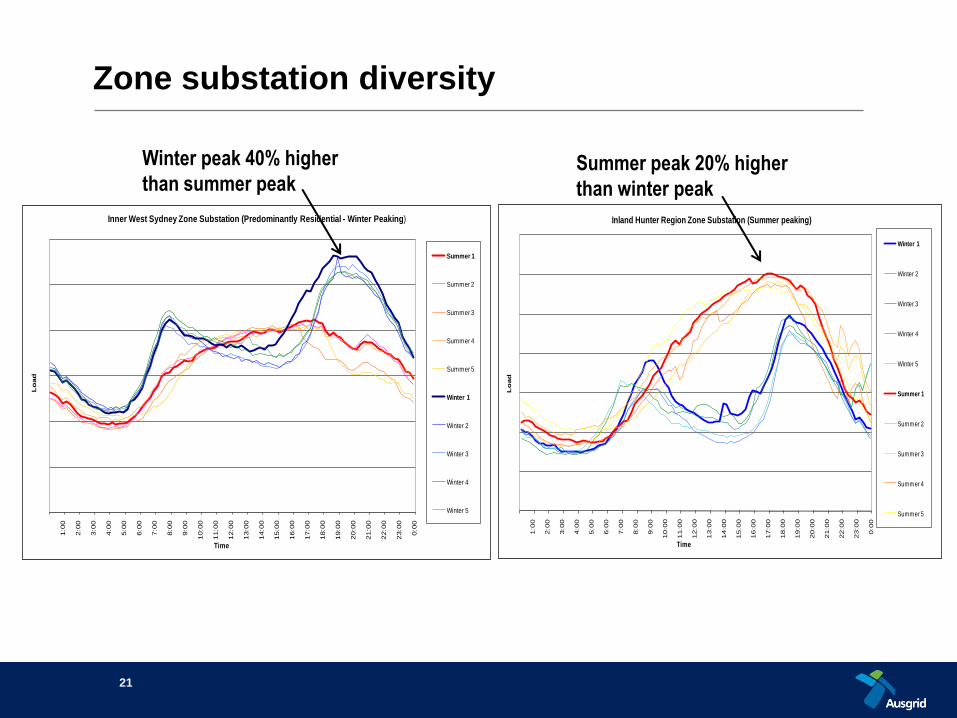
Inner West Sydney Zone Substation (Predominantly Residential - Winter Peaking)
Summer 1
Summer 2
Summer 3
Summer 4
Summer 5
Winter 1
Winter 2
Winter 3
Winter 4
Winter 5
1:0
0
2:0
0
3:0
0
4:0
0
5:0
0
6:0
0
7:0
0
8:0
0
9:0
0
10:0
0
11:0
0
12:0
0
13:0
0
14:0
0
15:0
0
16:0
0
17:0
0
18:0
0
19:0
0
20:0
0
21:0
0
22:0
0
23:0
0
0:0
0
Lo
ad
Time
Inland Hunter Region Zone Substation (Summer peaking)
Winter 1
Winter 2
Winter 3
Winter 4
Winter 5
Summer 1
Summer 2
Summer 3
Summer 4
Summer 5
Winter peak 40% higher
than summer peakSummer peak 20% higher
than winter peak
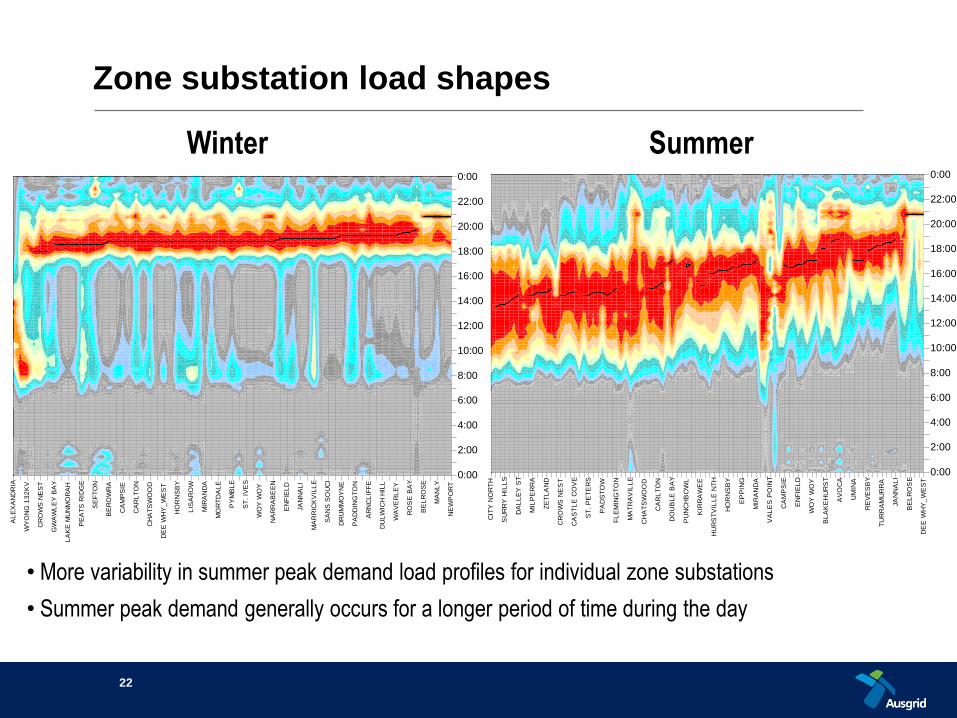
Zone substation load shapes
22
0:00
2:00
4:00
6:00
8:00
10:00
12:00
14:00
16:00
18:00
20:00
22:00
0:00
AL
EX
AN
DR
IA
WY
ON
G 1
32
KV
CR
OW
S N
ES
T
GW
AW
LE
Y B
AY
LA
KE
MU
NM
OR
AH
PE
AT
S R
IDG
E
SE
FT
ON
BE
RO
WR
A
CA
MP
SIE
CA
RL
TO
N
CH
AT
SW
OO
D
DE
E W
HY
_W
ES
T
HO
RN
SB
Y
LIS
AR
OW
MIR
AN
DA
MO
RT
DA
LE
PY
MB
LE
ST
. IV
ES
WO
Y W
OY
NA
RR
AB
EE
N
EN
FIE
LD
JA
NN
AL
I
MA
RR
ICK
VIL
LE
SA
NS
SO
UC
I
DR
UM
MO
YN
E
PA
DD
ING
TO
N
AR
NC
LIF
FE
DU
LW
ICH
HIL
L
WA
VE
RL
EY
RO
SE
BA
Y
BE
LR
OS
E
MA
NL
Y
NE
WP
OR
T
98%-100%
95%-98%
93%-95%
90%-93%
88%-90%
85%-88%
83%-85%
80%-83%
78%-80%
75%-78%
73%-75%
70%-73%
68%-70%
65%-68%
63%-65%
60%-63%
0:00
2:00
4:00
6:00
8:00
10:00
12:00
14:00
16:00
18:00
20:00
22:00
0:00
CIT
Y N
OR
TH
SU
RR
Y H
ILL
S
DA
LL
EY
ST
MIL
PE
RR
A
ZE
TL
AN
D
CR
OW
S N
ES
T
CA
ST
LE
CO
VE
ST
. P
ET
ER
S
PA
DS
TO
W
FL
EM
ING
TO
N
MA
TR
AV
ILL
E
CH
AT
SW
OO
D
CA
RL
TO
N
DO
UB
LE
BA
Y
PU
NC
HB
OW
L
KIR
RA
WE
E
HU
RS
TV
ILL
E N
TH
HO
RN
SB
Y
EP
PIN
G
MIR
AN
DA
VA
LE
S P
OIN
T
CA
MP
SIE
EN
FIE
LD
WO
Y W
OY
BL
AK
EH
UR
ST
AV
OC
A
UM
INA
RE
VE
SB
Y
TU
RR
AM
UR
RA
JA
NN
AL
I
BE
LR
OS
E
DE
E W
HY
_W
ES
T
98%-100%
95%-98%
93%-95%
90%-93%
88%-90%
85%-88%
83%-85%
80%-83%
78%-80%
75%-78%
73%-75%
70%-73%
68%-70%
65%-68%
63%-65%
60%-63%
Winter Summer
• More variability in summer peak demand load profiles for individual zone substations
• Summer peak demand generally occurs for a longer period of time during the day
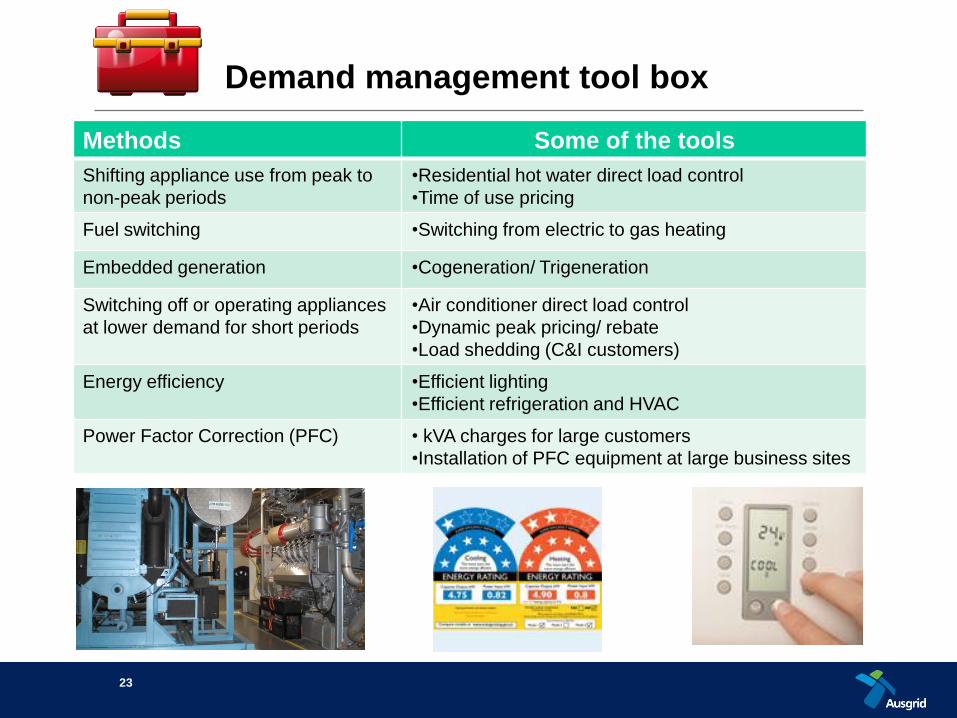
Demand management tool box
Methods Some of the tools
Shifting appliance use from peak to
non-peak periods
•Residential hot water direct load control
•Time of use pricing
Fuel switching •Switching from electric to gas heating
Embedded generation •Cogeneration/ Trigeneration
Switching off or operating appliances
at lower demand for short periods
•Air conditioner direct load control
•Dynamic peak pricing/ rebate
•Load shedding (C&I customers)
Energy efficiency •Efficient lighting
•Efficient refrigeration and HVAC
Power Factor Correction (PFC) • kVA charges for large customers
•Installation of PFC equipment at large business sites
23
Summary
1. Energy and peak demand have different characteristics
2. Main drivers for electricity demand; Time of day, season, weather and day type
3. Around half of system summer peak from residential and small business
4. Residential load changes the most between peak and non-peak days
5. Peak demand growth on network assets is a key investment driver
6. The diversity of network asset loads is influenced by location and customers
7. A tool box of strategies needed for demand management