Embed Size (px)
Citation preview
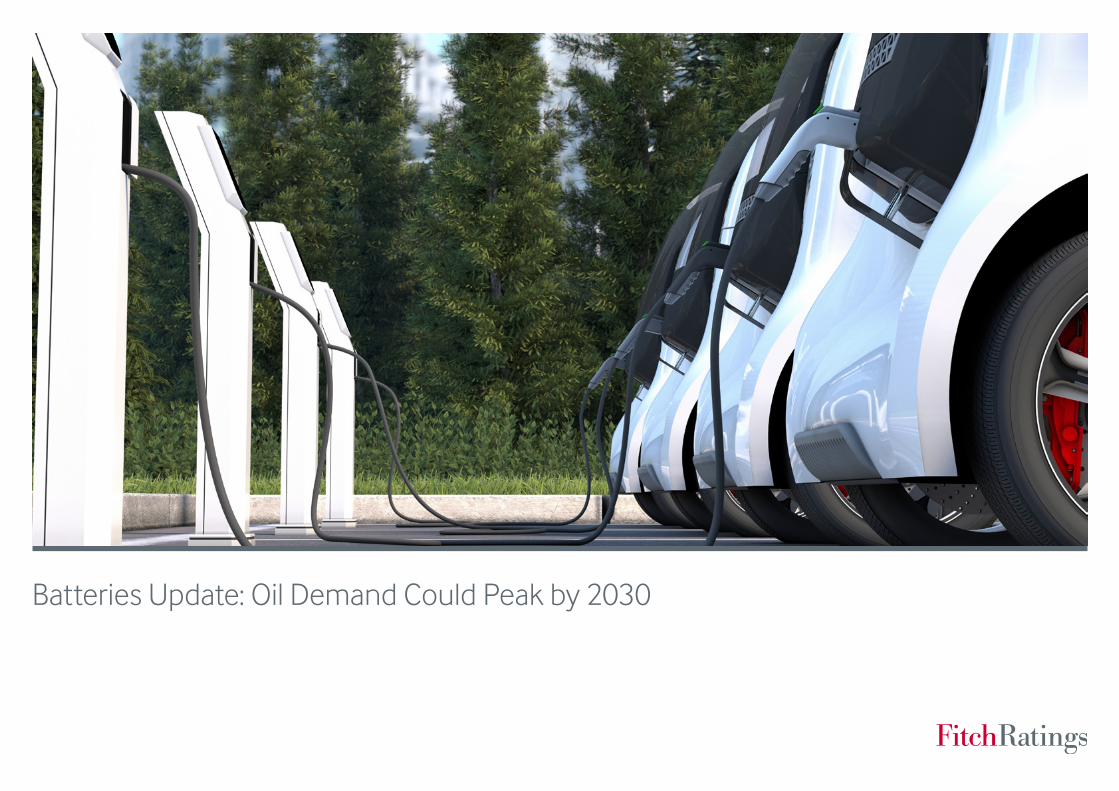
Batteries Update: Oil Demand Could Peak by 2030

2www.fitchratings.com | February 2018
Batteries Update: Oil Demand Could Peak by 2030
Developments over the last year suggest that annual sales of 10 million battery-powered electric vehicles (EVs) by 2025 are entirely achievable, based on manufacturers’ targets, public policy announcements and continued improvements in technology. This puts adoption above the “extreme thought experiment” we presented in our inaugural batteries report 15 months ago, a case which if followed could see oil demand peak in 2029. At end-2017 the oil and gas sector accounted for just over USD2 trillion of corporate bonds outstanding, with roughly 15% of this – or USD300 billion – maturing in 15 years or more.
To be clear this is not our base case – but it has moved from being highly unlikely in our estimation to being one of a number of plausible outcomes.
Tracking the more extreme scenario would require just under 10 million EVs sold each year by 2025, making up 9% of global auto sales. It would also require continued growth in sales of 33% per annum to 2030, leaving sales just shy of 40 million a year. This is admittedly aggressive – but based on the assumption EVs are by this stage at least comparable on a cost and performance basis with internal combustion engine (ICE) vehicles, and retain an environmentally friendly cache, not wholly improbable.
This scenario does not spell the end of oil by any means – the deceleration is very shallow. Even assuming that by 2035 all new cars sold are electric, as much oil is sold in 2040 as in 2015. But, as we have noted previously, an oil market which has gone ex-growth poses problems in a market which, over the last three years’ price crash, has shown almost no signs of an organic supply response. Recovering from future downturns could be even more protracted pointing to lower and more volatile oil prices. This
slow deceleration assumes a fairly benign outturn for mankind’s use of oil in petrochemicals, road freight, and shipping in line with the International Energy Agency’s (IEA) New Policies Scenario.
The acceleration in expectations reflects more than just the increased interest the EV sector has received in the press in the last year. Other causes include authorities’ need to respond to Paris Climate Change Agreement goals, fallout from the diesel engine emissions scandal, technological developments and the increased availability of models and production facilities, and continued improvements in battery technology. This has led to governments and manufacturers setting clear targets. A simple aggregation of manufacturers’ targets suggests 10 million EV sales by 2025 is entirely achievable.
The extreme scenario sees 1.3 billion EVs on the roads by 2040 – this is above the core assumptions of oil companies such as Exxon and BP, of around 100 million, and forecasters such as the IEA and OPEC which each expect around 250 million in their base scenarios. However, by other comparisons it is not that extreme. The IEA’s Sustainable Development case, for example, puts EVs at 900 million by 2040 (and it is one factor in this scenario contributing to a 24mmbbl/day reduction in oil demand from today). OPEC runs a high EV case of 516 million vehicles, resulting in oil demand plateauing in the mid 2030s at around 108mmbbl/d, versus steady growth to 2040 in its base case.
Furthermore, if we were to simply assume that 90% of the car fleet in India and China, which account for the bulk of car fleet growth over the period, were electric, and take 10% elsewhere, then we are already at 600 million by 2040.
EV Adoption May See Oil Demand Peak by 2030
“A simple aggregation of manufacturers’ targets suggests 10 million EV sales by 2025 is entirely achievable.”
Contents
EV Adoption May See Oil Demand Peak by 2030
2
Overview- Sectors Affected by Battery Transition
3
Forecasts for EV Adoption have Accelerated
4
Extreme Thought Experiment for Adoption Becomes Plausible
5
Scaling EV Adoption’s Impact on Oil Demand
7
Passenger Vehicles Only Part of Story 9
Battery Materials Constraints Probably Surmountable
10
10 Years in Power and Renewables - A Decade of Phenomenal Growth in Renewables October 2017 European Automotive Manufacturers Handbook October 2017
What Investors Want to Know - German Integrated Utilities September 2017
China New Energy Vehicle Blue Book - Government Policy Drives Market Development July 2017
Disruptive Technology: Batteries October 2016
ESG Risk
Related Research
3www.fitchratings.com | February 2018
Batteries Update: Oil Demand Could Peak by 2030
Overview- Sectors Affected by Battery Transition
Oil (USD2,054bn)
Renewables
Automotive (USD 662bn)
Generation (USD547bn)
Utilities (USD 1,588bn)
Sectors Affected and Debt Capital Markets Issuance Outstanding
Source: Fitch, Bloomberg. Bubble size represents outstanding debt capital markets issuance. * Renewables illustrative only
Threat O
pportunity
Limited Disruption High Disruption
Auto Parts(USD121bn)
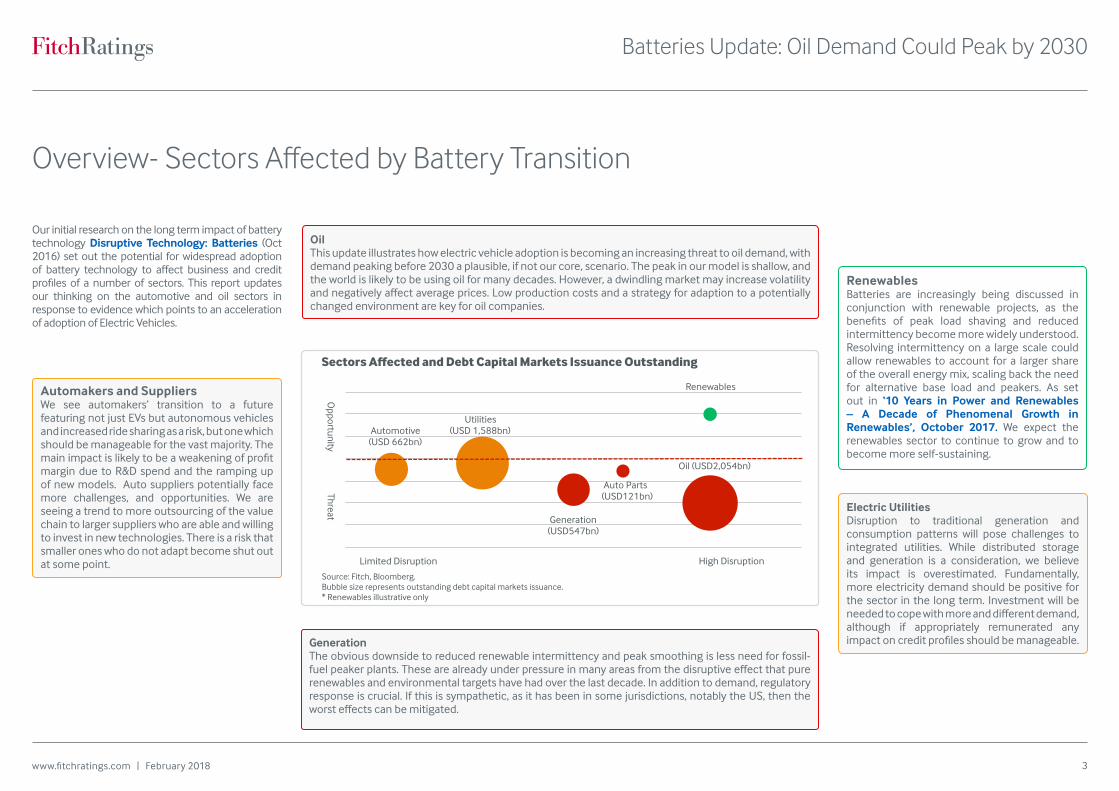
Automakers and Suppliers We see automakers’ transition to a future featuring not just EVs but autonomous vehicles and increased ride sharing as a risk, but one which should be manageable for the vast majority. The main impact is likely to be a weakening of profit margin due to R&D spend and the ramping up of new models. Auto suppliers potentially face more challenges, and opportunities. We are seeing a trend to more outsourcing of the value chain to larger suppliers who are able and willing to invest in new technologies. There is a risk that smaller ones who do not adapt become shut out at some point.
GenerationThe obvious downside to reduced renewable intermittency and peak smoothing is less need for fossil-fuel peaker plants. These are already under pressure in many areas from the disruptive effect that pure renewables and environmental targets have had over the last decade. In addition to demand, regulatory response is crucial. If this is sympathetic, as it has been in some jurisdictions, notably the US, then the worst effects can be mitigated.
Electric UtilitiesDisruption to traditional generation and consumption patterns will pose challenges to integrated utilities. While distributed storage and generation is a consideration, we believe its impact is overestimated. Fundamentally, more electricity demand should be positive for the sector in the long term. Investment will be needed to cope with more and different demand, although if appropriately remunerated any impact on credit profiles should be manageable.
Oil This update illustrates how electric vehicle adoption is becoming an increasing threat to oil demand, with demand peaking before 2030 a plausible, if not our core, scenario. The peak in our model is shallow, and the world is likely to be using oil for many decades. However, a dwindling market may increase volatility and negatively affect average prices. Low production costs and a strategy for adaption to a potentially changed environment are key for oil companies.
RenewablesBatteries are increasingly being discussed in conjunction with renewable projects, as the benefits of peak load shaving and reduced intermittency become more widely understood. Resolving intermittency on a large scale could allow renewables to account for a larger share of the overall energy mix, scaling back the need for alternative base load and peakers. As set out in ‘10 Years in Power and Renewables – A Decade of Phenomenal Growth in Renewables’, October 2017. We expect the renewables sector to continue to grow and to become more self-sustaining.
Our initial research on the long term impact of battery technology Disruptive Technology: Batteries (Oct 2016) set out the potential for widespread adoption of battery technology to affect business and credit profiles of a number of sectors. This report updates our thinking on the automotive and oil sectors in response to evidence which points to an acceleration of adoption of Electric Vehicles.
4www.fitchratings.com | February 2018
Batteries Update: Oil Demand Could Peak by 2030
Forecasts for EV Adoption have Accelerated
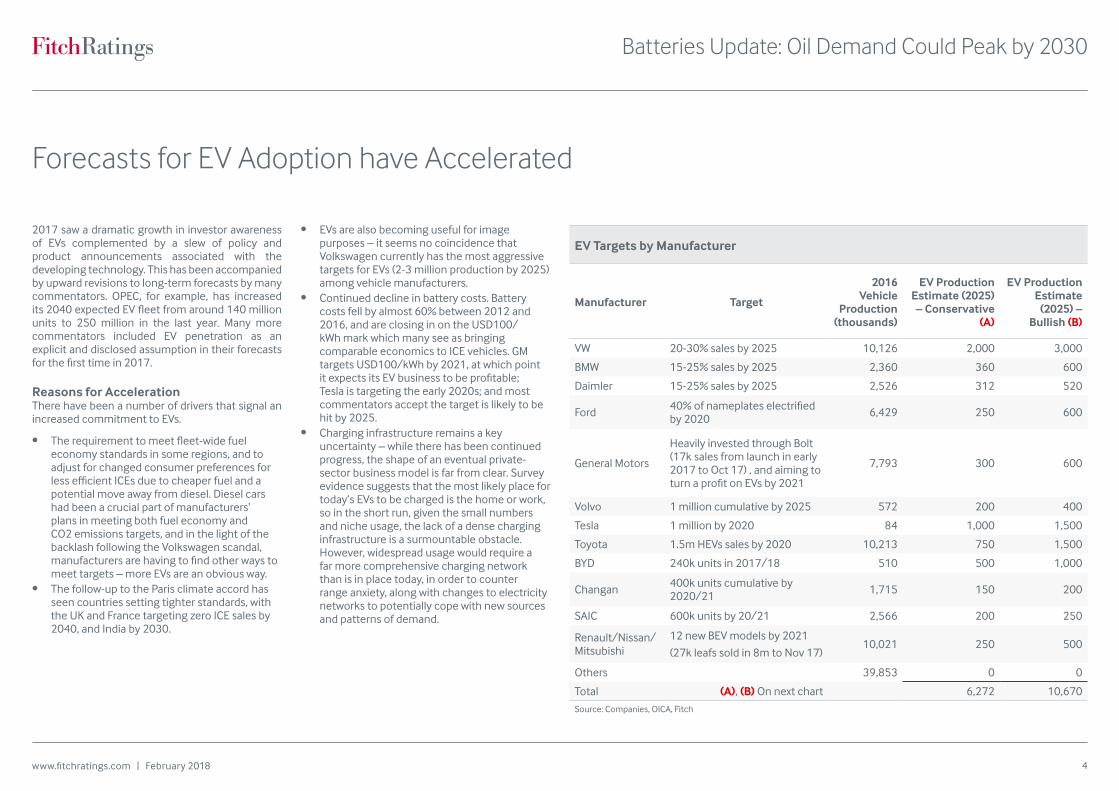
2017 saw a dramatic growth in investor awareness of EVs complemented by a slew of policy and product announcements associated with the developing technology. This has been accompanied by upward revisions to long-term forecasts by many commentators. OPEC, for example, has increased its 2040 expected EV fleet from around 140 million units to 250 million in the last year. Many more commentators included EV penetration as an explicit and disclosed assumption in their forecasts for the first time in 2017.
Reasons for AccelerationThere have been a number of drivers that signal an increased commitment to EVs.
• The requirement to meet fleet-wide fuel economy standards in some regions, and to adjust for changed consumer preferences for less efficient ICEs due to cheaper fuel and a potential move away from diesel. Diesel cars had been a crucial part of manufacturers’ plans in meeting both fuel economy and CO2 emissions targets, and in the light of the backlash following the Volkswagen scandal, manufacturers are having to find other ways to meet targets – more EVs are an obvious way.
• The follow-up to the Paris climate accord has seen countries setting tighter standards, with the UK and France targeting zero ICE sales by 2040, and India by 2030.
• EVs are also becoming useful for image purposes – it seems no coincidence that Volkswagen currently has the most aggressive targets for EVs (2-3 million production by 2025) among vehicle manufacturers.
• Continued decline in battery costs. Battery costs fell by almost 60% between 2012 and 2016, and are closing in on the USD100/kWh mark which many see as bringing comparable economics to ICE vehicles. GM targets USD100/kWh by 2021, at which point it expects its EV business to be profitable; Tesla is targeting the early 2020s; and most commentators accept the target is likely to be hit by 2025.
• Charging infrastructure remains a key uncertainty – while there has been continued progress, the shape of an eventual private-sector business model is far from clear. Survey evidence suggests that the most likely place for today’s EVs to be charged is the home or work, so in the short run, given the small numbers and niche usage, the lack of a dense charging infrastructure is a surmountable obstacle. However, widespread usage would require a far more comprehensive charging network than is in place today, in order to counter range anxiety, along with changes to electricity networks to potentially cope with new sources and patterns of demand.
EV Targets by Manufacturer
Manufacturer Target
2016 Vehicle
Production (thousands)
EV Production Estimate (2025) – Conservative
(A)
EV Production Estimate
(2025) – Bullish (B)
VW 20-30% sales by 2025 10,126 2,000 3,000
BMW 15-25% sales by 2025 2,360 360 600
Daimler 15-25% sales by 2025 2,526 312 520
Ford 40% of nameplates electrified by 2020 6,429 250 600
General Motors
Heavily invested through Bolt (17k sales from launch in early 2017 to Oct 17) , and aiming to turn a profit on EVs by 2021
7,793 300 600
Volvo 1 million cumulative by 2025 572 200 400
Tesla 1 million by 2020 84 1,000 1,500
Toyota 1.5m HEVs sales by 2020 10,213 750 1,500
BYD 240k units in 2017/18 510 500 1,000
Changan 400k units cumulative by 2020/21 1,715 150 200
SAIC 600k units by 20/21 2,566 200 250
Renault/Nissan/Mitsubishi
12 new BEV models by 2021
(27k leafs sold in 8m to Nov 17)10,021 250 500
Others 39,853 0 0
Total (A), (B) On next chart 6,272 10,670
Source: Companies, OICA, Fitch
5www.fitchratings.com | February 2018
Batteries Update: Oil Demand Could Peak by 2030
0%
20%
40%
60%
80%
100%
120%
0 200,000 400,000 600,000 800,000
1,000,000 1,200,000 1,400,000 1,600,000 1,800,000
2015
20
16
2017
20
18
2019
20
20
2021
20
22
2023
20
24
2025
20
26
2027
20
28
2029
20
30
2031
20
32
2033
20
34
2035
20
36
2037
20
38
2039
20
40
Light Vehicle Fleet ('000s)
Manufacturers' Announcements on or Above 'Extreme Case' Extreme Case: 33% CAGR in Sales
ICE (LHS) Electric (LHS)
Electric Car Sales as % Total (RHS)
Source: Fitch. A and B represent conservative and bullish estimates of 2025EV sales based on manufacurers' announcements.
. A B
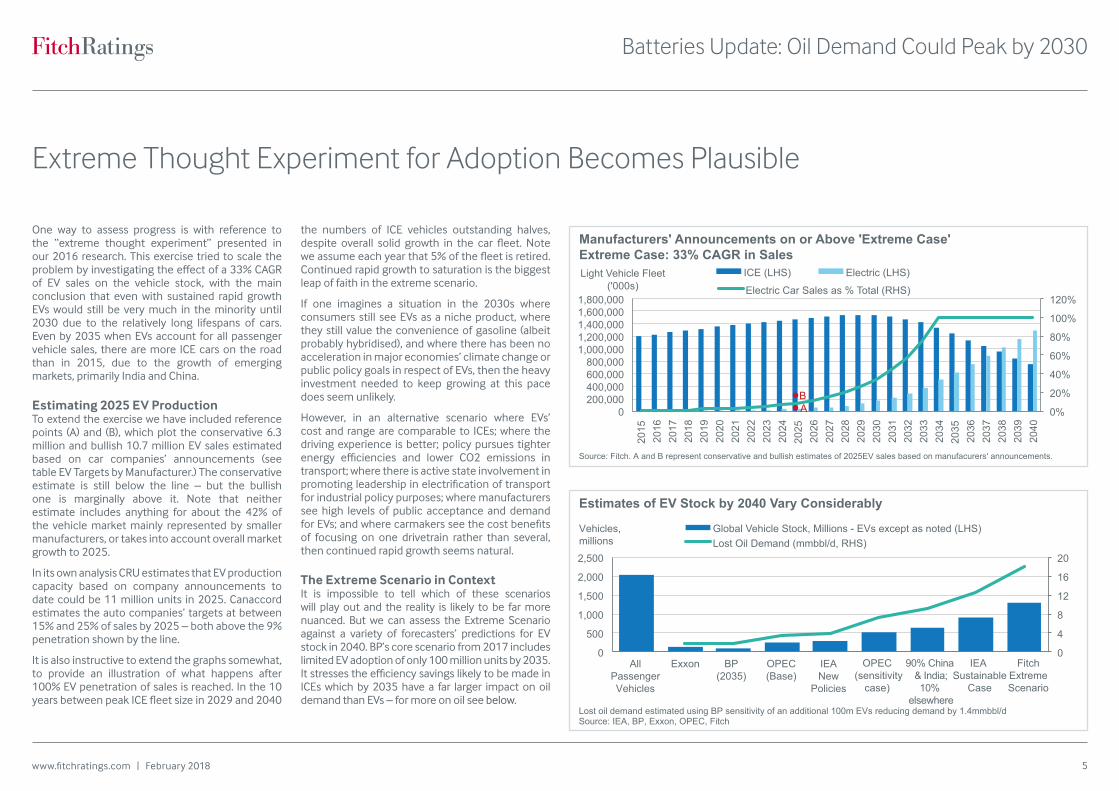
One way to assess progress is with reference to the “extreme thought experiment” presented in our 2016 research. This exercise tried to scale the problem by investigating the effect of a 33% CAGR of EV sales on the vehicle stock, with the main conclusion that even with sustained rapid growth EVs would still be very much in the minority until 2030 due to the relatively long lifespans of cars. Even by 2035 when EVs account for all passenger vehicle sales, there are more ICE cars on the road than in 2015, due to the growth of emerging markets, primarily India and China.
Estimating 2025 EV ProductionTo extend the exercise we have included reference points (A) and (B), which plot the conservative 6.3 million and bullish 10.7 million EV sales estimated based on car companies’ announcements (see table EV Targets by Manufacturer.) The conservative estimate is still below the line – but the bullish one is marginally above it. Note that neither estimate includes anything for about the 42% of the vehicle market mainly represented by smaller manufacturers, or takes into account overall market growth to 2025.
In its own analysis CRU estimates that EV production capacity based on company announcements to date could be 11 million units in 2025. Canaccord estimates the auto companies’ targets at between 15% and 25% of sales by 2025 – both above the 9% penetration shown by the line.
It is also instructive to extend the graphs somewhat, to provide an illustration of what happens after 100% EV penetration of sales is reached. In the 10 years between peak ICE fleet size in 2029 and 2040
the numbers of ICE vehicles outstanding halves, despite overall solid growth in the car fleet. Note we assume each year that 5% of the fleet is retired. Continued rapid growth to saturation is the biggest leap of faith in the extreme scenario.
If one imagines a situation in the 2030s where consumers still see EVs as a niche product, where they still value the convenience of gasoline (albeit probably hybridised), and where there has been no acceleration in major economies’ climate change or public policy goals in respect of EVs, then the heavy investment needed to keep growing at this pace does seem unlikely.
However, in an alternative scenario where EVs’ cost and range are comparable to ICEs; where the driving experience is better; policy pursues tighter energy efficiencies and lower CO2 emissions in transport; where there is active state involvement in promoting leadership in electrification of transport for industrial policy purposes; where manufacturers see high levels of public acceptance and demand for EVs; and where carmakers see the cost benefits of focusing on one drivetrain rather than several, then continued rapid growth seems natural.
The Extreme Scenario in ContextIt is impossible to tell which of these scenarios will play out and the reality is likely to be far more nuanced. But we can assess the Extreme Scenario against a variety of forecasters’ predictions for EV stock in 2040. BP’s core scenario from 2017 includes limited EV adoption of only 100 million units by 2035. It stresses the efficiency savings likely to be made in ICEs which by 2035 have a far larger impact on oil demand than EVs – for more on oil see below.
0
4
8
12
16
20
0
500
1,000
1,500
2,000
2,500
All Passenger Vehicles
Vehicles,millions
Exxon BP (2035)
OPEC (Base)
IEA New
Policies
OPEC (sensitivity
case)
90% China & India;10%
elsewhere
IEA Sustainable
Case
FitchExtremeScenario
Estimates of EV Stock by 2040 Vary Considerably
Global Vehicle Stock, Millions - EVs except as noted (LHS) Lost Oil Demand (mmbbl/d, RHS)
Source: IEA, BP, Exxon, OPEC, Fitch Lost oil demand estimated using BP sensitivity of an additional 100m EVs reducing demand by 1.4mmbbl/d
Extreme Thought Experiment for Adoption Becomes Plausible
6www.fitchratings.com | February 2018
Batteries Update: Oil Demand Could Peak by 2030
The IEA and OPEC core scenarios see the EV fleet at around 250 million passenger vehicles by 2040, more than double BP’s estimate but still just over 10% of total fleet.
Both OPEC and the IEA include more aggressive scenarios – OPEC a sensitivity case based solely on increased EV usage, and the IEA a “Sustainable Development” case where EVs play a large part but where efficiencies are found elsewhere also. The IEA’s case comes close to the “upper bound” with 900 million EVs on the road by 2040.
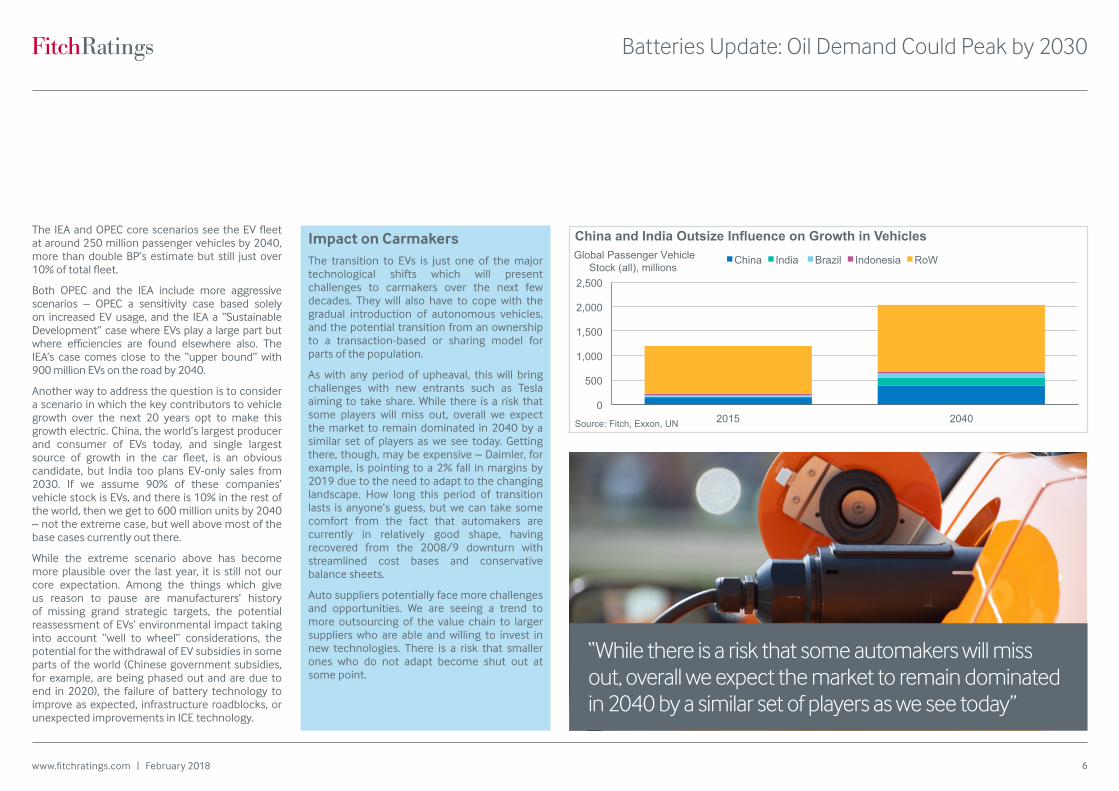
Another way to address the question is to consider a scenario in which the key contributors to vehicle growth over the next 20 years opt to make this growth electric. China, the world’s largest producer and consumer of EVs today, and single largest source of growth in the car fleet, is an obvious candidate, but India too plans EV-only sales from 2030. If we assume 90% of these companies’ vehicle stock is EVs, and there is 10% in the rest of the world, then we get to 600 million units by 2040 – not the extreme case, but well above most of the base cases currently out there.
While the extreme scenario above has become more plausible over the last year, it is still not our core expectation. Among the things which give us reason to pause are manufacturers’ history of missing grand strategic targets, the potential reassessment of EVs’ environmental impact taking into account “well to wheel” considerations, the potential for the withdrawal of EV subsidies in some parts of the world (Chinese government subsidies, for example, are being phased out and are due to end in 2020), the failure of battery technology to improve as expected, infrastructure roadblocks, or unexpected improvements in ICE technology.
Impact on CarmakersThe transition to EVs is just one of the major technological shifts which will present challenges to carmakers over the next few decades. They will also have to cope with the gradual introduction of autonomous vehicles, and the potential transition from an ownership to a transaction-based or sharing model for parts of the population.
As with any period of upheaval, this will bring challenges with new entrants such as Tesla aiming to take share. While there is a risk that some players will miss out, overall we expect the market to remain dominated in 2040 by a similar set of players as we see today. Getting there, though, may be expensive – Daimler, for example, is pointing to a 2% fall in margins by 2019 due to the need to adapt to the changing landscape. How long this period of transition lasts is anyone’s guess, but we can take some comfort from the fact that automakers are currently in relatively good shape, having recovered from the 2008/9 downturn with streamlined cost bases and conservative balance sheets.
Auto suppliers potentially face more challenges and opportunities. We are seeing a trend to more outsourcing of the value chain to larger suppliers who are able and willing to invest in new technologies. There is a risk that smaller ones who do not adapt become shut out at some point.
“While there is a risk that some automakers will miss out, overall we expect the market to remain dominated in 2040 by a similar set of players as we see today”
0
500
1,000
1,500
2,000
2,500
2015 2040
Global Passenger Vehicle Stock (all), millions
China and India Outsize Influence on Growth in Vehicles China India Brazil Indonesia RoW
Source: Fitch, Exxon, UN
7www.fitchratings.com | February 2018
Batteries Update: Oil Demand Could Peak by 2030
- 5
10 15 20 25 30 35
Starting Passenger
Vehicle Demand
Fleet Growth(100%) new
ICE
BEVDisplacement
(no efficiencies)
Fuel Efficiency Offset to
BEV Takeup
Fuel Efficiency (100% ICE)
PassengerVehicle Demand2040
(mb/d)
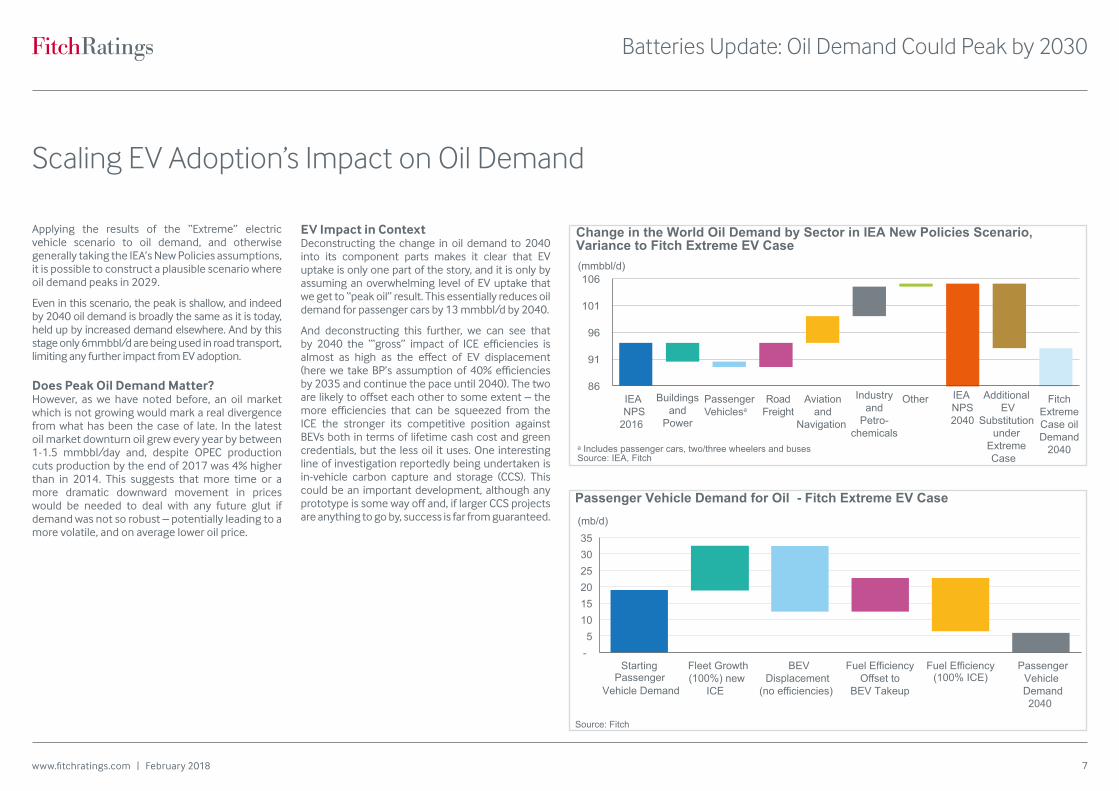
Passenger Vehicle Demand for Oil - Fitch Extreme EV Case
Source: Fitch
86
91
96
101
106
IEA NPS
2016
Buildingsand
Power
PassengerVehiclesa
Aviation and
Navigation
RoadFreight
Other Additional EV
Substitution under
Extreme Case
IEA NPS2040
Industryand
Petro-chemicals
FitchExtremeCase oilDemand
2040
(mmbbl/d)
Change in the World Oil Demand by Sector in IEA New Policies Scenario, Variance to Fitch Extreme EV Case
Includes passenger cars, two/three wheelers and buses Source: IEA, Fitch
Scaling EV Adoption’s Impact on Oil Demand
Applying the results of the “Extreme” electric vehicle scenario to oil demand, and otherwise generally taking the IEA’s New Policies assumptions, it is possible to construct a plausible scenario where oil demand peaks in 2029.
Even in this scenario, the peak is shallow, and indeed by 2040 oil demand is broadly the same as it is today, held up by increased demand elsewhere. And by this stage only 6mmbbl/d are being used in road transport, limiting any further impact from EV adoption.
Does Peak Oil Demand Matter?However, as we have noted before, an oil market which is not growing would mark a real divergence from what has been the case of late. In the latest oil market downturn oil grew every year by between 1-1.5 mmbbl/day and, despite OPEC production cuts production by the end of 2017 was 4% higher than in 2014. This suggests that more time or a more dramatic downward movement in prices would be needed to deal with any future glut if demand was not so robust – potentially leading to a more volatile, and on average lower oil price.
EV Impact in ContextDeconstructing the change in oil demand to 2040 into its component parts makes it clear that EV uptake is only one part of the story, and it is only by assuming an overwhelming level of EV uptake that we get to “peak oil” result. This essentially reduces oil demand for passenger cars by 13 mmbbl/d by 2040.
And deconstructing this further, we can see that by 2040 the ‘“gross” impact of ICE efficiencies is almost as high as the effect of EV displacement (here we take BP’s assumption of 40% efficiencies by 2035 and continue the pace until 2040). The two are likely to offset each other to some extent – the more efficiencies that can be squeezed from the ICE the stronger its competitive position against BEVs both in terms of lifetime cash cost and green credentials, but the less oil it uses. One interesting line of investigation reportedly being undertaken is in-vehicle carbon capture and storage (CCS). This could be an important development, although any prototype is some way off and, if larger CCS projects are anything to go by, success is far from guaranteed.

8www.fitchratings.com | February 2018
Batteries Update: Oil Demand Could Peak by 2030
30 41 43 44 43 33 40 26
8 11 13 16 13
16 10 8
14 17 21 24 21 24 21
22 10
12 12
12 12 12 12
10 14
13 11 10 11 10 11
7
0
20
40
60
80
100
120
2000 2016 2025 NP 2040 NP 2025 Extreme
2040 Extreme
2025 SD 2040 SD
(mmbbl/d)
Oil Demand Under IEA Scenarios and Extreme Stress Road Transport Aviation and Navigation
Industry and Petrochemicals Other Buildings and Power
Source: IEA, Fitch NP = IEA New Policies; SD = IEA Sustainable Development stress case, Exteme = Fitch Extreme Case
Note that in the above EVs include not just full EVs but also plug-in hybrids, on the assumption that these will primarily be bought with the intention that they will mainly be used as electric vehicles, with their ICE as a back-up and range extender. This does provide some potential upside to the oil demand analysis.
Implications for Oil ProducersEven after we have hit peak oil demand, the world will still need to consume vast amounts of oil for decades. However, as we have stated, more volatile and potentially lower prices are likely to make the overall environment financially tougher for oil players, which may be reinforced if the sector falls out of favour with the capital markets and lenders due to profitability or environmental concerns.
Most of the largest players are already taking action – what are thought of as large oil companies in reality often produce as much gas as oil (albeit this tends to be lower margin) and some such as Shell and BP have increased their exposure to gas in recent years. Others such as MOL are diversifying into petrochemicals. Oil majors are also familiarising themselves with alternative energy, as demonstrated by BP’s recent acquisition of a stake in Lightsource, Europe’s largest solar developer, and Total’s previous acquisition of a stake in Eren, the solar and wind energy producer. Depending on the pace of electric vehicle penetration and other developments, over time companies’ approach to the peak demand issue could start to affect ratings.
In terms of today’s ratings, our criteria already take into account cost position which will be key in any market, but especially one where demand becomes more fragile.
90 91 92 93 94 95 96 97 98 99
100
2015 2017 2019 2021 2023 2025 2027 2029 2031 2033 2035 2037 2039
(mmbbl/d)
Oil Demand Peak Under Extreme Scenario
Oil Demand
Source: Fitch
“Even after we have hit peak oil demand, the world will still need to consume vast amounts of oil for decades.”
9www.fitchratings.com | February 2018
Batteries Update: Oil Demand Could Peak by 2030
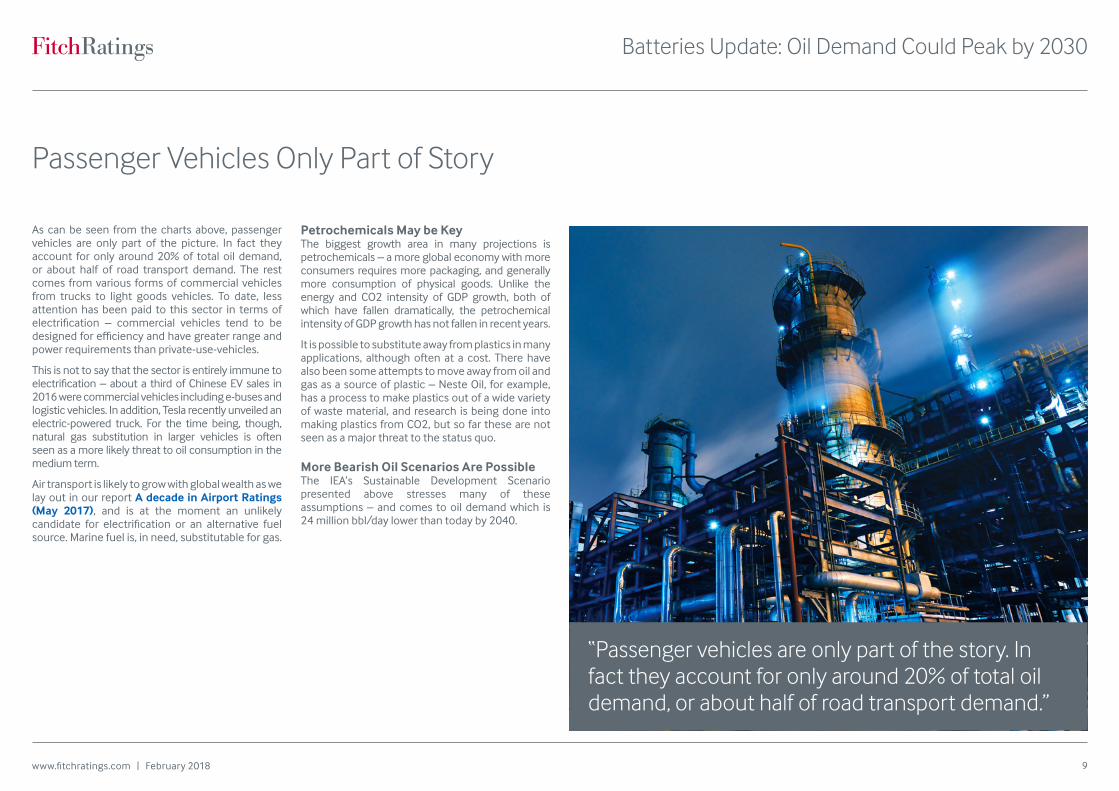
As can be seen from the charts above, passenger vehicles are only part of the picture. In fact they account for only around 20% of total oil demand, or about half of road transport demand. The rest comes from various forms of commercial vehicles from trucks to light goods vehicles. To date, less attention has been paid to this sector in terms of electrification – commercial vehicles tend to be designed for efficiency and have greater range and power requirements than private-use-vehicles.
This is not to say that the sector is entirely immune to electrification – about a third of Chinese EV sales in 2016 were commercial vehicles including e-buses and logistic vehicles. In addition, Tesla recently unveiled an electric-powered truck. For the time being, though, natural gas substitution in larger vehicles is often seen as a more likely threat to oil consumption in the medium term.
Air transport is likely to grow with global wealth as we lay out in our report A decade in Airport Ratings (May 2017), and is at the moment an unlikely candidate for electrification or an alternative fuel source. Marine fuel is, in need, substitutable for gas.
Petrochemicals May be KeyThe biggest growth area in many projections is petrochemicals – a more global economy with more consumers requires more packaging, and generally more consumption of physical goods. Unlike the energy and CO2 intensity of GDP growth, both of which have fallen dramatically, the petrochemical intensity of GDP growth has not fallen in recent years.
It is possible to substitute away from plastics in many applications, although often at a cost. There have also been some attempts to move away from oil and gas as a source of plastic – Neste Oil, for example, has a process to make plastics out of a wide variety of waste material, and research is being done into making plastics from CO2, but so far these are not seen as a major threat to the status quo.
More Bearish Oil Scenarios Are PossibleThe IEA’s Sustainable Development Scenario presented above stresses many of these assumptions – and comes to oil demand which is 24 million bbl/day lower than today by 2040.
“Passenger vehicles are only part of the story. In fact they account for only around 20% of total oil demand, or about half of road transport demand.”
Passenger Vehicles Only Part of Story

10www.fitchratings.com | February 2018
Batteries Update: Oil Demand Could Peak by 2030
In the last year, increasing focus has been given to the content requirements of batteries. A fully electric drivetrain replaces hundreds of separate moving parts with a handful. By far the largest cost of an EV is the battery itself and current batteries rely on what are fairly rare components. Lithium carbonate prices increased from about USD5,000/ton in 2015 to around 12,000/ton by November 2017, and cobalt prices more than doubled in 2017 on an undersupplied market.
A significant part of material costs of lithium-ion batteries, which dominate today’s EV deployments, is accounted for by cobalt, lithium and nickel, with manganese a more minor component (by cost) in some types of batteries. Of these, lithium and cobalt are the most likely to see their production dramatically affected by the increase in battery deployment; manganese and nickel have far broader industrial use.
The most obvious question is whether there is likely to be enough of these commodities to go around. Based on the US Geological survey’s data
which show 57 years of proved reserves of cobalt at current rates of production and 400 years for lithium, this seems likely.
Obviously, increased production due to increased battery demand would reduce these numbers. Albermarle, a major lithium producer, sees a near doubling of global lithium production by 2021 driven mainly by battery needs, still leaving a 200 year reserve life. Cobalt’s rise, based on CRU data is around a third by the same date, leaving a 42 year reserve life.
So in the short term it is not resources in the ground that are a constraint but production, and this is a problem which will be solved in time given appropriate price signals. Indeed, there is already evidence of production increasing. One problem, however, is where the reserves are concentrated. For cobalt the largest concentration, and current source of production, is the Democratic Republic of Congo (DRC). While the lithium story is better, with many of the lithium-containing brines in a region on the Argentina/Chile border, these operations have been known to experience more down time than
more traditional mines.
CRU has among the most comprehensive models of both lithium and cobalt demand, and broadly supports the view that significant further price appreciation will be moderated by supply increases. CRU forecasts that lithium will see a dramatic peak in 2017/18, with prices falling by 25% by the early 2020s with a gradual appreciation thereafter. As more supply comes online, CRU also sees 2018 as a peak year for cobalt prices, albeit a more modest peak, with moderation later in the year following the ramping up of Glencore’s Katanga mine in DRC. They expect prices to average around USD28/lb, a touch above 2017 prices, until 2025.
CRU estimates that at 2017 prices the cobalt and lithium content of a Tesla Model S with a 100kWh Nickel Cobalt aluminium (NCA) battery is USD800
and USD1,200 respectively; and for a BMW i3 with a 33kWh Nickel Manganese Cobalt (NMC) battery USD662 and USD522 respectively. So, put simply, even a doubling of both prices from 2017 would not have that great an impact in terms of percentage of price (the Tesla sells, very broadly at around USD100,000; the BMW USD50,000). However, in the quest to bring parity with ICE vehicles an extra couple of thousand dollars makes the case against electric a little stronger – particularly for more mass-market models which will need to proliferate in the Extreme Case.
As noted above, it is also possible to vary battery chemistry considerably, and many companies are trying to reduce the amount of cobalt in particular in their batteries. GM, which is targeting USD100/kWh for its batteries by 2021, is using a proprietary chemistry which reportedly does just this.
Battery Materials Constraints Probably Surmountable
Production and Reserves of Key Battery Minerals
Production Reserves Resources Use
Lithium (Tons) 35,000 14,000,000 46,900,000 39% Batteries, 30% Ceramics and glass
Cobalt (Tons) 123,000 7,000,000 25,000,000 50% Batteries, 25% alloys and metals
Source: US Geological survey. Figures for 2016.
DRC 49%
Australia 14%
Cuba7%
Other 30%
Global Reserves of Cobalt
Source: US Geoogical Survey, 2016
Argentina 14%
Australia 11%
Chile 52%
China 22%
Other 1%
Global Reserves of Lithium
Source: US Geoogical Survey, 2016

11www.fitchratings.com | February 2018
Batteries Update: Oil Demand Could Peak by 2030
ALL FITCH CREDIT RATINGS ARE SUBJECT TO CERTAIN LIMITATIONS AND DISCLAIMERS. PLEASE READ THESE LIMITATIONS AND DISCLAIMERS BY FOLLOWING THIS LINK: HTTPS://WWW.FITCHRATINGS.COM/SITE/DEFINITIONS?RD_FILE=INTRO. IN ADDITION, RATING DEFINITIONS AND THE TERMS OF USE OF SUCH RATINGS ARE AVAILABLE ON THE AGENCY’S PUBLIC WEB SITE AT WWW.FITCHRATINGS.COM. PUBLISHED RATINGS, CRITERIA, AND METHODOLOGIES ARE AVAILABLE FROM THIS SITE AT ALL TIMES. FITCH’S CODE OF CONDUCT, CONFIDENTIALITY, CONFLICTS OF INTEREST, AFFILIATE FIREWALL, COMPLIANCE, AND OTHER RELEVANT POLICIES AND PROCEDURES ARE ALSO AVAILABLE FROM THE CODE OF CONDUCT SECTION OF THIS SITE. FITCH MAY HAVE PROVIDED ANOTHER PERMISSIBLE SERVICE TO THE RATED ENTITY OR ITS RELATED THIRD PARTIES. DETAILS OF THIS SERVICE FOR RATINGS FOR WHICH THE LEAD ANALYST IS BASED IN AN EU-REGISTERED ENTITY CAN BE FOUND ON THE ENTITY SUMMARY PAGE FOR THIS ISSUER ON THE FITCH WEBSITE. Copyright © 2018 by Fitch Ratings, Inc., Fitch Ratings Ltd. and its subsidiaries. 33 Whitehall Street, NY 10004. Telephone: 1-800-753-4824, (212) 908-0500. Fax: (212) 480-4435. Reproduction or retransmission in whole or in part is prohibited except by permission. All rights reserved. In issuing and maintaining its ratings and in making other reports (including forecast information), Fitch relies on factual information it receives from issuers and underwriters and from other sources Fitch believes to be credible. Fitch conducts a reasonable investigation of the factual information relied upon by it in accordance with its ratings methodology, and obtains reasonable verification of that information from independent sources, to the extent such sources are available for a given security or in a given jurisdiction. The manner of Fitch’s factual investigation and the scope of the third-party verification it obtains will vary depending on the nature of the rated security and its issuer, the requirements and practices in the jurisdiction in which the rated security is offered and sold and/or the issuer is located, the availability and nature of relevant public information, access to the management of the issuer and its advisers, the availability of pre-existing third-party verifications such as audit reports, agreed-upon procedures letters, appraisals, actuarial reports, engineering reports, legal opinions and other reports provided by third parties, the availability of independent and competent third-party verification sources with respect to the particular security or in the particular jurisdiction of the issuer, and a variety of other factors. Users of Fitch’s ratings and reports should understand that neither an enhanced factual investigation nor any third-party verification can ensure that all of the information Fitch relies on in connection with a rating or a report will be accurate and complete. Ultimately, the issuer and its advisers are responsible for the accuracy of the information they provide to Fitch and to the market in offering documents and other reports. In issuing its ratings and its reports, Fitch must rely on the work of experts, including independent auditors with respect to financial statements and attorneys with respect to legal and tax matters. Further, ratings and forecasts of financial and other information are inherently forward-looking and embody assumptions and predictions about future events that by their nature cannot be verified as facts. As a result, despite any verification of current facts, ratings and forecasts can be affected by future events or conditions that were not anticipated at the time a rating or forecast was issued or affirmed. The information in this report is provided “as is” without any representation or warranty of any kind, and Fitch does not represent or warrant that the report or any of its contents will meet any of the requirements of a recipient of the report. A Fitch rating is an opinion as to the creditworthiness of a security. This opinion and reports made by Fitch are based on established criteria and methodologies that Fitch is continuously evaluating and updating. Therefore, ratings and reports are the collective work product of Fitch and no individual, or group of individuals, is solely responsible for a rating or a report. The rating does not address the risk of loss due to risks other than credit risk, unless such risk is specifically mentioned. Fitch is not engaged in the offer or sale of any security. All Fitch reports have shared authorship. Individuals identified in a Fitch report were involved in, but are not solely responsible for, the opinions stated therein. The individuals are named for contact purposes only. A report providing a Fitch rating is neither a prospectus nor a substitute for the information assembled, verified and presented to investors by the issuer and its agents in connection with the sale of the securities. Ratings may be changed or withdrawn at any time for any reason in the sole discretion of Fitch. Fitch does not provide investment advice of any sort. Ratings are not a recommendation to buy, sell, or hold any security. Ratings do not comment on the adequacy of market price, the suitability of any security for a particular investor, or the tax-exempt nature or taxability of payments made in respect to any security. Fitch receives fees from issuers, insurers, guarantors, other obligors, and underwriters for rating securities. Such fees generally vary from US$1,000 to US$750,000 (or the applicable currency equivalent) per issue. In certain cases, Fitch will rate all or a number of issues issued by a particular issuer, or insured or guaranteed by a particular insurer or guarantor, for a single annual fee. Such fees are expected to vary from US$10,000 to US$1,500,000 (or the applicable currency equivalent). The assignment, publication, or dissemination of a rating by Fitch shall not constitute a consent by Fitch to use its name as an expert in connection with any registration statement filed under the United States securities laws, the Financial Services and Markets Act of 2000 of the United Kingdom, or the securities laws of any particular jurisdiction. Due to the relative efficiency of electronic publishing and distribution, Fitch research may be available to electronic subscribers up to three days earlier than to print subscribers. For Australia, New Zealand, Taiwan and South Korea only: Fitch Australia Pty Ltd holds an Australian financial services license (AFS license no. 337123) which authorizes it to provide credit ratings to wholesale clients only. Credit ratings information published by Fitch is not intended to be used by persons who are retail clients within the meaning of the Corporations Act 2001. DC-129
Alex Griffiths +44 20 3530 1709 [email protected]
Stephen Brown (Autos) + 1 312 368 3139 [email protected]
Ying Wang (Oil and Gas, China Research) +86 21 5097 3010 [email protected]
Ian Dixon (Renewables) +44 203 530 1815 [email protected]
Peter Archbold (Natural Resources) +44 20 3530 1172 [email protected]
Emmanuel Bulle (Autos) +34 93 323 8411 [email protected]
Analysts

New York33 Whitehall Street New York, NY 10004 +1 212 908 0500 +1 800 75 FITCH
London30 North Colonnade Canary Wharf London E14 5GN +44 20 3530 1000
Fitch Ratings www.fitchratings.com Fitch Solutions www.fitchsolutions.com
Fitch Group