Embed Size (px)
Citation preview

Small Scale Testing within a
Correlative Multi-scale Framework
Phil Withers, Joao Fonseca & Bart Winiarski & Tim Burnett
Henry Moseley X-ray Imaging
Facility,
BP International Centre for
Advanced Materials,
University of Manchester
& Research Complex at Harwell
NPL-EPSRC Fellow & FEI
Research Fellows, University
of Manchester

These tasks are often poorly connected
Materials Design Challenge
Microstructure
Performance, Degradation
Chemistry Processing
Chemistry
lab
Materials
testing lab Microscopy
lab
Processing
lab

Materials Science Challenge
To design better high performance materials we need to:
• Identify the critical length and time scales
• Bring multimodal information to bear on RoI
• Spatially correlate information at different scales
m mm μm nm Atomic
10-10 10-9 10-6 10-3 100
Optical
Microscopy X-ray
Tomography
S/TEM SEM

Consider degradation by creep cavitation
e.g. boiler spine in a nuclear reactor
• Stainless steel component
• Combination of high temperature and residual
stress local to a weld
• Creep cavitation cracking can be life limiting
Weld Creep
cavitation
crack

Macro CT MicroCT Serial Sectioning FIB-SEM TEM
Millimeter Micrometer Nanometer Atomic
Cavity coalescence Critical cavities
GB sliding Cavity nucleation
Point defects GB segregation
EBSD
Macroscale Cracks
SEM SEM
Dislocations
Meter
100 10-3 10-6 10-9 10-10
Cavity nucleation
Optical Microscopy
Nanometer
10-9 10-8 10-7 10-5 10-4
Creep starts at the
atomic scale
Creep advances to
the nanoscale
Creep advances to
the microscale Creep ends at the
macroscale
Usually the different scales at which creep occurs are studied using
different instruments on different samples in an unconnected way

Large scale imaging
Can image 1-2m components and structures

Micron resolution lab. x-ray imaging
• Can image 1micron scale

Nanoscale lab. x-ray imaging
• Can image 50nm scale
Corrosion
Intermetallic
Sensitive teeth - toothpaste
Fossilised spider
Corrosion

Ultra high resolution imaging and chemistry
Overlay 3D atom probe map
and STEM image of pearlitic
steel: GB2, (Σ3 coherent twin)
shows much lower C
segregation than average
grain boundary[Herbig, Raabe
et al PRL 2014]
Atomic resolution elemental
map of SrTiO3 crystal by Super
X EDS on Titan 80-300
Aberration Corrected STEM
[NC State Univ]
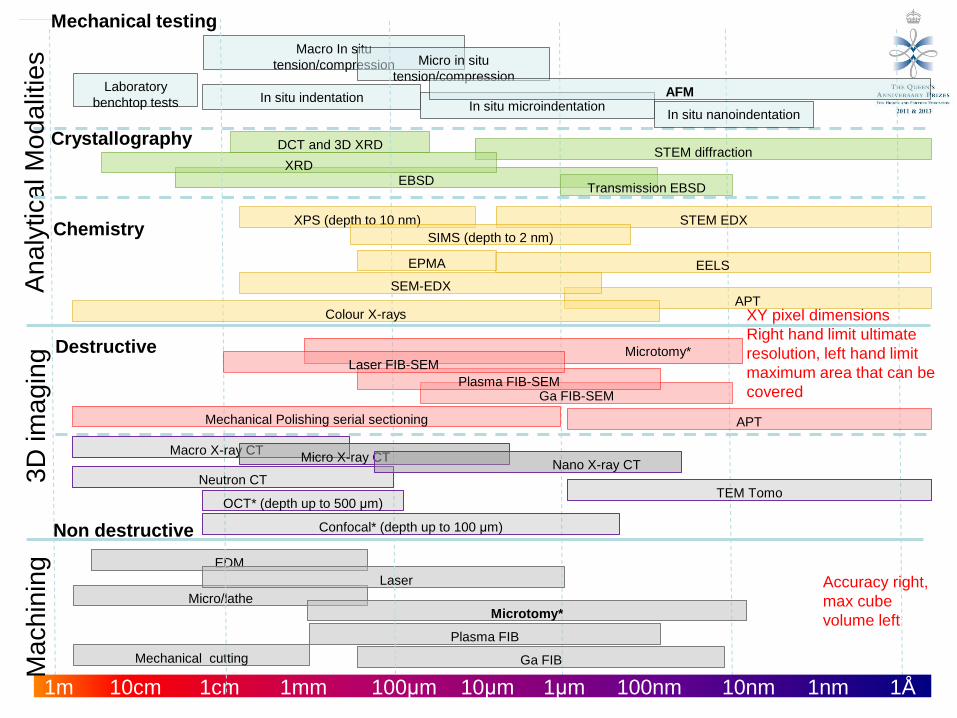
1m 1mm 1nm 1μm
Crystallography STEM diffraction
EBSD XRD
DCT and 3D XRD
Transmission EBSD
Ma
ch
inin
g
EDM
Mechanical cutting
Micro/lathe
Laser
Plasma FIB
Ga FIB
Accuracy right,
max cube
volume left Microtomy*
Mechanical testing
Laboratory
benchtop tests
Macro In situ
tension/compression
In situ indentation
Micro in situ
tension/compression
In situ microindentation In situ nanoindentation
AFM
1cm 10nm 10μm 10cm 100nm 100μm 1Å
Non destructive
Macro X-ray CT
TEM Tomo
Confocal* (depth up to 100 μm)
OCT* (depth up to 500 μm)
Neutron CT
Micro X-ray CT Nano X-ray CT
An
aly
tica
l M
od
alit
ies
Chemistry
APT SEM-EDX
EELS
STEM EDX XPS (depth to 10 nm)
SIMS (depth to 2 nm)
EPMA
Colour X-rays XY pixel dimensions
Right hand limit ultimate
resolution, left hand limit
maximum area that can be
covered
3D
im
ag
ing
Ga FIB-SEM
APT
Plasma FIB-SEM
Mechanical Polishing serial sectioning
Destructive Microtomy* Laser FIB-SEM

To see the value of a correlative
multiscale framework lets consider
pitting corrosion of a stainless
steel wire

Connecting timescales: Macroscale
X-ray CT
• Time lapse images show nucleation and growth of
corrosion pits
• Identification of the fastest or slowest growing pits
But we need to better characterize the pit morphology….
Sample immersed in Chloride Solution and polarized
200mm
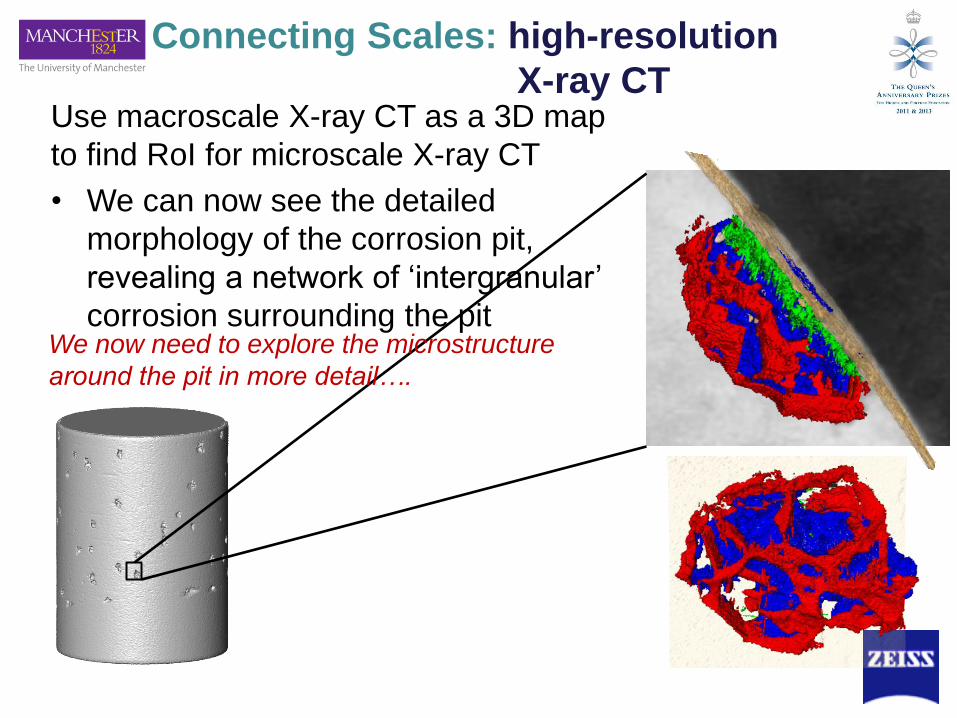
Connecting Scales: high-resolution
X-ray CT Use macroscale X-ray CT as a 3D map
to find RoI for microscale X-ray CT
• We can now see the detailed
morphology of the corrosion pit,
revealing a network of ‘intergranular’
corrosion surrounding the pit We now need to explore the microstructure
around the pit in more detail….

Correlative Tomography: Linking X-ray
CT to SEM
Manually register the surface as rendered from X-ray CT to
the SEM image to locate periphery of pit obscured by a
lacy cover:
Be
fore
Aft
er
100mm

Correlative Tomography: FIB-SEM serial
sectioning
3D analysis at the nanoscale using Slice and View
• Destructive but very high resolution and SEM imaging
reveals contrast from grain boundaries
• Characterize the shape, extent and direction of the
corrosion fronts
But we need to understand the crystallography to identify
the corrosion fronts….

Connecting Modalities: Crystallography
Electron backscatter diffraction has enabled analysis of the
crystallography around the corrosion fronts
• We have identified high angle grain boundaries (A), coincidence site
lattice (CSL)(B) and slip bands (C)
• The structural disorder of each of these boundaries appears related
to the degree of corrosion
C
C
A
B B
But we need to understand the role of the materials chemistry….

2.5
μm
Connecting modalities: Nanoscale
Chemical Analysis
Chemical Mapping with Titan ChemiSTEM-EDS
• GB and CSL are associated with chemical segregation
• Slip bands have not yet shown any chemical segregation
2.5 μm
1
2

Correlative Tomography
m mm μm nm Atomic
Pits Intergranular cracks
GB
segregation
Multiple
Pits Component
failure Grain structure Sub-grains

Mechanical cutting
TEM Tomo
APT
Confocal* (depth up to 100 μm)
OCT* (depth up to 500 μm)
Plasma FIB-SEM
EDM
Neutron CT
Mechanical Polishing serial sectioning
Micro/lathe
Laser
APT
Plasma FIB
Colour X-rays
SEM-EDX
EELS
STEM diffraction
Laboratory
benchtop tests
Macro In situ
tension/compression
In situ indention
EBSD XRD
XPS (depth to 10 nm)
SIMS (depth to 2 nm)
EPMA
DCT and 3D XRD
Micro in situ
tension/compression
In situ microindention In situ nanoindention
Microtomy*
AFM
Nano X-ray CT
Microtomy* Laser FIB-SEM
3D
im
ag
ing
A
na
lytica
l M
od
alit
ies
Ma
ch
inin
g
XY pixel dimensions
Right hand limit ultimate
resolution, left hand limit
maximum area that can be
covered
Non destructive
Destructive
Mechanical testing
Crystallography
Chemistry
1m 1mm 1nm 1μm
1 Macro X-ray CT
Accuracy right,
max cube
volume left
1cm 10nm 10μm 10cm 100nm 100μm 1Å
2 Micro X-ray CT
5 STEM EDX
4 Transmission EBSD
3 Ga FIB-SEM
Ga FIB

3D map of crystalline orientation in bone trebecula [Georgiadis et al Bone 2014]
We now have advanced tools to map
microstructures across the scales:
Challenge is to correlate these to
mechanical properties across the scales

Mechanical characterisation at
the millimetre (polycrystal)
scale…….

Mapping elastic properties - Spatially
resolved acoustic spectroscopy (SRAS)
• With Steve Sharples
(Nottingham), Lowe (Imperial
College)
(SS308 TIG weld)
(EBSD:UoM) (SRAS:Nott) Stiffness

Mapping plastic properties:The ETMT
• Originally
developed by Brian
Roebuck et al.
NPL

In situ monitoring of smart weld
filler during weld cooling
• Experiments conducted at ID11 beamline at the
ESRF synchrotron facility
Instron
version of
ETMT

Evolution of phase fractions
• Full structural (Rietveld) refinement of the
diffraction patterns to obtain phase fractions

Smart weld fillers Unconstrained cooling
Constrained cooling
Axial
Transverse
Dilational
Deviatoric

Mechanical characterisation at
the tens of micron (grain to grain)
scale……

Courtesy Hysitron
Courtesy Hysitron
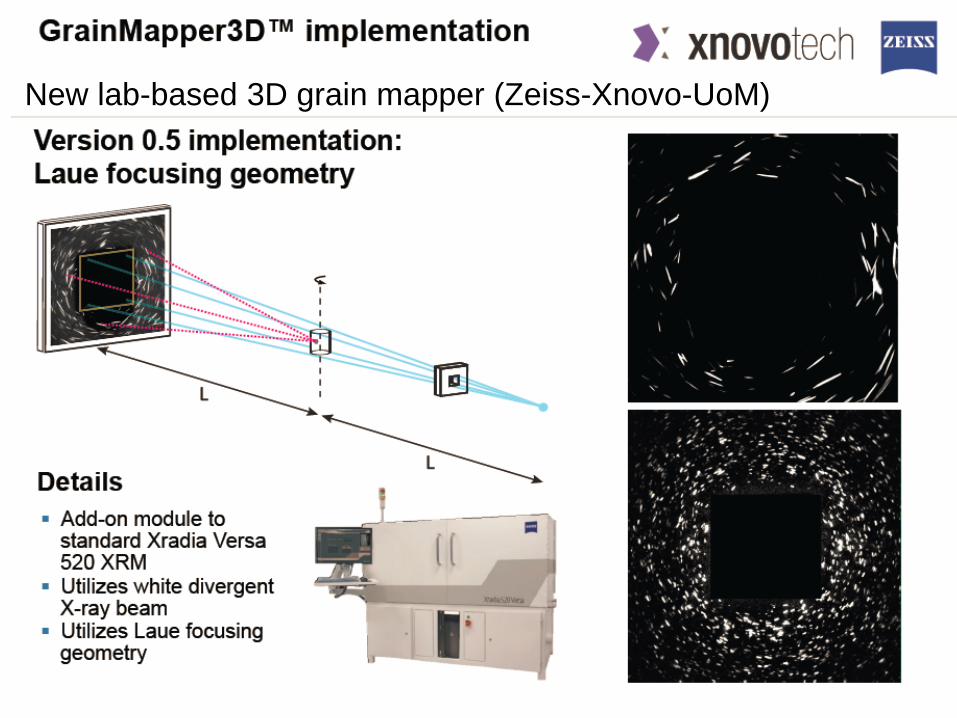
New lab-based 3D grain mapper (Zeiss-Xnovo-UoM)

Synchrotron DCT well established
• 3D crystallographic grain maps
• e.g. 3D sintering of Cu particles
Laboratory Diffraction Contrast Tomography
(DCT): crystallographic information
200 µm
Powered by
1 hour 3hour 2 hours 0 hours
Bringing synchrotron technology to
the laboratory
• 3D crystallographic information
obtained on a laboratory XRM (ZEISS
Xradia 520 Versa)
• Non-destructive 3D grain mapping in
lab.

Mapping grain deformation: EBSD + HRDIC
• Electron Back Scatter Diffraction – Before deformation:
• Grain boundaries
• Grain orientations (slip traces)
– After deformation
• Lattice rotations (local misorientation)
• Low angle grain boundaries
– Spatial resolution: 0.2 µm
• High Resolution Digital Image
Correlation – In-plane deformation gradient
• In-plane strain, rotation and their
gradients
– Spatial resolution: 0.2 µm

High resolution digital image correlation
• Sub-micron spatial resolution strain maps
400VECTORSPER100×100μm2 200,000VECTORSPER100×100μm2
Natural contrast Gold speckle
(LAVision DIC)

Al-Si Local strain evolution
10µm
-100%
-50%
0%
0%
yy

Al-Si Local strain evolution
10µm
-100%
-50%
0%
5%
yy

Al-Si Local strain evolution
10µm
-100%
-50%
0%
12%
yy

Al-Si Local strain evolution
10µm
-100%
-50%
0%
17%
yy

Al-Si Local strain evolution
10µm
-100%
-50%
0%
yy
22%
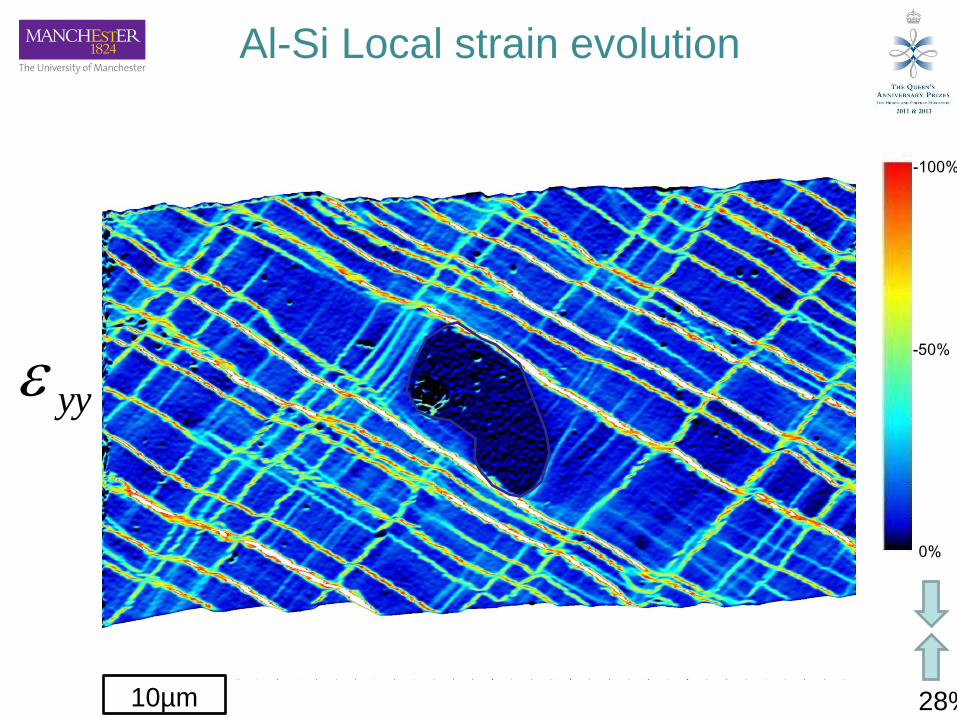
Al-Si Local strain evolution
10µm
-100%
-50%
0%
28%
yy

Al-Si strain heterogeneity – Bands vs
Matrix

DIC strain
EBSD
rotation
10o
0o
5o
-5o
-10o
-100%
-50%
0%
10µm
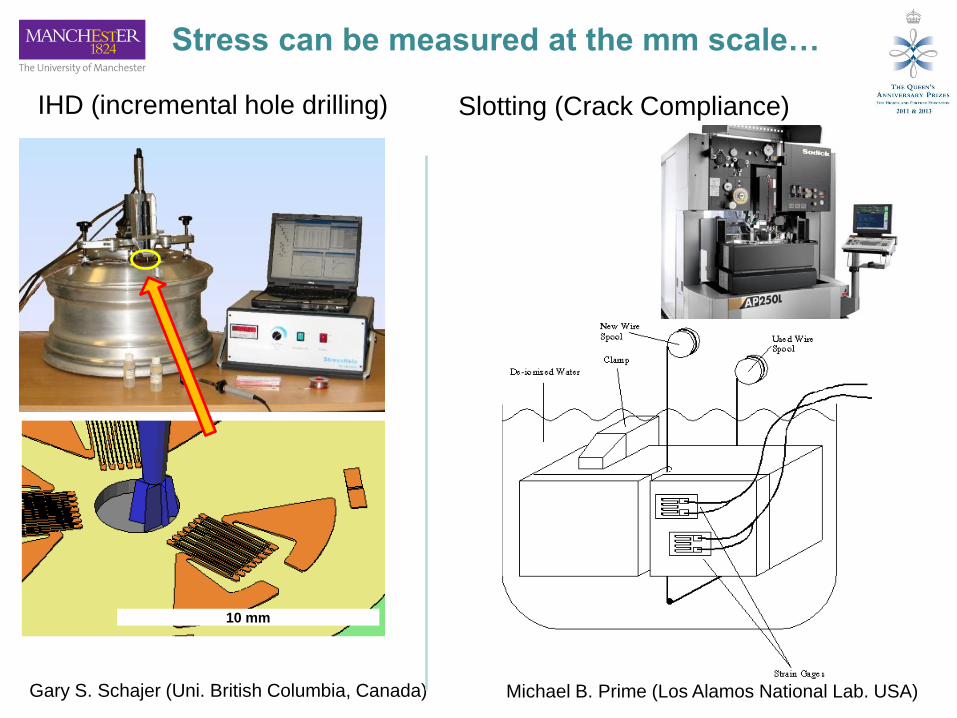
Stress can be measured at the mm scale…
10 mm
Gary S. Schajer (Uni. British Columbia, Canada) Michael B. Prime (Los Alamos National Lab. USA)
IHD (incremental hole drilling) Slotting (Crack Compliance)

Novel relaxation methods in the micron scale
Schajer GS, Winiarski B, Withers PJ. Exp. Mech. 2012
0
100
200
300
400
0 2 4 6 8
Distance from Support, mm
X-S
tres
s,
MP
a
S3 Theoretical
S3 Measured
S4 Theoretical
S4 Measured
MP
a
10 mm
µHD Sebastiani M et al. Mat. Sci. Eng. A 528 (2011) 7901– 7908
µRC
Massl S. et al. Thin Solid Films 516 (2008) 8655–8662
µCMRS

Mapping stress at the micron scale…
10 mm
0.010 mm
20 mm
0.010 mm
0.010 mm
0.003 mm
Micro-hole drilling Micro-slotting
2mm
Cross-section

Mapping stresses within Alloy 600 grains
3-D FEA model
GB
Alloy 600 subjected to low pressure hydrogenated steam

(micro-
slotting)
Intragranular RS in Alloy 600

Mechanical characterisation at
the hundreds of nanometers
scale……

Nanoindentation
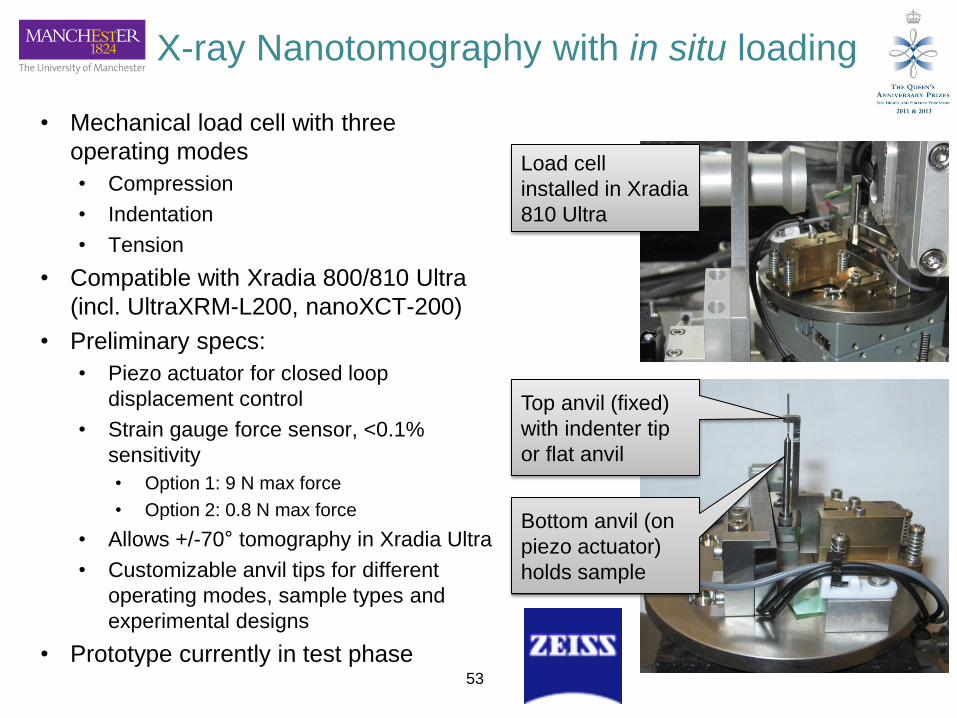
X-ray Nanotomography with in situ loading
• Mechanical load cell with three
operating modes
• Compression
• Indentation
• Tension
• Compatible with Xradia 800/810 Ultra
(incl. UltraXRM-L200, nanoXCT-200)
• Preliminary specs:
• Piezo actuator for closed loop
displacement control
• Strain gauge force sensor, <0.1%
sensitivity
• Option 1: 9 N max force
• Option 2: 0.8 N max force
• Allows +/-70° tomography in Xradia Ultra
• Customizable anvil tips for different
operating modes, sample types and
experimental designs
• Prototype currently in test phase 53
Top anvil (fixed)
with indenter tip
or flat anvil
Bottom anvil (on
piezo actuator)
holds sample
Load cell
installed in Xradia
810 Ultra

Xradia Ultra load cell – initial results:
In situ indentation / cracking of dentin
54
Diamond tip landing on Dentin (2D series, phase
contrast, 65 um FOV)
a
Force–displacement
curve: Abrupt fracture
event occurred here (c)
50mN
Diamond tip
(stationary)
Dentin sample (moving
up on actuator)
Diamond tip still
present but not
visible in absorption
contrast
Axial
crack Radial-
axial
crack
Crack
linking the
tubules
Circumf
erential
crack
Horizontal section

Courtesy Hysitron
Loading in situ within TEM

Concluding remarks
• Now able to track the same region of interest across
time and multiple length scales
• Using a correlative multi-scale framework can now
determine for the same region of interest the
mechanical properties as a function of length scale
– Better understanding of microstructure property
relationships
– Better understanding of how micro-structuring
can be used to control properties
• Inverse/Virtual fields methods may provide rich
spatially variant datasets without the need for idealised
test geometries

Acknowledgements FEI : Tim Burnett, Remco Geurts, Pybe Faber, Carmen van Vilsteren, Michael
Janus, Daniel Lischau, Pascal Doux, Bert Freitag, Trisha Rice
Zeiss: Ben Hornberger, Andrei Tkachuk, Marty Leibowitz
NPL: Ken Mingard, Mark Gee
UoM : Sam McDonald, Ali Gholinia, Dirk Engelberg, Tristan Lowe, Robert
Bradley, Teruo Hashimoto, Tom Slater, Sarah Haigh, Grace Burke, George
Thompson, Philip Withers
BP: Ellen Williams
Open University: Hedieh Jazaeri, Shirley Northover, John Bouchard
Luxfer- Henry Holroyd
Innoval- Geoff Scamans
Paper on correlative tomography:
http://www.nature.com/srep/2014/140416/srep04711/full/srep04711.html
Video on pitting example: https://www.youtube.com/watch?v=P5oUpiVvZVY
More information: www.imaging.manchester.ac.uk