Embed Size (px)
Citation preview

Small Modular Reactors in Latin America
Julio Vergara Aimone
LAS-ANS, Río de Janeiro, July 20th, 2014

Introduction

J. Vergara
Nuclear power may satisfy the needs of certain
countries that would need so. Their suitability
depends –generally– on the following:
Energy dependence and availability.
Real and external costs of electricity.
System size and demand projection.
Coherent unit power plant rating.
Human, physical and legal infrastructure.
Introduction
Which countries in L.A. need nuclear power?

J. Vergara
Country M# PIBp/#
tCO2/#
(%)
GW
TWh kWh/#
47 8900
90%
1.4
1150 53
14
15 7600
93%
2.1
1250 18
5
29 9200
80%
1.5
1300 37
9
10 4500
70%
1.5
640 6
2
16 18000
99%
6.0
3800 62
17
29 11350
99%
5.4
3400 98
28
197 10300
98%
2.1
2500 480
114
7 5300
94%
0.8
1250 8
9
3 13300
97%
2.3
2800 10
3
41 15500
95%
4.5
3000 121
33
109 13400
93%
4.0
2300 250
62
11 5900
86%
2.5
1350 15
6
590 10400
91%
2.7
2150 1250
320
Introduction
Different economic, energy and social realities

J. Vergara
Hu
ma
n D
eve
lop
me
nt
Ind
ex
HD
I
0
0.2
0.4
0.6
0.1
0.3
0.5
0.8
0.7
1.0
0.9
Electricity Consumption kWh / #
5.000 0 30.000 25.000 20.000 10.000 15.000
USA
Island Canada Australia
Niger
Ethiopia
Congo
India
China
Korea Rusia
South Africa
Netherlands Japan
Gabon
France
S.Arabia
Egypt
Africa
OECD
South américa
Ex-URSS
Asia
Argentine
Colombia Brazil
Chile
Perú
Introduction
Electricity generation and human development
J. Vergara
100
1000
1 10 100 1000 10000 1
10
100000
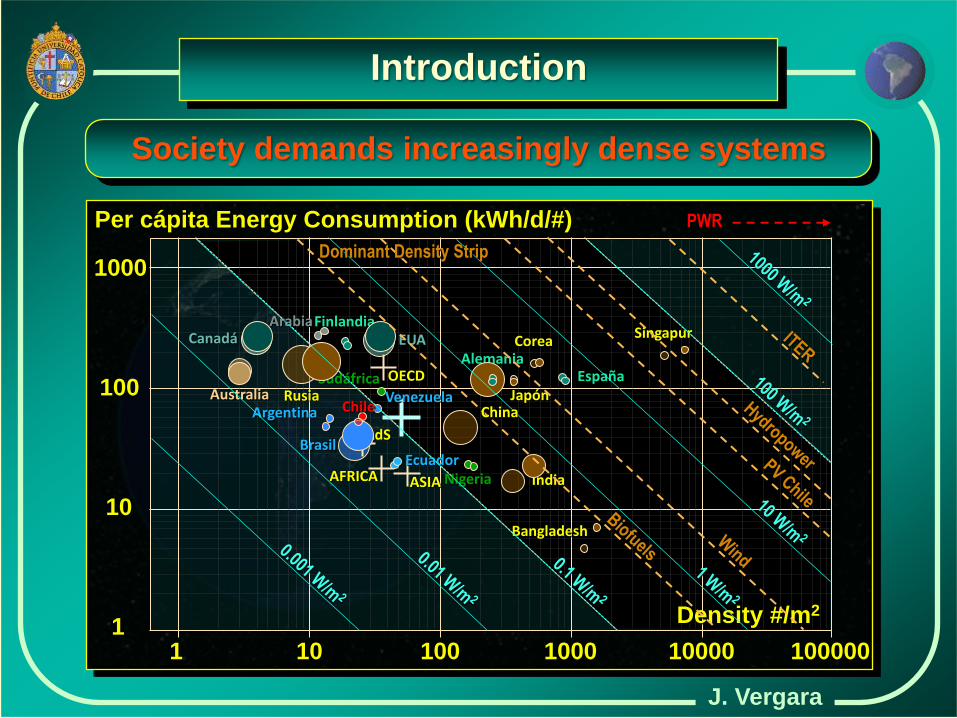
Per cápita Energy Consumption (kWh/d/#)
Density #/m2
Corea
Brasil
Rusia Argentina
Canadá
AFRICA
AdS
OECD
ASIA
EUA
Ecuador
Finlandia
España
Singapur Arabia
Nigeria
Australia
Alemania
Bangladesh
Sudáfrica
India
Japón Venezuela Chile
PWR
Dominant Density Strip
China
Introduction
Society demands increasingly dense systems

J. Vergara
210 m
110 m
1300 MW
110 m
120 m
1320 MW
One 165 MW module One 1600 MW module
50.000 a 100.000 W/m2
Nuclear Island and turbomachinery
Nuclear energy is –by far– very concentrated
Introduction
J. Vergara
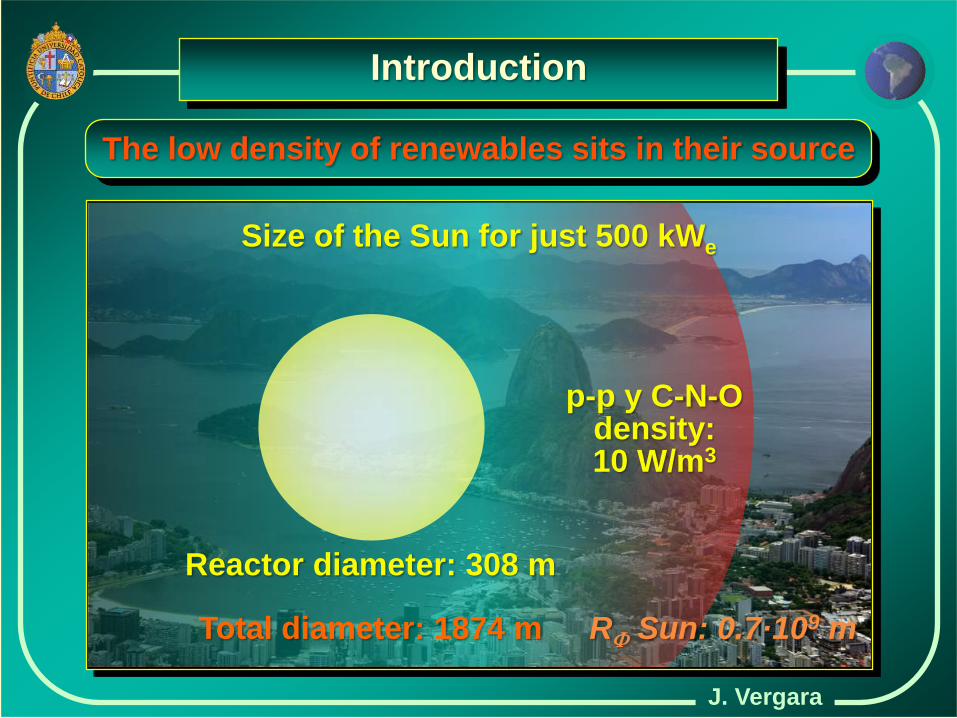
The low density of renewables sits in their source
Introduction
Size of the Sun for just 500 kWe
Reactor diameter: 308 m
Total diameter: 1874 m
p-p y C-N-O density: 10 W/m3
RF Sun: 0.7·109 m
J. Vergara
Gro
ss
In
tern
al P
rod
uc
t / C
ap
ita
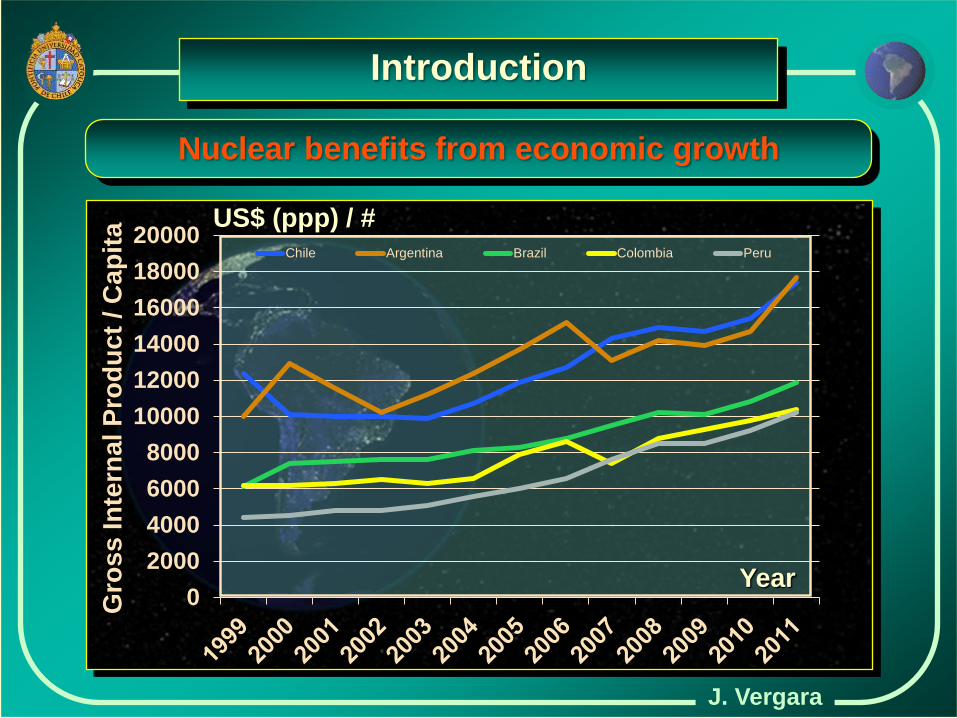
US$ (ppp) / #
0
2000
4000
6000
8000
10000
12000
14000
16000
18000
20000Chile Argentina Brazil Colombia Peru
Nuclear benefits from economic growth
Introduction
Year

J. Vergara
Em
iss
ion
s f
rom
ele
ctr
icit
y
Nuclear reduces greenhouse gases emissions
0,00
0,05
0,10
0,15
0,20
0,25
0,30
0,35
0,40
0,45
0,5019
90
19
91
19
92
19
93
19
94
19
95
19
96
19
97
19
98
19
99
20
00
20
01
20
02
20
03
20
04
20
05
20
06
20
07
20
08
20
09
Argentina Chile Brasil Colombia Peru
kg CO2/kWh
Año
Introduction

J. Vergara
Name Type Designer Gross/Net Power (MWe) Construction/ Operation
1) Atucha NPP, Lima, Buenos Aires (ARGENTINA, Nucleoeléctrica Argentina S.A.).
J.D. Perón PHWR KWU 357/335 1968/1974
N. Kirchner PHWR KWU 745/692 1981/2013
Carem-25 PWR CNEA 27/25 2012/2017
2) Embalse NPP, Embalse, Córdova (ARGENTINA, Nucleoeléctrica Argentina S.A.).
Embalse CANDU AECL 648/600 1974/1984
3) Almirante Álvaro Alberto NPP, Angra dos Reis, Rio de Janeiro (BRASIL, Eletrobras Eletronuclear S.A.)
Angra I PWR Westinghouse 640/609 1971/1985
Angra II PWR Siemens 1350/1275 1976/2001
Angra III PWR Siemens 1350/1245 2010/2016
4) Laguna Verde NPP, Veracruz (MÉXICO, Comisión Federal de Electricidad)
LV 1 BWR-5 General Electric 700/682 1976/1990
LV 2 BWR-5 General Electric 700/682 1977/1995
Introduction
Four nuclear power plants in Latin America, so far

J. Vergara
País Nombre Propósito Potencia Operador y Lugar
Argentina
RA-0 Critical facility 10 W Universidad UNC, Córdova
RA-1 Research and training 40 kW CNEA, CAC, Buenos Aires
RA-3 Isotope production 10 MW CNEA, CAE, Buenos Aires
RA-4 Critical facility 10 W Universidad UNR, Rosario
RA-6 Multipurpose and research 500 W CNEA, CAB, Bariloche
RA-8 CAREM emulator 10 W CNEA-CTP, Pilcaniyeu
RA-10 (*) Multipurpose and research 30 MW CNEA, CAE, Buenos Aires
Brasil
IEA-R1 Isotope production 5 MW IPEN/CNEN Sao Paulo
MB-01 Critical facility 100 W IPEN/CNEN Sao Paulo
IPR-R1 Research and training 100 kW CDTN/CNEN Belo Horizonte
Argonaut Research and training 500 W IPEN/CNEN Sao Paulo
RBM (*) Multipurpose and research 30 MW CNEN, Iperó-Aramar-Sao Paulo
Chile RECH-1 Isotope production 5 MW CCHEN, CEN La Reina, Santiago
RECH-2 In reserve 10 MW CCHEN, CEN Lo Aguirre, Santiago
Colombia IAN R-1 Resources research 20 kW INGEOMINAS, Bogotá
México TRIGA Multipurpose and research 1 MW ININ, Ciudad de México
Perú RP-10 Isotope production 10 MW IPEN Centro RACSO, Carabayllo
RP-0 Critical facility 10 W IPEN, San Borja, Lima
Introduction
But a large stock of research capabilities

J. Vergara
Issues Chile Brasil Argentina Colombia México Perú
National position D A A NC A NC
Nuclear safety A A A N A A
Integral management A A A A A A
Budget and funding D A D NC A D
Legislative work D A A NC A N
Safeguards A A A A A A
Regulatory framework N N A NC N N
Radiological Protection A A A A A A
Power network D A A D A D
Human resource development N A A D A D
Stakeholder involvement D A A D A D
Sites and installations N A A NC A NC
Environmental Protection A A A A A A
Emergency planning N N N N N N
Physical protection (security) N N N N N N
Fuel cycle D A A D A D
Waste management N A A N A N
Industrial involvement D A A D A D
Acquisitions A A A N A N
Introduction
Infrastructure level for nuclear power in the region

J. Vergara
Latin America has a moderate nuclear ambition.
Current nuclear operating countries entered
the field in a very different political context,
realized mainly by strong State´s will.
Would they have entered today, in open mar-
kets, with internet and social networks?
What would SMRs change today?
What went misplaced in classical reactors?
Is it reasonable to think about SMRs in LA?
Introduction

J. Vergara
Wind ~320 GW Minihydro ~ 50 GW Biomass ~ 80 GW Geothermal ~ 11 GW Solar PV ~140 GW Tide ~ 0.5 GW
Energy Use
World´s installed electric capacity : ~ 5400 GW
~ 3500 GW
~ 955 GW
~ 372 GW
~ 605 GW
~ 15600 TWh
~ 3350 TWh
~ 2500 TWh
~ 1230 TWh
51%
40%
77%
23%
Fossil
Hydro
Nuclear
Renewables ~ 605 GW Renewables
Renewable energies have the momentum today
Introduction
Renewables grew 10X in 1 decade

J. Vergara
Capacity (GW) Generation Share (%)
Operable Reactors (#)
Reactors iniciating construction (#)
APS-1
20
0
10
5
15
25
0
50
100
150
200
250
300
350
400
450
500
19
54
19
56
19
58
19
60
19
62
19
64
19
66
19
68
19
70
19
72
19
74
19
76
19
78
19
80
19
82
19
84
19
86
19
88
19
90
19
92
19
94
19
96
19
98
20
00
20
02
20
04
20
06
20
08
20
10
20
12
TMI-2
Chernobyl-4 Fukushima 1
Nuclear power has been fairly stagnant
Introduction
J. Vergara
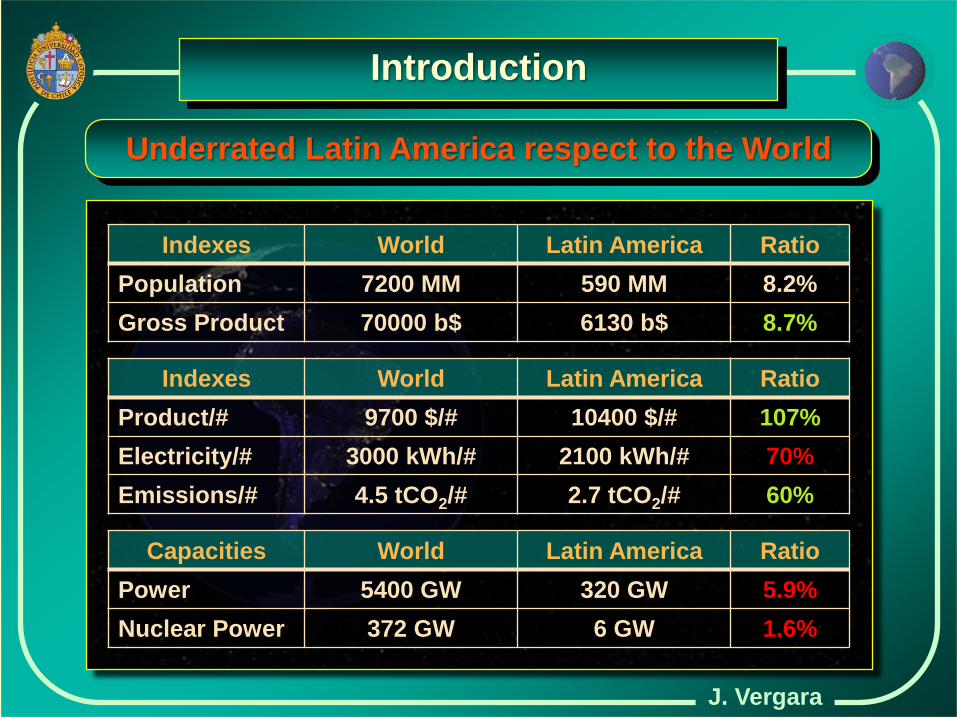
Introduction
Underrated Latin America respect to the World
Indexes World Latin America Ratio
Population 7200 MM 590 MM 8.2%
Gross Product 70000 b$ 6130 b$ 8.7%
Capacities World Latin America Ratio
Power 5400 GW 320 GW 5.9%
Nuclear Power 372 GW 6 GW 1.6%
Indexes World Latin America Ratio
Product/# 9700 $/# 10400 $/# 107%
Electricity/# 3000 kWh/# 2100 kWh/# 70%
Emissions/# 4.5 tCO2/# 2.7 tCO2/# 60%

The Dominant Reactor

J. Vergara
PWR unit
1000 to 1600 MWe
Steam
Water
The Dominant Reactor
PWR: Nuclear power dominant design
J. Vergara
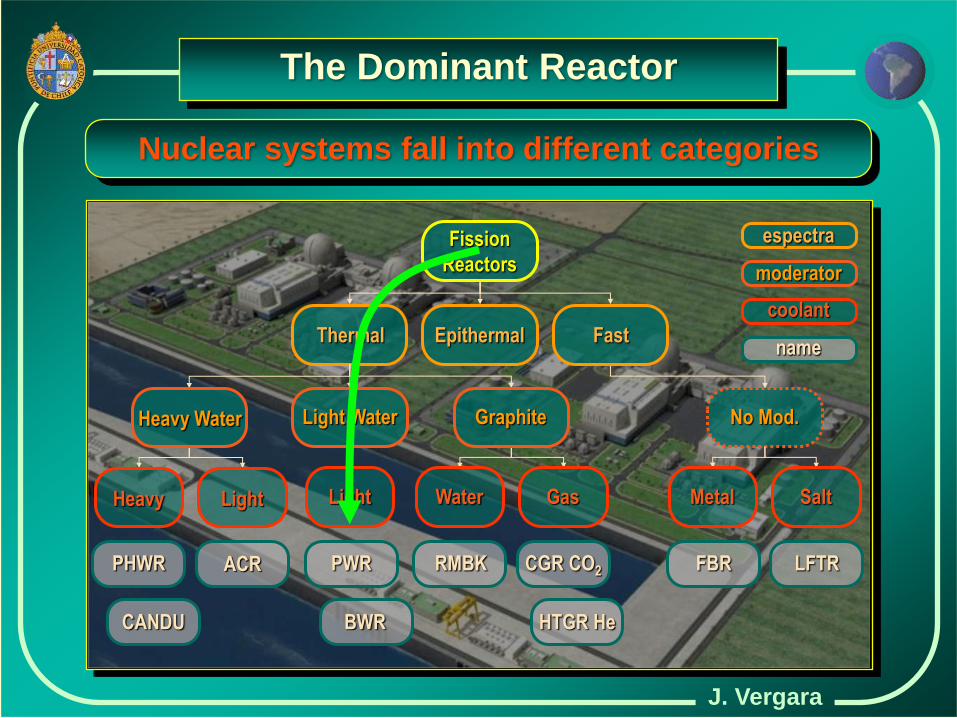
Fission
Reactors
Thermal Epithermal Fast
No Mod.
PWR PHWR
CANDU BWR
CGR CO2
HTGR He
RMBK FBR
espectra
moderator
coolant
name
Water Gas Metal Salt Heavy Light Light
Light Water Graphite Heavy Water
LFTR ACR
The Dominant Reactor
Nuclear systems fall into different categories
J. Vergara
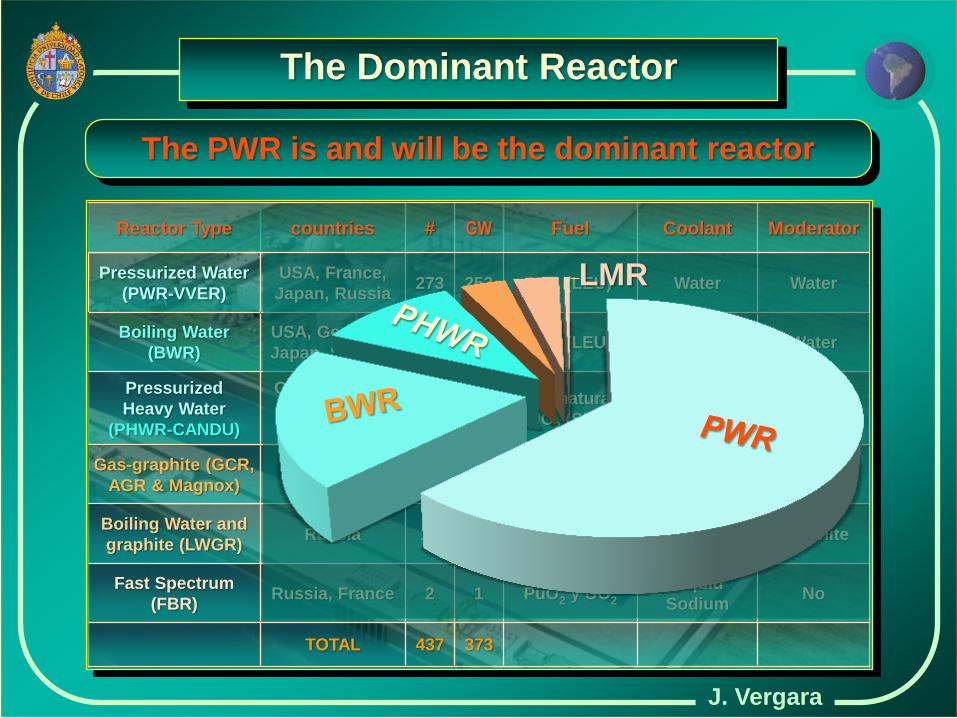
Water Water UO2 (LEU) 252 273 USA, France,
Japan, Russia
Pressurized Water
(PWR-VVER)
373 437 TOTAL
No Liquid
Sodium PuO2 y UO2 1 2 Russia, France
Fast Spectrum
(FBR)
Graphite Water UO2 (LEU) 10 15 Russia Boiling Water and
graphite (LWGR)
Graphite CO2 U (natural),
UO2 (LEU) 8 15
United
Kingdom
Gas-graphite (GCR,
AGR & Magnox)
Heavy
Water
Heavy
Water
UO2 (natural),
UO2 (SEU) 24 48
Canada, India,
Korea, China,
Argentine
Pressurized
Heavy Water
(PHWR-CANDU)
Water Water UO2 (LEU) 78 84 USA, Germany,
Japan, Sweden
Boiling Water
(BWR)
Moderator Coolant Fuel GW # countries Reactor Type
The PWR is and will be the dominant reactor
The Dominant Reactor
LMR

J. Vergara
Three new reactor
systems classes
Different reactor categorization models
Evolutive Innovative (≈ 1000+ MW) (≈ 300- MW)
Long-Term (P ≈ variable)
The Dominant Reactor

J. Vergara
Several categories
in energy services
Power H2O, CH2, H2 Heat
Propulsion
The Dominant Reactor
Different reactor categorization models

J. Vergara
EUA Francia Japón Rusia Corea India Canadá China Reino Unido Ucrania Suecia Alemania España Bélgica Rep. Checa Taiwán Suiza Finlandia Hungría Eslovaquia Pakistán Bulgaria Brasil Sudáfrica México Rumania Argentina Irán Eslovenia Holanda Armenia
0 10 20 30 40 50 60 70 80 100 90 # Country GW % 100 58 50 33 23 21 20 17 16 15 10 9 8 7 6 5 5 4 4 4 3 2 2 2 2 2 2 1 1 1 1
437 (372 GW)
Current size of the nuclear power sector
19 77 2
16 30 4
14 2
17 48 39 16 20 51 34 19 36 32 45 54 5
33 2 7 3
19 5 1
36 4
27
The Dominant Reactor

J. Vergara
China
Rusia
India
Corea
EUA
Japón
Taiwán
Pakistán
Eslovaquia
Ucrania
EAU
Argentina
Brasil
Finlandia
Francia
0 5 10 15 20 30 # Country GW 25
30
10
6
5
4
2
2
2
2
2
2
1
1
1
1
Current expansion of the nuclear power sector
71 (69 GW)
The Dominant Reactor

J. Vergara
0
5
10
15
20
25
30
35
1 3 5 7 9 11 13 15 17 19 21 23 25 27 29 31 33 35 37 39 41 43
275
Initial License:
~30 years.
160
The fleet is rather old most need to re-license
The Dominant Reactor

Issues of the classical reactor

J. Vergara
200
Nuclear
0 50 150 250
Coal
Gas
Offwind
100 Mills/kWh
Nuclear
Coal
Gas
Offwind
Nuclear
Gas
Offwind
Coal
N. A
me
rica
Eu
rop
e
Asi
a P
acif
ic
@10% OCDE 2010
Not quite “too cheap to meter” but not that bad
Issues of the classical reactor

J. Vergara
200
Nuclear
0 50 150 250
Coal
Gas
Offwind
100 Mills/kWh
Nuclear
Coal
Gas
Offwind
Nuclear
Gas
Offwind
Coal
N. A
me
rica
Eu
rop
e
Asi
a P
acif
ic
@5% OCDE 2010
Not quite “too cheap to meter” but not that bad
Issues of the classical reactor

J. Vergara
kgCeq /kWh
0.35
0.30
0.25
0.20
0.15
0.10
0.05
0
1990
A.
1990
B.
2005
-20
Lignite Coal
1990
A.
1990
B.
2005
-20
Oil
1990
A.
1990
B.
2005
-20
Gas
1990
A.
1990
B.
2005
-20
Solar PV 19
90 A
. 19
90 B
. 20
05-2
0
Biomass
Hig
h
Lo
w
Wind
L 2
5% J
ap
L 1
0% S
ui
L 1
0% B
e L
35%
O. B
e L
30%
O. U
K
Nuclear
Hig
h
Lo
w
Optimal for climate change avoidance / mitigation
Issues of the classical reactor
Hydro
Rep
resa
Br.
R
epre
sa A
l. R
epre
sa C
a.
Pas
ada
Su
i
J. Vergara
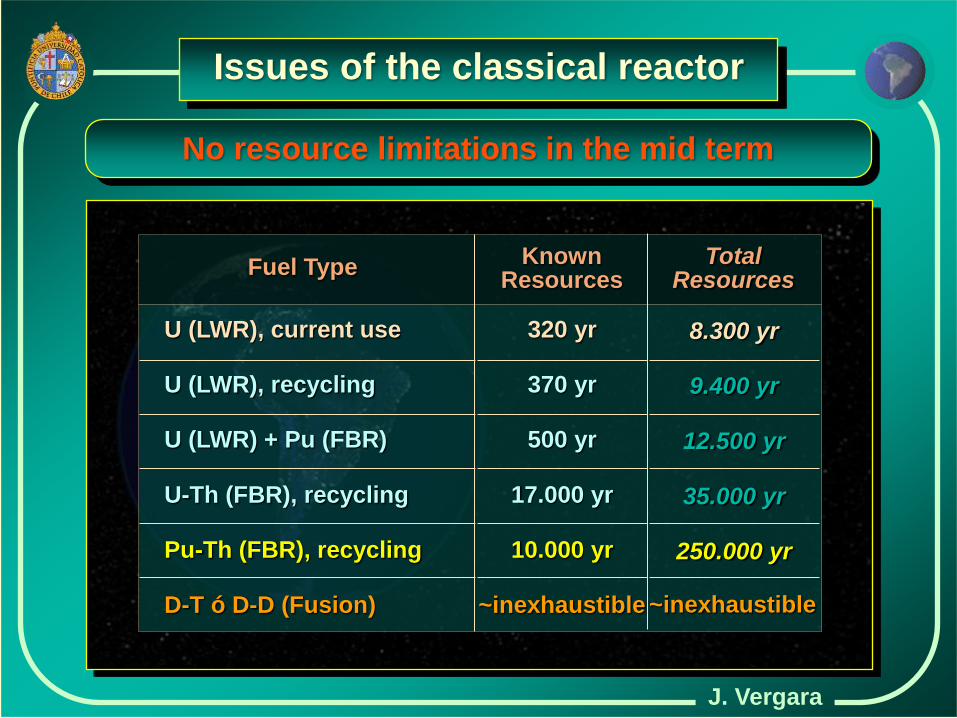
No resource limitations in the mid term
U (LWR), current use
U (LWR), recycling
U-Th (FBR), recycling
Pu-Th (FBR), recycling
Fuel Type
U (LWR) + Pu (FBR)
D-T ó D-D (Fusion)
Known Resources
320 yr
370 yr
17.000 yr
10.000 yr
500 yr
~inexhaustible
8.300 yr
9.400 yr
35.000 yr
250.000 yr
12.500 yr
~inexhaustible
Total Resources
Issues of the classical reactor

J. Vergara
No real problems with mortality and morbility
Number of Fatalities per GW-yr (1969-1996, including Chernobyl and Fukushima Dai-ichi) 101
10-2
10-3
10-1
100
Coal Nucleoelectric Hydropower Oil Natural Gas LPG Gas
Mean Value (1969-1986)
Severe Accidents in the Energy Sector, PSI, 1998
Issues of the classical reactor

J. Vergara
Immediate Accidents Fatalities (1969-1996, including Chernobyl and Fukushima Dai-ichi) 8000
7000
3000
2000
1000
0 Coal Nucleoelectric Hydropower
4000
5000
6000
Oil Natural Gas
Max. fatalities (1969-1996)
Min. fatalities (1969-1986)
Fritzsche (1969-1986)
Severe Accidents in the Energy Sector, PSI, 1998
LPG Gas
Issues of the classical reactor
No real problems with mortality and morbility

J. Vergara
Mortality of other energy forms in recent years
2010, Anacortes refinery, USA (10)
2010, Deepwater Horizon plataform, USA (11)
2010, Dosquebradas gaspipe, Colombia (39)
2011, Coal mine collapse, Pakistan (45)
2011, Coal mine well, Mexico (14)
2012, Amuay refinery, Venezuela (41)
2012, Panzhihua mine, Sichuan, China (41)
2012, Pemex gas plant, Mexico (26)
2012, Methane gas in Komi, Rusia (18)
2013, Oil cargo train derailing, Canada (52)
2014, Methane gas in Manisa, Turkey (301)
Issues of the classical reactor

J. Vergara
Knock-Nevis
564000 DWT, 458 x 69 x 30T m
4 trips-year of Knock Nevis (ULCC
of 564.000 DWT).
6 trips-year of Berge Stahl (OBC
of 365.000 DWT).
8 trips-year of scarse LNGCs
200 trips-year of a 90-wagon train.
Berge Stalh
365000 DWT, 343 x 63 x 25T m
Fuel transport (i.e. 600 MW of fossil energy)
Issues of the classical reactor
Just a few tons (trucks) of nuclear fuel
needed for the same power demand

J. Vergara
95-96% of this can be recycled
5% remaining is “HLW”
Historical global volume (1954-2012)
250.000 tons NSF
95% U
½% MA
<1% Pu <4% FP
Nuclear wastes are messy, however not decisive
Issues of the classical reactor
J. Vergara
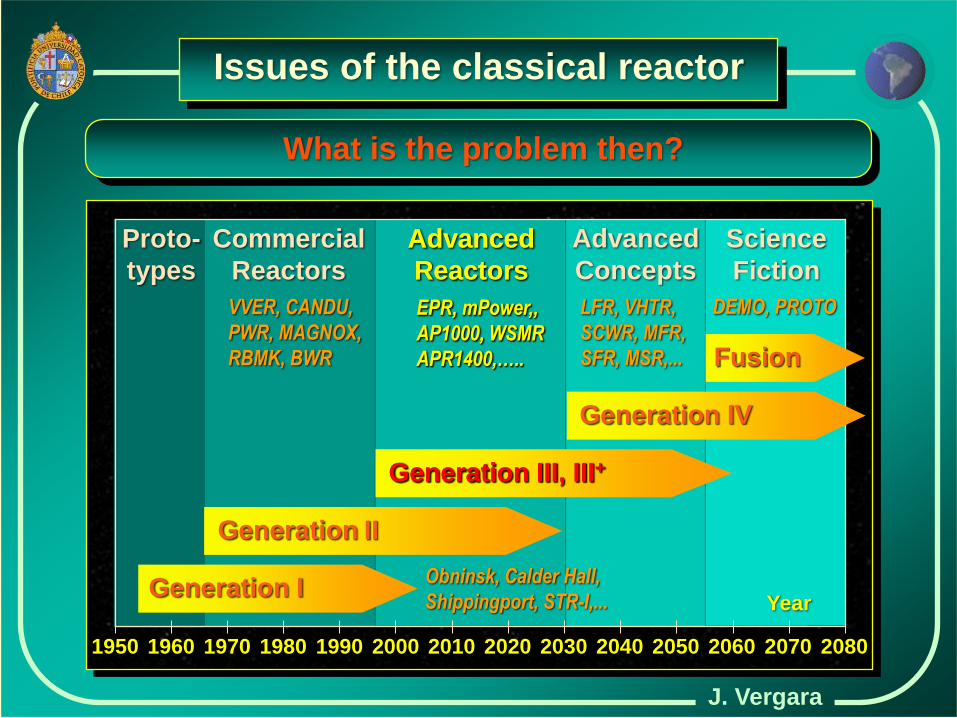
Science
Fiction
1950 1970 1990 2010 2030 2050 2070
Year
Commercial
Reactors
Advanced
Reactors
Advanced
Concepts
Proto-
types
Generation I
Generation II
Generation III, III+
Generation IV
Fusion
VVER, CANDU,
PWR, MAGNOX,
RBMK, BWR
EPR, mPower,,
AP1000, WSMR
APR1400,…..
LFR, VHTR,
SCWR, MFR,
SFR, MSR,...
Obninsk, Calder Hall,
Shippingport, STR-I,...
1960 1980 2000 2020 2040 2060
DEMO, PROTO
2080
Advanced
Reactors
EPR, mPower,,
AP1000, WSMR
APR1400,…..
Generation III, III+
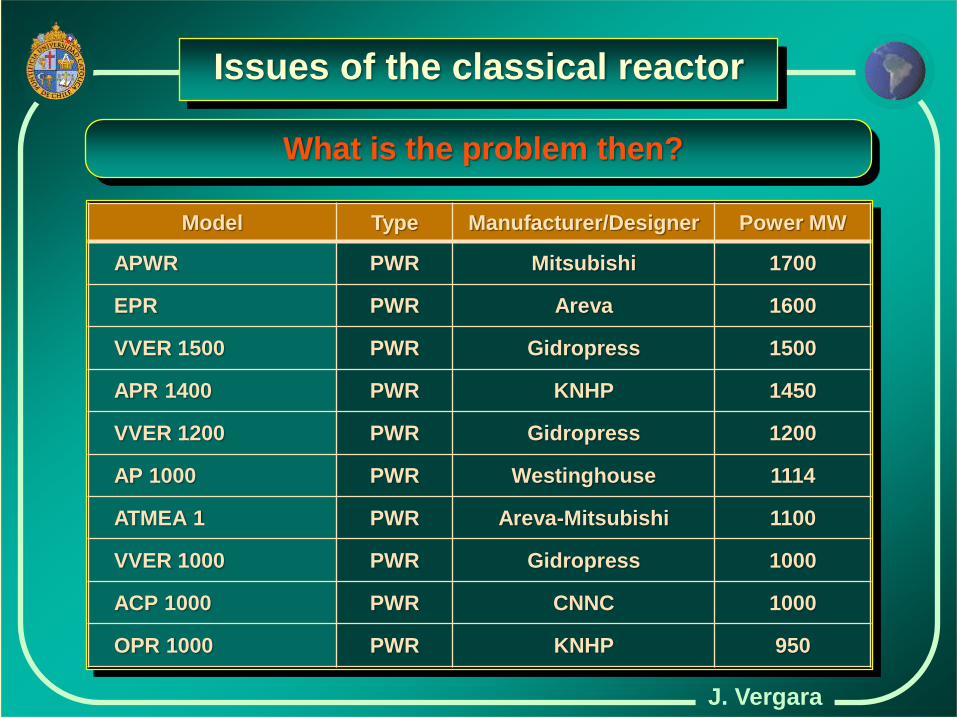
What is the problem then?
Issues of the classical reactor
J. Vergara
Model Type Manufacturer/Designer Power MW
APWR PWR Mitsubishi 1700
EPR PWR Areva 1600
VVER 1500 PWR Gidropress 1500
APR 1400 PWR KNHP 1450
VVER 1200 PWR Gidropress 1200
AP 1000 PWR Westinghouse 1114
ATMEA 1 PWR Areva-Mitsubishi 1100
VVER 1000 PWR Gidropress 1000
ACP 1000 PWR CNNC 1000
OPR 1000 PWR KNHP 950
What is the problem then?
Issues of the classical reactor

J. Vergara
Model Type Manufacturer/Designer Power MW
ESBWR BWR General Electric 1550
ABWR BWR General Electric 1300
SWR1000 (Kerena) BWR Areva 1250
ACR1000 PHWR AECL 1080
CANDU 9 PHWR AECL 600
EC6 PHWR Candu 600
CANDU 6 PHWR AECL 600
SBWR BWR General Electric 600
BN 600 LMR OKBM 560
BN 800 LMR OKBM 880
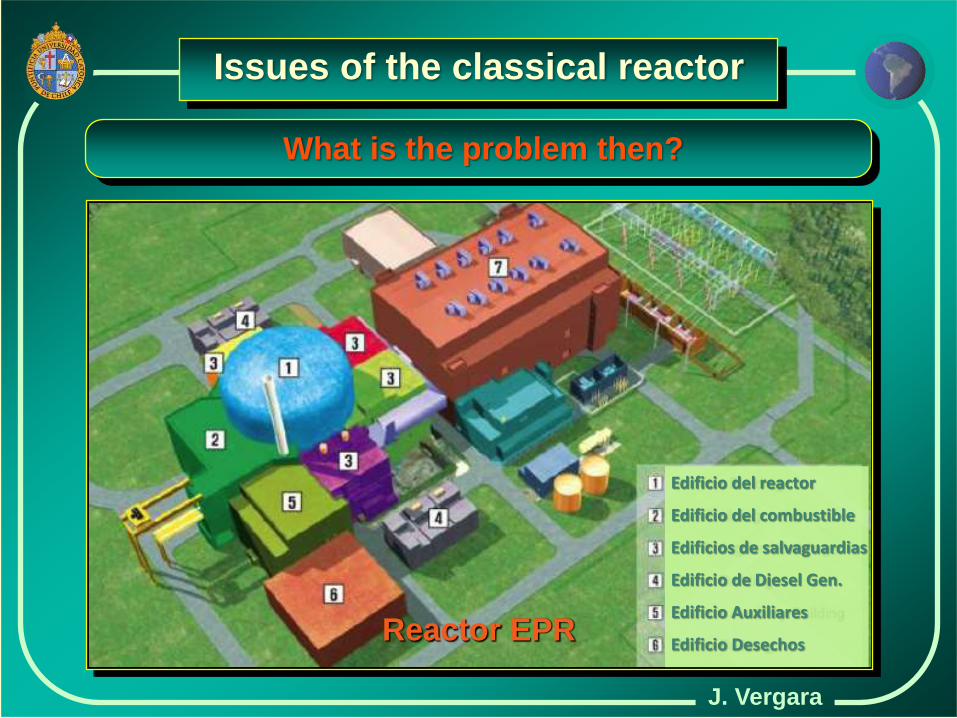
What is the problem then?
Issues of the classical reactor
J. Vergara
Edificio del reactor
Edificio del combustible
Edificios de salvaguardias
Edificio de Diesel Gen.
Edificio Auxiliares
Edificio Desechos Reactor EPR
What is the problem then?
Issues of the classical reactor

J. Vergara
1114 MW (under construction in China and USA)
AP1000 Reactor
What is the problem then?
Issues of the classical reactor

J. Vergara
ESBWR
APR1400
ABWR
APWR
ACR-1000
What is the problem then?
Issues of the classical reactor

J. Vergara
It seems to be in the reactor scale.
Although generation capacity is not suppos-
ed to be subject to economies of scale.
But. a $10 billion unit scares investors out.
It is an economic (risk) problem, on top of a
large array of underlying issues.
Need to eliminate the chance of an accident
imposing evacuation (any postulated accid-
ent should only impact the reactor site).
What is the problem then?
Issues of the classical reactor

J. Vergara
Chilean Hidroaysén (a 2.75 GW environment-
ally superb austral hydro plant) was drained.
Chilean Rio Cuervo (a 1 GW austral hydro
plant) would probably follow Hidroaysén.
Chilean Castilla project (a 2.2 GW coal-fired
station; Elke Batista´s) did not succeed.
PV, wind, bio plants, Diesels, CSP, and most
low scale gadgets, grow like mushrooms.
Scale is not limited to nuclear power
Issues of the classical reactor

Technology Trends

J. Vergara
IPWRs
100-300 MWe
Expected mid-term trend in generation III
Technology Trends
PWR unit
1000 to 1600 MWe

J. Vergara
Model Type Manufacturer/Designer Power MW
IMR IPWR CRIEPI 350
IRIS IPWR IRIS Consortium 335
VBER300 PWR OKBM 325
AHWR PHWR BARC 300
GT-MHR HTGR GA-OKBM 265
EM2 HTGR GA 240
HTR PM HTGR INET 210
Westinghouse SMR IPWR Westinghouse 200
mPower IPWR Babcock & Wilcox 180
Ideal to replace fossil-fueled units, without GHGs
A selection of Generation III innovative concepts
Technology Trends

J. Vergara
Model Type Manufacturer/Designer Power MW
HI-SMUR IPWR Holtec Int. 160
KALIMER LMR KAERI 150
SMART IPWR KAERI 100
CNP100 IPWR CCNC 100
MRX LWR JAERI 100
MASLWR IPWR NuScale Power 45
KLT 40 PWR OBKM 35
CAREM IPWR CNEA-INVAP 27
4S LMR CRIEPI 10
Ideal to replace fossil-fueled units, without GHGs
A selection of Generation III innovative concepts
Technology Trends

J. Vergara
SMART Reactor
Desalination
Plant
Electricity
Generation
90 MWe + 40000 ton/day
100 MWe
A selection of Generation III innovative reactors
Technology Trends

J. Vergara
mPower Reactor
180 MWe Unit
1080 MWe Plant
A selection of Generation III innovative reactors
Technology Trends

J. Vergara
mPower Reactor
180 MWe Unit
720 MWe Plant
A selection of Generation III innovative reactors
Technology Trends

J. Vergara
Westinghouse SMR
A sabotage threat is
reduced, the size of
the container is also
reduced and it can
be isolated from the
ground motions.
200 MWe
A selection of Generation III innovative reactors
Technology Trends

J. Vergara
145 MWe Unit Holtec HI-SMUR
A selection of Generation III innovative reactors
Technology Trends

J. Vergara
Plant: 540 MWe (12#) NuScale
A selection of Generation III innovative reactors
Technology Trends

J. Vergara
ACP 100 100 MW, CNCC
A selection of Generation III innovative reactors
Technology Trends

J. Vergara
27 MWe Unit Future size up to 300 MW
CAREM 25
Conjunto Argentino de REactores Modulares
A selection of Generation III innovative reactors
Technology Trends
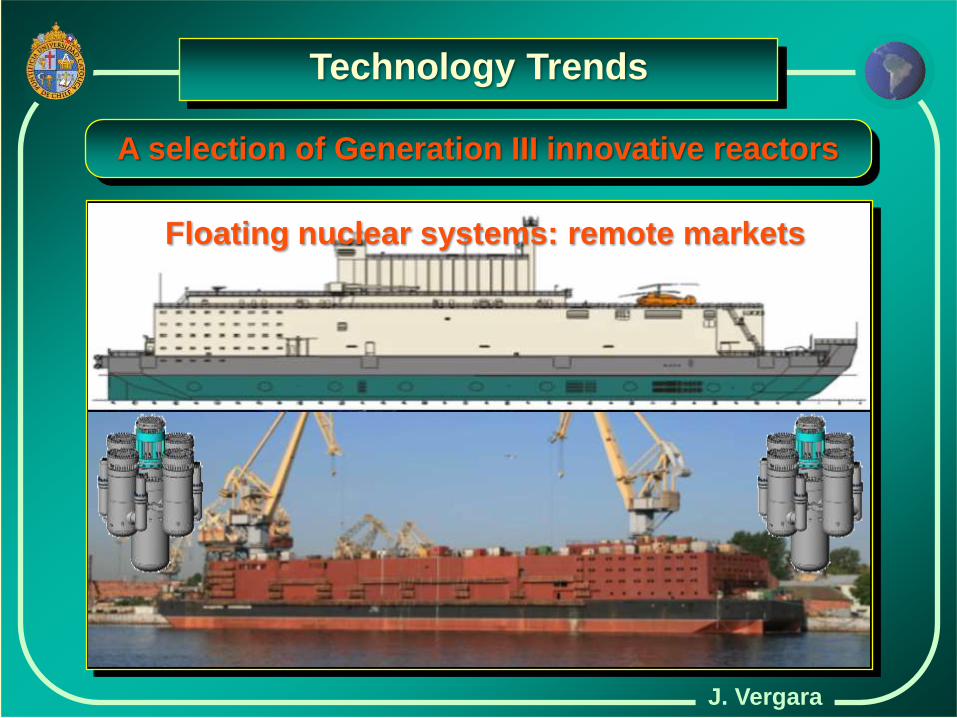
J. Vergara
Floating nuclear systems: remote markets
A selection of Generation III innovative reactors
Technology Trends

J. Vergara
Unidades de 50-200 MWe @ 50-100 m
No le faltará un sumidero de refrigeración
FlexBlue
A selection of Generation III innovative reactors
Technology Trends

J. Vergara
Planta de 800 MWe
FlexBlue
A selection of Generation III innovative reactors
Technology Trends
J. Vergara
FlexBlue Unidad de 50-200 MWe
This image could include 4# with 340 + 360 MWe
A selection of Generation III innovative reactors
Technology Trends
J. Vergara
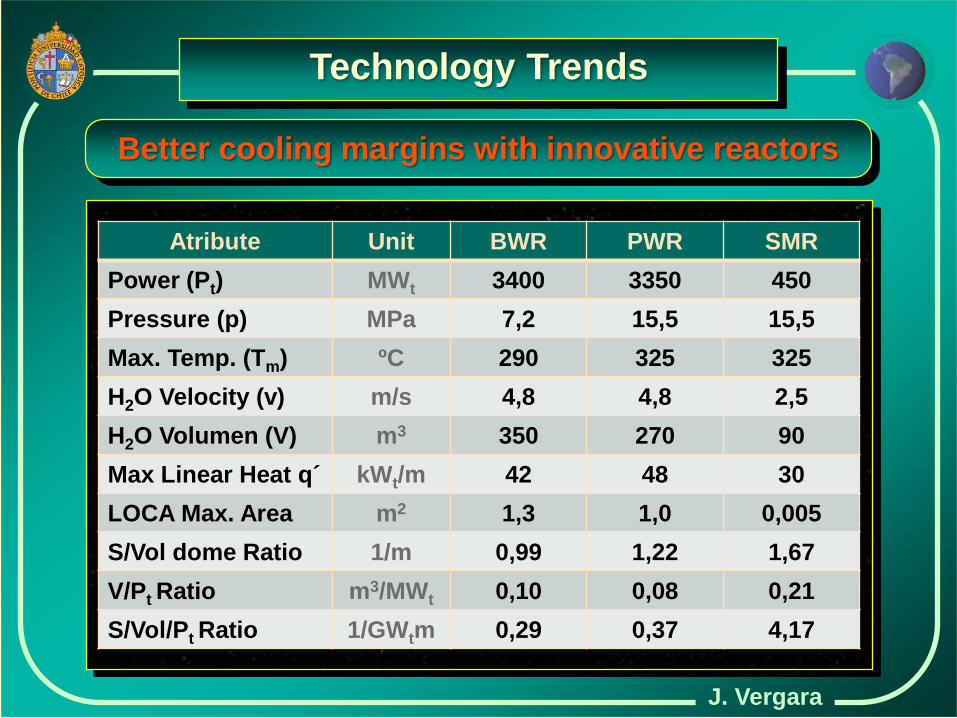
Atribute Unit BWR PWR SMR
Power (Pt) MWt 3400 3350 450
Pressure (p) MPa 7,2 15,5 15,5
Max. Temp. (Tm) ºC 290 325 325
H2O Velocity (v) m/s 4,8 4,8 2,5
H2O Volumen (V) m3 350 270 90
Max Linear Heat q´ kWt/m 42 48 30
LOCA Max. Area m2 1,3 1,0 0,005
S/Vol dome Ratio 1/m 0,99 1,22 1,67
V/Pt Ratio m3/MWt 0,10 0,08 0,21
S/Vol/Pt Ratio 1/GWtm 0,29 0,37 4,17
Better cooling margins with innovative reactors
Technology Trends

J. Vergara
Atribute Unit BWR PWR SMR
Power (Pt) MWt 3400 3350 450
Pressure (p) MPa 7,2 15,5 15,5
Max. Temp. (Tm) ºC 290 325 325
H2O Velocity (v) m/s 4,8 4,8 2,5
H2O Volumen (V) m3 350 270 90
Max Linear Heat q´ kWt/m 42 48 30
LOCA Max. Area m2 1,3 1,0 0,005
S/Vol dome Ratio 1/m 0,99 1,22 1,67
V/Pt Ratio m3/MWt 0,10 0,08 0,21
S/Vol/Pt Ratio 1/GWtm 0,29 0,37 4,17
Better cooling margins with innovative reactors
Technology Trends
Fukushima Innovative
2,1X
14,0X
1.6X
250,0X
1,4X
Improves
Water Reserve
Extracción de calor
Cooling Potential
Water loss
Energy density
Property

J. Vergara
Pending issues for superior nuclear systems:
Improved economic and financial results.
Enhanced safety (avoid criticality risks, reduce
decay heat and confine radioactive materials).
Reduced wastes and emissions (heat lost,
wastes, GHGs, self consumption, etc.).
A critical issue today is economics, to regain
competitiveness and momentum.
Future reactors need to improve even further
Technology Trends

J. Vergara
INSs are safe in PSA terms (CDF < 10-8). But,
these would not convince further if these are
reduced to, say 10-10), specially if somebody
makes a mistake, in another plant.
Wastes and other emissions can be reduced
(cogenerating, raising temperature, recycling,
transmuting, etc). Probably, the public would
not hesitate if wastes 90% or the efficiency
5%. Those are good to do, but not decisive.
Future reactors need to improve even further
Technology Trends

J. Vergara
Power (MWe)
Operacional effect
200 800 1400 1800 400 600 1000 1200 1600 0
Cost
Architecture effect
Safety and simplicity effect
$
kWe
Scope
Effect
Innovative reactors
Evolutive reactors
Traditional Reactors
Units
Produced
Technology Trends
Economies of scale benefiting clients & developers

J. Vergara
Power
Unit Cost
Vessels/unit
Constr. time
Plant type
Ocupation
Effects
4 x 300 MW
1500 MM$/#
1
2-3 years
Standardized
Income
Learning
1200 MW
5000 MM$
6
5-6 years
Specific
Interests
Little
Technology Trends
Economies of scale benefiting clients & developers

J. Vergara
2028 2026 2024 2018 2016 2022 2020
4000
2000
0
-2000
M US$
2030
Año
Technology Trends
Economies of scale benefiting clients & developers

J. Vergara
Gen IV reactors offer improvements in some areas
Science
Fiction
1950 1970 1990 2010 2030 2050 2070
Year
Commercial
Reactors
Advanced
Reactors
Advanced
Concepts
Proto-
types
Generation I
Generation II
Generation III, III+
Generation IV
Fusion
VVER, CANDU,
PWR, MAGNOX,
RBMK, BWR
EPR, mPower,,
AP1000, WSMR
APR1400,…..
LFR, VHTR,
SCWR, MFR,
SFR, MSR,...
Obninsk, Calder Hall,
Shippingport, STR-I,...
1960 1980 2000 2020 2040 2060
DEMO, PROTO
2080
Technology Trends
Advanced
Concepts
Generation IV
LFR, VHTR,
SCWR, MFR,
SFR, MSR,...
Gen V ??
ATW, HYPER,…

J. Vergara
Key: design more economical nuclear systems
Ref: Breakthrough LWRG3 HTGR SaltTR SCWR Na-FR Pb-FR GC-FR MS-FR
SAFE
TY
Low pressure no no yes no yes no yes yes
Resistent FAs no yes yes si yes yes yes yes
Safe coolant yes yes yes no no no yes yes
Natural conv. yes yes yes no yes yes no yes
MO
DU
LA-
RIT
Y Components yes yes yes no yes no yes no
Reactor no no no no yes no no no
Lower size. yes no yes no yes no no no
EFICIENCY 36% 45% 46% 45% 40% 45% 48% 50%
MA
DU
RIT
Y Prototype yes yes yes no yes yes no yes
Demonstrator no no no no yes no no no
Off-the-shelf yes yes yes no no no no no
Increm. R&D yes no yes no yes no no no
Technology Trends

J. Vergara
Radiotoxicidad (Sv/a) por TWeh 1012
1011
1010
1009
1007
1005
1008
1006
100 101 102 103 105 104 106 107
Años
Reciclaje múltiple MOX
Ciclo Abierto en LWR
LWR y FR MIX con Am y Cm
Reciclaje único y MIX en LWR
LWR y FR quemando Pu
FR con Pu
FR con Pu REF: NATU
116.6 tU
MOX
ADS Pyro Repo-
sitory
Fabri-
cation
Fabri-
cation
Reprocess
and mixing
LWR
ISF
MOX
NSF
Pu + AM
Pu E
Further reactor designs and advanced fuel cycles
Technology Trends

Conclusions
J. Vergara
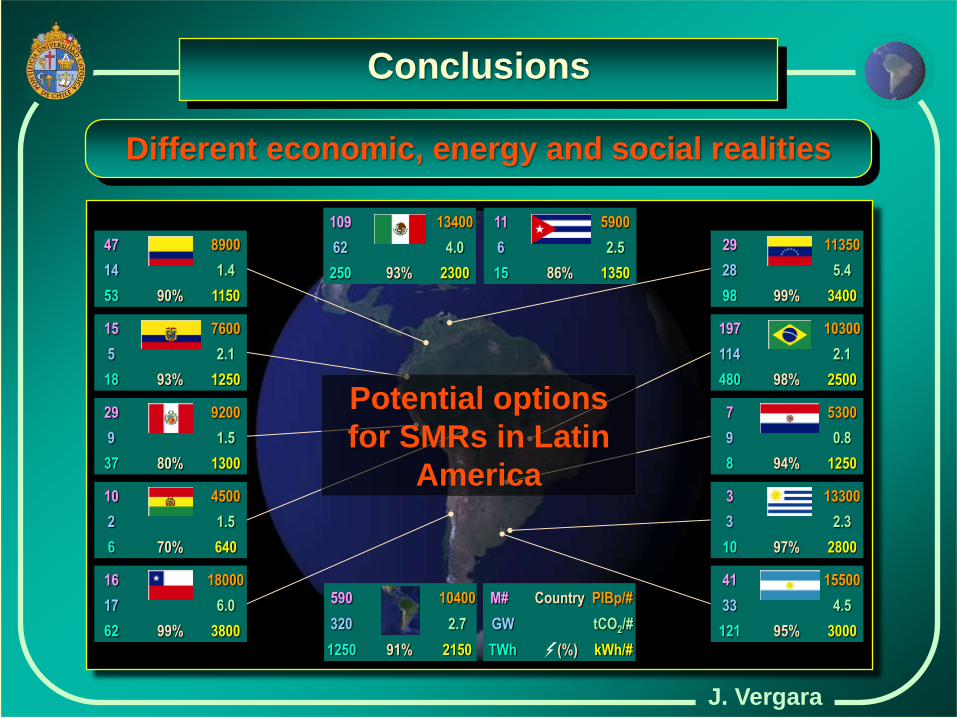
Country M# PIBp/#
tCO2/#
(%)
GW
TWh kWh/#
47 8900
90%
1.4
1150 53
14
15 7600
93%
2.1
1250 18
5
29 9200
80%
1.5
1300 37
9
10 4500
70%
1.5
640 6
2
16 18000
99%
6.0
3800 62
17
29 11350
99%
5.4
3400 98
28
197 10300
98%
2.1
2500 480
114
7 5300
94%
0.8
1250 8
9
3 13300
97%
2.3
2800 10
3
41 15500
95%
4.5
3000 121
33
109 13400
93%
4.0
2300 250
62
11 5900
86%
2.5
1350 15
6
590 10400
91%
2.7
2150 1250
320
Different economic, energy and social realities
Conclusions
Potential options
for SMRs in Latin
America

J. Vergara
Potential options for SMRs in Latin America
Conclusions
Country Option Possibilities in the nuclear field
Argentina Active Current, in addition to Large reactors
Colombia Unknown Possibly beyond 2040-50
Chile Unknown Possibly beyond 2020
Brasil Active SMRs in subs, but focus in large reactors
México Unknown Focus in large-sized reactors
Perú Unknown Possibly beyond 2030
J. Vergara
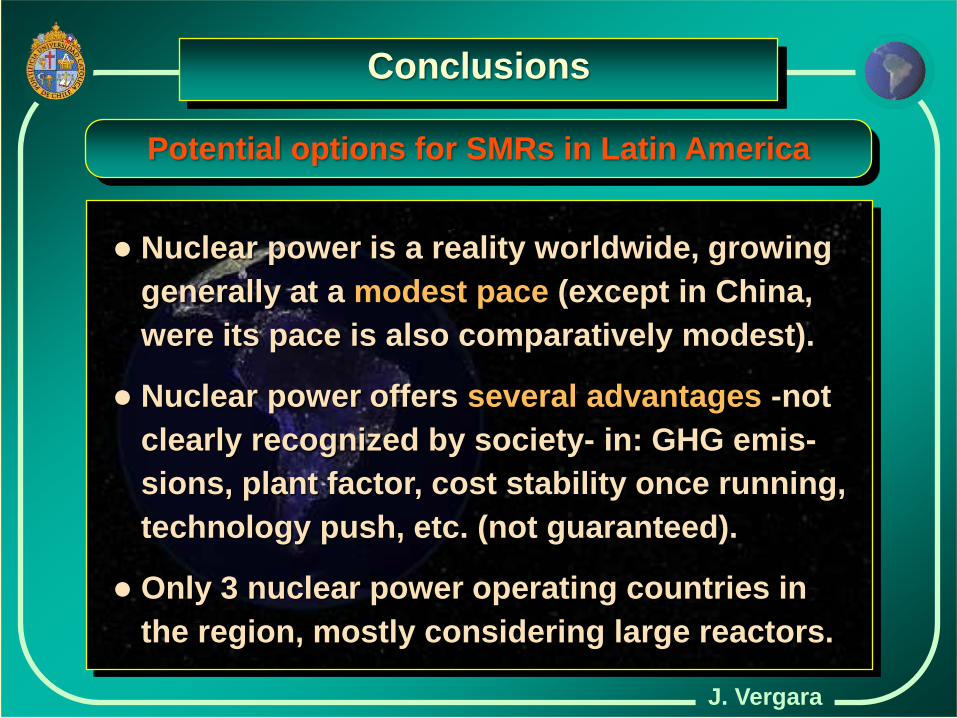
Nuclear power is a reality worldwide, growing
generally at a modest pace (except in China,
were its pace is also comparatively modest).
Nuclear power offers several advantages -not
clearly recognized by society- in: GHG emis-
sions, plant factor, cost stability once running,
technology push, etc. (not guaranteed).
Only 3 nuclear power operating countries in
the region, mostly considering large reactors.
Conclusions
Potential options for SMRs in Latin America

J. Vergara
However, the bet is in renewable energies, that
has grown from 60 to 600 GW in a decade and
will double the nuclear capacity by 2020.
Nuclear power is stagnant in 370 MW and it is
not known whether it will stay, raise or decline.
SMRs may restore confidence in nuclear tech-
nology as it reduces some of the fears brought
by society about conventional nuclear power.
Conclusions
Potential options for SMRs in Latin America
J. Vergara
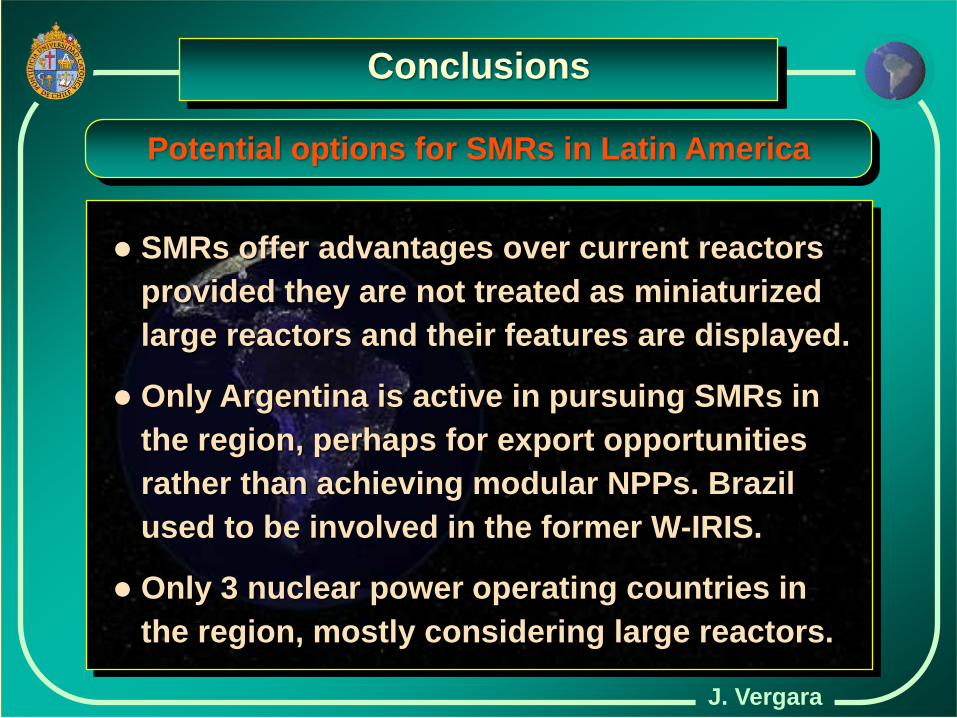
SMRs offer advantages over current reactors
provided they are not treated as miniaturized
large reactors and their features are displayed.
Only Argentina is active in pursuing SMRs in
the region, perhaps for export opportunities
rather than achieving modular NPPs. Brazil
used to be involved in the former W-IRIS.
Only 3 nuclear power operating countries in
the region, mostly considering large reactors.
Conclusions
Potential options for SMRs in Latin America

J. Vergara
It is hoped that SMRs will be selected, in the
same fashion renewables are today, based on:
Capital intensity and associated risks.
Overlapped cash flow profile and chance of
cooperative agreements with communities.
Reactor stealth for reduced exposition.
Enhanced safety and resilience to accidents
if they occurred, for public acceptability.
New energy services (hydrogen, heat, water).
Conclusions
Potential options for SMRs in Latin America

PhD, Nuclear Materials, MIT; MBA, UAI; MSc, Nuclear
Engineering, MIT; MSc, Naval Architecture & Marine
Engineering, MIT; MSc Materials Engineering, MIT;
Naval Engineer and BSc in naval Engineering, APN.
Professor of Sustainable Energy, Nuclear Engine-
ering, and Design, PUC; former Professor of Mana-
gement of technology and Innovation, UDD & UAI.
Listed in Marquis´ “Who´s Who in the World” and
“Who´s Who in Science and Engineering”. Former
Consultant to the IAEA. Board Member, CCHEN.
Speaker: Julio Vergara Aimone