Embed Size (px)
Citation preview
Slide 1Slide 1Slide 1Slide 1Slide 1Slide 1Slide 1
CHAPTER 7: COMMUNITY ECOLOGY
STRUCTURESPECIES INTERACTION
SUCCESSIONSUSTAINABILITY
Slide 2Slide 2Slide 2Slide 2Slide 2Slide 2Slide 2
COMMUNITIES AND STRUCTURE
ISLAND BIOGEOGRAPHY
SPECIES TYPES IN COMMUNITIES
SPECIES INTERACTIONS
PLANT SUCCESSION
STABILITY AND DISTURBANCE
TOPICS AND CONCEPTS CHAPTER 7

Slide 3Slide 3Slide 3Slide 3Slide 3Slide 3Slide 3
COMMUNITY STRUCTURE
Structure can be thought of as:Physical – for example the diameter of trees, canopy cover and layers of vegetation or tree partitioning by various animal species such as finches.Spatial patterns – populations dispersed randomly, clumped or uniformly.Biodiversity
Abundance - the number of individuals of a species in an areaRichness - the number of different species in an area which is a
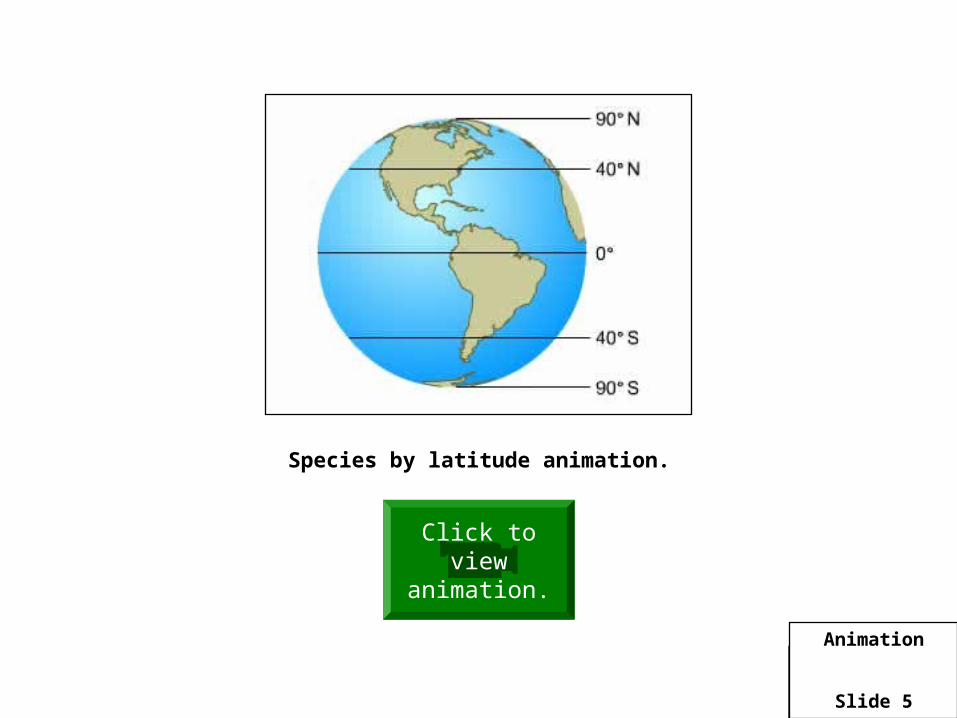
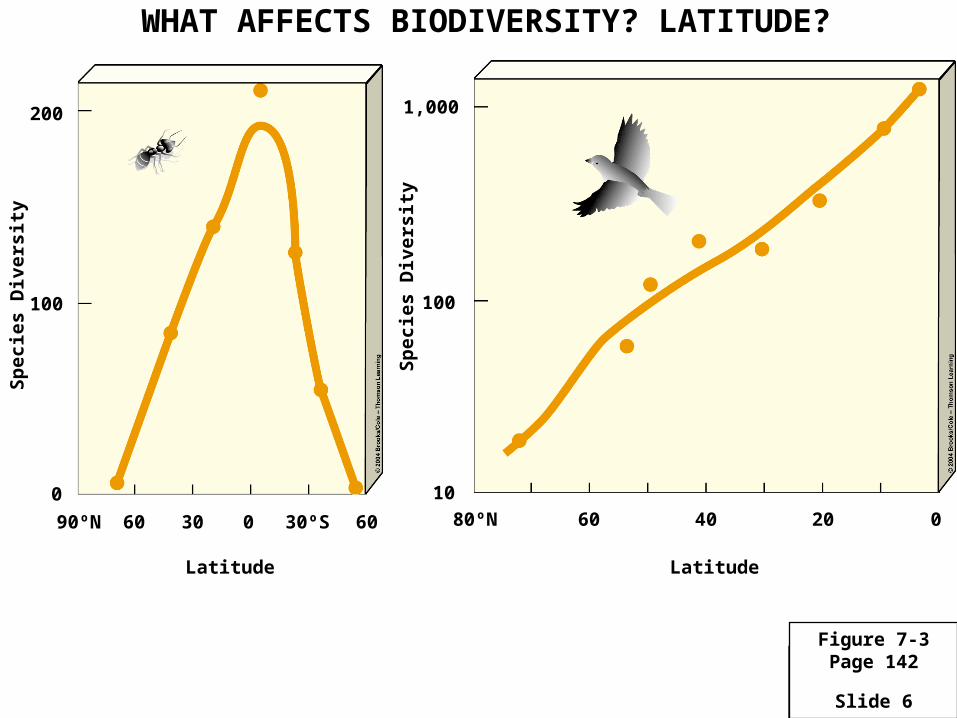
useful measure of the variety of ecological niches or genetic variation in a community. It decreases as we go from the equator towards the poles
Genetic – gene frequency; number of alleles, etc.Habitat changes – frequency of habitat changes through a fixed distanceTrophic level complexity – number of food chains (webs) in a systemNumber and types of services provided by natural capital – for example water purificationProductivity (discussed in chapter 4, pp. 79-81)

Slide 4Slide 4Slide 4Slide 4Slide 4Slide 4Slide 4
mft
10
50
20
30100
Tropicalrain forest
Coniferousforest
Deciduousforest
Thornforest
Tall-grassprairie
Short-grassprairie
Desertscrub
Thornscrub
Figure 7-2Page 141
COMPARISON OF PHYSICAL STRUCTURE OF THE WORLD'S TERRESTRIAL BIOMES
Slide 5Slide 5Slide 5Slide 5Slide 5Slide 5Slide 5
Click to view animation.
Species by latitude animation.
Animation
Slide 6Slide 6Slide 6Slide 6Slide 6Slide 6Slide 6
Figure 7-3Page 142
Sp
ecie
s D
iver
sity
Sp
ecie
s D
iver
sity
1,000
100
10
Latitude
80ºN 60 40 20 0
200
100
0
90ºN 60 30 0 30ºS 60
Latitude
WHAT AFFECTS BIODIVERSITY? LATITUDE?

Slide 7Slide 7Slide 7Slide 7Slide 7Slide 7Slide 7Number of individuals per diatom species
Nu
mb
er o
f d
iato
m s
pec
ies Unpolluted
stream
Pollutedstream
Figure 7-4Page 142
HOW DOES POLLUTION AFFECT DIVERSITY?
Slide 8Slide 8Slide 8Slide 8Slide 8Slide 8Slide 8
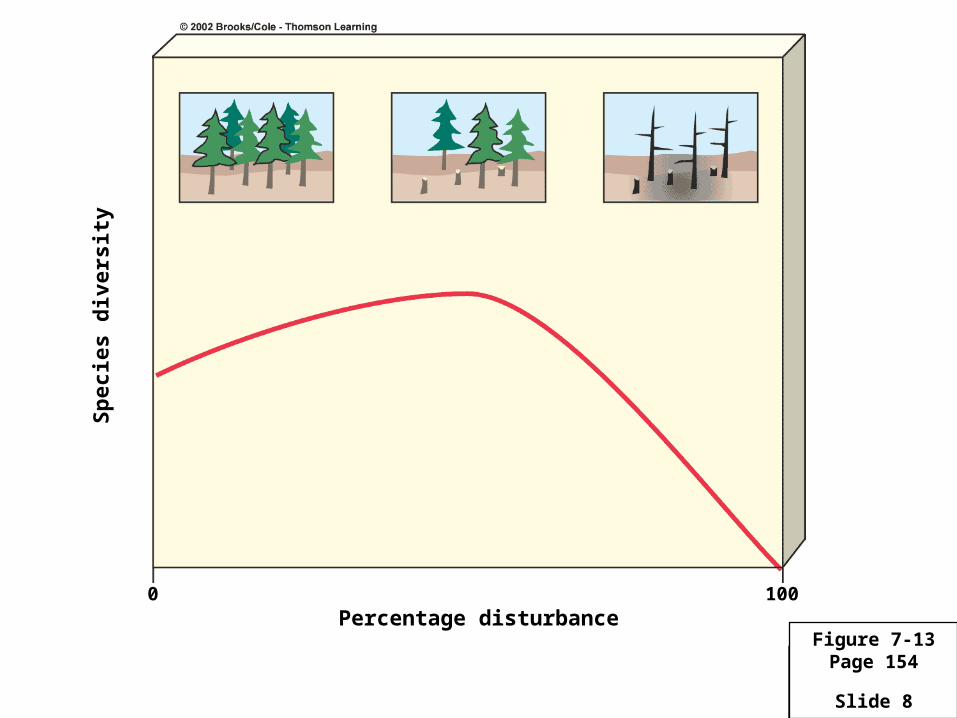
1000Percentage disturbance
Sp
ecie
s d
iver
sity
Figure 7-13Page 154

Slide 9Slide 9Slide 9Slide 9Slide 9Slide 9Slide 9
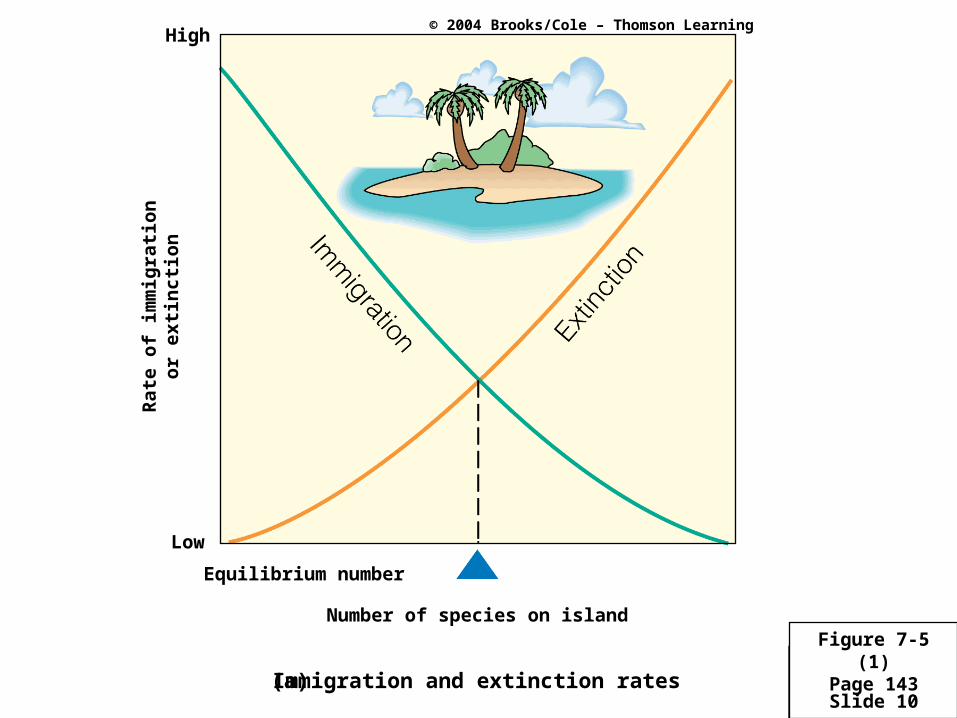
• THEORY OF ISLAND BIOGEOGRAPHY – diversity of isolated area is a function of:– Factors that influence diversity on islands are:
• Size
• Degree of isolation (distance from mainland)
• Age of island
– Species reach equilibrium where immigration rate equals extirpation rate (not extinction!!!)
– Galapagos are a classic example of this. San Juans follow this model. What about the Hawaiian Island chain?
Slide 10Slide 10Slide 10Slide 10Slide 10Slide 10Slide 10
High
Low
Rat
e o
f im
mig
rati
on
or
exti
nct
ion
Equilibrium number
Immigration and extinction rates
Number of species on island
(a)
Figure 7-5 (1)Page 143
© 2004 Brooks/Cole – Thomson Learning

Slide 11Slide 11Slide 11Slide 11Slide 11Slide 11Slide 11
High
Low
Rat
e o
f im
mig
rati
on
or
exti
nct
ion
Small island
Effect of island size
Number of species on island
(b)
Large island
Figure 7-5 (2)Page 143
© 2004 Brooks/Cole – Thomson Learning
Slide 12Slide 12Slide 12Slide 12Slide 12Slide 12Slide 12
High
Low
Rat
e o
f im
mig
rati
on
or
exti
nct
ion
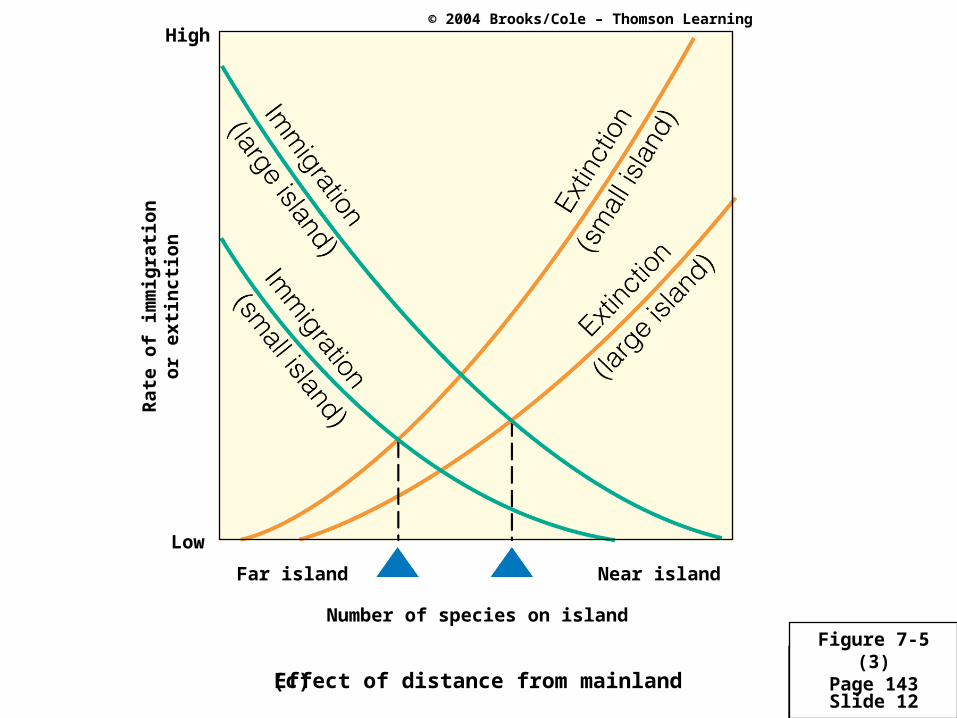
Far island
Effect of distance from mainland
Number of species on island
(c)
Near island
Figure 7-5 (3)Page 143
© 2004 Brooks/Cole – Thomson Learning

Slide 13Slide 13Slide 13Slide 13Slide 13Slide 13Slide 13
Click to view animation.
Animation
Area and distance effects interaction.

Slide 14Slide 14Slide 14Slide 14Slide 14Slide 14Slide 14
• SPECIES TYPES IN COMMUNITIES– Keystone (flying fox)
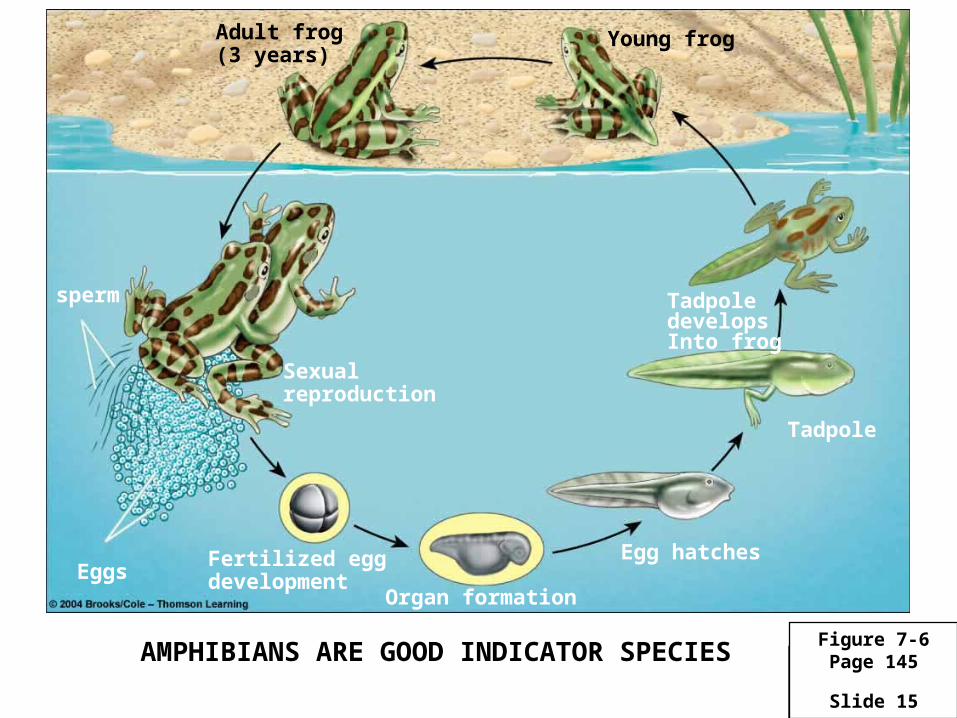
– Indicator (amphibians)
– Exotic or invasive (Himalayan blackberry)
– Top predator (killer whales, lions, wolves)
Slide 15Slide 15Slide 15Slide 15Slide 15Slide 15Slide 15
Figure 7-6Page 145
sperm
Eggs
Sexualreproduction
Fertilized eggdevelopment
Organ formation
Egg hatches
Tadpole
TadpoledevelopsInto frog
Young frogAdult frog(3 years)
AMPHIBIANS ARE GOOD INDICATOR SPECIES
Slide 16Slide 16Slide 16Slide 16Slide 16Slide 16Slide 16
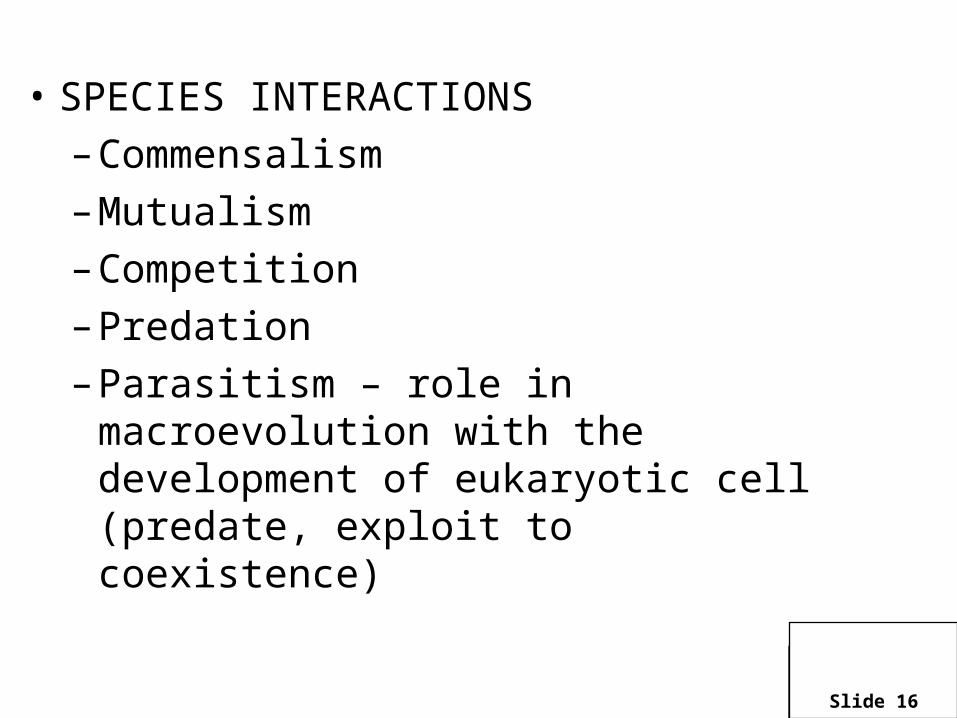
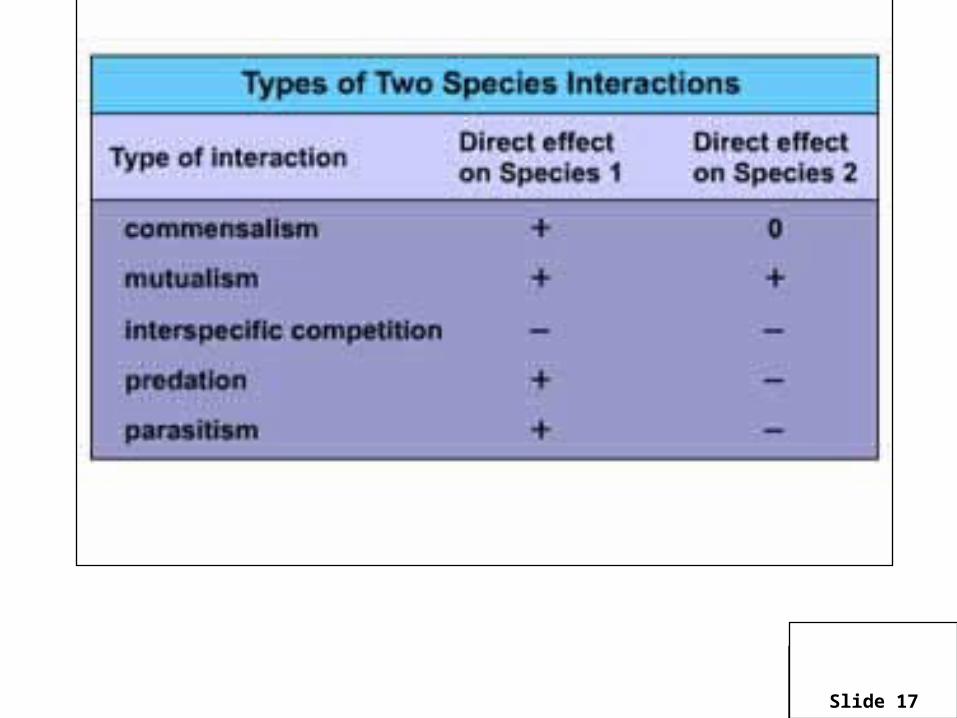
• SPECIES INTERACTIONS
– Commensalism
– Mutualism
– Competition
– Predation
– Parasitism – role in macroevolution with the development of eukaryotic cell (predate, exploit to coexistence)
Slide 17Slide 17Slide 17Slide 17Slide 17Slide 17Slide 17

Slide 18Slide 18Slide 18Slide 18Slide 18Slide 18Slide 18
Nu
mb
er o
f in
div
idu
als
Nu
mb
er o
f in
div
idu
als
Resource use
Resource use
Species 1 Species 2
Regionof
niche overlap
Species 1 Species 2
Figure 7-7Page 147
© 2004 Brooks/Cole – Thomson Learning
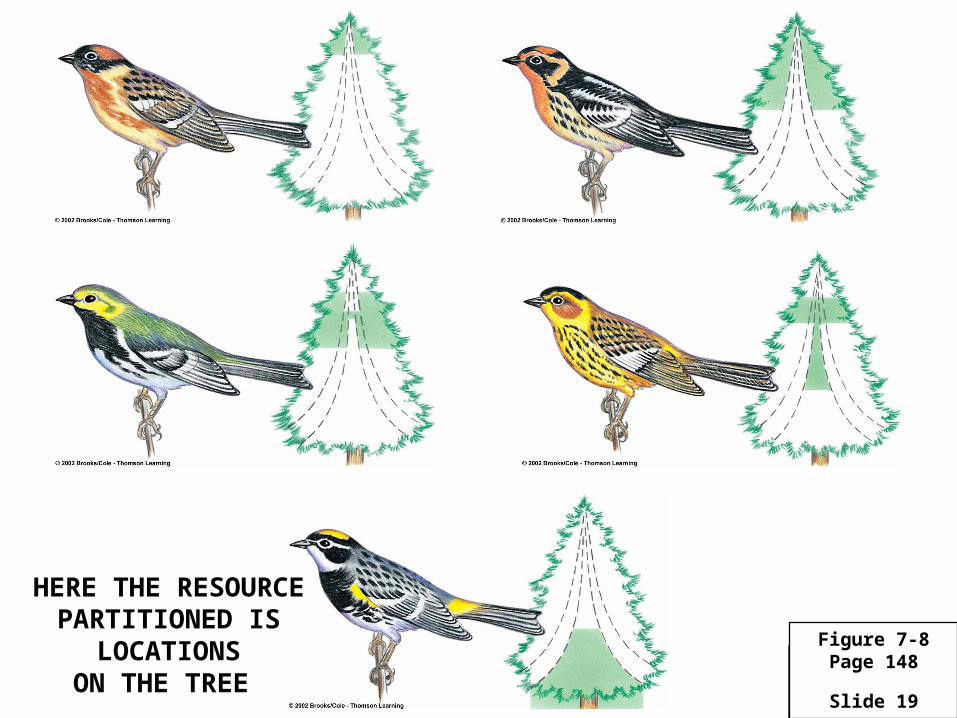
COMPETITION LEADS TO RESOURCE PARTITIONING
Slide 19Slide 19Slide 19Slide 19Slide 19Slide 19Slide 19
Figure 7-8Page 148
HERE THE RESOURCEPARTITIONED IS
LOCATIONSON THE TREE

Slide 20Slide 20Slide 20Slide 20Slide 20Slide 20Slide 20
Span worm Bombardier beetle
Viceroy butterfly mimicsmonarch butterfly
Foul-tasting monarch butterfly
Poison dart frog When touched, the snake caterpillar changes shape to look like the head of a snake
Figure 7-9Page 150
Wandering leaf insect
Hind wings of io mothresemble eyes of a much larger animal
DIFFERENT TYPES OF MIMICRY TO AVOID PREDATORS
MIMICRY IS LOOKING OR ACTING LIKE OTHER SPECIESTO AVOID BEING EATEN. 2 TYPES ARE
MULLERIAN AND BATESIAN
Slide 21Slide 21Slide 21Slide 21Slide 21Slide 21Slide 21
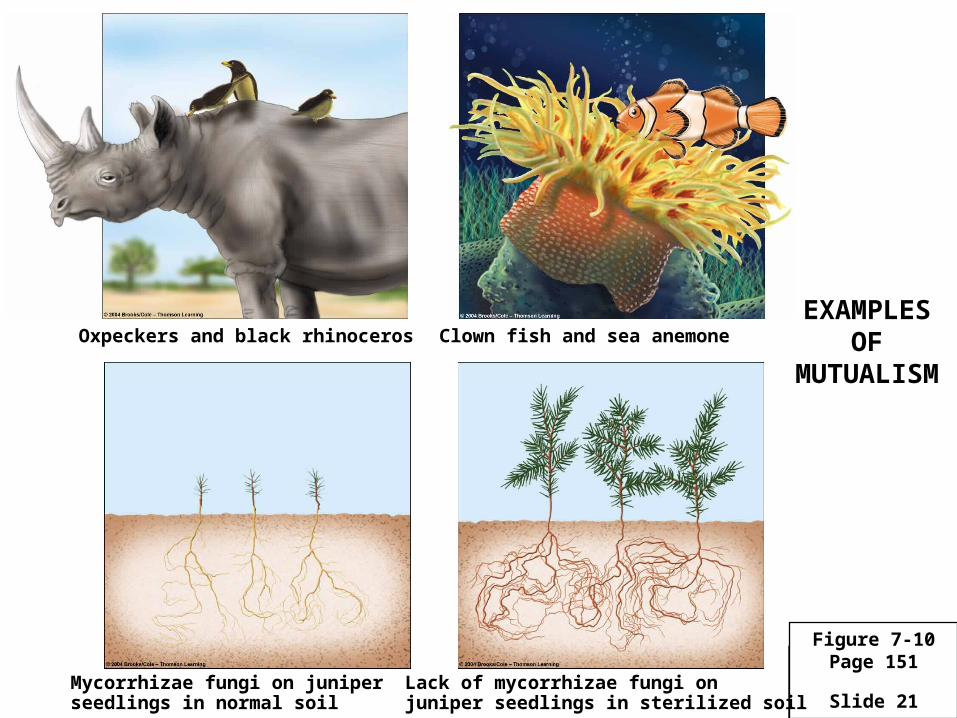
Figure 7-10Page 151
Oxpeckers and black rhinoceros Clown fish and sea anemone
Mycorrhizae fungi on juniper seedlings in normal soil
Lack of mycorrhizae fungi on juniper seedlings in sterilized soil
EXAMPLES OF
MUTUALISM
Slide 22Slide 22Slide 22Slide 22Slide 22Slide 22Slide 22
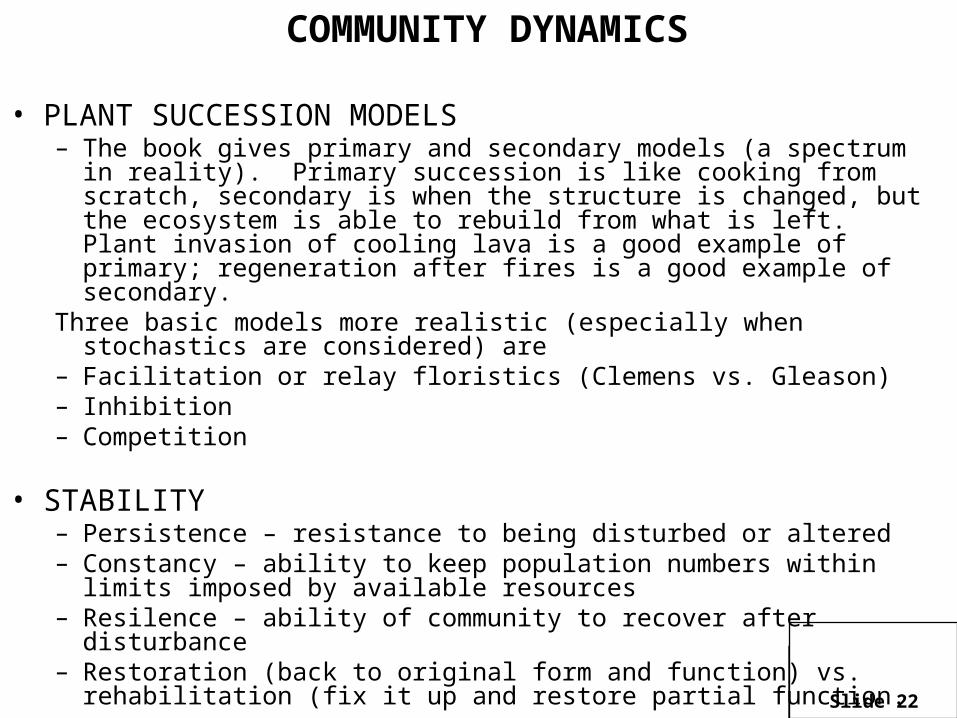
COMMUNITY DYNAMICS
• PLANT SUCCESSION MODELS– The book gives primary and secondary models (a spectrum in reality). Primary
succession is like cooking from scratch, secondary is when the structure is changed, but the ecosystem is able to rebuild from what is left. Plant invasion of cooling lava is a good example of primary; regeneration after fires is a good example of secondary.
Three basic models more realistic (especially when stochastics are considered) are– Facilitation or relay floristics (Clemens vs. Gleason)– Inhibition– Competition
• STABILITY– Persistence – resistance to being disturbed or altered– Constancy – ability to keep population numbers within limits imposed by
available resources– Resilence – ability of community to recover after disturbance– Restoration (back to original form and function) vs. rehabilitation (fix it up and
restore partial function.
Slide 23Slide 23Slide 23Slide 23Slide 23Slide 23Slide 23
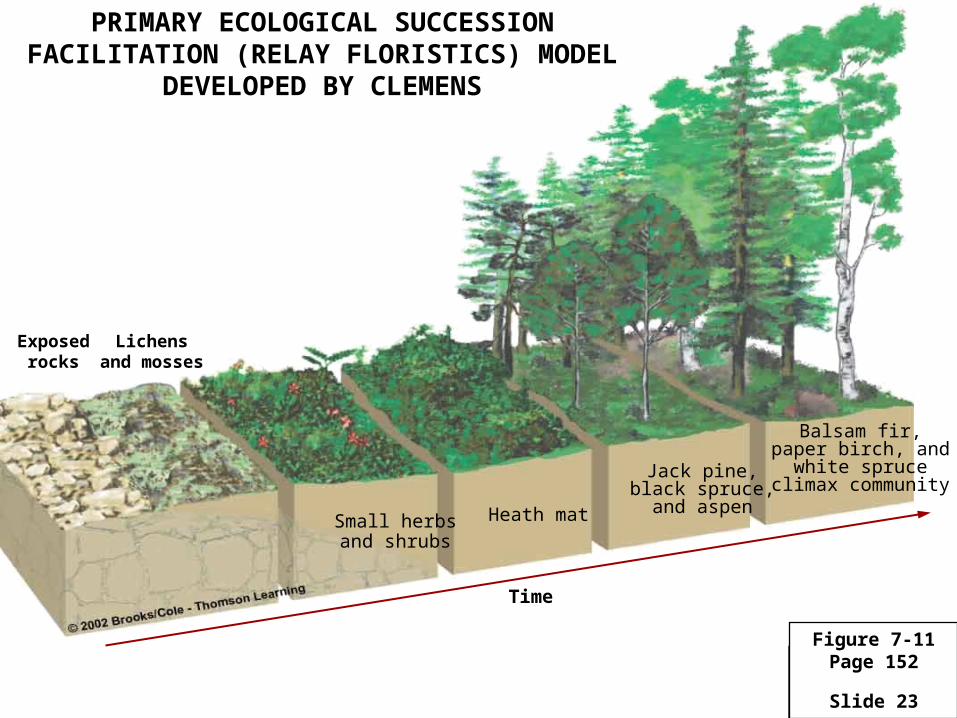
Time
Small herbsand shrubs
Heath mat
Jack pine,black spruce,
and aspen
Balsam fir,paper birch, and
white spruceclimax community
Exposedrocks
Lichensand mosses
Figure 7-11Page 152
PRIMARY ECOLOGICAL SUCCESSIONFACILITATION (RELAY FLORISTICS) MODEL
DEVELOPED BY CLEMENS

Slide 24Slide 24Slide 24Slide 24Slide 24Slide 24Slide 24
Time
Annualweeds
Perennialweeds and
grasses
ShrubsYoung pine forest
Mature oak-hickory forest
Figure 7-12Page 153
SECONDARY ECOLOGICAL SUCCESSION
Slide 25Slide 25Slide 25Slide 25Slide 25Slide 25Slide 25
THIS IS THE END OF CHAPTER 7THE TEST WILL COME FROM THESE LECTURE
SLIDES!!!!!!
USE THE TEXT TO CLEAR UP POINTS OR TOPICS THAT ARE NOT
CLEAR TO YOU. THANKS FOR STUDYING ENVIRNOMENTAL
SCIENCE