Embed Size (px)
Citation preview
Skin Disease Classification versus Skin Lesion Characterization:Achieving Robust Diagnosis using Multi-label Deep Neural Networks
Haofu Liao, Yuncheng Li, Jiebo LuoDepartment of Computer Science, University of Rochester
Rochester, New York 14627, USAEmail: {hliao6, yli, jluo}@cs.rochester.edu
Abstract—In this study, we investigate what a practicallyuseful approach is in order to achieve robust skin diseasediagnosis. A direct approach is to target the ground truthdiagnosis labels, while an alternative approach instead focuseson determining skin lesion characteristics that are more visuallyconsistent and discernible. We argue that, for computer aidedskin disease diagnosis, it is both more realistic and more usefulthat lesion type tags should be considered as the target of anautomated diagnosis system such that the system can first achievea high accuracy in describing skin lesions, and in turn facilitatedisease diagnosis using lesion characteristics in conjunction withother evidences. To further meet such an objective, we employconvolutional neutral networks (CNNs) for both the disease-targeted and lesion-targeted classifications. We have collected alarge-scale and diverse dataset of 75,665 skin disease imagesfrom six publicly available dermatology atlantes. Then we trainand compare both disease-targeted and lesion-targeted classifiers,respectively. For disease-targeted classification, only 27.6% top-1accuracy and 57.9% top-5 accuracy are achieved with a meanaverage precision (mAP) of 0.42. In contrast, for lesion-targetedclassification, we can achieve a much higher MAP of 0.70.
Index Terms—skin disease classification; skin lesion character-ization; convolutional neural networks
I. INTRODUCTION
The diagnosis of skin diseases is challenging. To diagnosea skin disease, a variety of visual clues may be used such asthe individual lesional morphology, the body site distribution,color, scaling and arrangement of lesions. When the individualelements are analyzed separately, the recognition process canbe quite complex [1]. For example, the well studied skincancer, melanoma, has four major clinical diagnosis methods:ABCD rules, pattern analysis, Menzies method and 7-PointChecklist. To use these methods and achieve a satisfactorydiagnostic accuracy, a high level of expertise is required asthe differentiation of skin lesions demands a great deal ofexperience and expertise [2].
Unlike the diagnosis by human experts, which dependsessentially on subjective judgment and is not always repro-ducible, a computer aided diagnostic system is more objectiveand reliable. Traditionally, one can use human-engineered fea-ture extraction algorithms in combination with a classifier tocomplete this task. For some skin diseases, such as melanomaand basal cell carcinoma, this solution is feasible as theirfeatures are regular and predictable. However, when we extendthe skin diseases to a broader range, where the features are socomplex that hand-crafted feature design becomes infeasible,the traditional approach fails.
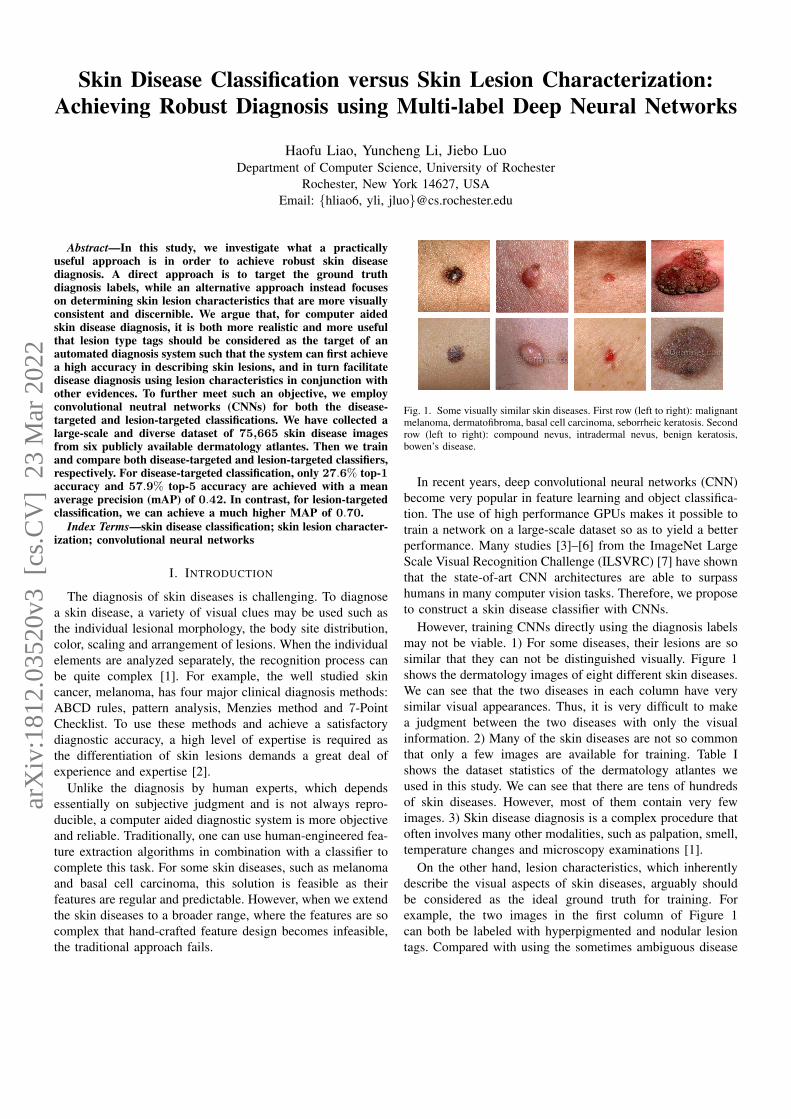
Fig. 1. Some visually similar skin diseases. First row (left to right): malignantmelanoma, dermatofibroma, basal cell carcinoma, seborrheic keratosis. Secondrow (left to right): compound nevus, intradermal nevus, benign keratosis,bowen’s disease.
In recent years, deep convolutional neural networks (CNN)become very popular in feature learning and object classifica-tion. The use of high performance GPUs makes it possible totrain a network on a large-scale dataset so as to yield a betterperformance. Many studies [3]–[6] from the ImageNet LargeScale Visual Recognition Challenge (ILSVRC) [7] have shownthat the state-of-art CNN architectures are able to surpasshumans in many computer vision tasks. Therefore, we proposeto construct a skin disease classifier with CNNs.
However, training CNNs directly using the diagnosis labelsmay not be viable. 1) For some diseases, their lesions are sosimilar that they can not be distinguished visually. Figure 1shows the dermatology images of eight different skin diseases.We can see that the two diseases in each column have verysimilar visual appearances. Thus, it is very difficult to makea judgment between the two diseases with only the visualinformation. 2) Many of the skin diseases are not so commonthat only a few images are available for training. Table Ishows the dataset statistics of the dermatology atlantes weused in this study. We can see that there are tens of hundredsof skin diseases. However, most of them contain very fewimages. 3) Skin disease diagnosis is a complex procedure thatoften involves many other modalities, such as palpation, smell,temperature changes and microscopy examinations [1].
On the other hand, lesion characteristics, which inherentlydescribe the visual aspects of skin diseases, arguably shouldbe considered as the ideal ground truth for training. Forexample, the two images in the first column of Figure 1can both be labeled with hyperpigmented and nodular lesiontags. Compared with using the sometimes ambiguous disease
arX
iv:1
812.
0352
0v3
[cs
.CV
] 2
3 M
ar 2
022
diagnosis labels for these two images, the use of the lesiontags can give a more consistent and precise description of thedermatology images.
In this paper, we investigate the performance of CNNstrained with disease and lesion labels, respectively. We col-lected 75,665 skin disease images from six different publiclyavailable dermatology atlantes. We then train a multi-classCNN for disease-targeted classification and another multi-label CNN for lesion-targeted classification. Our experimentalresults show that the top-1 and top-5 accuracies for the disease-targeted classification are 27.6% and 57.9% with a meanaverage precision (mAP) of 0.42. While for the lesion-targetedskin disease classification, a much higher mAP of 0.70 isachieved.
II. RELATED WORK
Much work has been proposed for computer aided skindisease classification. However, most of them use human-engineered feature extraction algorithms and restrict the prob-lem to certain skin diseases, such as melanoma [8]–[12].Some other works [13]–[15] use CNNs for unsupervisedfeature learning from histopathology images and only focuson the detection of mitosis, an indicator of cancer. Recently,Esteva et al. [16] proposed a disease-targeted skin diseaseclassification method using CNN. They used the dermatologyimages from the Dermnet atlas, one of the six atlantes used inthis study, and reported that their CNN achieved 60.0% top-1accuracy and 80.3% top-3 accuracy. However, they performedthe CNN training and testing on the same dataset withoutcross-validation which makes their results unpersuasive. Apreliminary work [17] of this study has also discovered similarperformances on skin disease classification.
III. DATASETS
We collect dermatology photos from the following derma-tology atlas websites:
• AtlasDerm (www.atlasdermatologico.com.br)• Danderm (www.danderm-pdv.is.kkh.dk)• Derma (www.derma.pw)• DermIS (www.dermis.net)• Dermnet (www.dermnet.com)• DermQuest (www.dermquest.com)
These atlantes are maintained by professional dermatologyresource providers. They are used by dermatologists for train-ing and teaching purpose. All of the dermatology atlanteshave diagnosis labels for their images. For each dermatologyimage only one disease diagnosis label is assigned. We usethese diagnosis labels as the ground truth to train the disease-targeted skin disease classifier.
However, each of the atlas maintains its own skin diseasetaxonomy and naming convention for the diagnosis labels. Itmeans different atlas may have different labels for the samediagnosis and some diagnosis may have several variations. Toaddress this problem, we adapt the skin disease taxonomy usedby the DermQuest atlas and merge the diagnosis labels fromother atlantes into it. We choose the DermQuest atlas because
TABLE IDATASET STATISTICS
Atlas # of Images # of Diagnoses
AtlasDerm 8766 478Danderm 1869 97Derma 13,189 1195DermIS 6588 651Dermnet 21,861 488DermQuest 22,082 657
Total 75,665 2113
of the completeness and professionalism of its dermatologyresources. In most of the cases, the labels for the samediagnoses may have similar naming conventions. Therefore,we merge them by looking at the word or string similarityof two diagnosis labels. We use the string pattern matchingalgorithm described in [18], where the similarity ratio is
S =2 ∗MT
. (1)
Here, M is the number of matches and T is the total number ofcharacters in both strings. The statistics of the merged atlantesis given in Table I. Note that the total number of diagnosesin our dataset is 2113 which is significant higher than anyof the atlas. This is because we use a conservative mergingstrategy such that we merge two diagnosis labels only whentheir string similarity is very high (S > 0.8). Thus, we canmake sure no two diagnosis labels are incorrectly merged.For those redundant diagnosis labels, they only contain a fewdermatology images. We can discard them by choosing athreshold that filters out small diagnosis labels.
For the disease-targeted skin disease classification, wechoose the AtlasDerm, Danderm, Derma, DermIS, andDermnet datasets as the training set and the DermQuest datasetas the test set. Due to the inconsistency of the taxonomy andnaming convention between the atlantes, most of the diagnosislabels have only a few images. As our goal is to investigatethe feasibility of using CNNs for disease-targeted skin diseaseclassification, we remove these noisy diagnosis labels and onlykeep those labels that have more than 300 images. As a resultof the label refinement and cleaning, we have 18,096 imagesin the training set and 14,739 images in the test set. The totalnumber of diagnosis labels is 38.
For the skin lesions, only the DermQuest dataset containsthe lesion tags. Unlike the diagnosis, which is unique foreach image, multiple lesion tags may be associated with adermatology image. There are a total of 134 lesion tags for the22,082 dermatology images from DermQuest. However, mostlesion tags have only a few images and some of the lesion tagsare duplicated. After merging and removing infrequent lesiontags, we retain 23 lesion tags.
Since only the DermQuest dataset has the lesion tags, weuse images from the DermQuest dataset to perform trainingand testing. The total number of dermatology images that havelesion tags is 14,799. As the training and test sets are sampled
from the same dataset, to avoid overfitting, we use 5-foldcross-validation in our experiment. We first split our datasetinto 5 evenly sized, non-overlapping “folds”. Next, we rotateeach fold as the test set and use the remaining folds as thetraining set.
IV. METHODOLOGY
We use CNNs for both the disease-targeted and lesion-targeted skin disease classifications. For the disease-targetedclassification, a multi-class image classifier is trained and forthe lesion-targeted classification, we train a multi-label imageclassifier.
Our CNN architecture is based on the AlexNet [19] and wemodify it according to our needs. The AlexNet architecturewas one of the early wining entry of the ILSVRC challengeswhich is considered sufficient for this study. Readers may referto the latest winning entry (MSRA [20] as of ILSVRC 2015)for better performance. Implementation details of training andtesting the CNNs are given in the following sections.
A. Disease-Targeted Skin Disease Classification
For the disease-targeted skin disease classification, eachdermatology image is associated with only one disease di-agnosis. Hence, we train a multi-class classifier using CNN.We fine-tune the CNN with the BVLC AlexNet model [21]which is pre-trained from the ImageNet dataset [7]. Sincethe number of classes we are predicting is different with theImageNet images, we replace the last fully-connected layer(1000 dimension) with a new fully-connected layer where thenumber of outputs is set to the number of skin diagnoses in ourdataset. We also increase the learning rate of the weights andbias of this layer as the parameters of the newly added layer israndomly initialized. For the loss function, we use the softmaxfunction [22, Chapter 3] and connect a new softmax layer tothe newly added fully-connected layer. Formally put, let zLjbe the the weighted input of the jth neuron of the softmaxlayer, where L is the total number of the layers in the CNN(For AlexNet, L = 9). Thus, the jth activation of the softmaxlayer is
aLj =ez
Lj∑
k ezLk
(2)
And the corresponding softmax loss is
E = − 1
N
N∑n=1
log(aLyn) (3)
where N is the number of images in a mini-batch, yn is theground truth of the nth image and aLyn is the ynth activationof the softmax layer. In the test phase, we choose the label jthat yields the largest activation aLj as the prediction, i.e.
y = arg maxj
aLj . (4)
B. Lesion-Targeted Skin Disease Classification
As we mentioned early, multiple lesion tags may be as-sociated with a dermatology image. Therefore, to classifyskin lesions we need to train a multi-label CNN. Similarto disease-targeted skin disease classification, we fine-tunethe multi-label CNN with the BVLC AlexNet model. Totrain a multi-label CNN, two data layers are required. Onedata layer loads the dermatology images and the other datalayer loads the corresponding lesion tags. Given an imageXn from the first data layer, its corresponding lesion tagsfrom the second data layer are represented as a binary vectorYn = [yn1 , y
n2 , . . . , y
nQ]T where Q is the number of lesions in
our data set and ynj , j ∈ {1, 2, . . . , Q} is given as
ynj =
{1, if the jth label is associated with Xn,0, otherwise.
(5)
We replace the last fully-connected layer of the AlexNet witha new fully-connected layer to accommodate the lesion tagvector. The learning rate of the parameters of this layer isalso increased so that the CNN can learn features of thedermatology images instead of those images from ImageNet.For the multi-label CNN, we use the sigmoid cross-entropy[22, Chapter 3] as the loss function and replace the softmaxlayer with a sigmoid cross-entropy layer. Let the zLj be theweighted input denoted in Section IV-B, then the jth activationof the sigmoid cross-entropy layer can be written as
aLj = σ(zLj ) =1
1 + e−zLj
. (6)
And the corresponding cross-entropy loss is
E = − 1
N
N∑n=1
Q∑j=1
ynj log aLj + (1− ynj ) log (1− aLj ). (7)
For a given image X, the output of the multi-label CNN isa confidence vector C = [aL1 , a
L2 , . . . , a
LQ]T . Here, aLj is the
jth activation of the sigmoid cross-entropy layer. It denotesthe confidence of X being related to the lesion tag j. In thetest phase, we use a threshold function t(X) to determine thelesion tags of the input image X, i.e. Y = [y1, y2, . . . , yQ]T
where
yj =
{1, aLj > t(X),
0, otherwise,j ∈ {1, 2, . . . , Q}. (8)
For the choice of the threshold function t(X), we adapt themethod recommended in [23] which picks a linear function ofthe confidence vector by maximizing the multi-label accuracyon the training set.
V. EXPERIMENTAL RESULTS
In this section, we investigate the performance of the CNNstrained for the disease-targeted and lesion-targeted skin diseaseclassifications, respectively. For both the disease-targeted andlesion-targeted classifications, we use transfer learning [24]
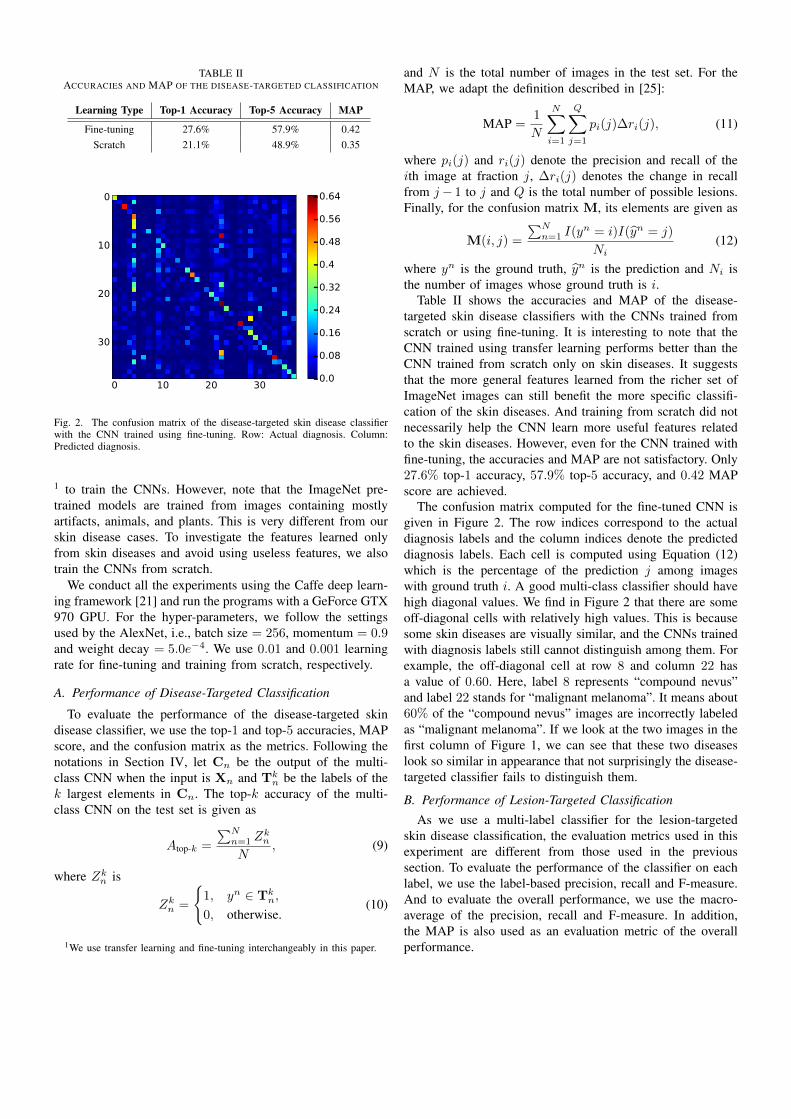
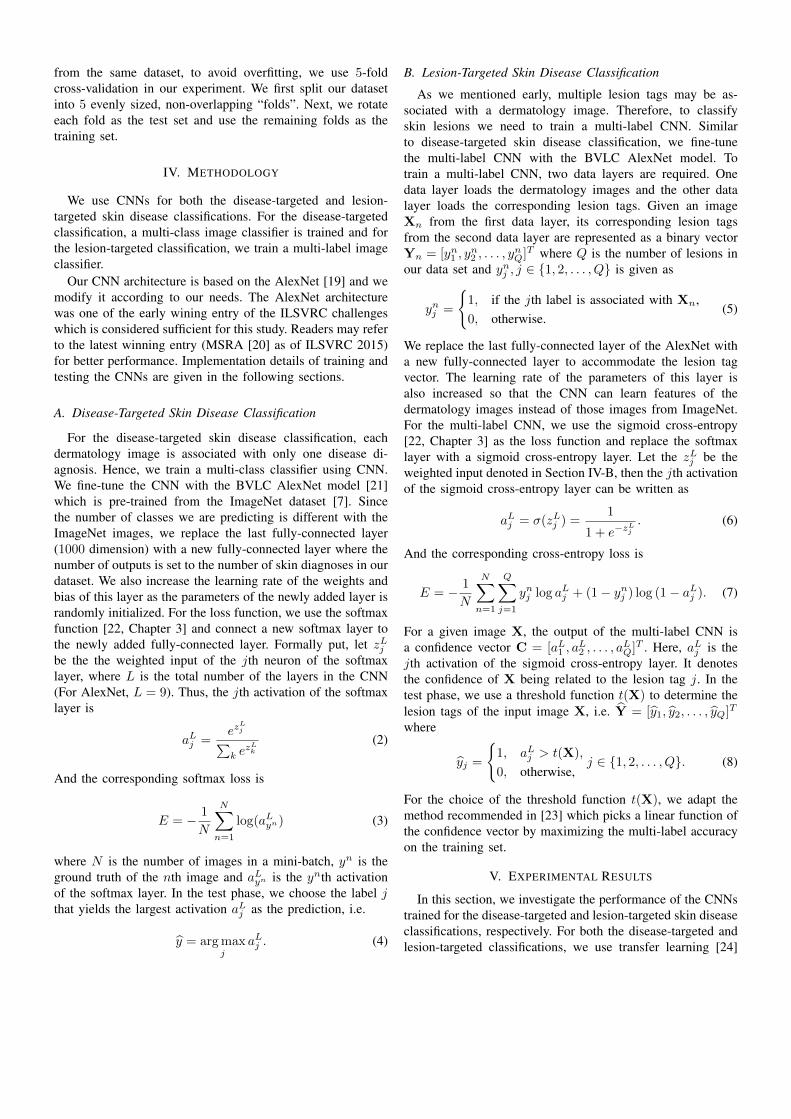
TABLE IIACCURACIES AND MAP OF THE DISEASE-TARGETED CLASSIFICATION
Learning Type Top-1 Accuracy Top-5 Accuracy MAP
Fine-tuning 27.6% 57.9% 0.42Scratch 21.1% 48.9% 0.35
0 10 20 30
0
10
20
30
0.0
0.08
0.16
0.24
0.32
0.4
0.48
0.56
0.64
Fig. 2. The confusion matrix of the disease-targeted skin disease classifierwith the CNN trained using fine-tuning. Row: Actual diagnosis. Column:Predicted diagnosis.
1 to train the CNNs. However, note that the ImageNet pre-trained models are trained from images containing mostlyartifacts, animals, and plants. This is very different from ourskin disease cases. To investigate the features learned onlyfrom skin diseases and avoid using useless features, we alsotrain the CNNs from scratch.
We conduct all the experiments using the Caffe deep learn-ing framework [21] and run the programs with a GeForce GTX970 GPU. For the hyper-parameters, we follow the settingsused by the AlexNet, i.e., batch size = 256, momentum = 0.9and weight decay = 5.0e−4. We use 0.01 and 0.001 learningrate for fine-tuning and training from scratch, respectively.
A. Performance of Disease-Targeted Classification
To evaluate the performance of the disease-targeted skindisease classifier, we use the top-1 and top-5 accuracies, MAPscore, and the confusion matrix as the metrics. Following thenotations in Section IV, let Cn be the output of the multi-class CNN when the input is Xn and Tk
n be the labels of thek largest elements in Cn. The top-k accuracy of the multi-class CNN on the test set is given as
Atop-k =
∑Nn=1 Z
kn
N, (9)
where Zkn is
Zkn =
{1, yn ∈ Tk
n,
0, otherwise.(10)
1We use transfer learning and fine-tuning interchangeably in this paper.
and N is the total number of images in the test set. For theMAP, we adapt the definition described in [25]:
MAP =1
N
N∑i=1
Q∑j=1
pi(j)∆ri(j), (11)
where pi(j) and ri(j) denote the precision and recall of theith image at fraction j, ∆ri(j) denotes the change in recallfrom j− 1 to j and Q is the total number of possible lesions.Finally, for the confusion matrix M, its elements are given as
M(i, j) =
∑Nn=1 I(yn = i)I(yn = j)
Ni(12)
where yn is the ground truth, yn is the prediction and Ni isthe number of images whose ground truth is i.
Table II shows the accuracies and MAP of the disease-targeted skin disease classifiers with the CNNs trained fromscratch or using fine-tuning. It is interesting to note that theCNN trained using transfer learning performs better than theCNN trained from scratch only on skin diseases. It suggeststhat the more general features learned from the richer set ofImageNet images can still benefit the more specific classifi-cation of the skin diseases. And training from scratch did notnecessarily help the CNN learn more useful features relatedto the skin diseases. However, even for the CNN trained withfine-tuning, the accuracies and MAP are not satisfactory. Only27.6% top-1 accuracy, 57.9% top-5 accuracy, and 0.42 MAPscore are achieved.
The confusion matrix computed for the fine-tuned CNN isgiven in Figure 2. The row indices correspond to the actualdiagnosis labels and the column indices denote the predicteddiagnosis labels. Each cell is computed using Equation (12)which is the percentage of the prediction j among imageswith ground truth i. A good multi-class classifier should havehigh diagonal values. We find in Figure 2 that there are someoff-diagonal cells with relatively high values. This is becausesome skin diseases are visually similar, and the CNNs trainedwith diagnosis labels still cannot distinguish among them. Forexample, the off-diagonal cell at row 8 and column 22 hasa value of 0.60. Here, label 8 represents “compound nevus”and label 22 stands for “malignant melanoma”. It means about60% of the “compound nevus” images are incorrectly labeledas “malignant melanoma”. If we look at the two images in thefirst column of Figure 1, we can see that these two diseaseslook so similar in appearance that not surprisingly the disease-targeted classifier fails to distinguish them.
B. Performance of Lesion-Targeted Classification
As we use a multi-label classifier for the lesion-targetedskin disease classification, the evaluation metrics used in thisexperiment are different from those used in the previoussection. To evaluate the performance of the classifier on eachlabel, we use the label-based precision, recall and F-measure.And to evaluate the overall performance, we use the macro-average of the precision, recall and F-measure. In addition,the MAP is also used as an evaluation metric of the overallperformance.
F-mea Recall Precision MAP0.0
0.1
0.2
0.3
0.4
0.5
0.6
0.7Fine-tune
Scratch
Fig. 3. Macro-average of precision, recalls, and F-measures as well as MAP.
Let Yi be the set of images whose ground truth containslesion i and Zi be the set of images whose prediction con-tains lesion i. Then, the label-based and the macro-averagedprecision, recall, and F-measure can be defined as
Pi =|Yi ∩ Zi||Zi|
, Pmacro =1
Q
Q∑i=1
Pi,
Ri =|Yi ∩ Zi||Yi|
, Rmacro =1
Q
Q∑i=1
Ri,
Fi =2|Yi||Zi||Yi|+ |Zi|
, Fmacro =1
Q
Q∑i=1
Fi.
(13)
where Q is the total number of possible lesion tags.Figure 3 shows the overall performance of the lesion-
targeted skin disease classifiers. The macro-average of theF-measure is around 0.55 and the mean average precisionis about 0.70. This is quite good for a multi-label problem.The label-based precisions, recalls, and F-measures are givenin Figure 4. We can see that for the lesion-targeted skindisease classification, the fine-tuned CNN performs better thanthe CNN trained from scratch which is consistent with ourobservation in Table II. It means for the lesion-targeted skindisease classification problem, it is still beneficial to initializewith weights from ImageNet pretrained models. We also seethat the label-based metrics are mostly above 0.5 in the fine-tuning case. Some exceptions are atrophy (0), erythemato-squamous (4), excoriation (6), oozing (15), and vesicle (22).The failures are mostly due to 1) the lesiona not visually salientor masked by other larger lesions, or 2) sloppy labeling of theground truth.
Some failure cases are shown in Figure 5. Image A islabeled as atrophy. However, the atrophic characteristic is notso obvious and it is more like an erythematous lesion. Forimage B, the ground truth is excoriation which is the littlewhite scars on the back. However, the red erythematous lesionis more apparent. So the CNN incorrectly classified it as aerythematous lesion. Similar case can be found in image D.For image C, the ground truth is actually incorrect.
Figure 6 shows the image retrievals using the lesion-targetedclassifier. Here, we take the output of the second to last fully-
connected layer (4096 dimension) as the feature vector. Foreach query image from the test set, we compare its featureswith all the images in the training set and outputs the 5-nearest neighbors (in euclidean distance) as the retrievals. Theretrieved images with green solid frames match at least onelesion tag of the query image. And those images with reddashed frames have no common lesion tags with the queryimage. We can see that the retrieved images are visually andsemantically similar to the query images.
VI. CONCLUSION
In this study, we have showed that, for skin disease classifi-cation using CNNs, lesion tags rather than the diagnosis tagsshould be considered as the target for automated analysis. Toachieve better diagnosis results, computer aided skin diseasediagnosis systems could use lesion-targeted CNNs as thecornerstone component to facilitate the final disease diagnosisin conjunction with other evidences. We have built a large-scale dermatology dataset from six professional photosharingdermatology atlantes. We have trained and tested the disease-targeted and lesion-targeted classifiers using CNNs. Both fine-tuning and training from scratch were investigated in trainingthe CNN models. We found that, for skin disease images,CNNs fine-tuned from pre-trained models perform better thanthose trained from scratch. For the disease-targeted classifi-cation, it can only achieve 27.6% top-1 accuracy and 57.9%top-5 accuracy as well as 0.42 MAP. The corresponding con-fusion matrix contains some high off-diagonal values whichindicates that some skin diseases cannot be distinguished usingdiagnosis labels. For the lesion-targeted classification, a 0.70MAP score is achieved, which is remarkable for a multi-labelclassification problem. Image retrieval results also confirm thatCNNs trained using lesion tags learn the dermatology featuresvery well.
ACKNOWLEDGMENT
We gratefully thank the support from the University, andNew York State through Goergen Institute for Data Science.
REFERENCES
[1] N. Cox and I. Coulson, “Diagnosis of skin disease,” Rook’s Textbook ofDermatology, 7th edn. Oxford: Blackwell Science, vol. 5, 2004.
[2] J. D. Whited and J. M. Grichnik, “Does this patient have a mole or amelanoma?” Jama, vol. 279, no. 9, pp. 696–701, 1998.
[3] P. Sermanet, D. Eigen, X. Zhang, M. Mathieu, R. Fergus, andY. LeCun, “Overfeat: Integrated recognition, localization and detectionusing convolutional networks,” CoRR, vol. abs/1312.6229, 2013.[Online]. Available: http://arxiv.org/abs/1312.6229
[4] S. Ioffe and C. Szegedy, “Batch normalization: Accelerating deepnetwork training by reducing internal covariate shift,” CoRR, vol.abs/1502.03167, 2015. [Online]. Available: http://arxiv.org/abs/1502.03167
[5] C. Szegedy, W. Liu, Y. Jia, P. Sermanet, S. Reed, D. Anguelov,D. Erhan, V. Vanhoucke, and A. Rabinovich, “Going deeper withconvolutions,” CoRR, vol. abs/1409.4842, 2014. [Online]. Available:http://arxiv.org/abs/1409.4842
[6] K. Simonyan and A. Zisserman, “Very deep convolutional networksfor large-scale image recognition,” CoRR, vol. abs/1409.1556, 2014.[Online]. Available: http://arxiv.org/abs/1409.1556

0 5 10 15 20Label
0.1
0.2
0.3
0.4
0.5
0.6
0.7
0.8
0.9
Precisions
Fine-tune
Scratch
(a) Precisions
0 5 10 15 20Label
0.1
0.2
0.3
0.4
0.5
0.6
0.7
0.8
0.9
Recalls
Fine-tune
Scratch
(b) Recalls
0 5 10 15 20Label
0.1
0.2
0.3
0.4
0.5
0.6
0.7
0.8
0.9
F-m
easure
Fine-tune
Scratch
(c) F-measures
Fig. 4. Label-based precisions, recalls, and f-measures
A B C D
Fig. 5. Failure cases. Ground truth (left to right): atrophy, excoriation,hypopigmented, vesicle. Top prediction (left to right): erythematous, erythe-matous, ulceration, edema.
Fig. 6. Images retrieved by the lesion-targeted classifier. Row 1: the queryimages from the test set. Row 2-6: the retrieved images from the training set.Dotted borders annotate errors. Ground truth of the test images from columnA to D: (crust, ulceration), (hyperpigmented, tumour), (scales), (erythematous,telangiectasis), (nail hyperpigmentation, onycholysis), (edema, erythematous).
[7] O. Russakovsky, J. Deng, H. Su, J. Krause, S. Satheesh, S. Ma,Z. Huang, A. Karpathy, A. Khosla, M. Bernstein, A. C. Berg, andL. Fei-Fei, “ImageNet Large Scale Visual Recognition Challenge,”International Journal of Computer Vision (IJCV), vol. 115, no. 3, pp.211–252, 2015.
[8] J. Arroyo and B. Zapirain, “Automated detection of melanoma indermoscopic images,” in Computer Vision Techniques for the Diagnosisof Skin Cancer, ser. Series in BioEngineering, J. Scharcanski and M. E.Celebi, Eds. Springer Berlin Heidelberg, 2014, pp. 139–192. [Online].Available: http://dx.doi.org/10.1007/978-3-642-39608-3 6
[9] F. Xie, Y. Wu, Z. Jiang, and R. Meng, “Dermoscopy image processingfor chinese,” in Computer Vision Techniques for the Diagnosis ofSkin Cancer, ser. Series in BioEngineering, J. Scharcanski and M. E.Celebi, Eds. Springer Berlin Heidelberg, 2014, pp. 109–137. [Online].Available: http://dx.doi.org/10.1007/978-3-642-39608-3 5
[10] G. Fabbrocini, V. Vita, S. Cacciapuoti, G. Leo, C. Liguori, A. Paolillo,A. Pietrosanto, and P. Sommella, “Automatic diagnosis of melanomabased on the 7-point checklist,” in Computer Vision Techniques for theDiagnosis of Skin Cancer, ser. Series in BioEngineering, J. Scharcanskiand M. E. Celebi, Eds. Springer Berlin Heidelberg, 2014, pp. 71–107.[Online]. Available: http://dx.doi.org/10.1007/978-3-642-39608-3 4
[11] A. Saez, B. Acha, and C. Serrano, “Pattern analysis in dermoscopicimages,” in Computer Vision Techniques for the Diagnosis of SkinCancer, ser. Series in BioEngineering, J. Scharcanski and M. E. Celebi,Eds. Springer Berlin Heidelberg, 2014, pp. 23–48. [Online]. Available:http://dx.doi.org/10.1007/978-3-642-39608-3 2
[12] C. Barata, J. Marques, and T. Mendonca, “Bag-of-features classificationmodel for the diagnose of melanoma in dermoscopy images usingcolor and texture descriptors,” in Image Analysis and Recognition, ser.Lecture Notes in Computer Science, M. Kamel and A. Campilho, Eds.Springer Berlin Heidelberg, 2013, vol. 7950, pp. 547–555. [Online].Available: http://dx.doi.org/10.1007/978-3-642-39094-4 62
[13] A. Cruz-Roa, A. Basavanhally, F. Gonzalez, H. Gilmore, M. Feldman,S. Ganesan, N. Shih, J. Tomaszewski, and A. Madabhushi, “Automaticdetection of invasive ductal carcinoma in whole slide images withconvolutional neural networks,” in SPIE Medical Imaging. InternationalSociety for Optics and Photonics, 2014, pp. 904 103–904 103.
[14] H. Wang, A. Cruz-Roa, A. Basavanhally, H. Gilmore, N. Shih, M. Feld-man, J. Tomaszewski, F. Gonzalez, and A. Madabhushi, “Cascadedensemble of convolutional neural networks and handcrafted features formitosis detection,” in SPIE Medical Imaging. International Society forOptics and Photonics, 2014, pp. 90 410B–90 410B.
[15] J. Arevalo, A. Cruz-Roa, V. Arias, E. Romero, and F. A. Gonzalez, “Anunsupervised feature learning framework for basal cell carcinoma imageanalysis,” Artificial intelligence in medicine, 2015.
[16] A. Esteva, B. Kuprel, and S. Thrun, “Deep networks for early stage skindisease and skin cancer classification.”
[17] H. Liao, “A deep learning approach to universal skin disease classifica-tion.”
[18] J. W. Ratcliff and D. E. Metzener, “Pattern matching: The gestaltapproach,” Dr Dobb’s Journal, vol. 13, no. 7, p. 46, 1988.
[19] A. Krizhevsky, I. Sutskever, and G. E. Hinton, “Imagenet classificationwith deep convolutional neural networks,” in Advances in Neural In-formation Processing Systems 25, F. Pereira, C. Burges, L. Bottou, andK. Weinberger, Eds. Curran Associates, Inc., 2012, pp. 1097–1105.
[20] K. He, X. Zhang, S. Ren, and J. Sun, “Deep residual learning for imagerecognition,” arXiv preprint arXiv:1512.03385, 2015.
[21] Y. Jia, E. Shelhamer, J. Donahue, S. Karayev, J. Long, R. Girshick,S. Guadarrama, and T. Darrell, “Caffe: Convolutional architecture forfast feature embedding,” arXiv preprint arXiv:1408.5093, 2014.
[22] M. A. Nielsen, Neural Networks and Deep Learning. DeterminationPress, 2015.
[23] M.-L. Zhang and Z.-H. Zhou, “Multilabel neural networks with applica-tions to functional genomics and text categorization,” IEEE Transactions

on Knowledge and Data Engineering, vol. 18, no. 10, pp. 1338–1351,Oct 2006.
[24] J. Yosinski, J. Clune, Y. Bengio, and H. Lipson, “How transferable arefeatures in deep neural networks?” CoRR, vol. abs/1411.1792, 2014.
[Online]. Available: http://arxiv.org/abs/1411.1792
[25] M. Zhu, “Recall, precision and average precision,” Department ofStatistics and Actuarial Science, University of Waterloo, vol. 2, 2004.
![LI ET AL.: SEMI-SUPERVISED SKIN LESION SEGMENTATION …dermoscopy images [14,18]. For example, Jaisakthi et al. [14] proposed a semi-supervised skin lesion segmentation method using](https://img.dokumen.tips/doc/110x75/60658319b2024701434d8eca/li-et-al-semi-supervised-skin-lesion-segmentation-dermoscopy-images-1418-for.jpg)