Embed Size (px)
Citation preview

Article
Size Effect on the Elastic Mechanical Properties ofBeech and Its Application in Finite Element Analysisof Wood Structures
Wengang Hu 1,2 , Hui Wan 3 and Huiyuan Guan 1,2,*1 Co-Innovation Center of Efficient Processing and Utilization of Forest Resources, Nanjing Forestry
University, Nanjing 210037, China2 College of Furnishings and Industrial Design, Nanjing Forestry University, Nanjing 210037, China3 Department of sustainable Bioproducts, Mississippi State University, Mississippi State, MS 39762-9820, USA* Correspondence: [email protected]; Tel.: +86-15077872795
Received: 7 August 2019; Accepted: 30 August 2019; Published: 9 September 2019�����������������
Abstract: Elastic constants of wood are fundamental parameters used in finite element analysis ofwood structures. However, few studies and standards regulate the dimensions of sample used tomeasure elastic constants of wood. The size effect on mechanical properties (i.e., elastic constants andproportional limit stresses) of European beech (Fagus sylvatica L.) wood was studied with five differentsizes samples. The data of experiments were inputted into a finite element model of self-designed chairand the loading capacity of chair was investigated by finite element method (FEM) and experiment.The results showed that nonlinear relationships were found between proportional limit stresses,cross-sectional area, and height of specimen by response surface method with R2 greater than 0.72 inlongitudinal, radial, and tangential directions. Elastic moduli and shear moduli increased with theheight of specimen when cross-sectional area was kept constant, and decreased with an increasedcross-sectional area of specimen, when the height was a constant, while the trends of Poisson’s ratiowere not as expected. The comparisons between experiment and FEM suggested that the accuracy ofFEM simulation increase with the raise of width-height ratio (≤1) of specimens used to determinethe elastic constants. It is recommended to use small cubic wood specimen to determine the elasticmechanical properties used for finite element analysis of beech wood structures. Further research tofind optimized wood specimen dimensions to get mechanical properties for FEM is quite necessary.
Keywords: size effect; elastic constants; European beech wood; finite element analysis;wood constructions
1. Introduction
The influence of size on strength is well-known for various materials and testing methods, but notenough data and knowledge of the effect on wood elastic mechanical properties under compressionwere studied [1], such as proportional limits and elastic constants. The elastic mechanical propertiesare basic characteristics of wood that play an important role in wood construction and engineeringdesign. Elastic constants and proportional limit strength of wood are prerequisites for establishingthe numerical model of wood products and wooden constructions. However, there is no standardto regulate the method of measuring the elastic constants of wood, which leads researchers to usedifferent methods and different dimensions of specimens to determine them. This may not help thedevelopment of wood science and technology profession.
Among different methods, the method of electric resistance strain gauge is widely used inmeasuring the elastic constants of wood. Nonetheless, there is no standard to be referred to, especiallythe dimensions of so-called small clear specimen, for the test, which causes inconsistent results of
Forests 2019, 10, 783; doi:10.3390/f10090783 www.mdpi.com/journal/forests

Forests 2019, 10, 783 2 of 13
elastic constants determined by different sizes of specimens [2]. Generally, the dimensions of woodblocks used to determine the elastic constants were 20 × 20 × 30 mm (length ×width × height) [3–5],20 × 20 × 60 mm [6,7], and 30 × 30 × 60 mm [8,9]. Nevertheless, Liu et al. [10] determined the 12 elasticconstants of larch forest using the specimens referring to ASTM D1990 [11] with 25 × 25 × 100 mmspecimens for longitudinal compression and 50 × 50 × 150 mm specimens for transverse compression.
It is known that the size effect causes the mechanical properties of wood not to be constant,but variables with changes of dimensions of specimens. Best known in wood science is the weakestlink theory (WLT), formulated and experimentally verified by Weibull based on the theory of perfectlybrittle materials, which fails at the initiation of macro-cracking [1]. Many studies have been reportedon size effect on wood mechanical properties. For example, the size effect on bending strength of woodhas been studied. Straže and Gorišek [12] determined the modulus of bending elasticity MOE (stat)and maximum bending strength by the three-point bending method and showed varying results ofsquared cross-section (a = 20...45...70 mm) of the same specimens. Free-free flexural vibration tests werecarried out additionally to determine dynamic modulus of elasticity (MOE (dyn)). Results showed thata positive and strong correlation existed between MOE (stat) and MOE (dyn) at larger wood members(a > 45 mm). Clear wood specimens are suggested to be used at mechanical testing of small-sizewood. Madsen and Tomoi [13] studied the size effect on the bending strength of spruce (Picea sp.A. Dietr.), pine (Pinus sp. L.) and fir (Abies sp. Mill.). Their results indicated that the length effects werevery pronounced, while thickness did not affect the strength quality. Zhou et al. [14] investigated thedependence between the flexural strength and the size of Chinese fir (Cunninghamia lanceolata (Lamb.)Hook.). Their results showed that the length size effects by the slope method [15] were 0.43 and 0.33,respectively for 5th and 50th percentiles of flexural strength that were higher than the foreign studyresults [16,17] and the specified value (0.14) in ASTM D1990 [11]. Fotsing and Foudjet [18] studiedthe size effect of two Cameroonian hardwoods in compression and bending strength parallel to thewood grain. The behavior of wood at failure was modeled by the Weibull’s law of three parameters forcompression and of two parameters for bending. Their experiments have been conducted to determineall the Weibull’s law parameters. Zauner and Niemz [1] also determined the influences of the samplessize on the compression strength and deformation of Norway spruce (Picea abies (L.) Karst.) wood.Their results showed the existence of a possible size effect during compression, while digital imagecorrelation illustrated the expected differences in deformation due to the shape and dependence ofthe strain distribution on the structure of wood. Zhou et al. [19] investigated the effect of size onthe bending, tensile and compression strength of Chinese larch (Larix gmelinii K.) lumber by usingnonparametric estimates method. The results showed that the size effect on bending strength, tensilestrength parallel to the grain and compression strength parallel to the grain were significant.
Other researchers studied the size effect on wood strength at the micro-scale. Yu et al. [20]measured the longitudinal MOE of Chinese fir on sections ranging in thickness from 70 to 200 µmand compared the MOE data with the values of normal size (10 × 10 × 10 mm) samples. Their resultsindicated that the MOE of wood sections increased with thickness from 70 to 200 µm, which wassignificantly smaller than that of the normal size samples. A size effect coefficient of 2.63 was inferredbased on statistical data for normal size samples and 200 µm thick sections. Karakoc and Freund [21]presented a simulation model comprising an input generation method, micromechanical model,and a method minimizing the boundary artifacts through micropolar elasticity. They conductedsimulation experiments to understand the size effect and measurement domain selection on thein-plane elasticity of wood-like cellular materials. Their results showed that it was possible to gatherreliable information and compute the compliance matrix in terms of the relationship between thestrain of the cell collection and the external stress. Buyuksari et al. [22] investigated the tensile andcompression strength of Scots pine (Pinus sylvestris Lipsky) wood using micro-sized and standard-sizedtest specimens. Their results showed that the compression strength of the micro- sized specimens(3 × 3 × 5 mm) was lower as compared to the standard-sized specimens (20 × 20 × 30 mm), while thetensile strength was higher in the micro- sized specimens.
Forests 2019, 10, 783 3 of 13
Although the influence of the size effect on some wood strength had been studied, the size effecton the elastic constants and proportional limit stress of wood and these parameters used in numericalanalysis of wood constructions have never been reported. Therefore, the aim of this study was toinvestigate the size effect on the elastic constants and proportional limit stress of European beech(Fagus sylvatica) by compression tests with five different sizes of small clear specimens (10 × 10 × 10 mm,10 × 10 × 20 mm, 10 × 10 × 30 mm, 20 × 20 × 30 mm, and 30 × 30 × 30 mm). The specific objectiveswere to 1) evaluate the proportional limit stress measured by five different dimensional samples;2) evaluate the elastic constants determined by five different sizes of samples; 3) predict the loadingcapacity of a self-designed chair based on finite element method (FEM) inputted the parameters(i.e., proportional limit and elastic constants) measured by the five types of samples; and 4) validate theFEM experimentally by testing loading capacity with nine self-designed chairs. With the best resultfrom the experiments, it was expected to improve the accuracy of applying FEM in structure design ofwood products and wooden constructions.
2. Materials and Methods
2.1. Materials and Equipment
European beech (Fagus sylvatica) lumber imported from Switzerland with dimensions of3000 × 200 × 50 mm (length × width × thickness) was purchased from a local commercial woodsupplier (Nanjing, China). A universal testing machine (AGS-X, SHIMADZU, Nakagyo-ku, Japan) anddata logger (TDS530, TML, Tokyo, Japan) were used to measure the elastic constants and proportionallimit stress of European beech wood samples.
2.2. Specimens Preparation
The specimens used to determine the elastic constants were six types of defect-free Europeanbeech blocks with different grain orientations cut from the same lumber shown in Figure 1. The samplesposted with strain gauges were shown in Figure 2. Five different dimensions of specimens are shownin Table 1, which were used to investigate the size effect on the elastic constants and proportionallimit stress of beech. The specimens 1-3 were used to study the effect of height on elastic constants,while the specimens 3-5 were used to investigate the effect of cross-sectional area on elastic constants.Proportional limit stresses in three-grain orientations were measured before determining the elasticconstants. In addition, nine pieces of mortise-and-tenon joint self-designed chair joined by poly (vinylacetate) (PVAc) resin, shown in Figure 3, were tested to verify the effects of elastic constants determinedwith different dimensions of specimens on the accuracy of FEM analysis. The dimensions of legs, siderails and side stretchers of chair were 30 × 20 × 300 mm, 20 × 15 × 124 mm (width × thickness × length),and 30 × 30 × 124 mm (width × thickness × length) respectively All samples were conditioned ina humidity chamber controlled at 20 ± 2 ◦C and 50 ± 5% relative humidity (RH) for two weeks.
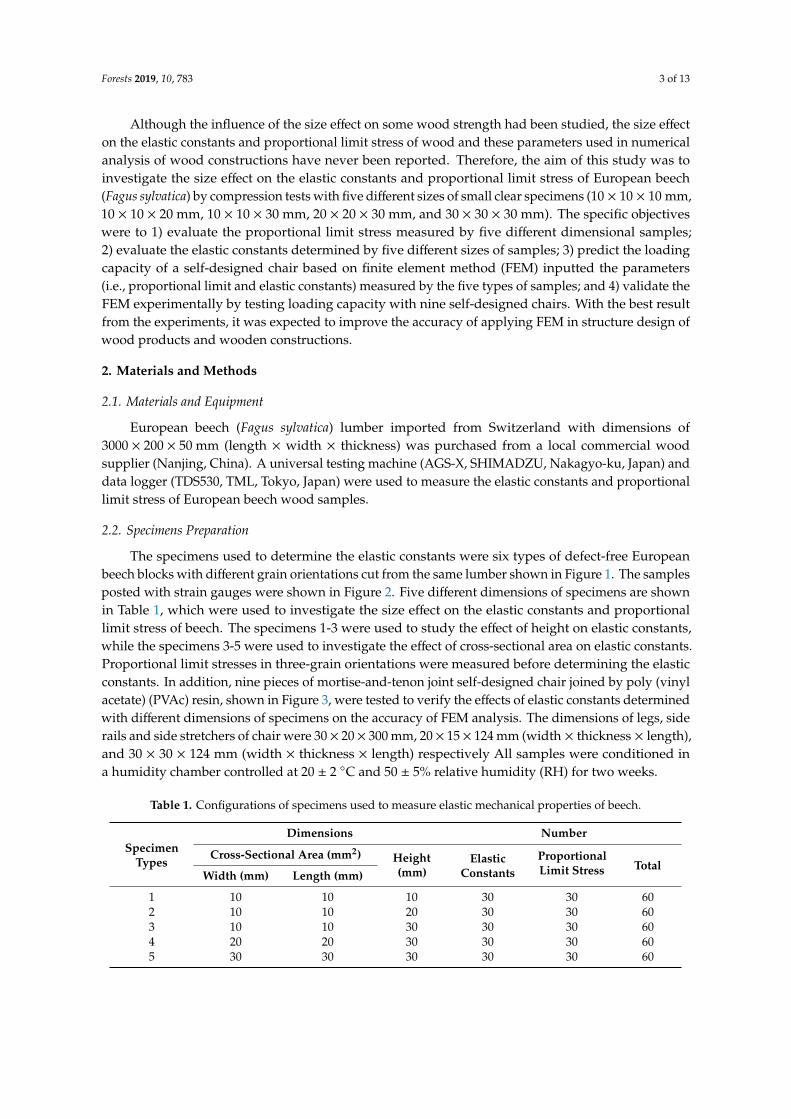
Table 1. Configurations of specimens used to measure elastic mechanical properties of beech.
SpecimenTypes
Dimensions Number
Cross-Sectional Area (mm2) Height(mm)
ElasticConstants
ProportionalLimit Stress Total
Width (mm) Length (mm)
1 10 10 10 30 30 602 10 10 20 30 30 603 10 10 30 30 30 604 20 20 30 30 30 605 30 30 30 30 30 60

Forests 2019, 10, 783 4 of 13
Forests 2019, 10, x FOR PEER REVIEW 4 of 14
Figure 1. Cutting method of samples used to measure elastic constants, (a) to (f) correspond to those in Figure 2. (L, R, and T are longitudinal, radial, and tangential grain orientations of European been).
(a) (b) (c) (d) (e) (f)
Figure 2. Configurations of specimens used to determine the elastic constants of beech (a): EL, μLR and μLT; (b): ER and μRT; (c): ET; (d): GLR; (e): GLT; (f): GRT.
Table 1. Configurations of specimens used to measure elastic mechanical properties of beech.
Specimen Types
Dimensions Number
Cross-sectional Area (mm2) Height (mm)
Elastic Constants
Proportional Limit Stress
Total Width (mm) Length (mm)
1 10 10 10 30 30 60 2 10 10 20 30 30 60 3 10 10 30 30 30 60 4 20 20 30 30 30 60 5 30 30 30 30 30 60
Figure 1. Cutting method of samples used to measure elastic constants, (a) to (f) correspond to those inFigure 2. (L, R, and T are longitudinal, radial, and tangential grain orientations of European been).
Forests 2019, 10, x FOR PEER REVIEW 4 of 14
Figure 1. Cutting method of samples used to measure elastic constants, (a) to (f) correspond to those in Figure 2. (L, R, and T are longitudinal, radial, and tangential grain orientations of European been).
(a) (b) (c) (d) (e) (f)
Figure 2. Configurations of specimens used to determine the elastic constants of beech (a): EL, μLR and μLT; (b): ER and μRT; (c): ET; (d): GLR; (e): GLT; (f): GRT.
Table 1. Configurations of specimens used to measure elastic mechanical properties of beech.
Specimen Types
Dimensions Number
Cross-sectional Area (mm2) Height (mm)
Elastic Constants
Proportional Limit Stress
Total Width (mm) Length (mm)
1 10 10 10 30 30 60 2 10 10 20 30 30 60 3 10 10 30 30 30 60 4 20 20 30 30 30 60 5 30 30 30 30 30 60
Figure 2. Configurations of specimens used to determine the elastic constants of beech (a): EL, µLR andµLT; (b): ER and µRT; (c): ET; (d): GLR; (e): GLT; (f): GRT.Forests 2019, 10, x FOR PEER REVIEW 5 of 14
Figure 3. Dimensions of chair used to determine the loading capacity. (unit: mm).
2.3. Testing Methods
2.3.1. Physical Properties of European Beech Wood
The density and moisture content were measured according to the ASTM D4442-92 [23] and ASTM D2395-93 [24] respectively. In addition, the width of annual ring was determined by vernier caliper with small defect-free samples.
2.3.2. Proportional Limit Stress and Elastic Constants
All elastic constants tests were performed on a universal testing machine equipped with the data logger in accordance with the procedures outlined in the literature [5]. The testing setup is shown in Figure 4 with the loading rate of 1 mm/min. Besides, the proportional limit stresses of five types of specimens in longitudinal (L), radial (R), and tangential (T) directions were determined before measuring the elastic constants, which were used to select the load range, i.e., initial load (P0) and end load (Pn) were 50% and 80% P respectively, to keep it in the linear range of beech. In order to determine the proportional limit stress, 150 measurements were tested at three-grain orientations and five dimensions samples with 10 replications. For testing elastic constants, 150 samples were tested for five different dimensions of specimens. In total, 300 specimens were prepared. The equations used to calculate the proportional limit stress and elastic constants are described in Equation 1 (proportional limit stress), Equation 2 (elastic moduli), Equation 3 (Poisson’s ratio), and Equation 4 (shear moduli) respectively. Figure 5 shows the method to obtain proportional limit load (P), and the value of P can be read by software (Origin 9.1, Origin Lab, Starkville, MS, USA)
Figure 3. Dimensions of chair used to determine the loading capacity. (unit: mm).

Forests 2019, 10, 783 5 of 13
2.3. Testing Methods
2.3.1. Physical Properties of European Beech Wood
The density and moisture content were measured according to the ASTM D4442-92 [23] andASTM D2395-93 [24] respectively. In addition, the width of annual ring was determined by verniercaliper with small defect-free samples.
2.3.2. Proportional Limit Stress and Elastic Constants
All elastic constants tests were performed on a universal testing machine equipped with the datalogger in accordance with the procedures outlined in the literature [5]. The testing setup is shownin Figure 4 with the loading rate of 1 mm/min. Besides, the proportional limit stresses of five typesof specimens in longitudinal (L), radial (R), and tangential (T) directions were determined beforemeasuring the elastic constants, which were used to select the load range, i.e., initial load (P0) andend load (Pn) were 50% and 80% P respectively, to keep it in the linear range of beech. In order todetermine the proportional limit stress, 150 measurements were tested at three-grain orientations andfive dimensions samples with 10 replications. For testing elastic constants, 150 samples were tested forfive different dimensions of specimens. In total, 300 specimens were prepared. The equations used tocalculate the proportional limit stress and elastic constants are described in Equation 1 (proportionallimit stress), Equation 2 (elastic moduli), Equation 3 (Poisson’s ratio), and Equation 4 (shear moduli)respectively. Figure 5 shows the method to obtain proportional limit load (P), and the value of P can beread by software (Origin 9.1, Origin Lab, Starkville, MS, USA).Forests 2019, 10, x FOR PEER REVIEW 6 of 14
Figure 4. Setup for measuring elastic constants of beech.
𝜎 = 𝑃 𝐴⁄ , (1)𝐸 = ∆𝜎 ∆𝜀⁄ = n[ ( )], (i = L, R, T), (2)𝑢 = ∆𝜀 ∆𝜀⁄ , (i, j = L, R, T), (3)𝐺 = ∆𝑃 °/[2𝐴 (∆𝜀 ° + ∆𝜀 °)], (i, j = L, R, T), (4)
where 𝜎 refers to proportional limit stress (MPa), 𝑃 infers to proportional limit load (N), 𝐴 indicates cross-sectional area of specimen (mm2), Ei is elastic modulus in direction i (MPa), ∆𝜎 refers to the difference between of end stress and initial stress (MPa), ∆𝜀 infers to the difference between strains of end load and initial load in loading direction, ∆𝜀 represents the difference between strains of end load and initial load in direction perpendicular to loading direction, 𝑃 infers initial load (N), which was set as 50% P, 𝑃n is end load (N) set as 80% P, 𝜀 is end strain, 𝜀 refers to initial strain, 𝑢 refers to Poisson’s ratio, 𝐺 represents shear modulus (MPa), ∆𝑃 ° is the difference between end load and initial load (N), ∆𝜀 ° infers to the difference between end strain and initial strain in transverse direction, ∆𝜀 ° refers to the difference between end strain and initial strain in vertical direction.
0.0 0.3 0.6 0.9 1.2 1.5
1
2
3
4
5
6
Load
(N)
Displacement (mm)
P
Figure 5. Method used to obtain proportional limit load (P).
2.3.3. Load Capacity of Chair
In order to verify the simulated results of FEM, experiments were carried out to measure the load capacity of a chair. The testing setup is shown in Figure 6. The legs of a chair in test were
Figure 4. Setup for measuring elastic constants of beech.
σPLS = P/A0, (1)
Ei = ∆σi/∆εi =Pn − P0
[A0(εn − ε0)], (i = L, R, T), (2)
ui j = ∆ε j/∆εi, (i, j = L, R, T), (3)
Gi j = ∆P45◦/[2A0
(∆ε45◦
x + ∆ε45◦y
)], (i, j = L, R, T), (4)
where σPLS refers to proportional limit stress (MPa), P infers to proportional limit load (N), A0 indicatescross-sectional area of specimen (mm2), Ei is elastic modulus in direction i (MPa), ∆σi refers to thedifference between of end stress and initial stress (MPa), ∆εi infers to the difference between strains ofend load and initial load in loading direction, ∆ε j represents the difference between strains of end loadand initial load in direction perpendicular to loading direction, P0 infers initial load (N), which was setas 50% P, Pn is end load (N) set as 80% P, εn is end strain, ε0 refers to initial strain, ui j refers to Poisson’s

Forests 2019, 10, 783 6 of 13
ratio, Gi j represents shear modulus (MPa), ∆P45◦ is the difference between end load and initial load(N), ∆ε45◦
x infers to the difference between end strain and initial strain in transverse direction, ∆ε45◦y
refers to the difference between end strain and initial strain in vertical direction.
Forests 2019, 10, x FOR PEER REVIEW 6 of 14
Figure 4. Setup for measuring elastic constants of beech.
𝜎 = 𝑃 𝐴⁄ , (1)𝐸 = ∆𝜎 ∆𝜀⁄ = n[ ( )], (i = L, R, T), (2)𝑢 = ∆𝜀 ∆𝜀⁄ , (i, j = L, R, T), (3)𝐺 = ∆𝑃 °/[2𝐴 (∆𝜀 ° + ∆𝜀 °)], (i, j = L, R, T), (4)
where 𝜎 refers to proportional limit stress (MPa), 𝑃 infers to proportional limit load (N), 𝐴 indicates cross-sectional area of specimen (mm2), Ei is elastic modulus in direction i (MPa), ∆𝜎 refers to the difference between of end stress and initial stress (MPa), ∆𝜀 infers to the difference between strains of end load and initial load in loading direction, ∆𝜀 represents the difference between strains of end load and initial load in direction perpendicular to loading direction, 𝑃 infers initial load (N), which was set as 50% P, 𝑃n is end load (N) set as 80% P, 𝜀 is end strain, 𝜀 refers to initial strain, 𝑢 refers to Poisson’s ratio, 𝐺 represents shear modulus (MPa), ∆𝑃 ° is the difference between end load and initial load (N), ∆𝜀 ° infers to the difference between end strain and initial strain in transverse direction, ∆𝜀 ° refers to the difference between end strain and initial strain in vertical direction.
0.0 0.3 0.6 0.9 1.2 1.5
1
2
3
4
5
6
Load
(N)
Displacement (mm)
P
Figure 5. Method used to obtain proportional limit load (P).
2.3.3. Load Capacity of Chair
In order to verify the simulated results of FEM, experiments were carried out to measure the load capacity of a chair. The testing setup is shown in Figure 6. The legs of a chair in test were
Figure 5. Method used to obtain proportional limit load (P).
2.3.3. Load Capacity of Chair
In order to verify the simulated results of FEM, experiments were carried out to measure the loadcapacity of a chair. The testing setup is shown in Figure 6. The legs of a chair in test were constrainedby fixtures (i.e., blue parts in Figure 6), while the load was imposed on the center of the chair seat witha loading rate 1 mm/min until the displacement reaching 3 mm. This is because the pre-tests showedthat a chair were broken when loading displacement was greater than 3 mm. Nine pieces of chairproduced in the same way were tested to determine the loading capacities.
All experimental results were analyzed by the analysis of variance (ANOVA) using IBM SPSS22, and all mean comparisons were performed at the 1% significance level using the protected leastsignificant difference (LSD) multiple comparisons procedure.
Forests 2019, 10, x FOR PEER REVIEW 7 of 14
constrained by fixtures (i.e., blue parts in Figure 6), while the load was imposed on the center of the chair seat with a loading rate 1 mm/min until the displacement reaching 3 mm. This is because the pre-tests showed that a chair were broken when loading displacement was greater than 3 mm. Nine pieces of chair produced in the same way were tested to determine the loading capacities.
All experimental results were analyzed by the analysis of variance (ANOVA) using IBM SPSS 22, and all mean comparisons were performed at the 1% significance level using the protected least significant difference (LSD) multiple comparisons procedure.
Figure 6. Setup for measuring loading capacity of chair.
2.4. Modeling
The method of establishing the FEM model of a chair followed the one by Hu and Guan [25,26] and Hu et al. [27]. The required inputs for elastic properties of European beech wood were three moduli of elasticity, three moduli of rigidity, and three Poisson’s ratios as orthotropic material, and for glue line in joint, they were one modulus of elasticity and one Poisson’s ratio as isotropic material. Material strength properties required for inputs were compressive proportional limit stress in longitudinal, tangential, and radial directions, respectively, and the shear strength of glue bonding. Elastic properties of beech wood were measured in this experiment, whereas elastic properties of PVAc glue line were obtained from the literature [28], such as the elastic modulus was 460 MPa and Poisson’s ratio was 0.3. The elastic constants determined by five types of specimens were specified to a quarter-chair finite element model created by ABAQUS6.14-1, respectively, shown in Figure 7. The dimensions and boundary constraints of the chair model are shown in Figure 3 and Figure 6, respectively, and symmetry boundary conditions were used. The 8-node linear brick (C3D8) element was used for the chair, and 8-node three-dimensional cohesive element (COH3D) was employed for the glue. In total 17,863 elements were used in the chair model. The elastic moduli determined by five types of samples were put into the finite element model successively. After analyzing, the results were used to compare with those of the chair tests.
Figure 6. Setup for measuring loading capacity of chair.

Forests 2019, 10, 783 7 of 13
2.4. Modeling
The method of establishing the FEM model of a chair followed the one by Hu and Guan [25,26] andHu et al. [27]. The required inputs for elastic properties of European beech wood were three moduli ofelasticity, three moduli of rigidity, and three Poisson’s ratios as orthotropic material, and for glue line injoint, they were one modulus of elasticity and one Poisson’s ratio as isotropic material. Material strengthproperties required for inputs were compressive proportional limit stress in longitudinal, tangential,and radial directions, respectively, and the shear strength of glue bonding. Elastic properties of beechwood were measured in this experiment, whereas elastic properties of PVAc glue line were obtainedfrom the literature [28], such as the elastic modulus was 460 MPa and Poisson’s ratio was 0.3. The elasticconstants determined by five types of specimens were specified to a quarter-chair finite element modelcreated by ABAQUS6.14-1, respectively, shown in Figure 7. The dimensions and boundary constraintsof the chair model are shown in Figures 3 and 6, respectively, and symmetry boundary conditions wereused. The 8-node linear brick (C3D8) element was used for the chair, and 8-node three-dimensionalcohesive element (COH3D) was employed for the glue. In total 17,863 elements were used in the chairmodel. The elastic moduli determined by five types of samples were put into the finite element modelsuccessively. After analyzing, the results were used to compare with those of the chair tests.Forests 2019, 10, x FOR PEER REVIEW 8 of 14
Figure 7. A quarter finite element model of chair.
3. Results and Discussion
3.1. Physical Properties of European Beech Wood
The average density of European beech lumber was 0.629 g/cm3, and the moisture content was conditioned to and held at 10.8% before and during experiments. The width of the annual ring was 1.3 mm, and the ratio of latewood to earlywood was 1/3.
3.2. Size Effect on Proportional Limit Stresses of European Beech
The results of proportional limit stresses of five types of specimens are shown in Figure 8. The comparisons results between specimens 1–3 suggest that the proportional limit stresses decrease with the increasing of the height of specimens with the same cross-sectional area. Comparing the results of specimens 3–5 indicate that the relationship between proportional limit stress and cross-sectional area was nonlinear within a constant height of the specimens.
Longitudinal Radial Tangential0
5
10
15
20
25
30
35
40
45
50
55
Prop
ertio
nal l
imit
stre
ss (M
Pa)
Grain orientations
Specimen 1 Specimen 2 Specimen 3 Specimen 4 Specimen 5
Figure 8. Proportional limit stresses of five types of specimens.
Figure 7. A quarter finite element model of chair.
3. Results and Discussion
3.1. Physical Properties of European Beech Wood
The average density of European beech lumber was 0.629 g/cm3, and the moisture content wasconditioned to and held at 10.8% before and during experiments. The width of the annual ring was1.3 mm, and the ratio of latewood to earlywood was 1/3.
3.2. Size Effect on Proportional Limit Stresses of European Beech
The results of proportional limit stresses of five types of specimens are shown in Figure 8.The comparisons results between specimens 1–3 suggest that the proportional limit stresses decreasewith the increasing of the height of specimens with the same cross-sectional area. Comparing the resultsof specimens 3–5 indicate that the relationship between proportional limit stress and cross-sectionalarea was nonlinear within a constant height of the specimens.

Forests 2019, 10, 783 8 of 13
Forests 2019, 10, x FOR PEER REVIEW 8 of 14
Figure 7. A quarter finite element model of chair.
3. Results and Discussion
3.1. Physical Properties of European Beech Wood
The average density of European beech lumber was 0.629 g/cm3, and the moisture content was conditioned to and held at 10.8% before and during experiments. The width of the annual ring was 1.3 mm, and the ratio of latewood to earlywood was 1/3.
3.2. Size Effect on Proportional Limit Stresses of European Beech
The results of proportional limit stresses of five types of specimens are shown in Figure 8. The comparisons results between specimens 1–3 suggest that the proportional limit stresses decrease with the increasing of the height of specimens with the same cross-sectional area. Comparing the results of specimens 3–5 indicate that the relationship between proportional limit stress and cross-sectional area was nonlinear within a constant height of the specimens.
Longitudinal Radial Tangential0
5
10
15
20
25
30
35
40
45
50
55
Prop
ertio
nal l
imit
stre
ss (M
Pa)
Grain orientations
Specimen 1 Specimen 2 Specimen 3 Specimen 4 Specimen 5
Figure 8. Proportional limit stresses of five types of specimens. Figure 8. Proportional limit stresses of five types of specimens.
Thus, the relationships between proportional limit stress, cross-sectional area, and height ofthe specimen in three wood grain orientations (L, R, and T) were modeled using the nonlinearregression method. The response surfaces were shown in Figure 9 and the corresponding regressionequations are Equation (5), Equation (6), and Equation (7) with R2 0.7217, 0.8086 and 0.7262 respectively.Since Chin [29] recommended R2 values for endogenous latent variables based on: 0.67 (substantial),0.33 (moderate), and 0.19 (weak), thus, these equations can be used to predict the proportional limitstresses with the varieties of cross-sectional area and height of the specimens.
Forests 2019, 10, x FOR PEER REVIEW 9 of 14
Thus, the relationships between proportional limit stress, cross-sectional area, and height of the specimen in three wood grain orientations (L, R, and T) were modeled using the nonlinear regression method. The response surfaces were shown in Figure 9 and the corresponding regression equations are Equation 5, Equation 6, and Equation 7 with R2 0.7217, 0.8086 and 0.7262 respectively. Since Chin [29] recommended R2 values for endogenous latent variables based on: 0.67 (substantial), 0.33 (moderate), and 0.19 (weak), thus, these equations can be used to predict the proportional limit stresses with the varieties of cross-sectional area and height of the specimens.
(a) (b) (c)
Figure 9. Relationships between proportional limits stress, cross-sectional area and height of specimens in longitudinal (a), radial (b) and tangential (c) grain orientations.
𝜎 = 3.97 + 1.79𝑒𝑥 𝑝(−3)𝐴 − 0.052𝐻 − 1.584𝑒𝑥 𝑝(−6)𝐴 + 9.7𝑒𝑥 𝑝(−4)𝐻 , R2=0.7217 (1)𝜎 = 12.12 + 0.013𝐴 − 0.33𝐻 − 1.174𝑒𝑥 𝑝(−5)𝐴 + 3.37𝑒𝑥𝑝(−3)𝐻 , R2=0.8086 (2)𝜎 = 9.36 + 8.31𝑒𝑥𝑝(−3)𝐴 − 0.46𝐻 − 8.90𝑒𝑥 𝑝(−6)𝐴 + 9.35𝑒𝑥 𝑝(−3)𝐻 , R2=0.8086 (3)
where σ , σ , and σ refers to proportional limit stresses in L, R and T directions (MPa), A is cross-sectional area of specimen in (mm2), H is the height of specimen in (mm).
Previous studies reported that the grain orientations influence the mechanical properties of beech lumber [5,30]. To the knowledge of the authors, only a few selected works existed for the weakest link theory (WLT) for wood under compression [18,31], showing either no size effect [18] or a small effect [31] on the mechanical properties of wood. The influences of cross-sectional area and height of specimen on the proportional limit stresses were determined with an analysis of variance (ANOVA) and Fisher’s F-test by IBM SPSS statistics 22. Table 2 shows the results of ANOVA that the cross-sectional area and height are all considered statistically significant with P-value less than 0.01, while the two-factorial analysis suggests that there were no interactions between height with cross-sectional area.
Table 2. The ANOVA of proportional limit stresses of beech.
Monitor Factor Sum of Squares
Degree of Freedom
Mean Squares
Fisher’s F-Test Significance
Intercept 17,851.842 1 17,851.842 6394.165 p < 0.01 Height (a) 219.444 2 109.722 39.300 p < 0.01
Cross-sectional Area (b) 181.119 2 90.559 32.437 p < 0.01 a × b 0 0 Error 167.514 60 2.792
3.3. Size Effect on Elastic Constants of Beech
Figure 9. Relationships between proportional limits stress, cross-sectional area and height of specimensin longitudinal (a), radial (b) and tangential (c) grain orientations.
σL = 3.97 + 1.79exp(−3)A− 0.052H − 1.584exp(−6)A2 + 9.7exp(−4)H2, R2 = 0.7217 (5)
σR = 12.12 + 0.013A− 0.33H − 1.174exp(−5)A2 + 3.37exp(−3)H2, R2 = 0.8086 (6)
σT = 9.36 + 8.31exp(−3)A− 0.46H − 8.90exp(−6)A2 + 9.35exp(−3)H2, R2 = 0.8086 (7)
where σL, σR, and σT refers to proportional limit stresses in L, R and T directions (MPa), A iscross-sectional area of specimen in (mmsuperscript2), H is the height of specimen in (mm).
Previous studies reported that the grain orientations influence the mechanical properties of beechlumber [5,30]. To the knowledge of the authors, only a few selected works existed for the weakest link

Forests 2019, 10, 783 9 of 13
theory (WLT) for wood under compression [18,31], showing either no size effect [18] or a small effect [31]on the mechanical properties of wood. The influences of cross-sectional area and height of specimenon the proportional limit stresses were determined with an analysis of variance (ANOVA) and Fisher’sF-test by IBM SPSS statistics 22. Table 2 shows the results of ANOVA that the cross-sectional area andheight are all considered statistically significant with P-value less than 0.01, while the two-factorialanalysis suggests that there were no interactions between height with cross-sectional area.
Table 2. The ANOVA of proportional limit stresses of beech.
Monitor Factor Sum ofSquares
Degree ofFreedom Mean Squares Fisher’s F-Test Significance
Intercept 17,851.842 1 17,851.842 6394.165 p < 0.01Height (a) 219.444 2 109.722 39.300 p < 0.01
Cross-sectional Area (b) 181.119 2 90.559 32.437 p < 0.01a × b 0 0Error 167.514 60 2.792
3.3. Size Effect on Elastic Constants of Beech
Table 3 shows the results of elastic constants of five types of specimens, which are reasonablysimilar to those of previous studies [2,30,32]. It indicates that elastic moduli (EL, ER, and ET) and shearmoduli (GL, GR, and GT) increased with the height based on the comparisons of specimen 1–3 withthe same cross-sectional area. Comparing the results of specimens 3-5, the elastic moduli (EL, ET, andER) and shear moduli (GL, GR, and GT) decreased with the increase of the cross-sectional area at thesame height. Xavier et al. [33] evaluated the longitudinal modulus of elasticity (EL) of maritime pine(Pinus pinaster Ait) by compression tests parallel to grain with 3D digital imagine correlation method(3D DIC). The samples with cross-sectional area (20 × 20, 30 × 30, and 40 × 40 mm) and height (30, 60,and 120 mm) were chosen, but the results showed opposite trends with this study. In accordance withthe equation (3) and compression strengths of wood in L, R and T grain orientations, the Poisson’sratio should decrease with the increase of height within the same cross-sectional area, and increasewith an increase of cross-sectional area with the same height. However, due to the error of tests,four observed values of Poisson’s ratios were not in consistence with this trend, thus, further studiesare needed to find out the reasons.
Table 3. Averages and coefficient of variances (COVs) of elastic constants.
SpecimenType
EL(MPa)
ER(MPa)
ET(MPa) µLR µLT µRT
GL(MPa)
GR(MPa)
GT(MPa)
1 13449 1027 764 0.697 0.720 0.444 527 399 173COV (%) 4.8 5.8 4.5 1.0 9.4 0.8 6.4 2.7 10.3
2 15284 1161 863 0.643 0.549 0.644 729 462 265COV (%) 0.3 2.7 0.7 3.0 1.3 3.5 1.0 5.5 13.1
3 17980 1537 1041 0.398 0.625 0.515 945 499 373COV (%) 2.4 6.8 2.0 1.9 0.5 2.8 1.5 14.4 4.5
4 14075 1482 707 0.710 0.338 0.465 832 444 259COV (%) 1.1 2.8 4.7 7.7 14.1 2.8 3.0 7.8 1.3
5 12617 1337 642 0.408 0.368 0.588 828 398 169COV (%) 1.9 3.1 6.8 0.9 10.1 0.3 10.4 3.8 18.6
Two-factor (height and cross-sectional area) ANOVA was conducted to assess the size effect onthe elastic constants of beech. It suggests that the effect of cross-sectional area, height and interactionof them on elastic constants were considered statistically significant. Table 4 only shows the ANOVAof interaction of cross-sectional area and height. This confirms that further research to find optimizedbeech specimen dimension to get mechanical properties data for FEM model is necessary.

Forests 2019, 10, 783 10 of 13
Table 4. ANOVA of interaction of cross-sectional area with height.
Monitored Factor DependentVariable Sum of Squares Degree of
FreedomMean
SquaresFisher’sF-Test Significance
Cross-sectional Area× Height
EL 176,983,729.639 4 44,245,932.410 237.704 p < 0.01ER 899,669.479 4 224,917.370 39.344 p < 0.01ET 195,869.174 4 48,967.294 30.436 p < 0.01νLR 0.293 4 0.073 51.594 p < 0.01νLT 0.318 4 0.079 24.222 p < 0.01νRT 0.082 4 0.021 65.324 p < 0.01GLR 293,182.023 4 73,295.506 19.698 p < 0.01GLT 21,512.839 4 5378.210 6.430 p < 0.01GRT 84,329.602 4 21,082.400 19.736 p < 0.01
3.4. Load Capacity of Chair and Failure Mode
Figure 10 shows the typical load-displacement curve and failure mode of a chair under compression,which indicates that the maximum load value can be obtained at displacement about 3 mm. Therefore,in this study, the load at 3 mm displacement were extracted and compared with those of FEM.The loading capacity of a chair at displacement of 3 mm was 13,055.06 N with a COV of 5.50. Thetypical failure of a chair at maximum load occurred at the joint of the rail and leg.
Forests 2019, 10, x FOR PEER REVIEW 11 of 14
mm. Therefore, in this study, the load at 3 mm displacement were extracted and compared with those of FEM. The loading capacity of a chair at displacement of 3 mm was 13,055.06 N with a COV of 5.50. The typical failure of a chair at maximum load occurred at the joint of the rail and leg.
0.0 0.5 1.0 1.5 2.0 2.5 3.0 3.5
3000
6000
9000
12000
15000
18000
Failure mode
Failure point
Load
(N)
Displacement (mm)
Load capacity at 3 mm displacement
(a) (b)
Figure 10. Typical load and displacement curve (a) and failure mode (b) of chair under compression.
3.4. Comparison and Analysis
Figure 11 shows the stress distributions of a chair from the initial loading state to the end loading state where the loading displacement reached 3mm. The elastic constants determined by five types of specimens were put into the chair model and analyzed by FEM respectively. The reaction forces of the loading head were outputted by ABAQUS6.14-1 and compared with those of experiments.
(a) (b) (c) (d)
Figure 11. Stress distributions of chair based on FEM (a) initial state, (b) state at 1 mm-displacement, (c) state at 2 mm-displacement, (d) state at 3 mm-displacement.
Figure 12 shows the loading capacities of self-designed chairs based on FEM and experiments. The stress increased with the load and concentrated at the joint of the stretcher and leg, which was consistent with the failure mode shown in Figure 10.
Figure 10. Typical load and displacement curve (a) and failure mode (b) of chair under compression.
3.5. Comparison and Analysis
Figure 11 shows the stress distributions of a chair from the initial loading state to the end loadingstate where the loading displacement reached 3mm. The elastic constants determined by five types ofspecimens were put into the chair model and analyzed by FEM respectively. The reaction forces of theloading head were outputted by ABAQUS6.14-1 and compared with those of experiments.
Forests 2019, 10, x FOR PEER REVIEW 11 of 14
mm. Therefore, in this study, the load at 3 mm displacement were extracted and compared with those of FEM. The loading capacity of a chair at displacement of 3 mm was 13,055.06 N with a COV of 5.50. The typical failure of a chair at maximum load occurred at the joint of the rail and leg.
0.0 0.5 1.0 1.5 2.0 2.5 3.0 3.5
3000
6000
9000
12000
15000
18000
Failure mode
Failure point
Load
(N)
Displacement (mm)
Load capacity at 3 mm displacement
(a) (b)
Figure 10. Typical load and displacement curve (a) and failure mode (b) of chair under compression.
3.4. Comparison and Analysis
Figure 11 shows the stress distributions of a chair from the initial loading state to the end loading state where the loading displacement reached 3mm. The elastic constants determined by five types of specimens were put into the chair model and analyzed by FEM respectively. The reaction forces of the loading head were outputted by ABAQUS6.14-1 and compared with those of experiments.
(a) (b) (c) (d)
Figure 11. Stress distributions of chair based on FEM (a) initial state, (b) state at 1 mm-displacement, (c) state at 2 mm-displacement, (d) state at 3 mm-displacement.
Figure 12 shows the loading capacities of self-designed chairs based on FEM and experiments. The stress increased with the load and concentrated at the joint of the stretcher and leg, which was consistent with the failure mode shown in Figure 10.
Figure 11. Stress distributions of chair based on FEM (a) initial state, (b) state at 1 mm-displacement,(c) state at 2 mm-displacement, (d) state at 3 mm-displacement.

Forests 2019, 10, 783 11 of 13
Figure 12 shows the loading capacities of self-designed chairs based on FEM and experiments.The stress increased with the load and concentrated at the joint of the stretcher and leg, which wasconsistent with the failure mode shown in Figure 10.Forests 2019, 10, x FOR PEER REVIEW 12 of 14
10000
12000
14000
16000
(4.1641%)
(4.862%)
(9.232%)
(2.897%)
Load
ing
capa
city
of c
hair
(N) Results of FEM
Average of experiments
Specimen5Specimen 4Specimen 3Specimen 2Specimen 1
(0.9625%)
Types of specimen Figure 12. Comparisons of experiments and finite element methods (FEMs) (Errors are shown in parentheses).
Based on Figure 12, the loading capacities of self-designed chairs based on FEM used the elastic constants determined by specimens 1–3 with the same cross-sectional area were compared with experimental results. This indicates that the results of the FEM inputted by the elastic constants determined by specimen 1 were more accurate than those determined by the other two specimens. Secondly, the same way was used to compare the results of FEM inputted parameters determined by specimens 3–5 with the same height, the results of FEM inputted the parameters measured by specimen 3 was more precise than the other two specimens. Thirdly, the results of FEM inputted the parameters measured by specimen 1 and specimen 5 with the same width-height ratio (i.e., equal to 1) were compared, the accuracy of the former was better than that of the later. In other words, the specimen 1 was more appropriate to be used to measure the elastic constants of beech wood compared with other specimens.
In summary, the data show that the smaller the specimen used to measure the elastic constants of wood with width (length)-height ratio equal to 1, the more accurate of the result the finite element model predicted. This might be similar to the finite element theory that the finer the element is, the more accurate the result of finite element model predicts [34]. It can also be explained by following three reasons that 1) the smaller the specimen, the more accurate the grain orientation, and less error; 2) The smaller the specimen, the less defects it contains, and the more precisely the mechanics it reflects [12], which is based on the idea that in a larger volume, the probability to encounter an element with lower strength is higher than in smaller volumes. In the end, this weakest element leads to the collapse of the structure [35]; and 3) it is assumed that the volumes might have a different expressed curvature of the annual rings, so that the very small specimen can be regarded as quasi orthotropic whereas the largest specimen size has to be considered as cylindrically anisotropic. Nevertheless, if one thinks about different wood species having different microstructures, based on what has been explained, finding optimized wood element dimensions of different wood species to obtain mechanical property data for FEM model for engineering applications is very necessary.
4. Conclusions
In conclusion, the results of the experiments and ANOVA output all suggested that the size effect on elastic mechanics of European beech wood be statistically significant. The proportional limit stress decreased with the growth of the height of specimens at a constant cross-sectional area. Nonlinear relationship between proportional stress, cross-sectional area, and height of specimens was regressed. The elastic moduli (EL, ER, and ET) and shear moduli (GL, GR, and GT) increased with the raise of height with the same cross-sectional area, but decreased with the increasing of cross-sectional area with the same height. However, four observed values of Poisson’s ratio were not consistent with this trend. Thus, further studies are needed to be conducted. A comparison of loading
Figure 12. Comparisons of experiments and finite element methods (FEMs) (Errors are shown inparentheses).
Based on Figure 12, the loading capacities of self-designed chairs based on FEM used the elasticconstants determined by specimens 1–3 with the same cross-sectional area were compared withexperimental results. This indicates that the results of the FEM inputted by the elastic constantsdetermined by specimen 1 were more accurate than those determined by the other two specimens.Secondly, the same way was used to compare the results of FEM inputted parameters determinedby specimens 3–5 with the same height, the results of FEM inputted the parameters measured byspecimen 3 was more precise than the other two specimens. Thirdly, the results of FEM inputted theparameters measured by specimen 1 and specimen 5 with the same width-height ratio (i.e., equal to1) were compared, the accuracy of the former was better than that of the later. In other words, thespecimen 1 was more appropriate to be used to measure the elastic constants of beech wood comparedwith other specimens.
In summary, the data show that the smaller the specimen used to measure the elastic constants ofwood with width (length)-height ratio equal to 1, the more accurate of the result the finite elementmodel predicted. This might be similar to the finite element theory that the finer the element is, themore accurate the result of finite element model predicts [34]. It can also be explained by followingthree reasons that 1) the smaller the specimen, the more accurate the grain orientation, and less error;2) The smaller the specimen, the less defects it contains, and the more precisely the mechanics itreflects [12], which is based on the idea that in a larger volume, the probability to encounter an elementwith lower strength is higher than in smaller volumes. In the end, this weakest element leads to thecollapse of the structure [35]; and 3) it is assumed that the volumes might have a different expressedcurvature of the annual rings, so that the very small specimen can be regarded as quasi orthotropicwhereas the largest specimen size has to be considered as cylindrically anisotropic. Nevertheless,if one thinks about different wood species having different microstructures, based on what has beenexplained, finding optimized wood element dimensions of different wood species to obtain mechanicalproperty data for FEM model for engineering applications is very necessary.
4. Conclusions
In conclusion, the results of the experiments and ANOVA output all suggested that the size effecton elastic mechanics of European beech wood be statistically significant. The proportional limit stress

Forests 2019, 10, 783 12 of 13
decreased with the growth of the height of specimens at a constant cross-sectional area. Nonlinearrelationship between proportional stress, cross-sectional area, and height of specimens was regressed.The elastic moduli (EL, ER, and ET) and shear moduli (GL, GR, and GT) increased with the raise ofheight with the same cross-sectional area, but decreased with the increasing of cross-sectional areawith the same height. However, four observed values of Poisson’s ratio were not consistent with thistrend. Thus, further studies are needed to be conducted. A comparison of loading capacity of chairsbetween experiment and FEM suggested that small cubic defect-free wood specimens are to be used todetermine the elastic constants, and the results of finite element model are more accurate. Findingoptimized wood element dimensions of different wood species to obtain mechanical property data forfinite element model for engineering applications is necessary.
Author Contributions: Conceptualization, H.G., H.W. and W.H.; methodology, W.H.; software, W.H.; validation,W.H., H.G. and H.W.; formal analysis, W.H.; investigation, W.H.; resources, H.G.; data curation, H.G.;writing—original draft preparation, W.H.; writing—review and editing, W.H., H.W. and H.G.; supervision,H.G.; funding acquisition, H.G.
Funding: This work was supported by Scientific Research Foundation of Nanjing Forestry University (GXL2019074),A Project Funded by the National First-class Disciplines (PNFD), and A Priority Academic Program Developmentof Jiangsu Higher Education Institutions (PAPD).
Acknowledgments: The authors would like to express my heartfelt gratitude to Edward D. Entsminger fromDepartment of Sustainable Bioproducts of Mississippi State University for his help in revising the grammar of themanuscript. We also would like to thank the anonymous reviewers and editor for their valuable comments andsuggestions for improving the quality of this paper.
Conflicts of Interest: The authors declare no conflict of interest.
References
1. Zauner, M.; Niemz, P. Uniaxial compression of rotationally symmetric Norway spruce samples: Surfacedeformation and size effect. Wood Sci. Technol. 2014, 48, 1019–1032. [CrossRef]
2. Zhang, F.; Li, L.; Zhang, L.; Xu, Z. Study of the determination of the elastic constants and mechanical propertyparameters of five kinds of wood commonly used in furniture. For. Mach. Woodwork. Equip. 2012, 40, 16–19.
3. Wang, L.Y.; Lu, Z.Y.; Shen, S.J. Study on twelve elastic constant values of Betula platyphylla Suk. wood.J. Beijing For. Univ. 2003, 25, 64–67. (In Chinese with English Summary)
4. CNS GB/T 1935. Method of Testing in Compressive Strength Parallel to Grain of Wood; Chinese National Standard:Beijing, China, 2009. (In Chinese)
5. Hu, W.G.; Guan, H.Y. Study on elastic constants of beech in different stress states. J. For. Eng. 2017, 2, 31–36,(In Chinese with English Summary)
6. Aira, J.R.; Arriaga, F.; González, G.L. Determination of the elastic constants of scots pine (Pinus sylvestris L.)wood by means of compression tests. Biosyst. Eng. 2014, 126, 12–22. [CrossRef]
7. Aydin, Y.; Aydin, M. Comparison of temperature dependent Young’s modulus of oriental beech (Fagusorientalis L.) that determined by ultrasonic wave propagation and compression test. Turk. J. For. 2018, 19,185–191. [CrossRef]
8. Shao, Z.P.; Zhou, S. Study on determining the elastic constants of wood of Cunninghamia lanceolata by meansof electric resistance-strain gauges. J. Anhui Agri. Univ. 2001, 28, 32–35. (In Chinese with English Summary)
9. Murata, K.; Tanahashi, H. Measurement of Young’s modulus and Poisson’s ratio of wood specimens incompression test. J. Soc. Mater. Sci. Jpn. 2010, 59, 285–290. [CrossRef]
10. Liu, F.L.; Jiang, F.; Zhang, J.Z.; Zhang, H.J.; Wang, X.P.; Yang, Z.H. Twelve elastic constants values of larchforest. J. North. For. Univ. 2015, 30, 227–231. (In Chinese with English Summary)
11. ASTM D143-94. Standard Test Methods for Small Clear Specimens of Timber; ASTM International: WestConshohocken, PA, USA, 2010.
12. Straže, A.; Gorišek, Z. Analysis of size effect on determination of mechanical properties of Norway sprucewood. In Proceedings of the 22nd International Scientific Conference on Wood is Good-EU PreaccessionChallenges of the Sector, Zagreb, Croatia, 21 October 2011; pp. 183–190.
13. Madsen, B.; Tomoi, M. Size effects occurring in defect-free spruce-pine-fir bending specimens. Can. J. CivilEng. 2011, 18, 637–643. [CrossRef]

Forests 2019, 10, 783 13 of 13
14. Zhou, H.B.; Ren, H.Q.; Lu, J.X. Size effect of length on flexural strength of Chinese fir dimension lumber usedin wood structure. J. Build. Mater. 2009, 12, 501–504. (In Chinese with English Summary)
15. Madsen, B.; Buchanan, A.H. Size effect in timber explained by a modified weakest link theory. Can. J. CivilEng. 1986, 13, 218–2232. [CrossRef]
16. Madsen, B.; Nielsen, P.C. In-Grade Testing: Size Investigation on Lumber Subjected to Bending; Structural ResearchSeries, Report No. 15; Department of Civil Engineering; University of British Columbia: Vancouver, BC,Canada, 1976; p. 10.
17. ASTM D1990-07. Standard Practice for Establishing Allowable Properties for Visually-Grade Dimension Lumberfrom in Grade Tests of Full-Size Specimens; ASTM International: West Conshohocken, PA, USA, 2016.
18. Fotsing, J.A.; Foudjet, A. Size effect of two Cameroonian hardwoods in compression and bending parallel tothe Grain. Holzforsch.-Int. J. Biol. Chem. Phys. Technol. Wood 1995, 49, 376–378. [CrossRef]
19. Zhou, H.B.; Han, L.Y.; Ren, H.Q.; Lu, J.X. Size effect on strength properties of Chinese larch dimensionlumber. BioResources 2015, 10, 3790–3797. [CrossRef]
20. Yu, Y.; Jiang, Z.H.; Tian, G.L. Size effect on longitudinal MOE of microtomed wood sections and relevanttheoretical explanation. For. Stud. China 2009, 11, 243–248. [CrossRef]
21. Karakoc, A.; Freund, J. Effect of size and measurement domain on the in-plane elasticity of wood-like cellularmaterials. J. Mater. Sci. 2016, 51, 1490–1495. [CrossRef]
22. Buyuksari, U.; As, N.; Dundar, T.; Sayan, E. Micro-tensile and compression strength of scots pine wood andcomparison with standard-size test results. Drvna. Ind. 2017, 68, 129–136. [CrossRef]
23. ASTM D4442-92. Standard Test Methods for Direct Moisture Content Measurements of Wood and Wood-BasedMaterials; ASTM International: West Conshohocken, PA, USA, 2010.
24. ASTM D 2395-93. Standard Test Methods for Specific Gravity of Wood and Wood-Based Materials; ASTMInternational: West Conshohocken, PA, USA, 2010.
25. Hu, W.G.; Guan, H.Y. Experimental and numerical study on optimization design of stretcher positions. WoodRes. 2017, 62, 575–586.
26. Hu, W.G.; Guan, H.Y. Investigation on withdrawal force of mortise and tenon joint based on friction properties.J. For. Eng. 2017, 02, 158–162. (In Chinese with English Summary)
27. Hu, W.G.; Guan, H.Y.; Zhang, J.L. Finite element analysis of tensile load resistance of mortise-and-tenonjoints considering tenon fit effects. Wood Fiber Sci. 2018, 50, 121–131. [CrossRef]
28. Kasal, A.; Smardzewski, J.; Kuskun, T.; Erdil, Y.Z. Numerical analysis of various sizes of mortise and tenonfurniture joints. BioResources 2016, 11, 6836–6853. [CrossRef]
29. Chin, W.W. Commentary: Issues and opinion on structural equation modeling. MIS Quart. 1988, 22, 7–16.30. Hearmon, R.F.S.; Barkas, W.W. The effect of grain direction on the Young’s moduli and rigidity moduli of
beech and sitka spruce. Proc. Phys. Soc. 1941, 53, 674–680. [CrossRef]31. Madsen, B. Structural Behaviour of Timber; Timber Engineering LTD: Vancouver, BC, Canada, 1992.32. Hering, S.; Keunecke, D.; Niemz, P. Moisture-dependent orthotropic elasticity of beech wood. Wood Sci.
Technol. 2011, 46, 927–938. [CrossRef]33. Xavier, J.; De Jesus, A.M.P.; Morais, J.J.L.; Pinto, J.M.T. Stereovision measurements on evaluating the modulus
of elasticity of wood by compression tests parallel to the grain. Constr. Build. Mater. 2012, 26, 207–215.[CrossRef]
34. Ghavidel, A.; Mousavi, S.R.; Rashki, M. The effect of FEM mesh density on the failure probability analysis ofstructures. KSCE. J. Civil Eng. 2017, 00, 1–13. [CrossRef]
35. Weibull, W. A statistical distribution function of wide applicability. J. Appl. Mech-T. ASME 1951, 18, 293–297.
© 2019 by the authors. Licensee MDPI, Basel, Switzerland. This article is an open accessarticle distributed under the terms and conditions of the Creative Commons Attribution(CC BY) license (http://creativecommons.org/licenses/by/4.0/).