Embed Size (px)
Citation preview

Accepted Manuscript
Combined ultrasonic-mechanical characterization of orthotropic elastic properties ofan unrefined bagasse fiber-polypropylene composite
Thomas K. Bader, Foroogh Dastoorian, Ghanbar Ebrahimi, Gerhard Unger, OlafLahayne, Christian Hellmich, Bernhard Pichler
PII: S1359-8368(16)30158-5
DOI: 10.1016/j.compositesb.2016.03.070
Reference: JCOMB 4171
To appear in: Composites Part B
Received Date: 11 June 2015
Revised Date: 21 March 2016
Accepted Date: 25 March 2016
Please cite this article as: Bader TK, Dastoorian F, Ebrahimi G, Unger G, Lahayne O, HellmichC, Pichler B, Combined ultrasonic-mechanical characterization of orthotropic elastic properties ofan unrefined bagasse fiber-polypropylene composite, Composites Part B (2016), doi: 10.1016/j.compositesb.2016.03.070.
This is a PDF file of an unedited manuscript that has been accepted for publication. As a service toour customers we are providing this early version of the manuscript. The manuscript will undergocopyediting, typesetting, and review of the resulting proof before it is published in its final form. Pleasenote that during the production process errors may be discovered which could affect the content, and alllegal disclaimers that apply to the journal pertain.
MANUSCRIP
T
ACCEPTED
ACCEPTED MANUSCRIPT
Page 1
Combined ultrasonic-mechanical characterization of orthotropic elastic
properties of an unrefined bagasse fiber-polypropylene composite
Thomas K. Badera*, Foroogh Dastooriana,b, Ghanbar Ebrahimib, Gerhard Ungera,
Olaf Lahaynea, Christian Hellmicha, and Bernhard Pichlera
a Institute for Mechanics of Materials and Structures, Vienna University of Technology (TU Wien),
Karlsplatz 13/202, A-1040 Vienna, Austria
b University of Tehran, P. O. Box 31585.3314, Karaj, Iran
*Corresponding author. E-mail address: [email protected]; Tel.: +43 1 58801 20228
Abstract
Use of wood-fiber plastics for construction purposes calls for comprehensive understanding of their
anisotropic mechanical properties. As a respective contribution, we here report the first-ever complete
elasticity characterization of an orthotropic bagasse fiber polypropylene composite, requiring identification of
nine independent constants. For this purpose, we carry out characterization in principal material directions.
Six diagonal stiffness tensor components are quantified based on ultrasonic longitudinal and shear wave
velocity measurements; and three diagonal compliance tensor components are identified as the inverses of
three Young’s moduli derived from unloading regimes of quasi-static uniaxial compression tests.
Combination of all measurement data in the framework of orthotropic linear elasticity provides access to all
off-diagonal stiffness and compliance tensor components, opening the door to quantifying six Poisson’s
ratios.
Keywords: A. Polymer-matrix composites (PMCs); B. Elasticity; B. Creep; D. Mechanical testing;
D. Ultrasonics

MANUSCRIP
T
ACCEPTED
ACCEPTED MANUSCRIPT
Page 2
1. Introduction
During sugar production, the extraction of cane juice from sugarcane delivers wooden
fibers as by-product – they are called bagasse, and according to [1,2,3] consist of 40-50%
cellulose, 25-35% hemicellulose, as well as of about 23.5% lignin, 1.3% ash, and 2.8%
other components. Brazil, India, and China are the world’s leading producers of the
material, and they use bagasse typically for energy production by combustion. Other
exploitation types include paper products, fiberboards, and fiber-polymer composites [4].
Cellulosic fibers are widely used for reinforcing purposes of all kind of matrix materials in
order to enhance their mechanical properties, e.g. by reinforcing the material against brittle
failure or reducing the creep activity of the composite [3,5]. Bagasse fiber polypropylene
composites belong to the wide class of wood plastic composites (WPC). So far, WPCs have
mainly been used for non-structural applications since the mechanical performance of
WPCs is typically rather compliant, and exhibits a pronounced creep activity. However,
recently developed technologies allow for the production of stiffer WPCs, thus opening the
door to semi-constructional applications, such as decking, railing, door and window
profiles, siding, and roof tiles [6]. Recent feasibility studies investigate the potential use of
WPCs for sill plates, deck substructure, and shoreline structures [7,8].
Verma et al. [4] reviewed research activities related to bagasse fiber composites and its
constituents. Mechanical properties have mainly been measured in tensile and flexural tests
following the protocols defined in major standards, such as ASTM D638, ASTM D747,
ASTM D790-03, and ISO 527, see [9-11] for details. As regards the composite
constituents, polypropylene is the “soft” matrix-type component with Young’s modulus
ranging from 0.9 to 1.3 GPa [1,5,9,10-14]; while bagasse plays the role of “reinforcing
MANUSCRIP
T
ACCEPTED
ACCEPTED MANUSCRIPT
Page 3
fibers”, with Young’s modulus ranging from 2.7 to 4.5 GPa [14,15]. Accordingly,
increasing bagasse contents increases the stiffness and strength of the overall plastic
composites, as was shown in a number of experimental campaigns; see e.g. [9-17].
However, these experimental campaigns do not account for the anisotropic nature of
bagasse fiber polypropylene composites [4,18], which results from the reorientation of
originally randomly oriented fibers during the extruding process of a matrix-fiber
composite [5,19]; and understanding of this anisotropic nature appears as essential for
development of reliable design of, and improved production technologies for WPC
elements. Assessment of the mechanical anisotropy of WPCs calls for largely increased
experimental efforts, due to the increased number of independent material constants to be
determined. In case of orthotropy, pure reliance on mechanical tests would require the
measurement of deformations orthogonal to uniaxial loading directions coinciding with the
material directions, plus subjecting the specimens to pure shear stresses. This would call for
very elaborate testing equipment, which might still deliver unreliable results. As a remedy,
we here resort to a combined mechanical-ultrasonic method in the line of [20]. This method
circumvents the ultrasonic characterization of off-diagonal stiffness components which are
very sensitive to inaccuracies regarding the measured wave velocities [20,21], and hence
only employs measurements of ultrasonic longitudinal and shear wave velocities in all three
orthotropic material directions, in order to obtain the six “diagonal” stiffness tensor
components; i.e. those filling the diagonal in a 6x6 Kelvin-Mandel representation of
stiffness tensors [22-24]. In addition, three Young’s moduli are measured in quasi-static
uniaxial compression tests. Exploiting orthotropic symmetry, the aforementioned
experimental dataset gives access to all nine independent elastic properties, and this allows
MANUSCRIP
T
ACCEPTED
ACCEPTED MANUSCRIPT
Page 4
us to determine all Poisson’s ratios. However, the quasi-static tests bear an additional
challenge as compared to the original campaign on wood [20], in form of the very
pronounced creep of the WPCs. Hence, utmost care has been devoted to the fact that elastic
deformations should be measured in time scales where creep deformations have either not
occurred to a remarkable degree yet, or have already largely faded away. This will be
described in great detail in the section on mechanical tests, which is preceded by a
description of the material and of the conducted ultrasonic tests. The paper is completed by
a summary of the determined orthotropic elastic constants, and a few relevant conclusions.
2. Materials and Methods
2.1 Bagasse fiber-polypropylene composite specimens
Here, we characterize a bagasse fiber-polypropylene composite with a density of 1.1 g cm-3,
provided by the Iranian producer Dez choopex Co. The material consists of 60 wt%
bagasse fibers (50 mesh size, i.e. 300 micrometer diameter according to [25]), 30 wt%
polypropylene as polymer matrix, 4 wt% maleic anhydride polypropylene as
compatibilizer, and 6 wt% other additives. The additives include UV stabilizers and
lubricants, which improve the flowability and decrease the viscosity of the molten plastics.
The raw materials were dry blended, and the composite was extruded using a counter
rotating twin-screw-extruder combined with an I-shaped cross section die.
Light microscopic images of cross-sections parallel and normal to the extrusion direction
were taken, in order to qualitatively visualize the size and the orientation of the bagasse
fibers (Fig. 1). The length and width of the bagasse fibers typically amounted to 1000 µm

MANUSCRIP
T
ACCEPTED
ACCEPTED MANUSCRIPT
Page 5
and to 300 µm, respectively. In addition, bagasse fibers were quite well aligned with the
extrusion direction (Fig. 1a).
Specimens for both ultrasonic and quasi-static tests were cut out from the web of the I-
shaped profile (Fig. 2). For all computations performed in this paper, we use a Cartesian
coordinate system to label the principal directions of the specimens: the x1-axis is aligned
with the extrusion direction, the x2-axis points in thickness direction of the web, and the x3-
axis runs in the web plane, normal to the extrusion direction (Fig. 2).
2.2 Ultrasonics testing
Ultrasonics experiments were carried out by means of a pulse transducer 5077PR -
Olympus NDT, an oscilloscope WaveRunner 62Xi - Lecroy, and transducers with
frequencies of 100 kHz and 250 kHz, respectively. Thin layers of honey ensured good
contact between the pulse transducers and the investigated specimens. Nine samples with
nominal dimensions of 51×13×13 mm3 were insonified by both longitudinal and transversal
ultrasonic waves (the former at a frequency of 100 kHz, and the latter at 250 kHz), in three
orthogonal directions aligned with the three principal material directions (Fig. 2).
Homogenized material properties of microheterogeneous materials (such as ultrasound-
derived elastic properties) are defined on representative volume elements (RVEs). They
exhibit a characteristic size ���� satisfying the separation of scales principle [26]: λ ≫���� ≫ �, where�stands for the characteristic length of inhomogenities inside the RVE,
and where λ denotes the characteristic length of mechanical loading, which in case of
ultrasonics testing, is equal to the wave length. Considering that the inequality ���� ≫ � is
typically satisfied (with maximum errors amounting to 5 %) if ���� is by a factor of 2 larger

MANUSCRIP
T
ACCEPTED
ACCEPTED MANUSCRIPT
Page 6
than� [27], the minimum RVE size ���� amounts to 2 mm in extrusion direction, and to
0.6 mm normal to the extrusion direction. Considering that the inequality λ ≫ ���� is
typically satisfied if λ is by a factor of 6 larger than���� [28], the wavelength should be
larger than 12 mm in extrusion direction, and larger than 3.6 mm normal to the extrusion
direction. The wavelength λ, in turn, is readily accessible from the measured wave speed V
and from the chosen signal frequency f as
= ��. (1)
The wave speed is equal to the travel distance s of the wave divided by the travel time t of
the signal
= ��. (2)
Each test was carried out nine times, allowing us to compute meaningful average values
and standard deviations of ultrasonic wave travel times t, wave velocities V, and
wavelengths λ (Table 1). For the sake of clarity, velocity symbols are marked with two
indexes: the first index denotes the travel direction of the wave and the second index stands
for the direction of particle displacements induced by the wave. In case of longitudinal
waves, where the particle oscillation direction is parallel to the direction of wave
propagation, both indexes are the same. In case of shear waves, where particles oscillate
perpendicular to the wave propagation direction, the two indexes are different.
Stiffness tensor components can be computed from the mass density ρ = 1.1 g cm-3 of the
composite, and the ultrasonic wave velocities, according to the theory of wave propagation
in elastic media [29]
����� = � ���, (3)
and

MANUSCRIP
T
ACCEPTED
ACCEPTED MANUSCRIPT
Page 7
����� = � ���. (4)
Accordingly, the normal stiffness tensor components C1111, C2222, and C3333 are related to
longitudinal wave velocities ��, ��, and ��; while the shear stiffness components C1212,
C1313, and C2323, which are equal to the shear moduli G12, G13, and G23, respectively, are
related to transversal wave velocities ��, ��, and ��.
2.3 Mechanical testing
Uniaxial, quasi-static mechanical testing in compression was carried out in all three
principal material directions, using a universal electromechanical testing machine of type
BT1-FB050TN of manufacturer Zwick/Roell. Rectangular specimens with nominal
dimensions of 25×13×13 mm3 and 13×13×25 mm3 (directions l1×l2×l3) were used for
compression tests in directions x1 and x3, while specimens with nominal dimensions of
6×13×6 mm3 were used for measurements in direction x2, see Fig. 2. For each material
direction, five replicates were tested.
Three step-like loading-unloading cycles with progressively increasing load levels were
applied. In order to account for the different specimen dimensions, the corresponding
compressive force levels were 0.8, 1.6, and 3.2 kN in directions x1 and x3, and 0.2, 0.4, and
0.8 kN in direction x2. This resulted in comparable compressive stress levels applied in the
different loading directions, namely amounting to 4.7, 9.5, and 18.9 N mm-2 in the x1 and x3
directions, as well as to 5.6, 11.1, and 22.2 N mm-2 in the x2 direction. At each of the three
load levels, the force was held constant for 600 s, in order to allow the initially significant
creep activity to fade away. Subsequently, the compressive load was slightly reduced so as
to determine unloading moduli. This accounts for the nature of elasticity as being related to

MANUSCRIP
T
ACCEPTED
ACCEPTED MANUSCRIPT
Page 8
the mechanically recoverable energy stored in the loaded sample [30-32]. After the
aforementioned slight unloading, the stresses were increased to a level exceeding the
formerly applied one. Loading and unloading were carried out under displacement control,
under consideration of the different specimen dimensions: In directions x1 and x3, the
loading and unloading rates were equal to 0.2 mm min-1 and 1 mm min-1, respectively,
while in direction x2, a loading rate of 0.1 mm min-1 and an unloading rate of 0.5 mm min-1
were prescribed. This resulted in comparable strain rates of 0.008 min-1 (loading) and
0.04 min-1 (unloading) for testing in directions x1 and x3, and of 0.0077 min-1 (loading) and
0.0385 min-1 (unloading) in direction x2. Force and displacement readings were recorded at
a data acquisition rate of 50 Hz. The Young’s moduli in all three orthotropic material
directions were determined from dividing the uniaxial stress rates measured at the
beginning of the unloading regime, by the corresponding strain rate imposed in terms of the
aforementioned displacement rates. In this context, it needs to be assured
that corresponding stress rates reflect elastic deformations only, and do not contain
remarkable contributions related to creep phenomena. Hence, creep deformations need to
have sufficiently faded out before the unloading procedure starts. This requirement can be
quantified in terms of a characteristic creep time ������ and a characteristic time of strain
evolution ����, namely the latter needs to significantly exceed the former, ���� ≫ ������.
The characteristic creep time is obtained through a viscoelastic chain representation [33] of
creep deformation histories under constant loads;
��������� = !" #� $1 − '( )*+,-
�, (5)

MANUSCRIP
T
ACCEPTED
ACCEPTED MANUSCRIPT
Page 9
with t as the time elapsed since the application of the constant load given in terms of a
uniaxial stress !, and with #� and /� as amplitude and characteristic time characterizing the
i-th viscoelastic chain element. n denotes the number of chain elements necessary to
minimize the error between measurement data and creep predictions according to Eq. (5),
to a value not exceeding a tolerated threshold value of TOL = 10-7
0 1��2���� − ���������3��� = ∑ 1��2���� − ���������3� < �678!!��9�8!!��9� . (6)The largest characteristic time /� in Eq. (5), stemming from minimization process in
Eq. (6), is then identified as the time ������ quantifying the duration of the overall creep
process,
/- = ������. (7)
On the other hand, the characteristic time of strain evolution, ���� , which indicates the
degree of creep fade-out at the time of unloading, � = �:-;�<= , follows the general
definition of a characteristic time according to [34],
�=�� = >��9�?@ABCD�>E ��9�?@ABCD�. (8)
3. Results and Discussion
3.1 Ultrasonic testing
Ultrasonic wave velocities as measured for the bagasse-fiber composite, together with
corresponding wave lengths, are reported in Table 1. The minimum longitudinal wave
velocity was measured normal to the extrusion direction and amounted to V22 = 1.83 km s-1
(see Figure 2 for the definition of material directions). It was obtained with a signal
frequency f = 100 kHz. Hence, Eq. (1) implies that minimum longitudinal wavelength
amounted to 18.3 mm, and this is larger than the required 3.6 mm. The minimum shear

MANUSCRIP
T
ACCEPTED
ACCEPTED MANUSCRIPT
Page 10
wave velocity, in turn, amounted to V32 = 1.06 km s-1. It was obtained with a signal
frequency f = 250 kHz. Hence, Eq. (1) implies that minimum shear wavelength amounted
to 4.24 mm, and this is larger than the required 3.6 mm. Hence, the separation-of scales
requirement is fulfilled, and the measured velocities can be used to determine the elastic
properties of the investigated composite.
Approximate identity of the ultrasonic shear wave velocities Vij and Vji (Table 1) evidences
the actual orthorhombic symmetry of the tested composite. Consequently, we use the
arithmetic mean of the two shear wave velocities for the further evaluation of stiffness
properties.
Stiffness properties as calculated according to Eqs. (3-4) are summarized in Table 2. The
normal stiffness in thickness direction, C2222, is considerably smaller than the normal
stiffness in the plane of the board. The stiffness in extrusion direction, C1111, in turn, is
slightly larger than the one in the perpendicular direction, C3333. This orthotropic behavior
can be explained by microstructural properties of the micro-heterogeneous composite
material. Bagasse fibers are stiffer than the polypropylene matrix. Since bagasse fibers are
predominantly oriented in extrusion direction, the highest stiffness values are observed in
this direction.
The shear stiffness in the plane of the board, C1313 =G13, is larger than the shear stiffnesses
in the out-of-plane directions, where C2323=G23 is smaller than C1212=G12. This is consistent
with the microstructural morphology described before.
3.2 Mechanical testing
MANUSCRIP
T
ACCEPTED
ACCEPTED MANUSCRIPT
Page 11
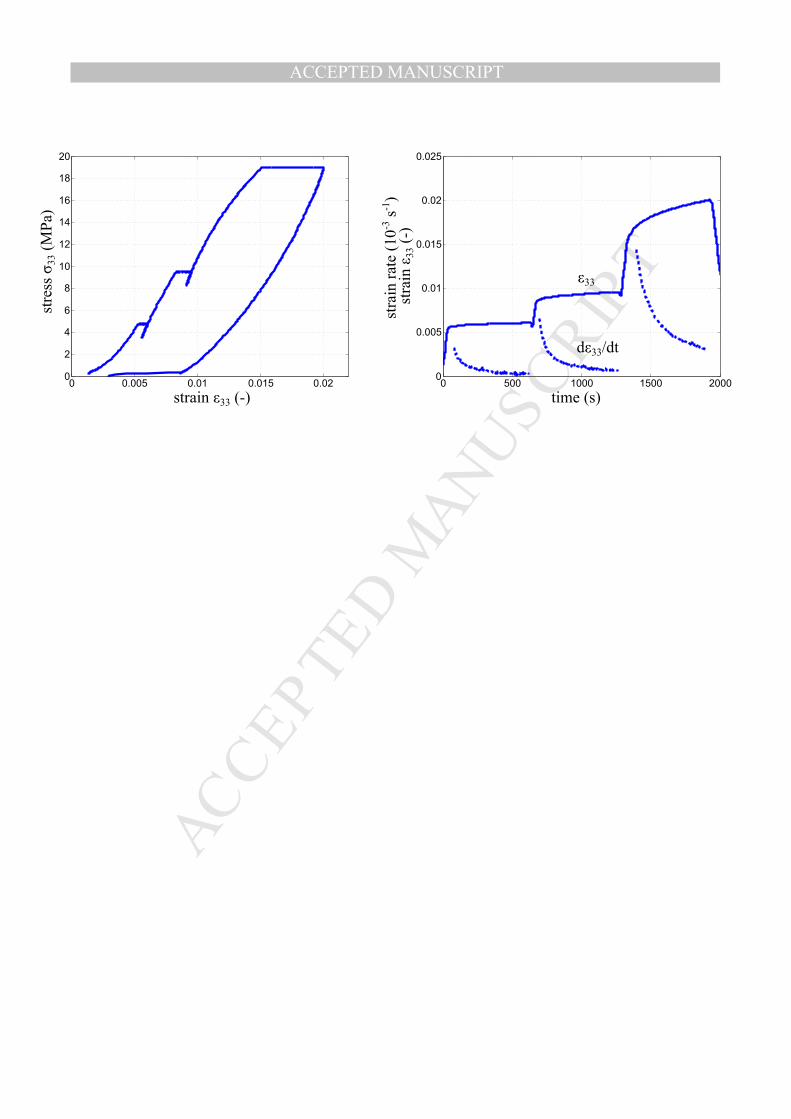
Representative stress-strain curves for three orthogonal directions are presented in Figs. 3-5
(left), together with the evolution of strains over time (solid lines in the right-hand images)
and the creep strain rate during the holding phase (dashed lines in the right-hand images).
The pronounced creep activity of the material results in non-linear stress paths even during
loading (Figs. 3-5). Deformation measurements taken during the constant load levels
quantify the creep activity in different material directions (see right-hand images in Figs. 3-
5). In plane directions x1 and x3 exhibit a similar mechanical performance, while a
considerably more compliant behavior was measured in the out-of-plane direction x2. As
expected, creep deformations are increasing with increasing stress levels. Consequently,
also strain rates (images on the right-hand side in Figs. 3-5) increase with increasing
stresses.
Characteristic creep times /� for the different material directions and for three different load
levels are summarized in Table 3. In each material direction and for the corresponding three
stress levels, the use of three characteristic creep times in Eq. (5) yielded values smaller
than the tolerated threshold value of TOL = 10-7, according to the minimization process in
Eq. (6).
Interestingly for all material directions, normalized strains ������/ ! during the first and
second load level are similar, which is also expressed by comparable characteristic creep
times (cf. Table 3). This indicates viscoelastic material behavior up to the corresponding
load levels. On the contrary, creep strains were considerably higher during the third load
plateau, which might indicate plastic deformations in addition to creep.
Characteristic creep times were highest in x2-direction (thickness direction) and smallest in
x1-direction (extrusion direction), see Table 3. This anisotropic (time-dependent) behavior
can be explained by microstructural properties of the micro-heterogeneous composite

MANUSCRIP
T
ACCEPTED
ACCEPTED MANUSCRIPT
Page 12
material. The time-dependent behavior of the bagasse fiber-polypropylene composite
mainly stems from the polypropylene matrix, while bagasse fibers are significantly less
creep active. Because of constraints during extrusion, bagasse fibers predominantly orient
themselves in extrusion x1-direction, see Fig. 1(a) [19]. Constraints in x2-direction
(thickness direction) are more pronounced than in x3-direction (in-plane direction), and this
makes it least likely that bagasse fibers are oriented in x2-direction (thickness direction), see
Fig. 1(b). Consequently, the visco-elastic behavior of polypropylene exhibits the strongest
effect in x2-direction, followed by the x3-direction, and rendering the x1-direction the least
creep active material direction.
A linear approximation of a specific section of the loading path, as often proposed by
standards, does not yield elastic material properties. However, elastic properties of such a
material can be determined under the assumption of an elastic immediate response when
unloading. As for determination of Young’s moduli, unloading branches were divided into
equal strain increments of 5×10⁻⁵, always starting from the end of each stress level.
Corresponding results are illustrated in Figs. 6-8, where the average values of elastic
modulus in three orthogonal directions, at different unloading strain increments, are shown
for different load levels.
Figs. 6-8 indicate a minor dependence of the unloading stiffness on the size of the
unloading strain increment, but larger moduli are observed for higher load levels. The latter
result can be explained by the creep activity right before unloading. Upon marginal
unloading, creep deformations will still result in a progressive shortening of the specimen,
while spontaneous elastic deformation will result in an elongation of the specimen. Creep-
related shortening counteracts the elasticity-related elongation such that unloading
elongations are underestimated, and this results in an overestimated stiffness. This effect is

MANUSCRIP
T
ACCEPTED
ACCEPTED MANUSCRIPT
Page 13
particularly pronounced in thickness direction x2, where the unloading stiffness determined
by unloading from the second stress plateau is considerably larger than the one determined
by unloading from the first stress plateau In contrast to this observation, a significant
increase of the unloading stiffness in in-plane-directions x1 and x2, is only found when
comparing results related to the second and the third stress plateau.
From a more quantitative standpoint, the aforementioned creep-induced error in the
determination of the elastic properties relates to the ratio of creep and strain evolution times
according to Eqs. (5-8): This creep-induced error goes to zero if the deformation time, �=��,
is considerably larger than the highest characteristic creep time, ������ . In Table 4, the
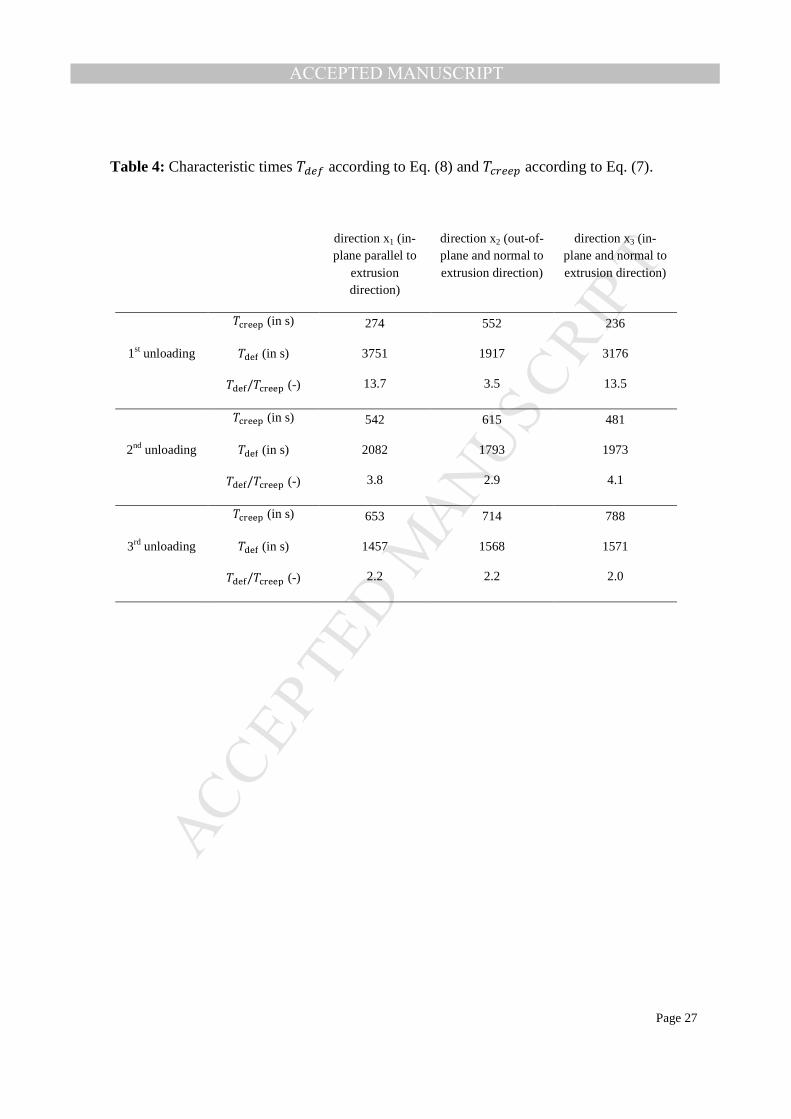
corresponding values are summarized for the different material orientations and load levels.
The factor between the deformation time and the characteristic creep time was the highest
at the end of the first load level, while it decreased for higher loads. Consistent with the
characteristic creep times, factors were highest in x1- and x3-direction, while lower values
were calculated for the thickness direction x2. The longitudinal and in-plane transverse
moduli E1 and E3, determined at stress levels 1 and 2 differed only very little from each
other (see Figs. 6-8), with the lowest corresponding �=��/������ ratio being as small as 3.8
(Table 4). Hence, such a ratio magnitude can be regarded as sufficiently large for virtually
excluding creep-induced error in unloading modulus-based elasticity determination. The
aforementioned value of 3.8 is also comparable to the �=��/������ ratio characterizing the
situation of the first unloading process in x2 direction. Consequently, the corresponding
modulus E2 can also be considered as elastic.
We summarize that the instantaneous unloading stiffnesses determined from unloading
processes at the end of stress level 1, represent the elastic properties of the material. In

MANUSCRIP
T
ACCEPTED
ACCEPTED MANUSCRIPT
Page 14
terms of Young’s moduli, they are: E1=3.68 (±0.80) GPa, E2=1.44 (±0.20) GPa, and
E3=2.79 (±0.35) GPa. The largest elastic stiffness is E1, which refers to the extrusion
direction, followed by the in-plane stiffness E3 in direction normal to the extrusion
direction. The smallest stiffness is given in out-of-plane direction, i.e. E2. Summarizing,
results from mechanical testing are consistent with results from ultrasonic testing.
3.3 Quantification of Poisson’s ratios and off-diagonal stiffness tensor components
from combined ultrasonic and quasi-static tests
A material with orthorhombic symmetry exhibits nine independent elastic constants. Given
that we have gained access to six stiffness tensor components via ultrasonic
characterization and to three Young’s moduli via quasi-static unloading, a complete
characterization of the material has been accomplished. Therefore, it is possible to quantify,
based on linear elasticity of orthotropic materials, numerical values of six Poisson’s ratios
and of three off-diagonal stiffness tensor components. The latter show up in the Kelvin-
Mandel representation [22-24] of the stiffness tensor referring to the principal material
directions,
H�I =JKKKKL����� ����� ���������� ����� ���������� ����� �����
0 0 00 0 00 0 00 0 00 0 00 0 02����� 0 00 2����� 00 0 2�����OP
PPPQ =
JKKKKL����� ����� ���������� ����� ���������� ����� �����
0 0 00 0 00 0 00 0 00 0 00 0 02R�� 0 00 2R�� 00 0 2R��OP
PPPQ, (9)
with shear moduli Gij. The compliance tensor [D] of the orthotropic material is the inverse
of the stiffness tensor, i.e. [D] = [C]-1, and the corresponding matrix-representation of [D]
reads as

MANUSCRIP
T
ACCEPTED
ACCEPTED MANUSCRIPT
Page 15
HSI =JKKKKLS���� S���� S����S���� S���� S����S���� S���� S����
0 0 00 0 00 0 00 0 00 0 00 0 02S���� 0 00 2S���� 00 0 2S����OP
PPPQ =
JKKKKKKKKKL �
TU − VUWTW − VUXTX− VWUTU�TW − VWXTX− VXUTU − VXWTW
�TX
0 0 00 0 00 0 0
0 0 00 0 00 0 0
��YWX 0 00 �
�YUX 00 0 �
�YUWOPPPPPPPPPQ
, (10)
with Young’s moduli Ei and Poisson’s ratios Z��, where subscripts i and j refer to directions
of lateral strain and applied stress respectively. Considering the orthorhombic symmetry of
the compliance tensor, there are nine independent elastic components including three
independent Poisson’s ratios. The remaining three Poisson’s ratios are dependent quantities
and satisfy the conditions Z��/[� = Z��/[� . Isotropic elastic materials exhibit just one
Poisson’s ratio and it is bounded between -1 and 0.5. Anisotropic materials, in turn, exhibit
several Poisson’s ratios without theoretical bounds, as long as the strain energy density is
positive definite [35].
Consideration of Eqs. (9-10) together with the condition [D] = [C]-1 yields the following
three equations for the determination of the Poisson’s ratios Z��, Z��, and Z�� as functions
(i) of the normal stiffness tensor components C1111, C2222, and C3333, as well as (ii) of the
Young’s moduli E1, E2, and E3, see also Eqs. (23-29) in [20]
Z�� = ��√�TWTX] -WU^UUUU^WWWW, (11)
Z�� = ��√�TWTX] -XU^UUUU^XXXX, (12)
Z�� = -XW�_UW_XW]`��`�� ^WWWW^XXXX, (13)
where
`�� = `�� − ℎ, (14)

MANUSCRIP
T
ACCEPTED
ACCEPTED MANUSCRIPT
Page 16
`�� = b�� − 2[�b���� + [��'�� − ℎ, (15)
`�� = b�� − 2[�b���� + [��'�� + ℎ, (16)
and
d = −16b�b�[��, (17)
f�� = b�−[����, (18)
f�� = b�−[����, (19)
`�� = b�� − 2[�b���� + [��'��, (20)
ℎ = gdf��� + `��� , (21)
with
'�� = b�� − 2[�b�h� + [��i��, (22)
'�� = b�� − 2[�b�i� + [��i��, (23)
'�� = b�� − 2[�b�i� + [��i�h�, (24)
��� = b� − [�i�, (25)
��� = b� + [�i�, (26)
��� = b� + [�[� − 3b�, (27)
��� = b� + [�[� − b�, (28)
b� = �����[�, b� = �����[�, b� = �����[�[�, (29)
i� = [� + �����, i� = [� − �����, h� = [� + 3�����, h� = [� − 3�����. (30)
Inserting stiffness tensor components as measured by means of ultrasonic testing as well as
Young’s moduli as measured by means of mechanical testing into Eqs. (11-13) yields
Poisson’s ratios and off-diagonal stiffness tensor components of the orthotropic material as

MANUSCRIP
T
ACCEPTED
ACCEPTED MANUSCRIPT
Page 17
given in Table 5. The determined Poisson’s ratio values lie between 0.230 and 0.722.
Corresponding off-diagonal stiffness tensor components range between 3.479 and
4.273 GPa. For the pair of in-plane Poisson’s ratios Z�� and Z��, values close to each other
are found, while the other two pairs of Poisson’s ratios showed larger differences. This is a
result of the anisotropy of the material, which is most pronounced between the in-plane and
out-of plane directions.
Considering the statistical variation of stiffnesses and Young’s moduli obtained from
ultrasonic and quasi-static testing, respectively, allows for quantifying the statistical
variations of Poisson’s ratios determined by the above described approach, see Table 5.
Notably, the out-of plane Poisson’s ratios are less sensitive than the in-plane Poisson’s
ratios, and this can be explained by the variability of the Young’s modulus E1, which is
significantly larger than the variability of E2 and E3.
4. Conclusions
The aim of this research was to characterize elastic properties for an orthotropic bagasse
fiber-polypropylene composite by combining ultrasonics and mechanical testing. The
following conclusions can be drawn from the present study:
• The stiffest material behavior was measured in extrusion direction, both in
ultrasonics and quasi-static tests. This indicates that bagasse fibers are
predominantly oriented in this direction.
• The differences of shear wave velocities in three pairs of orthogonal directions were
found to be very small, evidencing orthorhombic symmetry of the studied
composite.
MANUSCRIP
T
ACCEPTED
ACCEPTED MANUSCRIPT
Page 18
• Significant creep deformations were observed in compression tests. They were
particularly significant in the thickness direction x2, where the impact of the
polypropylene matrix is strongest because it is least likely that bagasse fibers are
aligned with the x2-direction.
• In order to obtain realistic values for Young’s moduli, creep deformations must be
excluded from the analysis. Therefore, unloading stiffness was determined after a
sufficiently long stress level, whereby the latter was small enough such that creep
deformations had practically faded out before unloading took place.
• As a novel contribution, Poisson’s ratios of the orthotropic material and off-
diagonal stiffness tensor components were calculated by combining ultrasonics and
quasi-static test data.
5. References
[1] Luz SM, Goncalves AR and Del’Arco AP. Mechanical behavior and microstructural
analysis of sugarcane bagasse fibers reinforced polypropylene composites, Compos Part
A-Appl S 2007;38:1455–1461.
[2] Moubarik A, Grimi N, Boussetta N. Structural and thermal characterization of Moroccan
sugar cane bagasse cellulose fibers and their applications as a reinforcing agent in low
density polyethylene, Compos Part B-Eng 2013;52:233–238.
[3] Yan L, Kasal B, Huang L, A review of recent research on the use of cellulosic fibres,
their fibre fabric reinforced cementitious, geo-polymer and polymer composites in civil
engineering, Compos Part B-Eng 2016;92:94–132.
[4] Verma D, Gope PC, Maheshwari MK, Sharma RK. Bagasse Fiber Composites – A
Review. J Mater Env Sci 2012;3(6):1079–1092.

MANUSCRIP
T
ACCEPTED
ACCEPTED MANUSCRIPT
Page 19
[5] Xue Y, Veazie DR, Glinsey C, Horstemeyer MF, Rowell RM, Environmental effects on
the mechanical and thermomechanical properties of aspen fiber–polypropylene
composites, Compos Part B-Eng 2007;38(2):152–158.
[6] Cai ZH, Ross RJ. Mechanical properties of wood-based composite materials. In: Wood
handbook, Forest Products Laboratory, 2011. p.12.1–12.12.
[7] Haiar KJ. Performance and design of prototype wood-plastic composite sections. MSc
thesis, Washington State University, 2000.
[8] Odell J. Wood plastic composite sill plate for continuous anchorage of shear walls in light
frame wood structures. MSc thesis, Washington State University, 2008.
[9] Arrakhiz FZ, Malha M, Bouhfid R, Benmoussa K, Qaiss A. Tensile, flexural and
torsional properties of chemically treated alfa, coir and bagasse reinforced polypropylene,
Compos Part B-Eng 2013;47:35–41.
[10] Ashori A, Nourbakhsh A. Polypropylene Cellulose-Based Composites: The Effect of
Bagasse Reinforcement and Polybutadiene Isocyanate Treatment on the Mechanical
Properties, J Appl Polym Sci 2009;111:1684–1689.
[11] Nourbakhsh A, Kouhpayehzadeh M. Mechanical properties and water absorption of fiber-
reinforced polypropylene composites prepared by bagasse and beech fiber, J Appl Polym
Sci 2009;114:653–657.
[12] Cao Y, Goda K, Shibata S. Development and mechanical properties of bagasse fiber
reinforced composites, Adv Compos Mater 2007;16(4):283–298.
[13] Cerqueira EF, Baptista CARP, Mulinari DR. Mechanical behavior of polypropylene
reinforced sugarcane bagasse fibers composites, Procedia Eng 2011;10:2046–2051.
[14] Vázquez A, Domínguez VA, Kenny JM. Bagasse Fiber-Polypropylene Based
Composites, J Thermoplast Compos 1999;12:477–497.
MANUSCRIP
T
ACCEPTED
ACCEPTED MANUSCRIPT
Page 20
[15] Samariha A, Bastani A, Nemati M, Kiaei M, Nosrati H, Farsi M. Investigation of the
mechanical properties of bagasse flour/polypropylene composites, Mech Compos Mater
2013;49(4):447–454.
[16] Cao Y, Shibata S, Fukumoto I. Mechanical properties of biodegradable composites
reinforced with bagasse fibre before and after alkali treatments, Compos Part A-Appl S
2006;37:423–429.
[17] Rodrigues EF, Maia TF and Mulinari DR. Tensile strength of polyester resin reinforced
sugarcane bagasse fibers modified by estherification. Procedia Eng 2011;10: 2348–2352.
[18] Muszynski L. Imaging Wood Plastic Composites (WPCs): X-Ray computed
tomorgraphy, a few other promising techniques, and why we should pay attention,
Bioresources 2009;4(3):1210–1221.
[19] Prapathanssiou TD, Guell DC. Flow Induced Alignment in Composite
Materials, Woodhead Pub., England, 1997.
[20] Kohlhauser C, Hellmich C. Determination of Poisson’s ratios in isotropic, and orthotropic
materials by means of combined ultrasonic-mechanical testing of normal stiffnesses:
application to metals and wood, Eur J Mech A-Solids 2012;33:82–98.
[21] Kriz R, Stinchcomb W. Elastic moduli of transversely isotropic graphite fibers and their
composites. Exp Mech 1979;19(2):41–49.
[22] Walpole LJ. Fourth-Rank Tensors of the Thirty-Two Crystal Classes: Multiplication
Tables. Proc R Soc Lond A 1984;391:149–179.
[23] Mehrabadi MM, Cowin SC. Eigentensors of linear anisotropic elastic materials, Q J
Mech Appl Math 1990;43:15–41.
[24] Helnwein P. Some remarks on the compressed matrix representation of symmetric
second-order and fourth-order tensors, Comput Method Appl M 2001;190(22-23):2753–
2770.

MANUSCRIP
T
ACCEPTED
ACCEPTED MANUSCRIPT
Page 21
[25] ASTM E11-95, Standard Specification for Wire Cloth and Sieves for Testing Purposes,
ASTM International, West Conshohocken, PA, 2001.
[26] Zaoui A. Continuum micromechanics: survey. J Eng Mechan (ASCE) 2002;128(8):808–
816.
[27] Drugan WJ, Willis JR. A micromechanics-based nonlocal constitutive equation and
estimates of representative volume element size for elastic composites, J Mech Phys
Solids 1996;44:497–524.
[28] Kohlhauser C, Hellmich C. Ultrasonic contact pulse transmission for elastic wave
velocity and stiffness determination: Influence of specimen geometry and porosity, Eng
Struct 2013;47:115–133.
[29] Carcione J. Wave Fields in Real Media: Wave Propagation in Anisotropic, Anelastic and
Porous Media. In: Handbook of Geophysical Exploration – Seismic exploration, first ed.,
vol. 31. Pergamon Elsevier Science Ltd., Oxford, United Kingdom, 2001.
[30] Coussy O. Poromechanis. John Wiley & Sons, Ltd, England, 2004.
[31] Luczynski KW, Brynk T, Ostrowska B, Swieszkowski W, Reihsner R, Hellmich C.
Consistent quasistatic and acoustic elasticity determination of poly-L-lactide-based rapid-
prototyped tissue engineering scaffolds. J Biomed Mater Res A 2013;101A:138–144.
[32] Luczynski KW, Steiger-Thirsfeld A, Bernardi J, Eberhardsteiner J, Hellmich C.
Extracellular bone matrix exhibits hardening elastoplasticity and more than double
cortical strength: Evidence from homogeneous compression of non-tapered single
micron-sized pillars welded to a rigid substrate. J Mech Behav Biomed Mat 2015;
doi:10.1016/j.jmbbm.2015.03.001.
[33] Lakes RS. Viscoelastic solids. CRC press LLC, 1999.
[34] Auriault JL, Boutin C, Geindreau C. Homogenization of Coupled Phenomena in
Heterogenous Media. Wiley-ISTE, 2010.

MANUSCRIP
T
ACCEPTED
ACCEPTED MANUSCRIPT
Page 22
[35] Ting, TCT, Chen T. Poisson's ratio for anisotropic elastic materials can have no bounds,
Q J Mech Appl Math 2005;58(1):73–82.
MANUSCRIP
T
ACCEPTED
ACCEPTED MANUSCRIPT
Page 23
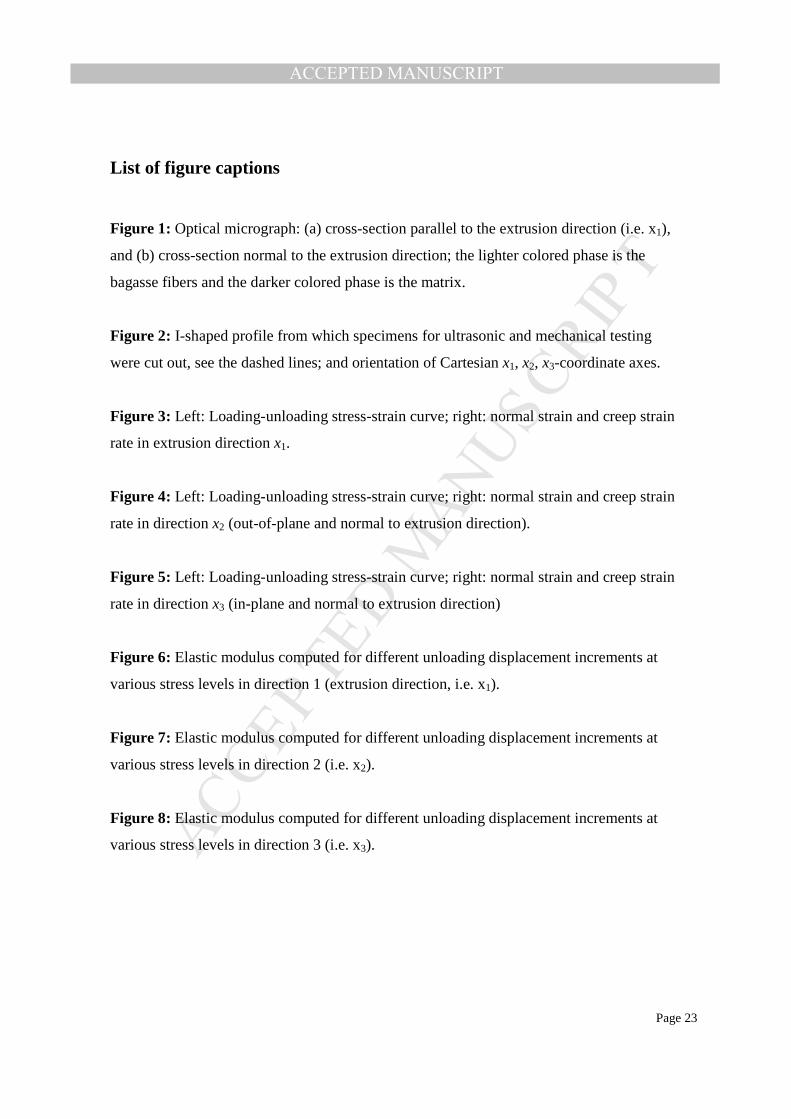
List of figure captions
Figure 1: Optical micrograph: (a) cross-section parallel to the extrusion direction (i.e. x1),
and (b) cross-section normal to the extrusion direction; the lighter colored phase is the
bagasse fibers and the darker colored phase is the matrix.
Figure 2: I-shaped profile from which specimens for ultrasonic and mechanical testing
were cut out, see the dashed lines; and orientation of Cartesian x1, x2, x3-coordinate axes.
Figure 3: Left: Loading-unloading stress-strain curve; right: normal strain and creep strain
rate in extrusion direction x1.
Figure 4: Left: Loading-unloading stress-strain curve; right: normal strain and creep strain
rate in direction x2 (out-of-plane and normal to extrusion direction).
Figure 5: Left: Loading-unloading stress-strain curve; right: normal strain and creep strain
rate in direction x3 (in-plane and normal to extrusion direction)
Figure 6: Elastic modulus computed for different unloading displacement increments at
various stress levels in direction 1 (extrusion direction, i.e. x1).
Figure 7: Elastic modulus computed for different unloading displacement increments at
various stress levels in direction 2 (i.e. x2).
Figure 8: Elastic modulus computed for different unloading displacement increments at
various stress levels in direction 3 (i.e. x3).

MANUSCRIP
T
ACCEPTED
ACCEPTED MANUSCRIPT
Page 24
Table 1: Average values and standard deviations (given in brackets) of measured ultrasonic
wave travel times t, wave velocities V computed according to Eq. (2), and wavelengths λ computed according to Eq. (1).
travel time of ultrasound waves (in µs)
t11 t22 t33 t12 t21 t13 t31 t23 t32
19.69 (±0.78)
7.10 (±1.10)
5.44 (±1.16)
43.22 (±1.97)
11.50 (±0.35)
39.84 (±1.02)
10.08 (±0.51)
12.04 (±2.09)
12.26 (±2.37)
wave velocities (in km s-1)
V11 V22 V33 V12 V21 V13 V31 V23 V32
2.59 (±0.06)
1.83 (±0.11)
2.39 (±0.14)
1.18 (±0.05)
1.13 (±0.03)
1.28 (±0.34)
1.29 (±0.48)
1.08 (±0.09)
1.06 (±0.02)
wavelength (in mm)
λ11 λ22 λ33 λ12 λ21 λ13 λ31 λ23 λ32
25.9 18.3 23.9 4.72 4.54 5.11 5.15 4.32 4.24

MANUSCRIP
T
ACCEPTED
ACCEPTED MANUSCRIPT
Page 25
Table 2: Mean values and standard deviation (given in brackets) of stiffness tensor
components derived from ultrasonics testing according to Eqs. (3-4).
stiffness tensor component
mean value (in GPa)
standard deviation (in GPa)
C1111 7.39 ± 0.37
C2222 3.68 ± 0.73
C3333 6.29 ± 0.26
C1313=G13 1.82 ± 0.11
C1212=G12 1.47 ± 0.09
C2323=G23 1.26 ± 0.08

MANUSCRIP
T
ACCEPTED
ACCEPTED MANUSCRIPT
Page 26
Table 3: Characteristic creep times /� and normalized amplitudes #� determined according
to Eq. (5).
direction x1 (in-plane parallel to extrusion direction)
direction x2 (out-of-plane and normal to extrusion
direction)
direction x3 (in-plane and normal to extrusion
direction)
1st holding
#� = 1.810·10-5
#� = 3.824·10-5
#� = 8.823·10-5
/�= 4.21 s
/� =29.24 s
/� = 273.70 s
#� = 7.050·10-5
#� = 2.180·10-4
#� = 5.612·10-4
/�= 8.44 s
/� = 56.68 s
/� = 551.8 s
#� = 1.916·10-5
#� = 4.283·10-5
#� = 1.032·10-4
/�= 4.64 s
/� = 30.56 s
/� = 236.30 s
2nd holding
#� = 2.243·10-5
#� = 3.069·10-5
#� = 8.680·10-5
/�= 12.61 s
/� = 76.69 s
/� = 542.20 s
#� = 1.175·10-4
#� = 3.195·10-4
#� = 8.772·10-4
/�= 21.18 s
/� = 90.66 s
/� = 614.70 s
#� = 1.710·10-5
#� = 3.264·10-5
#� = 1.046·10-4
/�= 11.23 s
/� = 56.69 s
/� = 480.50 s
3rd holding
#� = 1.459·10-5
#� = 5.781·10-5
#� = 2.083·10-4
/�= 16.63 s
/� = 84.09 s
/� = 653.20 s
#� = 6.463·10-5
#� = 2.531·10-4
#� = 7.719·10-4
/�= 28.17 s
/� = 107.10 s
/� = 713.60 s
#� = 3.615·10-5
#� = 7.788·10-5
#� = 2.671·10-5
/�= 18.61 s
/� = 94.15 s
/� = 788.00 s
MANUSCRIP
T
ACCEPTED
ACCEPTED MANUSCRIPT
Page 27
Table 4: Characteristic times �=�� according to Eq. (8) and ������ according to Eq. (7).
direction x1 (in-plane parallel to
extrusion direction)
direction x2 (out-of-plane and normal to extrusion direction)
direction x3 (in-plane and normal to extrusion direction)
1st unloading
�klmmn (in s) 274
3751
13.7
552
1917
3.5
236
3176
13.5
�omp (in s)
�omp/�klmmn (-)
2nd unloading
�klmmn (in s) 542
2082
3.8
615
1793
2.9
481
1973
4.1
�omp (in s)
�omp/�klmmn (-)
3rd unloading
�klmmn (in s) 653
1457
2.2
714
1568
2.2
788
1571
2.0
�omp (in s)
�omp/�klmmn (-)

MANUSCRIP
T
ACCEPTED
ACCEPTED MANUSCRIPT
Page 28
Table 5: Poisson’s ratios obtained from combined ultrasonics (C1111=7.39 GPa ,
C2222=3.68 GPa, C3333=6.29 GPa) and quasi-static mechanical tests (E1=3.68 GPa,
E2=1.44 GPa, E3=2.79 GPa).
Poisson’s ratios (-) off-diagonal stiffness tensor components (in GPa)
mean mean-std mean+std mean mean-std mean+std
Z�� 0.678 0.606 0.791 C1122 3.554 3.198 3.792
Z�� 0.265 0.261 0.289 C1133 4.273 4.659 3.572
Z�� 0.304 0.473 0.079 C2233 3.479 2.985 3.864
Z�� 0.230 0.401 0.055
Z�� 0.373 0.293 0.432
Z�� 0.722 0.577 0.829

MANUSCRIP
T
ACCEPTED
ACCEPTED MANUSCRIPT
500 μm 500 μm
x1
x3
x2
x3
(a) (b)

MANUSCRIP
T
ACCEPTED
ACCEPTED MANUSCRIPT
x1
x3
x2
Ultrasound Mechanical testingdirection 1 direction 2 direction 3
13 mm
1351 25
13 mm
13
25 mm13
136 mm
136

MANUSCRIP
T
ACCEPTED
ACCEPTED MANUSCRIPT
0 0.005 0.01 0.015 0.020
2
4
6
8
10
12
14
16
18
20
0 500 1000 1500 20000
0.002
0.004
0.006
0.008
0.01
0.012
0.014
0.016
0.018
strain ε11 (-)
stre
ss σ
11 (
MP
a)
time (s)st
rain
ε11
(-)
stra
in r
ate
(10-3
s-1
)
ε11
dε11/dt

MANUSCRIP
T
ACCEPTED
ACCEPTED MANUSCRIPT
0 0.02 0.04 0.06 0.08 0.10
5
10
15
20
25
0 500 1000 1500 2000 25000
0.01
0.02
0.03
0.04
0.05
0.06
0.07
0.08
0.09
0.1
strain ε22 (-)
stre
ss σ
22 (
MP
a)
time (s)
stra
in ε
22 (
-)st
rain
rat
e (1
0-3 s
-1)
ε22
dε22/dt
MANUSCRIP
T
ACCEPTED
ACCEPTED MANUSCRIPT
0 0.005 0.01 0.015 0.020
2
4
6
8
10
12
14
16
18
20
0 500 1000 1500 20000
0.005
0.01
0.015
0.02
0.025
strain ε33 (-)
stre
ss σ
33 (
MP
a)
time (s)st
rain
ε33
(-)
stra
in r
ate
(10-3
s-1
)
ε33
dε33/dt

MANUSCRIP
T
ACCEPTED
ACCEPTED MANUSCRIPT
0 1 2 3 40
500
1000
1500
2000
2500
3000
3500
4000
4500
5000
You
ng's
mod
ulus
E1
(MP
a)
unloading strain increment (10-4)
stress level 1stress level 2stress level 3
max
min
mean

MANUSCRIP
T
ACCEPTED
ACCEPTED MANUSCRIPT
0 0.2 0.4 0.6 0.8 10
500
1000
1500
2000
2500
3000
3500
stress level 1stress level 2stress level 3
You
ng's
mod
ulus
E2
(MP
a)
unloading strain increment (10-3)
max
min
mean

MANUSCRIP
T
ACCEPTED
ACCEPTED MANUSCRIPT
0 1 2 3 40
500
1000
1500
2000
2500
3000
3500
4000
stress level 1stress level 2stress level 3
You
ng's
mod
ulus
E3
(MP
a)
unloading strain increment (10-4)
max
min
mean