Embed Size (px)
Citation preview

IOSR Journal of Mechanical and Civil Engineering (IOSR-JMCE)
ISSN: 2278-1684 Volume 4, Issue 4 (Nov-Dec. 2012), PP 26-42 www.iosrjournals.org
www.iosrjournals.org 26 | Page
Six Sigma practice for quality improvement – A case study of
Indian auto ancillary unit
Dr. Rajeshkumar U. Sambhe
Department of Mechanical Engineering Jawaharlal Darda Institute of Engg. & Technology M.I.D.C. Area,
Lohara, Yavatmal-445001 Maharashtra, India.
Abstract : Indian automotive ancillary units are one of the swift growing within the small and mid-sized group
of industries which are influential contributors to the complete production of auto components. With the ascent
in interrogation of growing customers and presuming for resplendent quality of their product, some of giant
Indian organizations are inspiring their suppliers to employ Six Sigma in order to improve the quality of their
process and products for embellishing competitive advantage. This paper focus on a case of provoked mid-sized
auto ancillary unit consisting of 350-400 employee and employed Six Sigma (SS) methodologies to elevate
towards the dream of SS quality level. The methodology is executed on one of product assembly for trimming down defects level which are critical to customers and its implementation has had a significant financial hit on
the bottom-line of the enterprise.
Keywords: Indian SMEs, Six Sigma, DMAIC, Critical to Quality, Successful implementation
I. Introduction As per automotive survey, the Indian automobile industry is the largest three wheeler market in the
world, 2nd largest two wheeler market in the world, 4th largest passenger vehicle market in Asia, 4th largest
tractor market in the world and 5th largest commercial vehicle market in the world (A report by KPMG for
IBEF, 2006). India is emerging as one of the most attractive automotive markets in the globe, and is poised to become a key sourcing base for auto components. Many enterprises think to shift in the higher tier but no
production enterprise can expect persistence success without company detainment on product quality. The
productive capacity in auto ancillary enterprises in India is in essence excelling than contrasting sectors and it
has an elephantine potency to promote improvement, which in turn will extract the effectiveness of absolute
manufacturing sector. Hence it becomes imperative to ascertain ingredients that frame manufacturing in India to
deliver right quality and perk up the competitiveness. The attainment of large company‟s quality is essentially
relying on the delivery of goods with elevated quality and honest services from suppliers, which are most likely
to be small medium scale enterprises (SMEs) and are the vital spark of modern economies. SMEs should remain
combative and compose high quality yield is of importance notability at the small and mid-sized but also for
giant enterprises. In case, destitution of commodity quality in SMEs would impinge upon and affect the
competence of the larger corporations.
As such, innumerable new techniques have been developed to improve quality, reduce cost and improve responsiveness. Many more quality practices and frameworks have been developed, built or strategized
to escalate the competitiveness of businesses in the modern world. Statistical Process Control (SPC), ISO 9000,
KAIZEN, Total Quality Management (TQM), Benchmarking, Theory of constraints, Business Excellence
models, and other improvement programs have been adopted and implemented by various enterprises. However,
Six Sigma (SS) is a quality improvement methodology developed by Motorola. It was proclaimed as a new
approach to improving quality through statistical measurements and benchmarking. Despite the apparent
popularity of Six Sigma, very little is known about the extent to which Six Sigma has actually been adopted by
various firms in the India, specifically SMEs, the patterns of adoption across industrial sectors and occupational
groups and the factors that differentiate firms that heavily adopt Six Sigma from those that do not. According to
IDC report (2008), Department of Scientific & Industrial Research (DSIR), small and medium enterprises can
be defined as “Small enterprises are those companies who have an investment in plant and machinery of up to INR 5 Crores. Medium enterprises are the ones who have an investment between INR 5 Crores to INR 10
Crores in plant and machinery. Companies having a turnover of up to INR 50 Crores were considered as small
company and companies with turnover in the range of Rs. 50 to 250 Crores were considered as medium
companies”. As there are abundant benefits from Six Sigma implementation but there are many more issues in
regards to small medium scale enterprises. So, it is necessity to rivet on these problems under consideration
before the implementation and deployment of Six Sigma strategy. The availability of human capital is the
crucial challenge for SMEs. The other factors as to the constraints are technical coherence, financial attributes
and inadequate experience also had been an issue of concern for SMEs. Expensive consultation is major barrier
in concern of SMEs and so designing training methodology which can afford to SMEs as rigorous need. The

Six Sigma practice for process improvement – A case study of medium scale auto ancillary unit
www.iosrjournals.org 27 | Page
giant auto sectoral Indian organizations like TATA motors initiated encouraging their supplier to apply the well-
ascertain SS as a quality management practice.
II. COMPARING SIX SIGMA WITH QUALITY MANAGEMENT PRACTICES In general, quality management approaches can be classified into two broad categories, industry-
specific QM and non-industry-specific QM. For example, some QM program such as ISO 14000, AS9100, QS
9000, and TL 9000 are industry specific and others, including Lean management, Six Sigma, Total Quality
Management, and ISO 9000:2000, are company-wide quality management programs. Commonly observed
benefits of ISO are better documentation, quality awareness and help to take more market advantage. Total
quality management is a never-ending process to satisfy both the internal and the external customers and the
core ideas presented by Deming, Juran, Crosby, and Ishikawa are the key elements of TQM. Lean Management
mainly focuses on Process flow (Bell, R., 2011). SS seeks to improve the quality of process (Pfeifer, T. et. al, 2004) outputs by identifying and removing the causes of defects (errors) and minimizing variability in
manufacturing and business processes (Does, R. et. al, 2002). But Six Sigma is all about process performance
and TQM focuses on all activities.
III. FACETS OF SIX SIGMA IMPLEMENTATION IN SMEs The motivation behind Six Sigma is to reduce the cost that arises from poor quality. Quality related
costs have been measured to be as much as 40% of sales in some organizations. These costs, known as the Costs
of Poor Quality (COPQ), can occur in many different ways ranging from scrapping of work in process, customer
returns after the products are sold and even retyping letters (Berghe W., 1997). The limited resources of a small or medium size organization can pose difficulties for the implementation of Six Sigma such as employee
education, flow of information and practical experimentation (Patel, D. 2004).The common norm that surrounds
the hierarchy of necessary green, yellow and black belt training can be misleading for small organizations. A
successful implementation in a small organization does not require all levels of training. Gnibus and Krull
(2003) noticed in their testing that training to the green belt level yielded excellent results for the organization in
their test. The training can be costly and time consuming and only training to a green belt level can prove
successful without the excessive costs involved with other levels of training. There are two options regarding the
training for Six Sigma (Pandey, A. 2007).
An organization can develop an in-house education structure or can hire an outside firm. Breyfogle et
al. states that an in-house training program is probably not the best idea because it can take years to develop the
needed resources to have a successful program. If an outside firm is hired they will commonly train a smaller group of people and allow those people to use the training material to train others in the organization. This
process will be a faster and more effective structure due to the experience the trainers have with Six Sigma. It
may look more expensive in the beginning, but the cost of employees developing a program that is not effective
would cost a great deal more. A small organization will not likely have the resources to develop any kind of
effective Six Sigma training and will have the most success by hiring a competent firm to educate a handful of
individuals to manage projects within the company. Thomas et al. showed success in a small organization with
only one individual trained to the black belt level. Gnibus and Krull observed successful results with a handful
of individuals trained to the green belt level. These are two different approaches that both yielded success. This
shows that the implementation‟s success does not depend on the level of the training, but on the ability of
individuals to teach, connect, communicate, learn and understand the scope of the education, not only applying
it to problems faced but extending it to new types of unforeseen problems. A small organization can be
successful at implementing the Six Sigma plan using these principles. Patel D. (2004) also bring into focus that the level of training does not determine the degree of success
the organization will have. If the organization is willing to adopt the methodologies and work with a limited
amount of training, they will be able to successfully apply it to the issues that will arise in the organization even
though they have not trained to the extent of much larger organizations. Specific case illustrations are which are
discussing successful application of Six Sigma at small and medium sized Indian industries (Desai, 2008, 2006).
But an exhaustive empirical study of mid-sized automotive sectors of Indian industries with Six Sigma is
unapproachable in research publications.
IV. SIX SIGMA IMPLEMENTATION- CASE STUDY SIX SIGMA
Kumi et. al., (2006) defined Six Sigma is a statistical measure of the performance of a process or
product. It is used as a quality control mechanism, which seeks to reduce defects or variations in a process to 3.4
per million opportunities thereby optimizing output and increasing customer satisfaction. This is as close to
perfection as possible as 99.99966 per cent of the time it would be perfect. In addition to Six Sigma is uniquely

Six Sigma practice for process improvement – A case study of medium scale auto ancillary unit
www.iosrjournals.org 28 | Page
driven by close understanding of customer needs, disciplined use of facts, data, and statistical analysis, and
diligent attention to managing, improving, and reinventing business processes (Pande, P., et. al. 2000)
4.1 THE DMAIC SIX SIGMA METHODOLOGY
The Six Sigma is not merely a quality improvement strategy in theory, as it features a well defined
methodical approach of application in DMAIC and DMADV which can be used to improve the quality of
production. At the core of DMAIC, the framework is a formalized improvement strategy with the following five
facets i.e. define, measure, analyze, improve and control (DMAIC). The methodology is acknowledged with
different facets (Fig. 1) which is portrayed in I, II, III, IV and V and accomplished for this case.
I. Define Phase
Development of a Project Charter
The define facet of Six Sigma adjudicates the objectives and the goal of the project. This phase also
pile up evidences on processes and particularize the yield to internal and end customers.
Opportunity statement
Reduction in PPM Level at final assembly line which will reduce in rework, field failure, increase the
productivity and thus improve customer satisfaction.
As a result of high PPM Level, customer satisfaction is low.
Goal Statement
Reductions in internal PPM from 18909 PPM to 2500 PPM for Lighting stalk assembly.
Critical to Quality
Table 1 shows the constituent within a process that has a vital ascendancy on the process quality and
customary the quality of a crucial process, or need more attention in Six Sigma project.
Table 1 Critical to Quality
SIPOC Diagram
Table 2 threads the transfiguration operation of inputs from suppliers to output for customers. It
focuses on the stage-wise apprehension of the process and their allegory to each other.
Table 2 SIPOC Diagram
Supplier Input Process Output Customer
Component
stores
Lighting stalk
assembly
Combination
Switch assembly
Assembled
Switch
Inspection and
External Customer M1
Wiper stalk assembly
Central housing assembly
The SIPOC is generated for each subassembly and then input indicators for each process is noted as in Table 3
(Complete list of input indicators is to be listed as in Table 3)
PPM
level
PPM level less
than 2500
(For total
defects )
1. No noise / Low noise level from steering wheel
2. Wiper system should function whenever
operates the Combi switch.
3. Combi- switch side indicator function
should not fail.
4. Horn should function whenever SW
operates.
1. Noise from steering wheel while turning of vehicle.
2. Wiper is not working in flick
wiper mode.
3. Side indicator not working.
4. Horn is not blowing
CTQ Critical to Customer
Requirement
Key Customer Issue
Requirement Voice of the Customer
Requirement

Six Sigma practice for process improvement – A case study of medium scale auto ancillary unit
www.iosrjournals.org 29 | Page
Table 4 lists out most basic steps of process where the major steps on the top of board in order that they
occur in process. Under each major step, there is need of listing the different sub-steps that make up the element
of the process.
Table 4 Process mapping through Top-Down Charting
Process Manufacturing Of Combination Switch
Sub
processes
Lighting stalk
assembly
Wiper stalk
assembly
Central housing
assembly
Mounting of
subassembly
Activities
LCS base soldering
and visual
inspection
Wiper base
soldering and
visual inspection
Assembly of
Central housing,
Horn pin, Spring
and Retainer plate
Mounting of
lighting stalk
sub assembly,
wiper stalk
subassembly, central housing
assembly Screwing of lever,
Spacer, and LCS
fret base
Wiper assembly
riveting and visual
inspection
Screwing
CPC assembly Riveting of 6
contact pins
Assembly of clamp
plate, Nut, Spring
CPC assembly with
lever
Riveting of contact
blade, contact pins
wash feed link and
link blade
Mounting of striker
bush with
application of
grease
Screwing of cap
assembly with CPC
assembly
Visual inspection Date Stamping
Table 5 Process Indicators for Lighting Stalk
Head Off /Blink Printing Defective
Park / Head Circuit Interchanged Right engagement return
LCS Snap Defective Right lane change off
D.I. Snap Left lane change off
Head OFF Rivet bend
Flash Operation Noisy (H/D) Check date stamping.
L- Side Indicator OFF
II. Measure Phase
This phase forms the measurement systems for the inputs and outputs of the selected project with major
focus on lighting stalk assembly. It also ensure that way of aggregating data as well accumulated data is right
data from right place. If data accruement manner is wrong then it will provide inaccurate inferences in the phases underneath. Therefore, achieving success in the measure phase is vital. For SS project, an operational

Six Sigma practice for process improvement – A case study of medium scale auto ancillary unit
www.iosrjournals.org 30 | Page
definition focuses on meticulous definition of a measure while collecting every type of data and is well-defined.
The data accumulation will be senseless if the definition has not been delimitated in time. So, operational
definitions should be eventuated and verified before the data picking up commences. Then data collection for complete 30 days of production processes was measured as per operational
definition for each defect from process indicators for each sub-assembly was analyzed but this paper specifically
focuses on SS employment on lighting stalk assembly. The PPM level of each sub assemblies is shown below:
Figure 2 First level Pareto showing PPM level for each subassembly
0%
10%
20%
30%
40%
50%
60%
70%
80%
90%
100%
0
1000
2000
3000
4000
5000
6000
7000
Count
c
Defects
PPM
Figure 3 Second level Pareto for Lighting stalk assembly
Measuring Process Indicators:
It is necessary to find which inputs affect outputs (CTQ‟s) most. The following observation shows the
measurement of data with regards to lighting stalk assembly.
Table 6 Notations for Process indicator
Process Indicators Notation Measurement
Parking OFF/ Blink y1 Ref. Figure 4
Printing Defective y2 Ref. Figure 5
LCS Snap defective y3 Ref. Figure 6
D.I. Snap y4 Ref. Figure 7
Head Off/ Blink y5 Ref. Figure 8
Right Lane change Off y6 Ref. Figure 9

Six Sigma practice for process improvement – A case study of medium scale auto ancillary unit
www.iosrjournals.org 31 | Page
.
Figure 4 Measurement of Parking Off/ Blink defectives (y1)
Figure 5 Measurement of printing defectives (y2)
Figure 6 Measurement of LCS Snap defectives (y3)
Figure 7 Measurement of DI Snap defectives (y4)

Six Sigma practice for process improvement – A case study of medium scale auto ancillary unit
www.iosrjournals.org 32 | Page
Figure 8 Measurement of Head Off/ Blink defectives (y5)
Figure 9 Measurement of right lane change off effectives (y6)
Preliminary Failure Mode & Effect Analysis (FMEA) is also employed in this measure phase which
supports to establish the identity and accomplish apparent predicament in order to curtail defects and redeem
costs as soon as possible.
Outcome from Measure Phase:
Benchmark period is assigned for PPM level of rejection at customer end and internal assembly. In
project scope start should be from receipt of raw material / component from own organisation. Internal failure
cost should co-relate with the 2500 PPM target. In SIPOC, the list of component Part No. should be given in a
part description. In process walk through should be in details like include the observation on housekeeping,
assembly layout, material flow, visual control and work instructions. Special process on the shop floor should be
identified separately. Additional Operating resources for data collection are required and will be provided.
III. Analyze Phase
Analyze phase appraises and bring down the variables using box plot, descriptive statistics analysis,
hypothesis testing and assesses the most critical measures for process improvement. So, the measurements piled
up from the measure phase are examined so that hypothesis about the root causes of variations in the
measurements can be generated and the hypothesis subsequently validated. It is at this stage that practical
dilemma are turned into statistical problems and analyzed as statistical problems. The relevant outputs and all
the potential inputs (x) that might impact each output are connected to each other. So, the vital inputs (x) are
appraised using graphical analysis as shown below:
Cause and Effect Diagram: In this project, especially a team brainstorming analysis tool is cause and effect diagram also called a
fishbone diagram because the diagram plots contributing factors along parallel diagonal lines which each join a
central horizontal time-line (like the back-bone) which culminates at one end with the main issue or question.

Six Sigma practice for process improvement – A case study of medium scale auto ancillary unit
www.iosrjournals.org 33 | Page
Table 7 Cause-Effect Matrix:
Cause-Effect Matrix Scale : 0=None 1=Low 3=Moderate 9=Strong
Out
put #2
Outp
ut #2
Output
#3
<<<<Output
Indicators
10 10 10 <<<<<<<<Import
ance (1-10 scale)
Input' <<Input/Process Indicators<< Correlation of Input to
Output
<<<<
Total<<<<<
Contact Pin Material specification 0 0 0 0
Hardness 3 0 0 30
Dimensions 1 0 0 10
Plating 0 0 0 0
Cover Lock dimensions 0 0 0 0
Flash 9 0 0 90
Pawl fitment dimensions 9 0 0 90
Profile 0 0 0 0
Pivoting Pin Diameter 0 0 0 0
Slot Dimensions for Action slide
movement
3 0 0 30
Base Hole Diameters for contact pin
assembly
3 0 0 30
Pivoting Hole Diameter 0 0 0 0
Slot Dimensions for contact slide 1 0 0 10
Flash 1 0 0 10
counter depth on hole 3 0 0 30
Slot width and slot for link blade 3 0 0 30
Lever Diameter of pivoting where the rotor fitment take place
1 0 0 10
Fork Hole diameter 0 0 0 0
Hole diameter for screwing 1 0 0 10
Flash 1 0 0 10
Printing quality 1 0 0 10
Material grade 0 0 0 0
LCS Base Flatness 9 0 0 90
Flash 9 0 0 90
Hole diameter for screw head 1 0 0 10
Stem height 1 0 0 10
counter depth on hole 3 0 0 30
Slot width and slot for link blade 3 0 0 30
Pawl Thickness 3 0 0 30
Flash 3 0 0 30
Total length 0 0 0 0
Peg Height 0 0 0 0
Action Slide Flash 3 0 0 30
Thickness 3 0 0 30
Length 0 0 0 0
Triangular Profile 0 0 0 0
Lighting
contact
Locking Height 9 0 0 90
Thickness 3 0 0 30
Burr 3 0 0 30
Locking dimple Position in center 1 0 0 10
Contact area flatness 1 0 0 10

Six Sigma practice for process improvement – A case study of medium scale auto ancillary unit
www.iosrjournals.org 34 | Page
Table 8 Notations for Potential Inputs
Potential input (x) Notation Measurement
Flashes on contact area of LCS fret base x1 Shown in Fig. 11
Locking ring excess tightening x2 Shown in Fig. 12
Contact plate width more x3 Shown in Fig. 13
Scratches on printed Symbol x4 Shown in Fig. 14
Lighting contact off center x5 Shown in Fig. 15
Uneven height of terminal x6 Shown in Fig. 16
Figure 11 Descriptive statistics of flashes on contact area of LCS fret base (x1)
Descriptive statistics Of Flashes on contact area of LCS Fret Base (x1)
PPM( Flashes On contact
area (x1)
Count 30
Mean 5243.3
Standard Deviation 3145.6
Range 15949
Minimum 1000
25th Percentile (Q1) 3333.3
50th Percentile (Median) 4766.7
75th Percentile (Q3) 6666.7
Maximum 16949
95.0% CI Mean 4068.735 to 6417.913
95.0% CI Sigma 2505.181 to 4228.687
Anderson-Darling
Normality Test
A-Squared = 1.204421; P-
value = 0.0032
Descriptive statistics for locking ring excess tightening (x2)
PPM Locking ring Excess
tightening
Count 30
Mean 2245.7
Standard Deviation 3577.0
Range 15000
Minimum 0
25th Percentile (Q1) 0
50th Percentile (Median) 0
75th Percentile (Q3) 3611.1
Maximum 15000
95.0% CI Mean 910.052 to 3581.415
95.0% CI Sigma 2848.763 to 4808.644
Anderson-Darling Normality Test
A-Squared =
3.495375; P-value = 0.0000

Six Sigma practice for process improvement – A case study of medium scale auto ancillary unit
www.iosrjournals.org 35 | Page
Figure 12 Descriptive statistics of locking ring excess tightening (x2)
Figure 13 Descriptive statistics for contact plate width more (x3)
Figure 14 Descriptive statistics for scratches on printed Symbol (x4)
Descriptive Statistics For Contact Plate Width More (x3)
PPM Contact Plate width More
Count 30
Mean 722.21
Standard Deviation 1245.9
Range 4615.4
Minimum 0
25th Percentile (Q1) 0
50th Percentile (Median) 0
75th Percentile (Q3) 1570.5
Maximum 4615.4
95.0% CI Mean 257.0003 to 1187.426
95.0% CI Sigma 992.2131 to 1674.832
Anderson-Darling
Normality Test
A-Squared = 4.838974; P-value =
0.0000
Descriptive Statistics For scratches on Printed Symbol (x4)
PPM scratches on Printed Symbol (x4)
Count 30
Mean 4728.0
Standard Deviation 2211.0
Range 7043.0
Minimum 1290.3
25th Percentile (Q1) 2767.9 50th Percentile (Median) 5000
75th Percentile (Q3) 6666.7
Maximum 8333.3
95.0% CI Mean 3902.461 to 5553.635
95.0% CI Sigma 1760.825 to 2972.231 Anderson-Darling
Normality Test
A-Squared = 0.823384; P-value =
0.0295
Six Sigma practice for process improvement – A case study of medium scale auto ancillary unit
www.iosrjournals.org 36 | Page
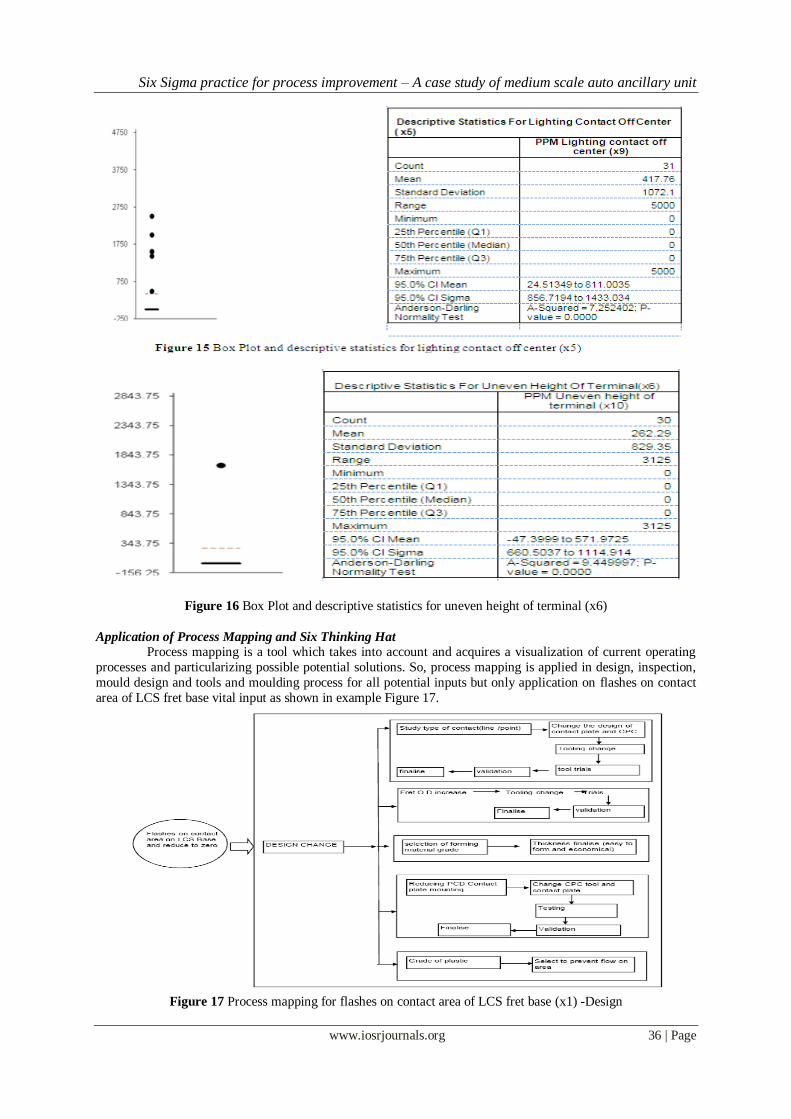
Figure 16 Box Plot and descriptive statistics for uneven height of terminal (x6)
Application of Process Mapping and Six Thinking Hat
Process mapping is a tool which takes into account and acquires a visualization of current operating
processes and particularizing possible potential solutions. So, process mapping is applied in design, inspection,
mould design and tools and moulding process for all potential inputs but only application on flashes on contact
area of LCS fret base vital input as shown in example Figure 17.
Figure 17 Process mapping for flashes on contact area of LCS fret base (x1) -Design

Six Sigma practice for process improvement – A case study of medium scale auto ancillary unit
www.iosrjournals.org 37 | Page
Six Thinking Hats' is practical approach which is used to look at determinations from a number of
crucial viewpoints. Many successful managerial contemplates from a very rational, positive prospect. Here, 'Six
Thinking Hats' technique is applied in design, inspection, mould design and tools as well as moulding process on flashes on contact area of LCS fret base (x1) defective and shown in Table 9 to solve it using this approach.
Accordingly it is employed to all critical inputs x2, x3, x4 etc. to find necessary solutions and shown in Table
10, 11, 12.
Table 9 Six Thinking Hat on Flashes on contact area of LCS fret base (x1) -Design
Green
1)Reducing PCD of contact plate mounting
Black
1)There is possibility of no contact due to contact comes on screw cut
out area.
Yellow
1) Sheet thickness change from 0.8 to 0.6 mm
2) Study of line / point contact on
LCS fret
2) Point contact to be studied form
durability point of view and that
can lead to more problem
2) Mating parts contact plate
thickness reduces to 1.5 mm to
1.2mm thus making the contact
area free from flash area.
3) Sheet thickness change from
0.8 to 0.6 mm
3)Validation for current carrying
capacity after thickness change.
4) Alternate material for contact
fret
4) Feasibility and cost to be studied.
5)Fret Outer dia. Increased in
turn lever I D and O D increased
(Not practical)
5) Fret O D Increase might create
problem in mating parts. Major tool
changes and validation , Customer
approval required. Not economical.
6) Mating parts contact plate
thickness reduces to 1.5 mm to
1.2mm thus making the contact
area free from flash area.
White
1) Flashes on area where fret
flatness not ok (Fret bending
area.
Blue
1)Don‟t mix up the other X's
Red
1) More black points, all lenthy
solutions, old design so
complicated that any design change
is causing many changes and hence
not feasible.
2) Daily 20 % rejection at
molding assembly.
2) Don‟t discuss within yourself,
Discuss within team.
3) Four numbers daily at final
functional (assembly)
3) New idea of thickness reduction
from 1.5 to 1.2 (contact plate ) to be
added in solution mapping
Table 10 Six Thinking Hat on flashes on contact area of LCS fret base (x1)-Inspection
Green Black Yellow
1) One inspection gauge to be
made and provide at moulding
operation.
1) Validation of the gauge for one
day production.
1) Gauge for inspection at molding
operation.
2) Cycle time of inspection should
be less Feasibility of checking by operation immediately after molding.
White Blue Red
1) Ok and not ok components
cannot be fully identified.
Visual Inspection is subjective.
1) After inspection also defective
being going in assembly line.

Six Sigma practice for process improvement – A case study of medium scale auto ancillary unit
www.iosrjournals.org 38 | Page
Table 11 Six Thinking Hat on flashes on contact area of LCS fret base (x1)-Mould design & Tools
Green Black Yellow
1) Press Tool design change
from hexagonal to circular
1) Feasibility of moulding to be
checked.
1) Press Tool design change from
hexagonal to circular
2) Review of mould design
considering the feasibility and
introducing 0.3 mm step in
mould.
2) Consequent changes in mould
design.
2) Review of mould design
considering the feasibility.
White Blue Red
1) Contact area is circular but
fret is hexagonal by design.(
Difference in x & y is 0.7 mm)
Table 12 Flashes on contact area of LCS fret base (x1)-Moulding process
Green Black Yellow
1) Review of Process
Parameters and start the set up
approval
1) Review of Process Parameters
and start the set up approval
2) Setting instructions to be
prepared
2) Setting instructions to be
prepared
White Blue Red
1) Flashes / Plastic material flown on contact plate area.
Today practically not possible
to define the area, hence the
problem is there.
1) Not to be considered design related issue. You have to think on
moulding process.
1) No defination of flashes. That's why rejection material goes to
assembly.
2) 100% Component is having
the plastic material in contact
area.
The following Table 13 shows validation of root causes and necessary actions need to undertake in Improve
phase.

Six Sigma practice for process improvement – A case study of medium scale auto ancillary unit
www.iosrjournals.org 39 | Page
IV. Improve Phase
The Improve phases focus on amplifying hypothesis to take away principle causes of variation,
examination and standardizing those solutions. As we know, which are critical inputs and affect the outputs
then, there is need to run trials to find and confirm the changes in old processes or procedure of these vital
inputs and start implementing new processes according to Defects per Millions Opportunities (DPMO) to be
reduce which can be called as Design of Experiments (DOE). DOE can be employed as a tool to pin point the
influencing factors (x‟s) which affects on process outputs (y‟s) and could effectively troubleshoot problem.
Figure 18 Scratches on printed symbol is corrected by monitoring of baking time and curing time and
temperature.

Six Sigma practice for process improvement – A case study of medium scale auto ancillary unit
www.iosrjournals.org 40 | Page
Figure 19 Printing Symbol Mismatch is corrected by fixture for printing changed from wooden material to
aluminum material
After applying solutions in Improve phase, the following results are obtained for y1, y2, y3, y4 etc. defectives
which are shown in following figures.
Figure 23 Pareto for parking off (y1) defectives
Figure 24 Pareto for LCS Snap Defective (y2) defectives

Six Sigma practice for process improvement – A case study of medium scale auto ancillary unit
www.iosrjournals.org 41 | Page
Figure 25 Pareto for D. I. Snap Defective (y3)
Figure 26 Pareto for printing defective (y4)
Figure 27 Results obtained after effective implementation for Lighting Stalk Assembly
V. Control Phase
Once defects have been curtailed then it is necessary to assure that how this improvement is sustained.
So, at the end project, the control phase is applied to acclimate gauge measures to asseverate functioning and to correct problems as demanded. This also comprehends to affirm process long-term capability and execute
process control exercising control charts to monitor the processes that create the product. The Table 15 shows
the sustenance plan implemented after accomplishment of this project.

Six Sigma practice for process improvement – A case study of medium scale auto ancillary unit
www.iosrjournals.org 42 | Page
V. CONCLUSION This Six Sigma quality management practice exhibits to improve stratum as well elevate internal and
external customers‟ atonement; redesign manufacturing processes in perspective of curtailing or eliminating
defects; creating culture of perpetual improvement, but it needs right focus and commitments. To initiate Six
Sigma specifically in SMEs, the top management should locate enthusiastic personnel‟s as team members from
their enterprises and get trained at least on Green Belt through external agencies or customer organisation if they
acute to support. Then enterprises can think to apply „Internal Training Methodology‟ (ITM) for education and training on SS for hierarchical downlink through these trained personnel, since SMEs can‟t be ready to invest in
heavy consultancy cost for massive training. After accomplishing one project, enterprise can deploy new
projects for different CTQs‟, render savings, then upgrade staff for higher belt levels and then elevate speed of
implementation. The Six Sigma results can be further improved by employing advanced tools viz. Design of
Experiment (DOE) as well software tool viz. Minitab.
ACKNOWLEDGEMENT We will quote special thanks to Dr. R. S Dalu, Head (Mechanical Engg.), Government College of
Engineering, Amravati, Mr. Praful Kalankar, Sr. Manager (Manufacturing & Quality) and Hon. Management of the enterprise for permission to perform this case study as well for their valuable guidance and cooperation at
the time of project implementation.
References [1] (2008), “Defining the Role of the Government in the Transnationalisation Efforts of the Indian SMEs in the Auto Components
Sector”, Department of Scientific and Industrial Research (DSIR), Ministry of Science and Technology, New Delhi, Published by:
IDC (India) Limited CYBER HOUSE, B-35, Sector 32-Institutional,Gurgaon Last Visited 15 March 2011,
www.dsir.gov.in/reports/ittp_sme/AutoCompReport.pdf
[2] (2006), “A report by KPMG for IBEF, Auto Components”, Indian Brand Equity Foundation,
http://www.ibef.org/industry/autocomponents.aspx, retrieved on June 2010
[3] Bell, R. (2011), “A Comparison of Four Quality Improvement Approaches”, Article Directory, http://articleco.com/2011/03/21/a-
comparison-of-four-quality-improvement-approaches/ retrieved on Jan 2012
[4] Pfeifer, T., Reissiger, W. and Canales, C. (2004), “Integrating Six Sigma with quality management systems”, The TQM Magazine,
Vol. 16, No. 4, pp 241 – 249.
[5] Does, R., Heuvel, E., Mast, J. and Bisgard, S. (2002), “Comparing non-manufacturing with traditional applications of Six Sigma”,
Quality Engineering, Vol. 15, No. 1, pp. 177 – 182.
[6] Berghe W. (1997), “Application of ISO 9000 standards to education and training”, Interpretation and Guidelines in a European
Perspective”, Published by: CEDEFOP European centre for Development of Vocational Training, First Edition, ISBN 92-827
www.oitcinterfor.org/public/english/region/ampro/cinterfor/temas/calidad/doc/iso.pdf
[7] Patel, D. (2004), “Initiation and implementation of Six Sigma in a small organization”, Wichita State University, Department of
Industrial and Manufacturing Engineering.
[8] Gnibus, R. and Krull, R. (2003), “Small Companies See the Money”, Quality, Vol. 42, No. 8. pp. 48
[9] Pandey, A. (2007), “Strategically focused training in Six Sigma way: a case study”, Journal of Europeans Industrial Training, Vol.
31, No. 2, pp. 145-162
[10] Breyfogle III, F.W., Cupello, J.M. and Meadows, B. (2001), “Managing Six Sigma”, John Wiley and Sons, New York
[11] Thomas, A., Barton, R. and Chuke-Okafor, C. (2009), “Applying Lean Six Sigma in a Small Engineering Company – A Model for
Change”, Journal of Manufacturing Technology Management, Vol. 20, No. 1, pp. 113-129
[12] Gordon, T. (1995), “The underlying fallacies of lean and mean, The Ironbridge group, USA”, BPICS Control, August, pp. 4-11
[13] Gnibus, R. and Krull, R. (2003), “Small Companies See the Money”, Quality, Vol. 42, No. 8. pp. 48
[14] Desai, D.A. (2008), “Improving productivity and profitability through Six Sigma: experience of a small-scale jobbing industry”,
International Journal of Productivity and Quality Management, Vol. 3, No.3, pp. 290 – 310.
[15] Desai, D. A. (2006), “Improving customer delivery commitments the Six Sigma way: case study of an Indian small scale industry”,
International Journal of Six Sigma and Competitive Advantage, Vol. 2, No. 1, 23–47.
[16] Kumi, S. and Morrow, J. (2006), “Improving self service the Six Sigma way”, Newcastle University Library Program: Electronic
Library and Information Systems, Vol. 40, No. 2, pp.123–136.
[17] Pande, P., Neuman, R., and Cavanagg, R. (2000), “The Six Sigma way: how GE, Motorola, and other top companies are honing
their performance”¸ Publisher: McGraw-Hill; 1 edition (April 27, 2000), New York., Hardcover: 448 pages; ISBN: 0071358064