Embed Size (px)
Citation preview

Site Suitability Analysis of Water Harvesting Structures Using Remote Sensing and GIS – A Case Study of Pisangan Watershed, Ajmer District, Rajasthan
Harish Chand Prasad, Parul Bhalla and Sarvesh Palria
Dept. of Remote Sensing and Geo-informatics
MDS University, Ajmer - 305009
KEYWORDS:
Water Harvesting Structures, Analytic hierarchy process model, Spatial Analyst Tool, Multi Criteria Analysis, Runoff Depth
ABSTRACT:
Rajasthan is a region with very limited water resources. Water is the most crucial for maintaining an environment and ecosystem
conducive to sustaining all forms of life. The principle of watershed management is the proper management of all the precipitation
by the way of collection, storage and efficient utilization of runoff water and to recharge the ground water. The present study aim‟s
to identify suitable zones for water harvesting structures in Pisangan watershed of Ajmer district, Rajasthan by using Geographic
Information System (GIS) and Multi Criteria Evaluation (MSE). Multi criteria evaluation is carried out in Geographic Information
system to help the decision makers in determining suitable zones for water harvesting structures based on the physical characteristics
of the watershed. Different layers which were taken into account for multi criteria evaluation are; Soil texture, slope, rainfall data
(2000-2012), land use/cover, geomorphology, lithology, lineaments, drainage network. The soil conservation service model was
used to estimate the runoff depth of the study area Analytical Hierarchy Processes (AHP) is used to find suitable water harvesting
structures on the basis of rainfall. Produced suitability map will help in the selection of harvesting structures such as percolation
tanks, storage tank, check dams and stop dams.
Introduction
The groundwater table in most parts of Rajasthan is steadily
going down due to over-exploitation and inadequate natural
recharge, resulting from frequent drought conditions in a
region where the erratic annual rainfall is below 50-60 cm in
most parts.
Water plays a vital role not only in fulfilling basic human
need for life and health but in socio-economic development
also. As the primary source of water is rainfall, so it
becomes necessary for us to harvest it effectively we can
maximize the storage and minimize the wastage of rain
water.
In order to address the problem of the imbalance between
abstraction and resources, it is necessary to augment the
groundwater potential by artificial recharge of the depleted
aquifers in a scientific and well-studied manner.
Generally, groundwater recharge requires applying water in
surface and near-surface spreading basins, pits and trenches,
using the unsaturated porous and permeable zones and the
fracture planes to transport and store water. The
hydrogeology of the unsaturated zones, particularly the
vertical hydraulic conductivity of the land-cover materials,
including the soils and the sub-soil sediments, frequency of
fractures and fault zones, lineaments etc., play a critical role
in transporting and storing the recharged water (Flint, 2002).
Therefore, the study and evaluation of this zone and its
geologic, tectonic, geomorphologic and land-cover attributes
is important and necessary for selecting areas or sites for
groundwater recharge.
Rain Water Harvesting and Conservation, is the activity of
direct collection of rain water collected can be stored for
direct use or can be re-charged into the Ground Water.
“Identification of suitable sites for water harvesting
structures needs a large volume of multidisplinary data from
various source for which the applications of modern remote
sensing and geographic information system techniques have
gained much attention in recent years”. (Ramaswamy &
anbazhagan 1997).
“Each watershed has various physiographic characteristics
of the study area such as geomorphology, geology,
structures, landuse/landcover, soil & drainage pattern
integrated with the help of Remote sensing and GIS
techniques. SCS-CN technique was used to generate rainfall
runoff model, the developed rainfall-runoff model is used to
understand the watershed and its runoff flow characteristics.
The rainfall runoff result of the trend line shows that there
where the Runoff potential is high or low. On the basis of
interpretation Water harvesting sites are suggested”
(Porchelvan et al., 2009).
Aggarwal et al., (2008) “study deals with the potential sites
for construction of rain water harvesting structures in the
Bakhar watershed of Mirzapur district, UP. It has been
identified by using remote sensing and GIS technology.
Various thematic maps such as land cover/ land use,
geomorphology and lineaments etc. these layers along with
geology and drainage were integrated using GIS techniques
to derive suitable ware harvesting structures each theme was
The International Archives of the Photogrammetry, Remote Sensing and Spatial Information Sciences, Volume XL-8, 2014ISPRS Technical Commission VIII Symposium, 09 – 12 December 2014, Hyderabad, India
This contribution has been peer-reviewed. doi:10.5194/isprsarchives-XL-8-1471-2014
1471

assigned a weightage depending upon an the ground water
recharge”.
Pisangan watershed is the part of Ajmer district out of 8
blocks. Pisangan Watershed Covering Geographical area of
1201 Sq km including major town and city. According to
CGWB report (2008), the net annual ground water
availability was 54.2009 mcm but the demand of annual for
all users are 96.6411 mcm and demand is increasing day by
day due to increasing population and tourists those who
came from outside that why the watershed falls in the
category of Over-Exploited Ajmer city falls in Pisangan
Block with total population of 7, 98,454, Nasirabad with
population of 50,804 and Peesangan town with population of
15,741 are major populated areas falls in the watershed area.
Most of the water supply to the area is being supplied from
Bisalpur dam. Annual rainfall of the district is 447.2 mm
Almost 95% of the total annual rainfall is received during the
southwest monsoon, Drought analysis based on agriculture
criteria indicates that the district is prone to mild and normal
type of droughts. Serve and very serve type of drought
happen very rare and occurred three times during 1987, 2002
and 2009.There is no important river in the district Khari,
Dai, Sarsuti or Saraswati, Sagarmati rivers are ephemeral &
flow only in response to precipitation. The Ana Sagar &
Puskhar are two natural lakes near the Ajmer City.
According to CGWB Report Ajmer, area around Ajmer,
Nasirabad and Peesagan exhibit steep depletion of water
level. At the annual rate of 2.74 m/yr. Mostly Rivers Dai,
Swarswati and Sagarmati mainly response to the
Precipitation, According to CGWB Pisangan Block belongs
to over-exploitation category. Availability of water in near
future is going to become a matter of grave concern as the
population is increasing at a constant growth rate.
Using GIS and AHP, the present study endeavours to locate
the site for water harvesting structures in Pisangan
Watershed. The people practicing the unplanned manner to
store the water this study also provides the Suggested sites
for water structures in planned manner for the conservation
and better utilization of water.
Materials and Method To meet the objectives for the study
area, data from the both primary and secondary sources have
been used. They include the following:
i. Landsat 8 images, band 3, 4, 5; Resolution - 30
meter
a. Kharif – 18 October 2013
b. Rabi – 06 January 2014.
ii. ASTER DEM, Resolution – 30 meter.
iii. Rainfall data of 12 years (2000-2012).
iv. Primary data has land cover/ land use, drainage,
and slope.
v. Secondary data, which are lineaments,
Geomorphology, Lithology and Soil.
The data so obtained were digitized and
converted into digital format in ArcGIS 9.3 for the spatial
analysis. AHP Model was applied on the selected criteria
and suitable weightages were allocated. All the layers were
then converted into raster format and spatial analyst tool
was applied for finding out the suitable location for the
Water Harvesting Structures.
Description of the Study Area
The Watershed area of Pisangan Watershed is 1201.61 sq
kms and located between 23044’45” N to 23058’30’’ N
latitude and 78035’45’’ E to 78046’15’’ E longitudes. The
climate of the study area is semi-arid and very hot in summer
and extremely cold in winter. The monsoon is of very short
duration. The Aravali mountain range (one of the oldest in
the world) in western India runs approximately 482 km from
northeast to southwest across the State of Rajasthan. The
study area has an average elevation of 312 m Pisangan
Watershed is the part of Ajmer District and covers Ajmer
City.
Ajmer district is spread over an area of 8,481 sq. kms and is
bounded by Nagaur district to the north, Jaipur and Tonk to
the east and Bhilwara district to the south and Pali district to
the east. The Population of Ajmer District 2011 census is
approximately 2, 58,491.The watershed is well connected by
National Highway No-8 and State highways making all the
important places of the district easily accessible.
Figure 1 Study Area Location
The International Archives of the Photogrammetry, Remote Sensing and Spatial Information Sciences, Volume XL-8, 2014ISPRS Technical Commission VIII Symposium, 09 – 12 December 2014, Hyderabad, India
This contribution has been peer-reviewed. doi:10.5194/isprsarchives-XL-8-1471-2014
1472

Figure 2 Conceptual Methodology
Preparation of thematic maps was a necessity for the study
region, where digitization was used with the help of
“ArcGIS” software and ERDAS is used for image
processing, ERDAS model maker help for the runoff depth
estimation where mathematical algorithms are applied and
interpolation of rainfall is done using ArcGIS spatial analyst
tool. Referring to previous studies, different criteria were
chosen for determination of suitable area for water
harvesting.
Drainage
Drainage network helps in delineation of watersheds and for
suggesting various water harvesting structures and soil
conservation measures. Drainage pattern is defined as the
plan, which the individual stream courses collectively form.
It refers to both spatial relations of individual streams and
the overall pattern made by the individual drainage lines.
The drainage pattern of Pisangan Watershed is formed by
various tributaries and sub-tributaries of Swarswati River.
The Dendritic drainage pattern of Pisangan Watershed can
be observed due many contributing streams. They develop
where the channel follows the slope of the terrain. After
drainage identification, orders are assigned to each
tributaries and sub-tributaries respectively.
Drainage ordering represent the number of streams presents
in each order defined i.e. 1, 2,3,4,5 and 6 stream orders. 2nd,
3rd or 4th order streams are suitable for Storage Tank and
Percolation Tank. 4th, 5th or 6th order streams are suitable for
Check Dams. 3rd or 4th order streams are suitable for Stop
Dams. Stream length of each is taken out and analyzed.
Lithology
Lithology involves the study of landforms, structures, and
the subsurface to understand the physical processes creating
and modifying the earth‟s crust. Remote sensing is used as a
tool to extract information about the land surface structure,
composition, or subsurface, but is often combined with other
data sources providing complementary measurements. In
order to understand the Lithology of the study area, a general
lithological map has been used mapped by RRSC, Jodhpur.
Phylite, schist, slate, granite and gneissic are some of the
Lithological units found in the study area. Gneiss are hard
type material and Phyllite is type of metamorphic rock
created from slate, It is primarily composed of quartz,
sericitemica and chlorite. The schist is medium grade
metamorphic rock, formed by mudstone/shale. Limestone is
deeply absorbent because of its soft texture but the water
dissolves the stone overtime runoff is moderate. Sandstone
absorbs water because it is porous. This means that it has
holes in.
The lithology units present in watershed having moderate to
high rain runoff potential which are being used to conserve
water by making scientific water harvesting structures with
proper management. Lithology plays important role to
recharge the ground water level. The total Lithological unit
area is 1425.77 sq km.
Geomorphology
The Geomorphological units available in the study area of
Pisangan Watershed. Denudation hills, Structural hills,
Pediments and Pediplains are some of the Geomorphological
units found in the study area. The total area covered by the
different landforms is 1438.03 Sq km. In Ajmer district land
forms have been classified on the basis of genetic factor and
the geomorphic processes involved.
DEM and Slope
Digital Elevation Model is derived from ASTER Data. The
Digital Elevation Model of Pisangan Watershed shows the
areas elevation (height) at a class of 352-428 m, 428-475 m,
475-545m, 545-657m and 657-888 respectively.
Watershed average slope offers information about the
watershed topography. It is considered an independent
variable. The average slope of a watershed influences
radically the value of the time of concentration and, directly,
the runoff generated by a rainfall.
Slope Map, is created with the help of Digital Elevation
Model using ArcGIS-9.3 software. DEM is the basic input
for generation of Slope map.
Soil
One of the most important features of soil, from the
standpoint of its water holding capacity is variation in
porosity with depth. Porosity is a measure of the open space
The International Archives of the Photogrammetry, Remote Sensing and Spatial Information Sciences, Volume XL-8, 2014ISPRS Technical Commission VIII Symposium, 09 – 12 December 2014, Hyderabad, India
This contribution has been peer-reviewed. doi:10.5194/isprsarchives-XL-8-1471-2014
1473

within some soil or rock and it is function of the sizes of
particles and the way they are arranged .Texture indicates the
relative content of particles of various sizes, such as sand,
silt and clay in the soil. Soil texture is an important soil
characteristic that will be taking into consideration of
suggesting water harvesting structures .The study area has
been having different types of soil texture as fine loamy,
coarse loamy, loamy skeletal, clay loam, and sandy loamy
and rock outcrops.
Lineaments
Lineament in this study is defined as a map able, linear
feature of a surface, whose parts are aligned in a rectilinear
or slightly curvilinear relationship and which differ from the
pattern of adjacent features and presumably reflect some
subsurface phenomenon. The definition is chosen because it
is the most practical definition in the context of remote
sensing image interpretation. (Gupta, 1991).The buffer map
is generated for lineament because it is the best geological
unit which helps to collect the water and where the water is
store at High capacity.
Figure 3 Drainage and Water body Map
RUNOFF DEPTH ALGORITHMS
Rainfall Data Interpolation
Study area has only 7 rainfall gauging stations. A dense
network is required to estimate accurately spatial distribution
of a given area. Therefore 19 stations in Ajmer district are
used for interpolation on the entire district and then
interpolated rainfall map of the study area was clipped.
Figure shows the location and distribution of the rain gauge
stations of the study area.
Interpolation was used to estimate rainfall for the areas not
having rainfall point measurements. The interpolation has
been done in ArcGIS 9.3 using Inverse Distance Weight
(IDW). Inverse distance weighted (IDW) interpolation
determines, cell values using a linearly weighted
combination of a set of sample points. The weight is a
function of inverse distance (ArcGIS 9.3). The interpolated
raster map shows variation in average annual rainfall. In the
north and south eastern part of the study area having high
rainfall.
Rainfall Runoff Modelling
Rain water harvesting is a hydrological intervention which
can best be depicted through hydrological models that are
able to show directions of flow, runoff and run on area and
identify locations for impounding structures.
Runoff modeling is relationships for the basin are considered
using the SCS curve number method. In undertaking
hydrological modeling using remote sensing data in GIS
environment the SCS curve runoff model is largely suitable
due to its reliance on land cover parameters which can be
extracted from remote sensing (Senay et al., 2004).
Runoff curve number equation estimates total runoff from
total rainfall and this relationship excludes time as a variable
and rainfall intensity. Its stability is ensured by the fact that
runoff depth (Q) is bounded between the maximum rainfall
depth (P). This implies that as rainfall amount increase the
actual retention (P-Q), approaches a constant value; the
maximum potential retention (USDA, 2004)
The runoff estimation related runoff (Q) to precipitation (P)
and the curve number (CN) which is in turn related to
storage (S). CN is based on the following parameters;
hydrologic soil group, land use and treatment classes,
hydrologic surface conditions.
Equation 1 known as the runoff curve number gives the
relationship between the parameters described below.
𝑸 = 𝑷−𝑰𝒂 𝟐
𝑷−𝑰𝒂 + 𝑺 (1)
Where;
Q = runoff depth (mm)
P = rainfall (mm)
S = potential maximum retention after runoff starts (mm)
Ia = initial abstraction (mm)
Initial abstraction consists mainly of interception, infiltration
during early parts of the storm, and surface depression
storage. Its determination is not easy due to the variability of
infiltration during the early part of the storm since it depends
on conditions of the watershed at the start of a storm such as
the land cover, surface conditions and rainfall intensity; thus
it is assumed to be a function of the maximum potential
retention. (USDA, 2004)
Ia = 0.2S
Potential maximum retention (S) can be calculated by the
Curve Number as below
The International Archives of the Photogrammetry, Remote Sensing and Spatial Information Sciences, Volume XL-8, 2014ISPRS Technical Commission VIII Symposium, 09 – 12 December 2014, Hyderabad, India
This contribution has been peer-reviewed. doi:10.5194/isprsarchives-XL-8-1471-2014
1474

𝑺 =𝟐𝟓𝟒𝟎𝟎
𝑪𝑵− 𝟐𝟓𝟒
The soil conservation service (SCS) model depends on the
runoff Curve Number (CN). Curved Number is estimated via
the effect of soil and land cover on the rainfall runoff
processes. The range of the Curve Number (CN) is between
1 (100 % rainfall infiltration) and 100, lower values of the
Curve Number indicate lower runoff, while higher values of
Curve Number refer to higher values of runoff.
Evaluating Curve Number
Curve number is used to characterize the runoff properties
for a certain soil and land cover/ land use. The soil
conservation service runoff equation uses the curve number
value as input parameter. Curve Number is evaluating for the
study area on pixel basis using the land cover/land use and
soil map that are reclassified to hydrologic conditions and
hydrologic soil group (Table1 ).Infiltration depends on the
soil property which effects the relation between rainfall and
runoff. The soil conservation service model divides all soils
into four Hydrologic Soil groups according to the united
states geology survey (USGS) land use and land cover
classification system (A, B, C and D). The classification of
soil to hydrologic soil group depends on infiltration rates and
the soil texture composition. Table defines the Hydrologic
Soil Groups, based on the USGS classification system. Only
classed A, B and D were found in the study area.
Soil Group Runoff Description Soil Texture
A Low runoff potential because of high infiltration rates Sand, loamy sand and sandy loam
B Moderately infiltration rates leading to moderately runoff
potential
Silty loam and loam
C High/moderate runoff potential because of slow infiltration rates Sandy clay loam
D High runoff potential with very low infiltration rates Clay loam, silty clay loam, sandy
clay, silty clay and clay
Table 1 Soil group and corresponding soil texture
Table can be used to find the hydrologic soil groups of the
study area depending on the soil type.
The high runoff potential is present in the west of the study
area because this area is a mostly lies in wasteland and open
land. The soil texture is clay stone or silt clay to clay.
A moderate runoff potential occurs in the south eastern part
of the study area because the landforms in this region are
fluctuating between undulating and plain terrain the runoff
seem to high near the urban settlement.
Hydrologic condition refers to the effect of the land cover,
and represents the surface conditions in the basin in relation
to infiltration and runoff. The land cover that is present in
figure can be used together with a map of hydrologic soil
group in ERDAS model maker to match the hydrologic soil
group with the land cover. Table presents the values of curve
number based on the USGS classification system (A, B, C
and D).
Hydrologic Soil Group
Land cover/Land use A B C D
Built up 74 85 90 92
Cropland 72 81 88 91
Fallow land 77 86 91 94
Forest 43 65 76 82
Wasteland 77 86 91 94
Water body 98 98 98 98
Table 2 Runoff curve number for combinations of different
land cover and hydrological soil groups
Table 2 –The Curve numbers were thus generated using the
USGS land cover and Hydrologic soil group classification
system (Maidment 1993). The curve number value for each
hydrologic soil group and corresponding land cover class
presented in Table 2. A high value of the curve number (such
as 94) refers to an area that has a high runoff potential and
low infiltration. A low value to the curve number (such as
43) indicates an area that has a low runoff potential and high
infiltration.
The International Archives of the Photogrammetry, Remote Sensing and Spatial Information Sciences, Volume XL-8, 2014ISPRS Technical Commission VIII Symposium, 09 – 12 December 2014, Hyderabad, India
This contribution has been peer-reviewed. doi:10.5194/isprsarchives-XL-8-1471-2014
1475

Figure 4 Curve Number Map
Figure 5 Runoff Depth Potential Map
The International Archives of the Photogrammetry, Remote Sensing and Spatial Information Sciences, Volume XL-8, 2014ISPRS Technical Commission VIII Symposium, 09 – 12 December 2014, Hyderabad, India
This contribution has been peer-reviewed. doi:10.5194/isprsarchives-XL-8-1471-2014
1476

Analysis Through equal weightage
Equal Weightage Approach is assigned of relative
importance which is a simple map overlay method of GIS in
which all parameters are treated to be equal importance. In
this study, Equal weightage approach has been adopted.
Weighted Sum overlay analysis follows the same general
steps of the overlay analysis described above.
Using the Weighted Sum tool, complemented by other
Spatial Analyst tools, an additive overlay analysis can be
implemented. The values for the input layers need to be
reclassified prior to using the Weighted Sum tool. Unlike the
weights in the Weighted Overlay tool, the weights assigned
to the input rasters can be any value and do not need to add
to a specific sum. When adding the input rasters, the
Weighted Sum tool output values are a direct result of the
addition of the multiplication of each value by the weights.
Unlike Weighted Overlay, the values are not rescaled back to
a defined scale; therefore, it maintains the attribute resolution
of the values entered in the model. Weighted Sum assumes
that more favorable factors result in the higher values in the
final output raster, therefore identifying these locations as
being the best.Any class can also be assigned a restricted
value, which means that the corresponding area is
unacceptable or cannot be used. Restricted areas are
excluded from the analysis. In the land-use raster, for
example, unclassified area is restricted. These parameters are
overlaid on one another and the resultant integrated layer is
synthesized using defined criterion to derive the required
solution.
Raster Layer Influence (%)
(Theme weight)
Feature Classes
Or Buffer Distance
Feature Weight Class
Lineament Buffer 20 Lineament Buffer
100m 9
Geomorphology 15 Landforms
Alluvial Plain 9
Denudational Hill 3
Eolian Plain 9
Habitation Mask 1
Pediplain 7
Piedmont Zone 7
Structural Hills 5
Waterbody Mask 1
Lithology 15 Rock Type
Alluviam/Sandstone 9
Granite/ Gneissic 6
Habitation Mask 1
Phyllite 2
Quartize 4
Waterbody Mask 8
Soil 10 Soil Type
Loamy Sand 3
Fine Loamy 8
Coarse Loamy 5
Loamy Skeletal 6
The International Archives of the Photogrammetry, Remote Sensing and Spatial Information Sciences, Volume XL-8, 2014ISPRS Technical Commission VIII Symposium, 09 – 12 December 2014, Hyderabad, India
This contribution has been peer-reviewed. doi:10.5194/isprsarchives-XL-8-1471-2014
1477

Rock Outcrops 5
Sandy Loamy 3
Slope 25 Slope Structure
Gently Sloping 7
Level to Gently Sloping 9
Moderate Sloping 5
Others 3
LULC 15 Class
Agriculture 8
Built Up 1
Forest 4
Wasteland 5
Waterbody 9
Table 3 Weight Determination of Different layers
Weighted Index Model
Weighted Index Model, represent the weighting the multiple
parameters. In this study of Pisangan Watershed, equal
weightage concept is used for data integration in which all
parameters are treated to be equal importance. All thematic
layers prepared in the study of Pisangan Watershed are
classified, in reference to the site suitability of Water
Harvesting Structures. In this study, the most important
aspect is to assess the area of high potential zones of water,
through which the measures based upon the sustainable
development of different parameters of surface water
resources. All this is done by keeping in view that all the
parameters are dependent on each other as respect to the
study.
A Multi Criteria based analysis has been adopted for the
identification of such areas. All the layers generated in the
ArcGIS-9.2 software are in the vector format, for Weighted
Overlay Analysis the Rasterization of each physiographic
unit is performed by the conversion tools in the Arc Tool
Box Window. The first step of data conversion is
„Rasterization‟ for converting different lines and polygon
coverage into raster data format.
After this, Reclassification of all the raster files is processed
along with providing the scale value of each unit. All the
layers are given ranking based on their influence on the
study. A criterion is assigned, which shows the relationship
amongst the different parameters in the same units. Further,
in the Spatial Analyst Tool, Weighted Overlay Function has
been processed for identification of the suitable area.
Analytic Hierarchy Process (AHP)
In this study, pairwise comparison, known as the Analytic
Hierarchy Process (AHP), was used. This method was
developed by Saaty (1977). The pairwise comparison
method includes the comparison of each factor against
every other factors in pairs (Ronad 2006). The weights
of criteria in Saaty‟s technique are computed by
applying the main eigenvector of the square reciprocal
matrix of pairwise comparisons between the two factors
(Drobne et al 2009).
Consistency ratio (CR): 0.0152
Table 4: Different weight assign to Layers through AHP
Runoff
Depth
Slope Soil
texture
Drainage Land
use
Rainfall 1 2 3 4 5
Slope 1/2 1 2 3 4
Soil texture 1/3 1/2 1 2 3
Drainage 1/5 1/4 1/3 1 2
Land use 1/6 1/5 1/4 1/2 1
The International Archives of the Photogrammetry, Remote Sensing and Spatial Information Sciences, Volume XL-8, 2014ISPRS Technical Commission VIII Symposium, 09 – 12 December 2014, Hyderabad, India
This contribution has been peer-reviewed. doi:10.5194/isprsarchives-XL-8-1471-2014
1478
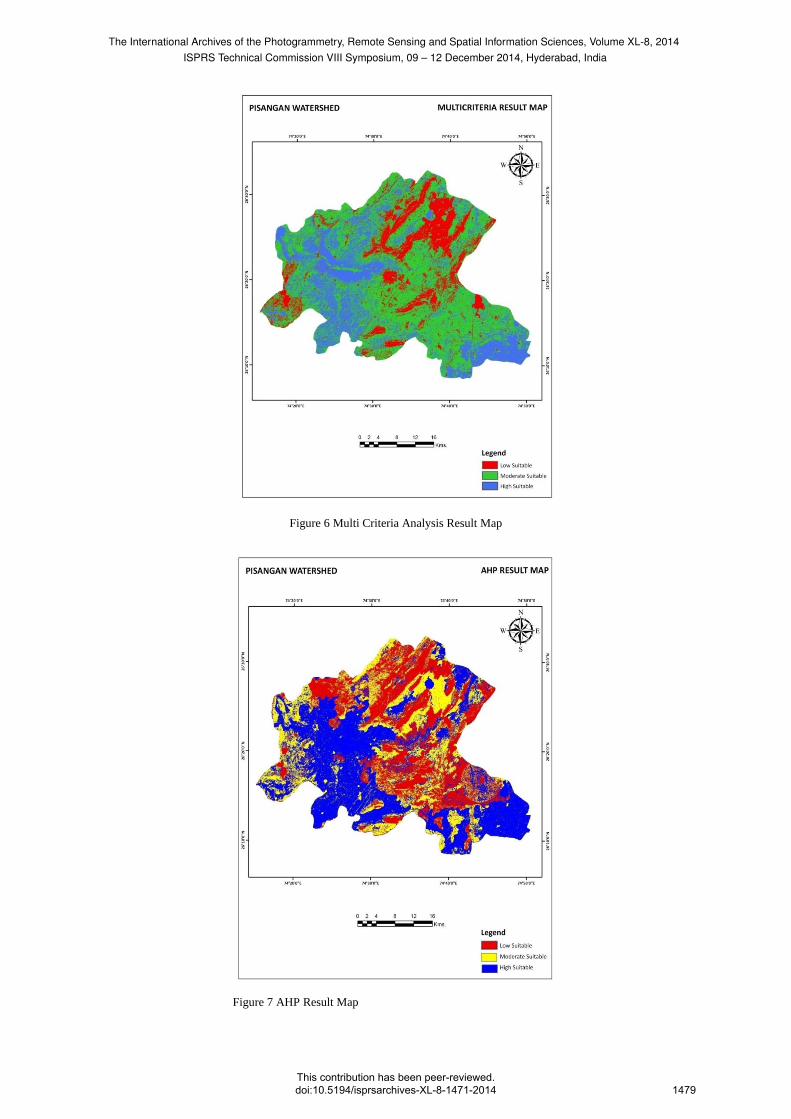
Figure 6 Multi Criteria Analysis Result Map
Figure 7 AHP Result Map
The International Archives of the Photogrammetry, Remote Sensing and Spatial Information Sciences, Volume XL-8, 2014ISPRS Technical Commission VIII Symposium, 09 – 12 December 2014, Hyderabad, India
This contribution has been peer-reviewed. doi:10.5194/isprsarchives-XL-8-1471-2014
1479

Results
The multi layer integration through land use/cover slope,
flow direction, drainage (buffer) road (buffer) and
settlement (buffer) gave the suitability units for
identifying RWH sites for insitu, ponds, rocks and dam
catchments. Factor layers (maps) were incorporated in
ArcMap MCE analysis, using the Weighted Overlay function
in the ArcGIS analyst, finally, a final suitability map was
developed that show the potential sites for different Water
Harvesting Sites in study area. The suitability maps below
for the different rainwater harvesting show that there
are multiple areas suitable for each techniques from the
weighted overlay, figures 8 show the suitability maps for
location of stop dams, check dams, percolation tank, storage
tank and in-situ respectively.
The AHP Result has been used to saw the rainfall runoff of
the watershed; the runoff is mainly seen on the South side of
the watershed and on the south east portion of the watershed.
One of the cities Nasirabaad located in this region. The
rainfall mainly recharges the groundwater and increase the
potential of the ground water.
S.No Types of
Structure
Lithology Land Use/ Land
Cover
Slope Drainage
1 Storage Tank Sandstone/Limestone Wasteland Steep Slope 2nd or 3rd Order Stream
2 Percolation Tank Sandstone/Quartzite Land with Scrub Moderate Slope 2nd, 3rd or 4th Order
Stream
3 Stop Dam Phylite / Schist Forest Very Gentle Slope 3rd and 4th Order Stream
4 Check Dam Granite/ Genissic Cropping land Gentle Slope 5th and 6th Order Stream
Table 5 Water Resource Management Map
Rain Water Harvesting Systems
Storage tank is one of the structures for surface water
storage. These structures are very useful in rain water
harvesting. Storage tanks are often cylindrical in shape,
perpendicular to the ground with flat bottoms and a fixed or
floating roof.
In the study of Pisangan Watershed, the most suitable areas
for storage tank is suggested in the areas where open and
land without scrub along with sandstone and less density of
lineaments are found having steep slope. Twelve sites for
construction of storage tanks are suggested in the Pisangan
Watershed. The suggested sites are in the areas of
Govindgradh village, Kishanpura village and Hokran Bari
village. These areas fulfill all the necessary conditions
needed for construction of storage tanks.
Percolation tanks are the structures for recharging ground
water. These are generally constructed across streams and
bigger gullies in order to impound a part of the run-off
water.
In the study of Pisangan Watershed, areas which are under
land with scrub, moderate slope, basalt and high density of
lineaments is proposed for percolation tank. Sixteen sites
for construction of percolation tanks are suggested in the
Pisangan Watershed. The suggested sites are in the areas of
Gowaliya village and somalpur village. These areas fulfill
all the necessary conditions needed for construction of
percolation tanks.
Stop Dam is a masonry barriers built across the direction of
water flow on shallow rivers and streams for the purpose of
water harvesting for irrigation as well as for domestic and
animal use. In the study of Pisangan Watershed, the areas
of open degraded forest, gentle slope and 3rd to 4th order
stream is proposed for stop dam. Thirteen sites for
construction of stop dams are suggested in the Pisangan
Watershed. The suggested sites are in the areas of Rampura
village and Gola village. These areas fulfill all the
necessary conditions needed for construction of stop dams.
Check dams are small devices constructed of rock,
sediment retention fiber rolls, gravel bags, sandbags, or
other proprietary product placed across a natural or
manmade channel or drainage ditch. A properly designed,
constructed, and maintained check dam will reduce scour
and channel erosion by reducing flow velocity and
encouraging sediment settlement.
In the study of Pisangan Watershed, areas having double
crop, sandstone, very gentle slope and 5th and 6th order
stream are proposed for check dams. Fifteen sites for
construction of check dam are suggested in the Pisangan
Watershed. The suggested sites are in the areas of
Peesangan village, Amitpura village and Amangarh village.
These areas fulfill all the necessary conditions needed for
construction of check dams.
For Water Resource management, shown in Fig8 the Study
area of Pisangan Watershed has resultant in the areas where
different implementation can be done based on different
area suitable for the sustainable development of Water
Resources.
The International Archives of the Photogrammetry, Remote Sensing and Spatial Information Sciences, Volume XL-8, 2014ISPRS Technical Commission VIII Symposium, 09 – 12 December 2014, Hyderabad, India
This contribution has been peer-reviewed. doi:10.5194/isprsarchives-XL-8-1471-2014
1480

Figure 8 Water Harvesting Site Suitability Map
Conclusion
Due to rapid urbanization in the study area, demand for
water Consumption has increased at an unprecedented rate.
Statistics on water availability in the study area has already
revealed that water table has gone down remarkably in
last 2-3decades. Nevertheless, the area has sufficient
potential to feed on the ever increasing demand of water if
harvest and conserve properly.
Geographic information system(GIS), a spatial as well as
non spatial database management system, enables us to
manage a large volume of data from a variety of sources.GIS
stores, retrieve, manipulate and analyze and present the data
according to the user defined specification, and therefore, is
an ideal tool in advanced site-selection studies.
Site selection for RWH is carried out by overlying the slope,
soil, land use/land cover & buffered stream order maps. The
study area is having full scope for storage tanks, percolation
tanks, stop dam and check dams. Produced map will help in
the selection of the suitable location of harvesting structures
and hence, help in water conservation in water depleted area.
For Site Suitability for Water Resource Management
approach, thematic layers such as Lithology,
Geomorphology, Lineaments and Land use/Land cover
features basically the physical properties of the watershed
were generated from the remote sensing data and integrated
with Drainage, Soil and Slope maps under GIS environment.
Further, Multi Criteria Based Analysis was done to
demarcate the zones of suitable surface and ground water
exploitation structures and artificial recharge structures by
using Equal weightage approach. Thus, integrated remote
sensing and GIS can provide the appropriate platform for
analysis of multi disciplinary data and sustainable
development of land and water resources. Remote sensing
data can especially play significant role in generation of
parameters from remote areas of watershed and enable us to
arrive at natural resource management solutions by adopting
a holistic approach.
The soil conservation service model was applied by using
average annual rainfall for the period 2000 to 2012 in
Pisangan area to estimate the runoff depth. The analysis of
rainfall indicates that a significant amount of annual runoff
depth can be harvested. Using GIS techniques, these
databases can be converted to information about land
use/land cover mapping and change detection, runoff
estimation, soil erosion study, site suitability analysis for rain
water harvesting, watershed prioritization etc. can be
effectively carried out using GIS techniques. The remote
sensing technology could be used for monitoring the
progress of implementation work and also assess the impact
of the implementation.
The International Archives of the Photogrammetry, Remote Sensing and Spatial Information Sciences, Volume XL-8, 2014ISPRS Technical Commission VIII Symposium, 09 – 12 December 2014, Hyderabad, India
This contribution has been peer-reviewed. doi:10.5194/isprsarchives-XL-8-1471-2014
1481

References
• Brady, N.C. (1974). The Nature and Properties of Soils.
New York: MacMillan. 639 pp.
• Central Ground Water Report (2008), State Government
Rajasthan.
• Chakaravarty A.K (1993), Strategies for watershed
management planning using Remote sensing
techniques, Journal of Indian society of Remote Sensing
Vol-21, pp 87-98.
• Durbude. D.G &Venkatesh, B(2004), Site suitability
analysis for soil & water conservation structures,
Journal of Indian society of Remote Sensing Vol-32,
pp- 399-405.
• IWMP Report of Ajmer District (2009), Soil and Water
conservation Department
• Joshi .K.A,Kundal.P, (2004), water resources
development action plan for sati watershed chandrapur
district, Maharashtra using Remote sensing and GIS,
Journal of Indian society of Remote Sensing Vol-32.
• Kumar.Girish. M, Aggrawal.K.A (2008)Delineation of
potential sites for water harvesting structures using
Remote Sensing and GIS, Journal of Indian society of
Remote Sensing Vol-36, pp 323-334.
• Raojagdesswara P. and Rao, Suryaprakasa.B,(2004) An
integrated study on ground water resources of
peddagedda watershed, Journal of Indian society of
Remote Sensing Vol-34.
• Rao. K , Singh K.D,(2006) Sustainable development of
land and water resources using Remote Sensing and
GIS, Journal of Indian society of Remote Sensing Vol-
34, pp 223-229.
• Singh. P.J, Singh.Darshdeep,(2009) Selection of
suitable sites for water harvesting structures in
soankhand watershed, Punjab using Remote sensing &
GIS approach –A Case Study, Journal of Indian society
of Remote Sensing Vol-37.
• Sharma.K.V, Patil. S.G (2008), Application of RS
Technology for Impact Assessment of watershed
development programme, Journal of Indian society of
Remote Sensing Vol-36
• Trivedi.R.K& Singh, R.M (2005), A micro level
approach for integrated watershed investigation
development planning & artificial recharge site
selection for ground water in malani river watershed,
Gondwana geological magazine,Vol-20, pp-137-146.
• Thinh N.X & Vogel R.T (2007), Application of
Analytic Hierarchy process in the multiple criteria
decision analysis of retention areas for flood risk
management, Environmental informatics and systems
research, pp-675-682.
• http://www.physicalgeography.net/fundamentals/10ah.h
tml
• http://support.esri.com/en/knowledgebase/GISDictionar
y/term/reclassification
The International Archives of the Photogrammetry, Remote Sensing and Spatial Information Sciences, Volume XL-8, 2014ISPRS Technical Commission VIII Symposium, 09 – 12 December 2014, Hyderabad, India
This contribution has been peer-reviewed. doi:10.5194/isprsarchives-XL-8-1471-2014
1482