Embed Size (px)
Citation preview
Simulation of Water Adsorption on Kaolinite under Atmospheric Conditions
T. Croteau, A. K. Bertram,* and G. N. Patey†
Department of Chemistry, UniVersity of British Columbia, VancouVer, British Columbia, Canada V6T 1Z1
ReceiVed: March 18, 2009; ReVised Manuscript ReceiVed: May 7, 2009
Grand canonical Monte Carlo calculations are employed to investigate water adsorption on kaolinite at 298and 235 K. Both basal planes (the Al and Si surfaces) as well as two edge-like surfaces are considered. Thegeneral force field CLAYFF is used together with the SPC/E and TIP5P-E models for water. Problems thatoccur in single slab simulations due to arbitrary truncation of the point charge lattice are identified, and aworking remedy is discussed. The edges and the Al surface adsorb water at subsaturation in the atmosphericallyrelevant pressure range. The Si surface remains dry up to saturation. Both edges have a very strong affinityfor water and adsorb continuously up to monolayer coverage. The Al surface has a weaker affinity for waterbut forms a subsaturation monolayer. On the Al surface, the monolayer is formed in an essentially sharptransition, and strong hysteresis is observed upon desorption. This indicates collective behavior among thewater molecules which is not present for the edges. Binding energies of singly adsorbed water molecules at10 K were determined to understand the differences in water uptake by the four kaolinite surfaces. Bindingenergies (SPC/E) of -21.6, -46.4, -73.5, and -94.1 kJ/mol, were determined for the Si surface, Al surface,unprotonated edge, and protonated edge, respectively. The water monolayer on the Al surface, particularly at235 K, exhibits hexagonal patterns. However, the associated lattice parameters are not compatible with iceIh. Water density and hydrogen bonding in the monolayers at both 298 and 235 K were also determined tobetter understand the structure of the adsorbed water.
I. Introduction
Mineral dust particles are abundant in the atmosphere, withestimated total global emissions of 800-1500 Tg/year.1-5 Thecomponents of aerosolized mineral dust found in the atmosphereinclude illite, kaolinite, montmorillonite, quartz, and calcite.Kaolinite represents a significant component, comprising ap-proximately 5-10% of aerosolized mineral dust.6 In theatmosphere, mineral dust particles can take up water and act ascloud condensation nuclei or ice nuclei.7-13 Thus, mineral dustparticles can influence climate by changing the frequency andproperties of clouds.8,10,14,15 To completely understand theseprocesses, one must first understand the interaction of waterwith mineral dust particles.
Mineral dust particles can also provide a surface on whichheterogeneous reactions can occur in the atmosphere. Thesereactions could be a sink of gas-phase atmospheric species andinfluence the chemical composition of the mineral dust par-ticles.16 Examples of reactions that may occur on mineral dustparticles are the hydrolysis of N2O5 and the uptake of HNO3.Recent studies17-23 have shown that these reactions can bestrongly influenced by the presence of water on mineral surfaces.Hence, in order to understand these reactions under atmosphericconditions, an understanding of the interaction of water withmineral surfaces is also necessary.
One method of studying the interaction of water with mineralsurfaces is to use computational methods. The interaction ofwater with kaolinite has been investigated in several ab initiostudies, which have confirmed the hydrophobic and hydrophilicnature of the Si and Al surfaces, respectively.24-28 Thehydrophobicity of the Si surface refers to its rather weak
interaction with a water molecule, which, in some instances,can lead to water clustering instead of layering.
The recent computational studies of Hu and Michaelides27,28
are of particular relevance for ice nucleation studies. Theseauthors have examined water on the Al surface of kaolinite byemploying density functional theory (DFT). They found that atwo-dimensional (2D) water layer with a stability comparableto that of ice Ih could be formed on the Al surface, but theynote a mismatch between the ice Ih lattice and the 2D waterstructure imposed by the substrate. Moreover, they note thatmultilayers of water on the Al surface are less stable than bulkice.
More recently, we used grand canonical Monte Carlo(GCMC) calculations to study water adsorption and structureon kaolinite surfaces as a function of relative humidity (RH) at235 K, with a focus on ice nucleation.29 We found monolayerformation, but the lattice parameters did not match that of iceIh. Indeed, the strain produced on an ice embryo by the latticemismatch strongly suggests that an atomically smooth, defect-free Al surface would not be a good ice nucleus, contrary tosome previous speculation.30
There have been a number of simulation studies of water onvarious related surfaces, including the Al and Si surfaces ofkaolinite,31-33 CaF2 and BaF2,34 �-AgI,35-37 metals,38,39 andmodel hexagonal surfaces.40 However, we note that the vastmajority of this work has employed closed systems and doesnot address adsorption questions. A relevant exception is thework of Delville,33 who focused on the Si surface.
The present paper describes a significant extension of ourinitial studies of water adsorption on kaolinite at 235 K, whichfocused on ice nucleation.29 Here, we investigate in detail wateradsorption on kaolinite at both 298 and 235 K, again employingthe GCMC method, which is well-suited to address adsorptionquestions. The calculations at 298 K allow us to compare
* To whom correspondence should be addressed. E-mail: [email protected].
† E-mail: [email protected].
J. Phys. Chem. A 2009, 113, 7826–78337826
10.1021/jp902453f CCC: $40.75 2009 American Chemical SocietyPublished on Web 06/10/2009

qualitatively with recent adsorption experiments,41 and those at235 K are motivated by ice nucleation experiments carried outat that temperature.9,10 Four kaolinite surfaces are considered.These include the hydrophilic Al surface, the hydrophobic Sisurface, and two so-called edge configurations (defined below).Some of the topics addressed in the present paper that were notincluded in our preliminary report are as follows.
We examine the modeling/simulation techniques employedand identify potential problems that can arise. For example, wenote that arbitrary truncation of a kaolinite slab (a lattice ofpoint charges) can lead to strong unphysical fields at longdistances from the surface of interest. These fields can seriouslydistort the results obtained, but we show that such effects canbe essentially eliminated by carrying out simulations with twoslabs arranged such that the long-range, truncation-dependentfields cancel exactly. We also examine the convergence of theEwald sums necessary to take account of the long-rangeCoulombic interactions.
We determine water adsorption isotherms at 298 and 235 Kfor all four surfaces, and the results are compared with recentlaboratory studies. We study the orientation and binding energiesof single adsorbed water molecules at 10 K to understand thedifferences in water uptake by the four kaolinite surfaces. Thisincludes determination of the binding energies and geometricarrangements of single water molecules on the surface, as wellas water-surface hydrogen bond analyses. The water structurein the monolayers is analyzed using density and hydrogen-bondnumber profiles.
The remainder of this paper is organized into three parts. Themodels and simulation issues are discussed in section II, theresults are presented and discussed in section III, and ourconclusions are summarized in section IV.
II. Model and Method
The model used for the clay lattice is CLAYFF, a generalforce field developed by Cygan et al.42 In this model, the short-range interactions of all atoms are represented by Lennard-Jones(LJ) potentials. For the lattice oxygens, the parameters assignedare identical to those of the single point charge (SPC) modelfor water.43 Partial charges for all lattice atoms were derivedby periodic density functional theory calculations based on theelectronic structures of simple oxides and hydroxides (e.g.,quartz (R-SiO2), corundum (R-Al2O3), boehmite (γ-AlO(OH)),and others).42 The structure of kaolinite obtained by Bish44 wasused to improve the optimization of the interaction parameters.The versatility of this model, mainly due to the use of anonbonded description for the interatomic interactions of thelattice, gives a general force field suitable for application to awide variety of different clays. To keep the computationalrequirements practical, we use a rigid lattice corresponding tothe most stable kaolinite configuration.44
We employ the extended single point charge SPC/E45 andTIP5P-E46 models to represent the water-water and water-latticeinteractions. The SPC/E is a widely used three-site model withthe Coulombic interactions described by three point charges (onefor each atomic nucleus) embedded in a LJ sphere centered atthe oxygen. TIP5P-E is a recent reparameterization of theoriginal TIP5P model47 to better treat the long-range interactionswhen using Ewald sums. It is a five-site model with positivecharges located at the hydrogen nuclei and negative charges at“lone pair” positions, all embedded in a LJ sphere centered atthe oxygen nucleus. The water models are rigid with oxygen-hydrogen bond lengths of 1 and 0.9572 Å, and bond angles of109.47 and 104.52° for the SPC/E and TIP5P-E models,
respectively. For TIP5P-E, the oxygen lone pairs are located at0.7 Å, with a bond angle of 109.47°. Both models give areasonably good description of water structure and properties45,48
under ambient conditions. We note that the TIP5P-E model givesa more accurate prediction of the melting point of ice, 274compared with 215 K for the SPC/E model.49 However, thisdifference does not appear to have a significant influence onwater adsorption on kaolinite. Two different water models areused to ensure as far as possible that model-dependent effectsare not significantly influencing our observations and conclu-sions. It should be noted that both water models employed arerigid point-charge models that do not allow for water dissocia-tion. While water dissociation might play a significant role insurface chemistry, we would not expect it to have a largeinfluence on the adsorption isotherms.
The configurational energy for our system, U, is given bythe sum of Coulombic and LJ interactions
where the sums are over all lattice and water interaction sitesand rij is the distance between sites i and j. The first termrepresents the Coulombic interactions, where qi is the pointcharge on site i, e is an elementary charge, and εo is the dielectricpermittivity of free space. The second term represents the LJcontribution, and the energy and distance parameters for thedifferent site-site interactions, Do,ij and Ro,ij, respectively, aregiven in ref 42. For the cross interactions, the Lorentz-Berthelotrules, Do,12 ) (Do,11Do,22)1/2 and Ro,12 ) (Ro,11 + Ro,22)/2, areused.
Kaolinite [Al2Si2O5(OH)4] is a clay mineral that has a layeredstructure. These layers consist of octahedral aluminum (Alsurface) and tetrahedral silicon (Si surface). Kaolinite consistsof many of these layers attached together by hydrogen bondsbetween the hydroxyl groups extending from the Al surface andbridging oxygens on the Si surface. The large number ofhydrogen bonds connecting the layers makes them almostinseparable. Thus, kaolinite is described as a nonexpanding ornonswelling clay. The three-dimensional simulation cell il-lustrated in Figure 1 is constructed such that the Al and Sisurfaces are parallel to the (001) plane. The rectangular latticesperiodically replicated in the xy plane are composed of 48
Figure 1. The simulation cell.
U ) e2
4πεo∑i*j
qiqj
rij+ ∑
i*j
Do,ij[(Ro,ij
rij)12
- 2(Ro,ij
rij)6]
(1)
Simulation of Water Adsorption on Kaolinite J. Phys. Chem. A, Vol. 113, No. 27, 2009 7827

kaolinite unit cells for a total of 816 atoms per surface. The xand y dimensions of the cell are 30.921 and 35.7676 Å,respectively.
In addition to the Al and Si surfaces, we consider twoadditional surfaces that commonly occur in kaolinite samples50-52
and are sometimes called “edges”, a term that we will adopthere. Two extreme edge cases are considered, one which has“bare” oxygens exposed (unprotonated edge) and another whereall oxygens are protonated (protonated edge). The unprotonatededge is constructed by cleaving the Al surface along the (100)plane such as to have oxygen atoms exposed (see Figure 1).The surface is then rotated 90° counterclockwise to bring theexposed oxygens into the (001) plane and expanded to have xand y dimensions of 29.524 and 35.76764 Å, respectively, andcontain 816 atoms. A protonated edge is constructed by placinghydrogen atoms (a total of 64), each with a charge of 0.4250e,1 Å above every bare oxygen atom. To counterbalance this extracharge and maintain a neutral surface, an opposing negativecharge is equally distributed on all sites below the first layer ofAl and Si atoms. Specifically, a negative charge of 0.05e isplaced on all 544 sites below the surface. This procedure isobviously somewhat arbitrary, but changing the surface thick-ness (thus reducing the charge per subsurface site) does not haveany significant effect on the results obtained. We remark thatmany “edge” surfaces could be constructed by cleaving kaolinitealong different planes. The particular edges considered here havebeen discussed by previous authors50-52 and are believed to makea significant contribution to the surface area of kaolinite samples.
Care must be taken in simulating slabs that are periodicallyinfinite in two dimensions (x and y) but arbitrarily truncated inthe third (z). Although our samples are overall electricallyneutral, arbitrary truncation of the discrete point charge latticecan induce local charge imbalance at the resulting surface andsignificant net polarization. This can create unphysical fieldsthat depend strongly on the slab thickness and can act at largedistances from the surface. Such effects would not occur for aninfinitely thick sample because charges in neighboring layerspreserve local charge neutrality. As an illustration of theproblem, the interaction energy of a water molecule (arbitraryorientation) with a single surface is shown in Figure 2 (top).We note that the interaction energy does not decay quickly andis about -3 kJ/mol at a distance of 25 Å from the surface. This
unphysical interaction strongly depends on the slab thickness,is different for different surfaces, and can significantly influencethe results obtained. For example, for the Al and Si surfaces,one can observe small isolated water “towers” on the surface,such as those previously reported by Delville33 for the Si surface.We believe that such effects are artifacts of the long-range,unphysical field resulting from truncation of the charge lattice.One way to solve this problem is to add an opposing surfacehaving the same size and layer structure (see Figure 1), suchthat the unphysical fields produced by truncation simply cancel.We note that this technique was previously employed by Warneand Cosgrove31 for similar reasons. Results for a single watermolecule in a two-slab arrangement are also shown in Figure2, and we see that the interaction now approaches 0 at about10 Å from the surface. The strong dependence on slab thickness(not shown) found for a single slab vanishes when two slabsare used. Furthermore, unusual structures such as isolated watertowers without any obvious physical explanation no longeroccur.
The configurational energies were obtained using a methodpreviously applied to slab geometries with long-range electro-static interactions.53,54 We wish to calculate the long-rangeinteractions in a slab of finite thickness. One way to do this isto periodically repeat the cell shown in Figure 1 in threedimensions and apply the usual 3D Ewald method55 but leaveenough empty space to prevent the undesired images in the zdirection from having a significant physical influence.53,54 Forour systems, an empty gap of 107 Å was found to be sufficientfor this purpose, and increasing the gap further had no noticeableeffect. Comparing adsorption results, it was judged sufficientto employ 6858 wave vectors in the Ewald sums as nosignificant change was observed with larger numbers. The otherEwald parameters employed were R ) 0.175 Å-1 and areciprocal space cutoff of 2.0 Å-1. The LJ and real spaceinteractions were cut off at half of the length of the x side ofthe simulation cell.
The simulations were carried out employing the GCMCmethod.55 This method allows the equilibrium properties of anopen system to be obtained at fixed chemical potential, µ,volume, and temperature. In the present calculations, the numberof water molecules, NW, fluctuates. A Monte Carlo step isdefined as an attempted insertion, deletion, or displacement(rotation or translation) of a water molecule, and all threepossibilities were attempted with equal probability. The ac-ceptance rate for insertion (deletion) moves was ∼0.01%, whichis comparable to that found in GCMC simulations of bulkwater;56 the maximum size of the displacement moves wasadjusted to give an acceptance rate of ∼50%. To ensureconvergence, the systems were equilibrated for at least 5 × 10⁷
Monte Carlo (MC) steps. Following equilibration, averages werecollected for 2 × 10⁸ or more MC steps and include energy,water content, density profile, and hydrogen-bond number. Thisprocedure was repeated for a wide range of chemical potentialsand at different temperatures to produce adsorption isothermsand related properties for all four surfaces.
For the two-slab geometry discussed above (Figure 1), thenumber of layers included in each kaolinite slab did notsignificantly influence the results, and a single layer (constructedas described above) was sufficient for this investigation.However, since we are interested in modeling adsorption onsingle surfaces rather than in slits of finite width, care must betaken to place the slabs sufficiently far apart such that the wateradsorption on each slab is not influenced by the presence ofthe other. Most simulations were carried out with the slabs
Figure 2. The surface-water interaction energy of a single, randomlyoriented, SPC/E water molecule as a function of the perpendiculardistance from the center of the highest hydroxyl hydrogen atom on theAl surface. The top and bottom panels show the results obtained forsimulation cells with one and two slabs, respectively. The blue (circles),red (squares), and green (triangles) lines correspond to 6858, 15624,and 226980 k-space wave vectors, respectively.
7828 J. Phys. Chem. A, Vol. 113, No. 27, 2009 Croteau et al.
separated by 30 Å, but some test runs were performed with aseparation of 60 Å. These confirmed that, at least before thefilling transition at saturation (bulk condensation of the vapor),the surfaces adsorbed independently. The results reported wereobtained by averaging values for both surfaces, which improvesthe statistics. Some simulations were also performed by varyingthe x and y cell dimensions by factors of 0.5 and 1.5, and again,these tests revealed no significant system size dependence.
III. Results and Discussion
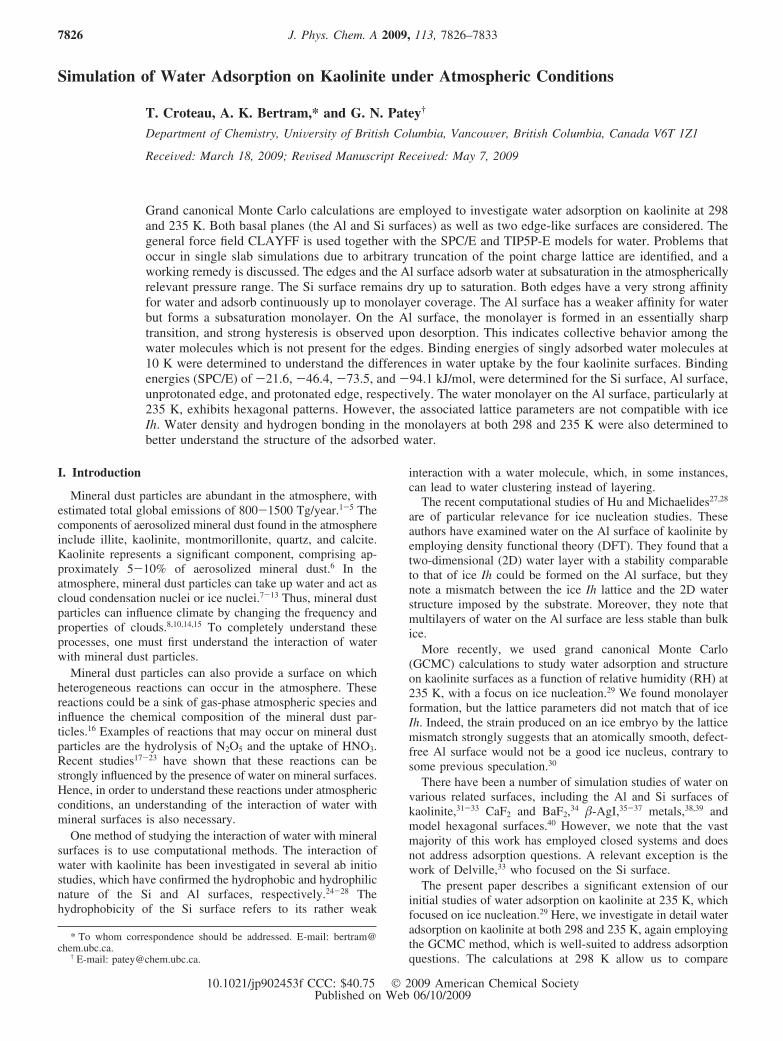
A. Water Adsorption at 298 and 235 K. Adsorptionisotherms for all four surfaces obtained at 298 K are displayedin Figure 3 as a function of chemical potential. The watercoverage plotted on the vertical axis is the average number ofwater molecules adsorbed on a single surface. For atmosphericcomparisons, it is often useful to convert the chemical potentialscale into pressure/saturated vapor pressure (P/Po). Since thesaturated vapor pressure of water at 298 and 235 K is low (<0.1atm), the vapor pressures can be estimated using the ideal gasrelationship, P ) e�µtr/�Λ3, where µtr is the translationalcontribution to the chemical potential and Λ is the thermal deBroglie wavelength. The saturated vapor pressure Po for ourmodels can be found by setting P/Po ) 1 at the filling transitionsobserved in the simulations. Some P/Po estimates are givenbelow. In contrast to the Al surface and the edges, for bothwater models considered, the Si surface remains completely dryup to the filling transition. For this reason, no further adsorptionresults are presented for the Si surface.
Qualitatively similar adsorption behavior is observed for bothwater models. Both edges adsorb readily even at low chemicalpotentials (vapor pressures), the protonated edge having thegreatest affinity for water. Adsorption begins at very lowchemical potentials for these surfaces, that is, below µ ≈ -75.0(P/Po ≈ 9.6 × 10⁻⁴) and -90.0 kJ/mol (P/Po ≈ 2.3 × 10⁻⁶)for the unprotonated and protonated edges, respectively. As thechemical potential is increased, the water uptake increasesslowly, partially covering the surface at well-defined bindingsites (see discussion below) until a monolayer is obtained at µ≈ -63.0 kJ/mol (P/Po ≈ 0.12)(SPC/E). The film then thickens,and finally, a transition to a completely filled state occurs. Thestrong water affinity of the edges demonstrates that they can
make an important contribution to water uptake and could wellplay an important role in heterogeneous surface chemistry thatinvolves water.
In contrast, adsorption on the Al surface occurs over a muchnarrower range of chemical potentials (which is slightly largerfor TIP5P-E), suggesting a weaker water affinity on that surface.On the chemical potential scale shown in Figure 3, it is onlyjust prior to filling, at µ ≈ -59.2 (SPC/E) and -56.5 kJ/mol(TIP5P-E), that monolayer coverage is achieved. Note that wetake monolayer coverage to be a density of one water moleculeper 9 Å2 of surface area (assuming a smooth surface) or about100 molecules on a single surface in our simulation cell. Interms of the relative vapor pressure, P/Po, the adsorption rangeon the Al surface is of atmospheric relevance. The P/Po rangeover which adsorption occurs is approximately 0.55-1 at 298K, and 0.2-1 at 235 K, which covers the range of interest foratmospheric science.14
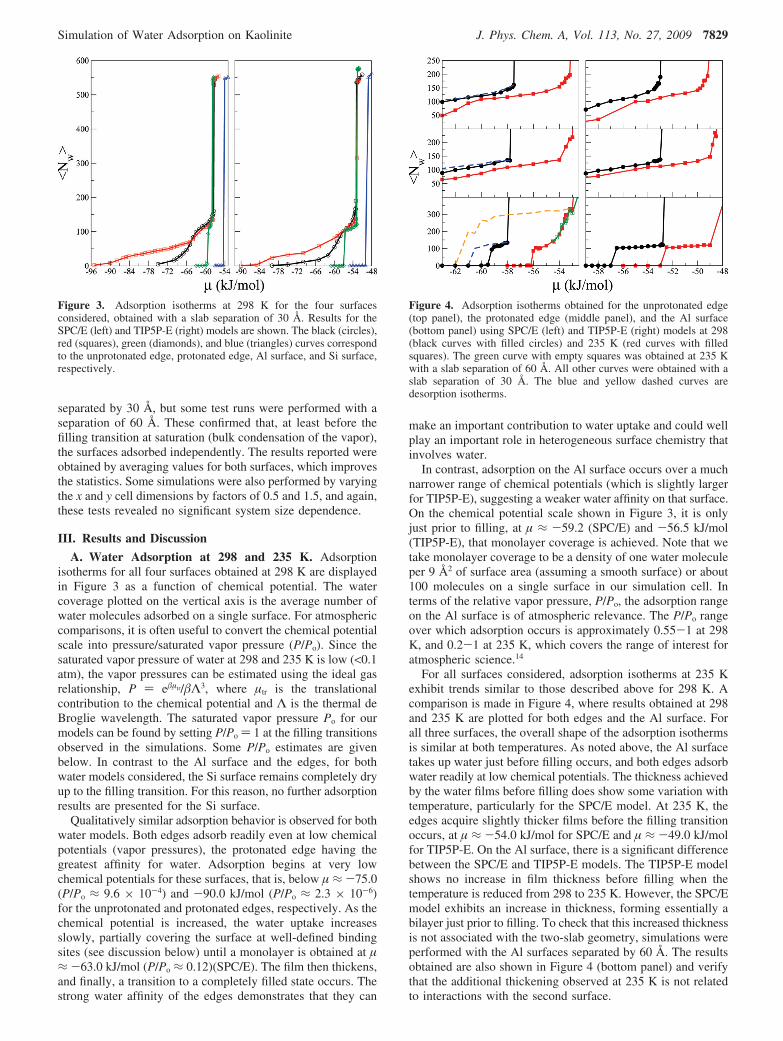
For all surfaces considered, adsorption isotherms at 235 Kexhibit trends similar to those described above for 298 K. Acomparison is made in Figure 4, where results obtained at 298and 235 K are plotted for both edges and the Al surface. Forall three surfaces, the overall shape of the adsorption isothermsis similar at both temperatures. As noted above, the Al surfacetakes up water just before filling occurs, and both edges adsorbwater readily at low chemical potentials. The thickness achievedby the water films before filling does show some variation withtemperature, particularly for the SPC/E model. At 235 K, theedges acquire slightly thicker films before the filling transitionoccurs, at µ ≈ -54.0 kJ/mol for SPC/E and µ ≈ -49.0 kJ/molfor TIP5P-E. On the Al surface, there is a significant differencebetween the SPC/E and TIP5P-E models. The TIP5P-E modelshows no increase in film thickness before filling when thetemperature is reduced from 298 to 235 K. However, the SPC/Emodel exhibits an increase in thickness, forming essentially abilayer just prior to filling. To check that this increased thicknessis not associated with the two-slab geometry, simulations wereperformed with the Al surfaces separated by 60 Å. The resultsobtained are also shown in Figure 4 (bottom panel) and verifythat the additional thickening observed at 235 K is not relatedto interactions with the second surface.
Figure 3. Adsorption isotherms at 298 K for the four surfacesconsidered, obtained with a slab separation of 30 Å. Results for theSPC/E (left) and TIP5P-E (right) models are shown. The black (circles),red (squares), green (diamonds), and blue (triangles) curves correspondto the unprotonated edge, protonated edge, Al surface, and Si surface,respectively.
Figure 4. Adsorption isotherms obtained for the unprotonated edge(top panel), the protonated edge (middle panel), and the Al surface(bottom panel) using SPC/E (left) and TIP5P-E (right) models at 298(black curves with filled circles) and 235 K (red curves with filledsquares). The green curve with empty squares was obtained at 235 Kwith a slab separation of 60 Å. All other curves were obtained with aslab separation of 30 Å. The blue and yellow dashed curves aredesorption isotherms.
Simulation of Water Adsorption on Kaolinite J. Phys. Chem. A, Vol. 113, No. 27, 2009 7829

Some associated desorption isotherms for the SPC/E modelare also plotted in Figure 4. These were obtained by carryingout simulations at decreasing chemical potentials, starting withan initial configuration obtained at a chemical potential that isjust below the filling transition on the adsorption curve.Simulations were carried out at decreasing chemical potentialsuntil all water molecules evaporated. We noted above thatadsorption on the edges is relatively smooth before the fillingtransition. This, together with the fact that the desorption curvesreveal relatively little hysteresis, suggests that water adsorptionon the edges is essentially a continuous process, dominated bywater-surface interactions. In contrast, water adsorption on theAl surface is not smooth and “jumps” rather sharply fromessentially nothing to monolayer coverage. Additionally, thedesorption curves show a large hysteresis at both temperatures.These observations indicate that water adsorption on the Alsurface has strong “first-order” characteristics, with importantcollective behavior among the water molecules.
Recently, Schuttlefield et al.41 investigated water uptake onkaolinite minerals using ATR-FTIR spectroscopy coupled withquartz crystal microbalance measurements at 296 K. The datashow that kaolinite particles take up water continuously from 0to 90% RH (P/Po × 100). At a RH of 50%, they observedapproximately 6-25 monolayers of water uptake, and at 80%RH, they observed approximately 10-40 monolayers of wateruptake, depending on the source of the kaolinite. This is incontrast to our simulations at 298 K, where we do not observemore than approximately monolayer coverage below 100% RHfor any of the surfaces considered. The simulations suggest thatthe water uptake observed in the laboratory experiments cannotbe explained by water uptake on defect-free surfaces.
B. Orientations and Binding Energies of Singly AdsorbedWater Molecules. The differences in water uptake by the fourkaolinite surfaces can be largely understood by considering thelow-temperature water-surface binding energies. Results ob-tained in NVT Monte Carlo simulations at 10 K involving onlya single water molecule are summarized in Table 1. The standarddeviations included in Table 1 were obtained by dividing MonteCarlo runs of 106 steps into 10 equal blocks and assuming thatthe block averages are independent estimates of the water-surfaceinteraction energy. Other error estimates using widely spacedsingle configuration energies gave similar values. We note thatthe average water-surface energies obtained for the SPC/E andTIP5P-E models are in good agreement, except for the proto-nated edge, where the SPC/E interaction is more attractive by∼15.6 kJ/mol. For both models, the single water moleculebinding energies correlate well with the water adsorption curvesshown in Figures 3 and 4. The weakest interaction is obtainedfor the Si surface which does not adsorb water before thechemical potential reaches bulk saturation, and the strongestinteractions are for the edges which adsorb at very low chemicalpotentials (vapor pressures). In this case, the very strongwater-surface interactions can support very low coverages bothat 298 and 235 K. For the Al surface, which adsorbs near bulk
saturation but in the atmospherically relevant range, the interac-tion energy lies between the two extremes. For the Al surface,the direct water-surface interaction is not strong enough forsignificant submonolayer coverage, and collective water-waterinteractions are necessary to stabilize the monolayer. Thisexplains the relative sharpness of the transitions on this surface(Figures 3 and 4) and the hysteresis noted above.
It is instructive to consider the surface-single-water-moleculeinteractions in more detail. The geometric arrangements obtainedat 10 K are shown in Figure 5, indicating clearly the clay atomsthat form hydrogen bonds with the water molecule. We definea hydrogen bond using geometric criteria similar to those appliedin earlier work.57,58 Specifically, a water-water hydrogen bondis said to exist if and only if the water-oxygen-water-oxygendistance is less than 3.41 Å, the water-hydrogen-water-oxygendistance is less than 2.38 Å, and the O-O-H angle is less than35°. This definition can be generalized to water-surfacehydrogen bonds in an obvious manner. The lengths and anglechosen are clearly arbitrary to some extent, and using differentparameters might, in some cases, influence the number ofhydrogen bonds counted. In the present case, the number ofwater-surface hydrogen bonds is somewhat sensitive to theangle used, but 35° appears to be a reasonable choice yieldinghydrogen-bond numbers consistent with those previously re-ported for the Al surface (see below).
We first consider the Si surface which has the weakestinteraction with water. We note that the energies obtained forboth water models are very similar despite the differingorientations (Figure 5a and b). For the SPC/E model (Figure5a), there is a strong hydrogen bond between the water hydrogenand the closest bridging oxygen of the surface. The waterhydrogens also have strong attractive interactions with otherneighboring bridging oxygens. However, the structure shownin Figure 5a leads to highly repulsive interactions between thewater hydrogens and silicon atoms of the surface, leading to anet attraction that is relatively weak. For the TIP5P-E model,the most attractive and repulsive interactions are modified andcome from the lone pair charges interacting with surface siliconand oxygen atoms, respectively. This gives the structure shownin Figure 5b, where both water hydrogens lie flat in the xy planeand there are no hydrogen bonds with the surface. As notedabove, somewhat surprisingly given the structural differences,both water models give essentially the same binding energy.
A water molecule binds much more strongly to the Al surface,and the energies that we obtain (Table 1) compare well withprevious DFT calculations.28 Note that when the zero-pointenergy (not present in our classical model) is removed, the DFTbinding energy is ∼-43.4 kJ/mol, which is close to our values(-46.4 kJ/mol for SPC/E and -45.6 kJ/mol for TIP5P-E). TheSPC/E model promotes a very attractive interaction between adownward-pointing water hydrogen and a hydroxyl oxygenforming a donor hydrogen bond (Figure 5c). Two additionalacceptor hydrogen bonds are formed between the water oxygenand two surface hydroxyl hydrogens, giving a total of three.
TABLE 1: Binding Energies and Hydrogen-Bond Numbers for Single Water Molecules Obtained Using NVT Monte CarloSimulations at 10 Ka
surface type water-surface hydrogen bonds ⟨Uwater-surface⟩ (kJ/mol)
water model SPC/E TIP5P-E SPC/E TIP5P-E
Si surface 1 0 -21.64(0.03) -21.03(0.04)Al surface 3 1 -46.36(0.04) -45.64(0.02)unprotonated edge 1 1 -73.45(0.02) -71.42(0.03)protonated edge 2 2 -94.14(0.02) -78.51(0.04)
a The numbers in brackets represent one standard deviation.
7830 J. Phys. Chem. A, Vol. 113, No. 27, 2009 Croteau et al.

The number of hydrogen bonds and the structure shown inFigure 5c are in agreement with the DFT results reported byHu and Michaelides.28 The TIP5P-E model gives a somewhatdifferent structure, with the strongest attractive interactions againcoming through the lone pair charges. One lone pair forms anacceptor hydrogen bond with a hydroxyl hydrogen and interactsfavorably with neighboring underlying aluminum atoms. Thisgives a structure with the water hydrogens lying flat in the xyplane, as shown in Figure 5d. We note that, despite theorientational differences, both models give similar net bindingenergies. Also, the monolayer structures obtained at highertemperatures, which are clearly influenced by water-water aswell as water-surface interactions, are very similar (see Figure6d). Both low-temperature structures (Figure 5c and d) actuallyoccur in the monolayers obtained at 298 and 235 K, for bothwater models. However, we note that it is only for the TIP5P-Emodel that the water-surface interaction is attractive for bothconfigurations, likely explaining the slightly larger adsorptionrange observed for TIP5P-E.
For both edges, the low-energy water structures occur nearthe junction between the Si and Al surfaces (Figure 5e and f).For the unprotonated edge, a very favorable interaction is formedbetween the water oxygen (SPC/E) or lone pairs (TIP5P-E) anda hydroxyl hydrogen from the Al surface, thus forming anacceptor hydrogen bond with both models. Note that, althoughthere are a large number of bare oxygen atoms exposed on theunprotonated edge, no donor hydrogen bonds are observed.
For the protonated edge, the most attractive interactions areformed between the water hydrogens and hydroxyl and bridgingoxygens, leading to two donor hydrogen bonds for both models(Figure 5g and h). For both types of edge, the delocalization ofthe partial negative charge from the center of the water oxygennucleus (SPC/E) to the lone pair locations (TIP5P-E) hasminimal impact on the structures obtained. However, it doesgive a significant change in the binding energy on the protonatededge, increasing from -94.1 (SPC/E) to -78.5 kJ/mol (TIP5P-E), whereas the energies obtained for the unprotonated edgeare very similar. For the protonated edge, the difference isexplained by the fact that for the TIP5P-E model, the
water-surface interaction is more sensitive to the presence ofneighboring, non-hydrogen-bonding surface atoms.
C. Water Structure at Monolayer and SubmonolayerCoverage. Snapshots obtained for submonolayer coverage onboth edges and for monolayer coverage on the unprotonated
Figure 5. Snapshots of a water molecule at 10 K for the Si surface (a, b), Al surface (c, d), unprotonated edge (e, f), and protonated edge (g, h)using the SPC/E (a, c, e, g) and TIP5P-E (b, d, f, h) water models. The water oxygens are blue, lattice oxygens are red, hydrogens are white,aluminums are gray, silicons are brown, lone pairs are orange, and the surface atoms involved in hydrogen bonding with the water molecule areindicated in green.
Figure 6. Snapshots obtained at 235 K using the TIP5P-E model forlow water coverage on the unprotonated edge (a) and the protonatededge (b) and for monolayer coverage on the unprotonated edge (c) andthe Al surface (d). The water oxygens and hydrogens are blue and white,respectively.
Simulation of Water Adsorption on Kaolinite J. Phys. Chem. A, Vol. 113, No. 27, 2009 7831
edge and the Al surface are shown in Figure 6. These resultswere obtained for the TIP5P-E model at 235 K. Images obtainedfor the SPC/E model at 235 K, and for both models at 298 K,are very similar to those given in Figure 6 and hence are notshown. It is evident from Figure 6a and b that, at low coverage,water molecules adsorb on the edges at well-defined bindingsites and with particular orientations (as described above).
We note that for both edges and the Al surface, at monolayercoverage, the adsorbed water layer exhibits little order, and nolong-range patterns are discernible (Figure 6c and d). A detailedanalysis of the nature of the monolayer on the Al surface, andits possible relevance to ice nucleation under atmosphericconditions, was given in a previous communication.29 To brieflysummarize, although some hexagonal structures do form on theAl surface (Figure 6d), the relevant lattice parameter isconsiderably larger than that required to match ice Ih. Structurefactors calculated for the surface layer employing reciprocallattice vectors appropriate for hexagonal ice59,60 are close to 0.The expected strain on the ice embryo due to this mismatchwould depress the nucleation temperature to well below theatmospherically relevant range.29,61 Therefore, our results do notsupport the theory that kaolinite serves as a good ice nucleusbecause the crystallographic properties of kaolinite are such thatthe Al surface is particularly hospitable to water structures thatclosely match hexagonal ice.
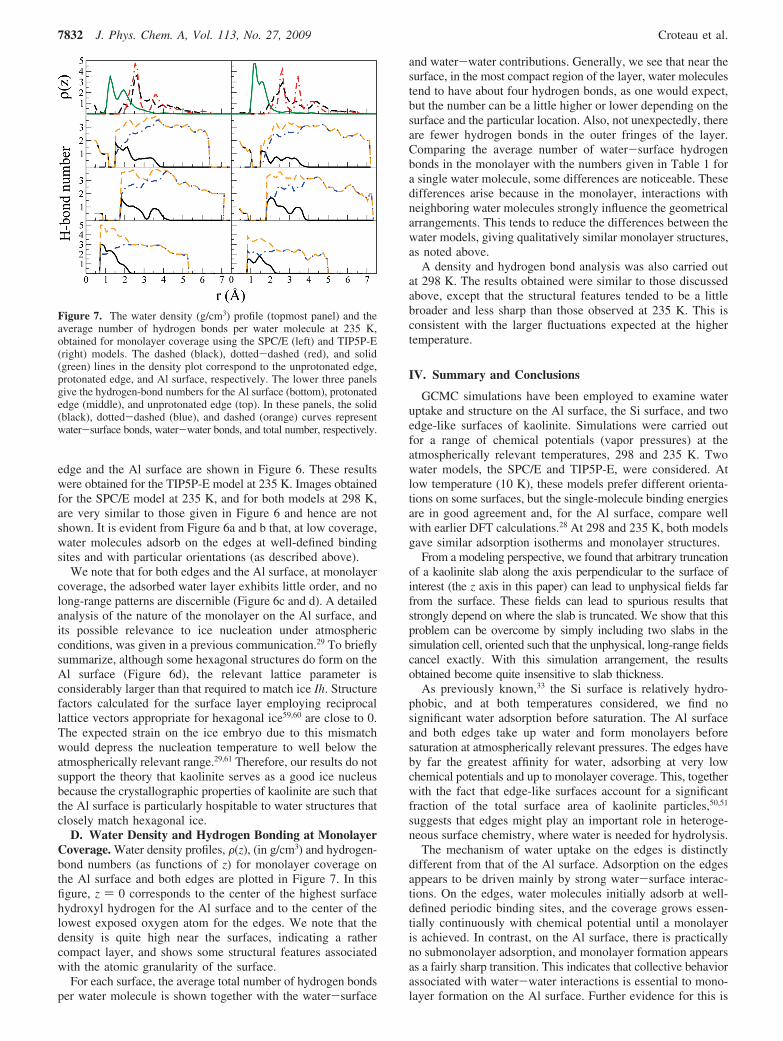
D. Water Density and Hydrogen Bonding at MonolayerCoverage. Water density profiles, F(z), (in g/cm3) and hydrogen-bond numbers (as functions of z) for monolayer coverage onthe Al surface and both edges are plotted in Figure 7. In thisfigure, z ) 0 corresponds to the center of the highest surfacehydroxyl hydrogen for the Al surface and to the center of thelowest exposed oxygen atom for the edges. We note that thedensity is quite high near the surfaces, indicating a rathercompact layer, and shows some structural features associatedwith the atomic granularity of the surface.
For each surface, the average total number of hydrogen bondsper water molecule is shown together with the water-surface
and water-water contributions. Generally, we see that near thesurface, in the most compact region of the layer, water moleculestend to have about four hydrogen bonds, as one would expect,but the number can be a little higher or lower depending on thesurface and the particular location. Also, not unexpectedly, thereare fewer hydrogen bonds in the outer fringes of the layer.Comparing the average number of water-surface hydrogenbonds in the monolayer with the numbers given in Table 1 fora single water molecule, some differences are noticeable. Thesedifferences arise because in the monolayer, interactions withneighboring water molecules strongly influence the geometricalarrangements. This tends to reduce the differences between thewater models, giving qualitatively similar monolayer structures,as noted above.
A density and hydrogen bond analysis was also carried outat 298 K. The results obtained were similar to those discussedabove, except that the structural features tended to be a littlebroader and less sharp than those observed at 235 K. This isconsistent with the larger fluctuations expected at the highertemperature.
IV. Summary and Conclusions
GCMC simulations have been employed to examine wateruptake and structure on the Al surface, the Si surface, and twoedge-like surfaces of kaolinite. Simulations were carried outfor a range of chemical potentials (vapor pressures) at theatmospherically relevant temperatures, 298 and 235 K. Twowater models, the SPC/E and TIP5P-E, were considered. Atlow temperature (10 K), these models prefer different orienta-tions on some surfaces, but the single-molecule binding energiesare in good agreement and, for the Al surface, compare wellwith earlier DFT calculations.28 At 298 and 235 K, both modelsgave similar adsorption isotherms and monolayer structures.
From a modeling perspective, we found that arbitrary truncationof a kaolinite slab along the axis perpendicular to the surface ofinterest (the z axis in this paper) can lead to unphysical fields farfrom the surface. These fields can lead to spurious results thatstrongly depend on where the slab is truncated. We show that thisproblem can be overcome by simply including two slabs in thesimulation cell, oriented such that the unphysical, long-range fieldscancel exactly. With this simulation arrangement, the resultsobtained become quite insensitive to slab thickness.
As previously known,33 the Si surface is relatively hydro-phobic, and at both temperatures considered, we find nosignificant water adsorption before saturation. The Al surfaceand both edges take up water and form monolayers beforesaturation at atmospherically relevant pressures. The edges haveby far the greatest affinity for water, adsorbing at very lowchemical potentials and up to monolayer coverage. This, togetherwith the fact that edge-like surfaces account for a significantfraction of the total surface area of kaolinite particles,50,51
suggests that edges might play an important role in heteroge-neous surface chemistry, where water is needed for hydrolysis.
The mechanism of water uptake on the edges is distinctlydifferent from that of the Al surface. Adsorption on the edgesappears to be driven mainly by strong water-surface interac-tions. On the edges, water molecules initially adsorb at well-defined periodic binding sites, and the coverage grows essen-tially continuously with chemical potential until a monolayeris achieved. In contrast, on the Al surface, there is practicallyno submonolayer adsorption, and monolayer formation appearsas a fairly sharp transition. This indicates that collective behaviorassociated with water-water interactions is essential to mono-layer formation on the Al surface. Further evidence for this is
Figure 7. The water density (g/cm3) profile (topmost panel) and theaverage number of hydrogen bonds per water molecule at 235 K,obtained for monolayer coverage using the SPC/E (left) and TIP5P-E(right) models. The dashed (black), dotted-dashed (red), and solid(green) lines in the density plot correspond to the unprotonated edge,protonated edge, and Al surface, respectively. The lower three panelsgive the hydrogen-bond numbers for the Al surface (bottom), protonatededge (middle), and unprotonated edge (top). In these panels, the solid(black), dotted-dashed (blue), and dashed (orange) curves representwater-surface bonds, water-water bonds, and total number, respectively.
7832 J. Phys. Chem. A, Vol. 113, No. 27, 2009 Croteau et al.
given by the large hysteresis observed on water desorption fromthe Al surface. Very little hysteresis is observed for the edges.
The monolayer structure on the Al surface and that on bothedges was analyzed through density and hydrogen-bond numberprofiles. The density profiles F(z) reached a maximum of 3-5g/cm3, depending on the surface, indicating that the monolayersare rather dense. In the dense regions of the monolayers, a watermolecule tends to form about four hydrogen bonds, some withthe surface and some with other water molecules of themonolayer. The details of the density and hydrogen-bondnumber profiles do show some variation with the water modelemployed, but overall, the monolayer structures are very similar.
Finally, we note that for all surfaces considered, at 298 K,we observe only monolayer coverage before saturation (bulkcondensation of the vapor). This contrasts with recent experi-mental results for kaolinite particles,41 where much highercoverages are reported for relative humidities well below 100%.Our simulations suggest that the experimental observationscannot be explained with atomistically smooth surfaces and thatsurface roughness likely plays a very important role in wateradsorption by kaolinite particles.
Acknowledgment. The financial support of the NaturalScience and Engineering Research Council of Canada and theCanadian Foundation for Climate and Atmospheric Science isgratefully acknowledged. This research has been enabled bythe use of WestGrid computing resources, which are funded inpart by the Canada Foundation for Innovation, Alberta Innova-tion and Science, BC Advanced Education, and the participatingresearch institutions. WestGrid equipment is provided by IBM,Hewlett-Packard, and SGI.
References and Notes
(1) Bauer, S. E.; Balkanski, Y.; Schulz, M.; Hauglustaine, D. A.;Dentener, F. J. Geophys. Res., Atmos. 2004, 109 (D2).
(2) Lunt, D. J.; Valdes, P. J. J. Geophys. Res., Atmos. 2002, 107 (D23).(3) Tegen, I.; Harrison, S. P.; Kohfeld, K.; Prentice, I. C.; Coe, M.;
Heimann, M. J. Geophys. Res.-Atm. 2002, 107 (D21).(4) Tegen, I.; Miller, R. J. Geophys. Res., Atmos. 1998, 103 (D20),
25975.(5) Woodward, S. J. Geophys. Res., Atmos. 2001, 106 (D16), 18155.(6) Glaccum, R. A.; Prospero, J. M. Mar. Geol. 1980, 37 (3-4), 295.(7) Cziczo, D. J.; Murphy, D. M.; Hudson, P. K.; Thomson, D. S. J.
Geophys. Res., Atmos. 2004 109 (D4).(8) DeMott, P. J.; Cziczo, D. J.; Prenni, A. J.; Murphy, D. M.;
Kreidenweis, S. M.; Thomson, D. S.; Borys, R.; Rogers, D. C. Proc. Natl.Acad. Sci. U.S.A. 2003, 100 (25), 14655.
(9) Eastwood, M. L.; Cremel, S.; Gehrke, C.; Girard, E.; Bertram, A. K.J. Geophys. Res., Atmos. 2008, 113.
(10) Dymarska, M.; Murray, B. J.; Sun, L.; Eastwood, M. L.; Knopf,D. A.; Bertram, A. K. J. Geophys. Res., Atmos. 2006, 111, D4.
(11) Zuberi, B.; Bertram, A. K.; Cassa, C. A.; Molina, L. T.; Molina,M. J. Geophys. Res. Lett. 2002, 29 (10).
(12) Twohy, C. H.; Kreidenweis, S. M.; Eidhammer, T.; Browell, E. V.;Heymsfield, A. J.; Bansemer, A. R.; Anderson, B. E.; Chen, G.; Ismail, S.;DeMott, P. J.; Van den Heever, S. C. Geophys. Res. Lett. 2009, 36.
(13) Twohy, C. H.; Poellot, M. R. Atmos. Chem. Phys. 2005, 5, 2289.(14) Forster, P.; Ramaswamy, V.; Artaxo, P.; Berntsen, T.; Betts, R.;
Fahey, D. W.; Haywood, J.; Lean, J.; Lowe, D. C.; Myhre, G.; Nganga, J.;Prinn, R.; Raga, G.; Schulz, M.; Dorland, R. V. Changes in AtmosphericConstituents and in Radiative Forcing. In Climate Change 2007: ThePhysical Science Basis, Contribution of Working Group I to the FourthAssessment Report of the Intergovernmental Panel on Climate Change;Solomon, S., Qin, D., Manning, M., Chen, Z., Marquis, M., Averyt, K. B.,Tignor, M., Miller, H. L., Eds.; Cambridge University Press: Cambridge,U.K., 2007, pp 129-234.
(15) Cantrell, W.; Heymsfield, A. J. Bull. Am. Meteor. Soc. 2005, 86(6), 795.
(16) Usher, C. R.; Michel, A. E.; Grassian, V. H. Chem. ReV. 2003,103 (12), 4883.
(17) Mogili, P. K.; Kleiber, P. D.; Young, M. A.; Grassian, V. H. Atmos.EnViron. 2006, 40 (38), 7401.
(18) Mashburn, C. D.; Frinak, E. K.; Tolbert, M. A. J. Geophys. Res.,Atmos. 2006, 111 (D15).
(19) Goodman, A. L.; Bernard, E. T.; Grassian, V. H. J. Phys. Chem. A2001, 105 (26), 6443.
(20) Krueger, B. J.; Ross, J. L.; Grassian, V. H. Langmuir 2005, 21(19), 8793.
(21) Hanisch, F.; Crowley, J. N. Phys. Chem. Chem. Phys. 2001, 3 (12),2474.
(22) Laskin, A.; Wietsma, T. W.; Krueger, B. J.; Grassian, V. H. J.Geophys. Res., Atmos. 2005, 110 (D10).
(23) Santschi, C.; Rossi, M. J. J. Phys. Chem. A 2006, 110 (21), 6789.(24) Tunega, D.; Gerzabek, M. H.; Lischka, H. J. Phys. Chem. B 2004,
108, 5930.(25) Tunega, D.; Benco, L.; Haberhauer, G.; Gerzabek, M. H.; Lischka,
H. J. Phys. Chem. B 2002, 106, 11515.(26) Tunega, D.; Haberhauer, G.; Gerzabek, M. H.; Lischka, H.
Langmuir 2002, 18, 139.(27) Hu, X. L.; Michaelides, A. Surf. Sci. 2007, 601, 5378.(28) Hu, X. L.; Michaelides, A. Surf. Sci. 2008, 602, 960.(29) Croteau, T.; Bertram, A. K.; Patey, G. N. J. Phys. Chem. A 2008,
12, 10708.(30) Pruppacher, H. R.; Klett, J. D. Microphysics of Clouds and
Precipitation, 2nd rev. ed.; Kluwer Academic: Dordrecht, The Netherlands,1997; pp 329-331.
(31) Warne, M. R.; Cosgrove, T. Phys. Chem. Chem. Phys. 2000, 2,3663.
(32) Vasconcelos, I. F.; Bunker, B. A.; Cygan, R. T. J. Phys. Chem. C2007, 111, 6753.
(33) Delville, A. J. Phys. Chem. 1995, 99, 2033.(34) Wassermann, B.; Reif, J.; Matthias, E. Phys. ReV. B 1994, 50, 2593.(35) Shevkunov, S. V. Colloidal J. 2005, 67, 497.(36) Shevkunov, S. V. Colloidal J. 2007, 69, 360.(37) Taylor, J. H.; Hale, B. N. Phys. ReV. B 1993, 47, 9732.(38) Cerda, J.; Michaelides, A.; Bocquet, M.-L.; Feibleman, P. J.; Mitsui,
T.; Rose, M.; Fomin, E.; Salmeron, M. Phys. ReV. Lett. 2004, 93, 116101–1.
(39) Michaelides, A.; Morgenstern, K. Nat. Mater. 2007, 6, 597.(40) Nutt, D. R.; Stone, A. J. Langmuir 2004, 20, 8720.(41) Schuttlefield, J. D.; Cox, D.; Grassian, V. H. J. Geophys. Res. 2007,
112, D21303.(42) Cygan, R. T.; Liang, J.-J.; Kalinichev, A. G. J. Phys. Chem. B 2004,
108, 108–1255.(43) Berendsen, H. J. C.; Postma, J. P. M.; van Gunsteren, W. F.;
Hermans, J. In Intermolecular Forces; Pullman, B., Ed.; Reidel: Dordrecht,The Netherlands, 1981; p 331.
(44) Bish, D. L. Clays Clay Miner. 1993, 41, 783.(45) Berendsen, H. J. C.; Grigera, J. R.; Straatsma, T. P. J. Phys. Chem.
1987, 91, 6269.(46) Lisal, M.; Nezbeda, I.; Smith, W. R. J. Phys. Chem. B 2004, 108,
7412.(47) Mahoney, M. W.; Jorgensen, W. L. J. Chem. Phys. 2000, 112, 8910.(48) van der Spoel, D.; van Maaren, P. J.; Berendsen, H. J. C. J. Chem.
Phys. 1998, 108, 10220.(49) Vega, C.; Sanz, E.; Abascal, J. L. J. Chem. Phys. 2005, 122, 114507.(50) Brady, P. V.; Cygan, R. T.; Nagy, K. L. J. Colloid Interface Sci.
1996, 183, 356.(51) Zbik, M.; Smart, R. S. C. Clays Clay Miner. 1998, 46 (2), 153.(52) Wang, Y.-S.; Siu, W.-K. Can. Geotech. J. 2006, 43, 587.(53) Shelley, J. C.; Patey, G. N. Mol. Phys. 1996, 88, 385.(54) Yeh, I.-C.; Berkowitz, M. L. J. Chem. Phys. 1999, 111, 3155.(55) Allen, M. P.; Tildesley, D. J. Computer Simulation of Liquids;
Oxford: New York, 1987.(56) Shelley, J. C.; Patey, G. N. J. Chem. Phys. 1995, 102, 7656.(57) (a) Luzar, A.; Chandler, D. Nature 1996, 53, 379. (b) Luzar, A.;
Chandler, D. Phys. ReV. Lett. 1996, 76, 928.(58) Luzar, A. J. Chem. Phys. 2000, 113, 10663.(59) Kittel, C. Introduction to Solid State Physics, 2nd ed.; Wiley &
Sons, Inc.: New York, 1953.(60) Kroes, G. J. Surf. Sci. 1992, 275, 365.(61) Turnbull, D.; Vonnegut, B. Ind. Eng. Chem. 1952, 44, 1292.
JP902453F
Simulation of Water Adsorption on Kaolinite J. Phys. Chem. A, Vol. 113, No. 27, 2009 7833


![NaCl and CaCl on kaolinite substrates · Contrary to the reports of Sheng [7], the adsorption tests with NaCl showed an inverse tendency: the higher salinity, the lower adsorption;](https://img.dokumen.tips/doc/110x75/5fc742d647290a12a65bd3c2/nacl-and-cacl-on-kaolinite-contrary-to-the-reports-of-sheng-7-the-adsorption.jpg)