Embed Size (px)
Citation preview

Clays and Clay Minerals, Vol. 49, No. 1.44-59, 2001.
THE RELATIONSHIPS BETWEEN KAOLINITE CRYSTAL PROPERTIES A N D THE ORIGIN OF MATERIALS FOR A BRAZILIAN KAOLIN DEPOSIT
ANGI~LICA E DRUMMOND C. VARAJ,~O, I ROBERT J. GILKES, 2 AND ROBERT D. HART 2
DEGEO/EM/UFOR Campus Morro do Cruzeiro, 35400-000 Ouro Preto, MG, Brazil 2 Soil Science and Plant Nutrition, Faculty of Agriculture, The University of Western Australia, Nedlands,
Western Australia 6907, Australia
Abst rac t The clay particles in a kaolin deposit from Brazil were investigated by X-ray diffraction (XRD), differential thermal analysis (DTA), analytical transmission electron microscopy (ATEM), and electron paramagnetic resonance (EPR) to examine the relationships between morphological and chemical properties of the crystals and to relate these properties to formation conditions. The XRD patterns show the dominant presence of kaolinite with minor amounts of gibbsite, illite, quartz, goethite, hematite, and anatase. ATEM observations show two discontinuities in the deposit as indicated by changes in mor- phology and size of the kaolinite crystals. At the base of the deposit, hexagonal platy and lath-shaped particles (mean area of 001 face = 0.26 p,m 2) maintain the original fabric of the parent rock which characterizes an in situ evolution. In the middle of the deposit a bimodal population of large (mean area of 001 face > 0.05 ixm:) and small (mean area of 001 face < 0.05 p.m 2) sub-hexagonal platy kaolinite crystals occurs. This zone defines the boundary between the saprolitic kaolinite and the pedogenic kao- linite. Near the top of the profile, laths and irregular plates of kaolinite, together with sub-hexagonal particles, define two different depositional sources in the history of formation of the deposit. Crystal thickness as derived from the width of basal reflections and the Hinckley index are compatible with the morphological results, but show only one discontinuity. At the base of the deposit, kaolinite has a low- defect density whereas in the middle and at the top of the profile, kaolinite has a high-defect density. Likewise, EPR spectroscopy shows typical spectra of low-defect kaolinite for the bottom of the deposit and typical spectra of high-defect kaolinite for the other portions of the deposit. Despite the morphological changes observed through the profile, the elemental composition of individual kaolinite crystals did not show systematic variations. These results are consistent with the deposit consisting of a transported pedogenic kaolinite over saprolite consisting of in situ kaolinized phyllite.
Key Words--ATEM, Defect, EPR, Formation Condition, Kaolinite, Morphology, Saprolite, Soil, XRD.
I N T R O D U C T I O N
Kaol in i te is an impor t an t wea the r ing product at low lat i tudes. It is a c o m m o n cons t i tuen t of saprol i tes and the mos t a b u n d a n t clay minera l in the over ly ing soils (Dixon, 1989). Kaol in i te can be fo rmed by in s i tu
chemica l evo lu t ion (weather ing) of the under ly ing rocks and f rom col luvia l mater ia ls der ived f rom highly wea the red lateri t ic profi les (Gilkes et al., 1973; Mul- cahy, 1973). Accord ing to the A I P E A Nomenc la tu re C o m m i t t e e Repor t ( G u g g e n h e i m et al., 1997), the t e rm kaol in m a y be e i ther a minera l group n a m e or a rock name. In the present work, kaol in i te is des igna ted as a mine ra l n a m e and kaol in is used only as a rock nanle .
Crys ta l s of kaol in i te in saprol i te and in kaol in de- posi ts are typica l ly large ( 1 - 2 Ixm) hexagona l plates (Dixon, 1989), a l though var ious shapes (Keller, 1978), such as laths and pseudo-hexagona l plates, m ay occur. In m a r k e d contrast , kaol in i te in topsoi l hor izons com- m o n l y cons is t s of smal l anhedra l platy to tubu la r par- t icles (S ingh and Gilkes , 1992a). Such var iabi l i ty in kaol in i te m o r p h o l o g y is c o m m o n and widespread in na tura l deposi ts . Similar ly, the defect densi ty and p robab ly chemica l compos i t i on of kaol in i te m ay differ a m o n g occur rences and this m a y inf luence the surface
chemica l and phys ica l proper t ies of clay mater ia l s (Robson and Gilkes, 1981; M c C r e a et al., 1990).
M a n y studies re la t ing the defect densi t ies in kaol in- ite to chemica l compos i t ion have been pe r fo rmed since the early work of Rober t son et al. (1954), and several t echniques us ing spect roscopic me thods were p roposed to inves t iga te defect concen t ra t ions (Jones et
al., 1974; Ange l et al., 1974; M e a d s and Malden , 1975; Herb i l lon et aL, 1976; M e s t d a g h e t aL, 1980; Br ind ley et al., 1986). These studies s h o w e d that bo th the con ten t and the locat ion of s t ructural i ron m a y in- vo lve re la t ionships wi th the defect densi t ies in kaol in- ites, a l though the m e c h a n i s m s respons ib le for these re- la t ionships are unknown . There is some unders t and ing of the geochemica l process tha t controls the compo- s i t ion of kaol in i te fo rmed dur ing wea ther ing (Mul le r e t al., 1995), bu t the great var iabi l i ty in i ron con ten t and m o r p h o l o g y of kaol in i te in soils (S ingh and Gil- kes, 1995; Har t et al., unpubl , data) raises ques t ions about the role of the i ron conten t of kaol in i te in af- fec t ing crys ta l propert ies . For example , does i ron in solut ion or as crys ta l l ine phases dur ing the fo rmat ion of kaol ini te affect crys ta l g rowth or is i ron acciden- tal ly incorpora ted into the kaol ini te so that the extent of incorpora t ion is af fected by crys ta l m o r p h o l o g y and not the reverse (Stone and Torres-Sanchez , 1988).
Copyright �9 2001, The Clay Minerals Society 44
Vol. 49, No. 1, 2001 Kaolinite crystal properties and the origin of materials 45
The present study focuses on the morphological and chemical features of kaolinite crystals from Brazil and the relationship to formation conditions in a low-tem- perature environment. The deposit, sampled from a drill core, was formed by the superposition of a col- luvial unit upon an in s i tu saprolitic unit (Varaj~o et
al., 1989, 1990, 2000). This study allows us to distin- guish the processes of formation of the kaolinite and is potentially useful for mineral exploration in highly weathered terrains and for interpreting geological his- tory.
Size and morphology of the kaolinite crystals were examined by high-resolution transmission electron mi- croscopy (HRTEM), and the elemental composition of single crystals was obtained by energy dispersive spectroscopy (EDS). Bulk chemical analyses, X-ray diffraction (XRD) patterns, and electron paramagnetic resonance spectroscopy (EPR) were used to determine the defect content and crystal chemistry of kaolinite.
LOCATION AND GEOLOGICAL SETTING
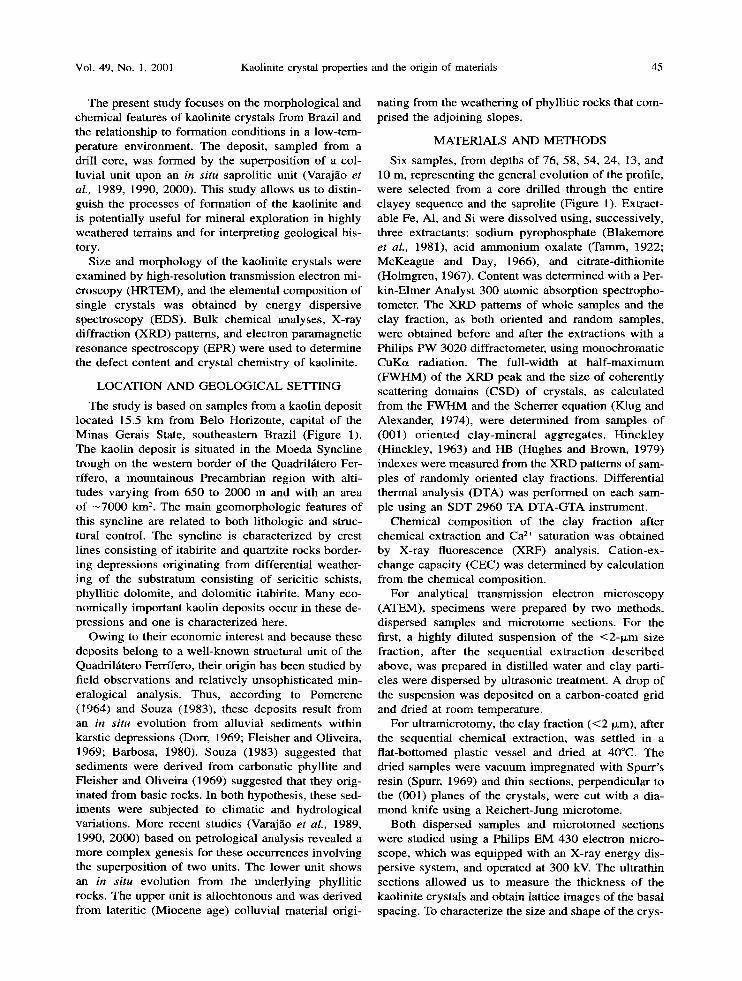
The study is based on samples from a kaolin deposit located 15.5 km from Belo Horizonte, capital of the Minas Gerais State, southeastern Brazil (Figure 1). The kaolin deposit is situated in the Moeda Syncline trough on the western border of the Quadril~tero Fer- rifero, a mountainous Precambrian region with alti- tudes varying from 650 to 2000 m and with an area of --7000 km 2. The main geomorphologic features of this syncline are related to both lithologic and struc- tural control. The syncline is characterized by crest lines consisting of itabirite and quartzite rocks border- ing depressions originating from differential weather- ing of the substratum consisting of sericitic schists, phyllitic dolomite, and dolomitic itabirite. Many eco- nomically important kaolin deposits occur in these de- pressions and one is characterized here.
Owing to their economic interest and because these deposits belong to a well-known structural unit of the Quadril~tero Ferrffero, their origin has been studied by field observations and relatively unsophisticated min- eralogical analysis. Thus, according to Pomerene (1964) and Souza (1983), these deposits result from an in s i tu evolution from alluvial sediments within karstic depressions (Dorr, 1969; Fleisher and Oliveira, 1969; Barbosa, 1980). Souza (1983) suggested that sediments were derived from carbonatic phyllite and Fleisher and Oliveira (1969) suggested that they orig- inated from basic rocks. In both hypothesis, these sed- iments were subjected to climatic and hydrological variations. More recent studies (Varaj~o et al., 1989, 1990, 2000) based on petrological analysis revealed a more complex genesis for these occurrences involving the superposition of two units. The lower unit shows an in s i tu evolution from the underlying phyllitic rocks. The upper unit is allochtonous and was derived from lateritic (Miocene age) colluvial material origi-
nating from the weathering of phyllitic rocks that com- prised the adjoining slopes.
MATERIALS AND METHODS
Six samples, from depths of 76, 58, 54, 24, 13, and 10 m, representing the general evolution of the profile, were selected from a core drilled through the entire clayey sequence and the saprolite (Figure 1). Extract- able Fe, AI, and Si were dissolved using, successively, three extractants: sodium pyrophosphate (Blakernore et al., 1981), acid ammonium oxalate (Tamm, 1922; McKeague and Day, 1966), and citrate-dithionite (Holmgren, 1967). Content was determined with a Per- kin-Elmer Analyst 300 atomic absorption spectropho- tometer. The XRD patterns of whole samples and the clay fraction, as both oriented and random samples, were obtained before and after the extractions with a Philips PW 3020 diffractometer, using monochromatic CuKet radiation. The full-width at half-maximum (FWHM) of the XRD peak and the size of coherently scattering domains (CSD) of crystals, as calculated from the FWHM and the Scherrer equation (Klug and Alexander, 1974), were determined from samples of (001) oriented clay-mineral aggregates. I-Iinckley (Hinckley, 1963) and HB (Hughes and Brown, 1979) indexes were measured from the XRD patterns of sam- pies of randomly oriented clay fractions. Differential thermal analysis (DTA) was performed on each sam- ple using an SDT 2960 TA DTA-GTA instrument.
Chemical composition of the clay fraction after chemical extraction and Ca 2+ saturation was obtained by X-ray fluorescence (XRF) analysis. Cation-ex- change capacity (CEC) was determined by calculation from the chemical composition.
For analytical transmission electron microscopy (ATEM), specimens were prepared by two methods, dispersed samples and microtome sections. For the first, a highly diluted suspension of the <2-1xm size fraction, after the sequential extraction described above, was prepared in distilled water and clay parti- cles were dispersed by ultrasonic treatment. A drop of the suspension was deposited on a carbon-coated grid and dried at room temperature.
For ultramicrotomy, the clay fraction (<2 p.m), after the sequential chemical extraction, was settled in a fiat-bottomed plastic vessel and dried at 40~ The dried samples were vacuum impregnated with Spurr's resin (Spurr, 1969) and thin sections, perpendicular to the (001) planes of the crystals, were cut with a dia- mond knife using a Reichert-Jung microtome.
Both dispersed samples and microtomed sections were studied using a Pbilips EM 430 electron micro- scope, which was equipped with an X-ray energy dis- persive system, and operated at 300 kV. The ultrathin sections allowed us to measure the thickness of the kaolinite crystals and obtain lattice images of the basal spacing. To characterize the size and shape of the crys-

46 Varajho, Gilkes, and Hart Clays and Clay Minerals
8 0 0 km
0-
Pedogenic Kaolin
Saprolitic Kaolin
S0 ~ 4 0 ~
) DE JANEIRO ILO
- "k.~,P"~ / / /
- - 1 2 ~
2 0 ~
f I BELO CAETE"
HORIZONTE ca o
�9 SABARA
@ Studied area
Q U A D R I L A T E R O F E R I ~ F E R O
ITAB1R/TO t3
OURO BRANCO
n
MARIANA o D
OURO PRETO
o SANTA BARBARA
20 km L _ _ J
Figure 1. Location of the study area and a schematic core, showing the boundary between the saprolitic and overlying pedogenic kaolin with the sample locations.
tals, micrographs were taken of the dispersed samples. The shape o f each crystal was copied using Adobe PhotoShop software. For each sample, > 1 0 0 crystals were obtained and the area- and shape-distribution functions were determined using N I H Image software, vers ion 6.0. To estimate the shape, we considered the
axial ratio (length/width) of the ell ipse ci rcumscribed around each particle and that is denominated in this paper as the shape ratio (Sr). An arbitrary value o f the length/width ratio of 2.0 was used to calculate the rel- ative proportion o f elongated and equant particles in each sample. To complement morphologica l data from

Vol. 49, No. 1, 2001 Kaolinite crystal properties and the origin of materials 47
7.t6 ./L 12000@
to.os ~ j 1o~ooo
-__JL
7 12
3.s7 .~ 4.8s A
17 22 27
20 (~
10
13
24
$4
58
76
32
Figure 2. X-ray diffraction patterns (CuKa radiation) of the oriented clay fraction after chemical treatment. From the bot- tom to the top (samples 76, 58, 54, 24, 13, 10), note that ~e basal reflections of kaolinite (001, 7.16 A and 002, 3.57 A) become less sharp and less intense owing to increasing de- fects and decreasing crystal size.
6000 4.85 .~, 10 2-~8A
[ 4.37 A 7.t6x [ l 3.57x 2.56x / 2.05X l.~x 1.49x
5000 ~ \ " ~ I I
13
400O
24
r~ s4
2000 ~ ~
1000 ' ~ - ~ - ~ ' " ~ 6 - = - - - ~ "
0 ~ r "
27 32 37 42 47 52 57 62
z0 (o)
Figure 3. X-ray diffraction patterns (CuKa radiation) of the randomly oriented clay fraction, after chemical treatment to remove iron oxides, showing the mineral distribution in the profile. From the bottom to the top (samples 76, 58, 54, 24, 13, 10), note the decreasing defects of kaolinite with depth marked by the improved resolution of reflections in the range 18-30 and 35-40 ~
? 12 17 22
TEM, the surface area of the <2-txm size fraction was measured using the N2-BET method (Aylmore et aL, 1970) on a Gemini 2375 V5.00 instrument.
To determine the elemental chemical composition of individual crystals for each dispersed sample, data from EDS for >100 single crystals were collected at 100 s, using a spot size of --10 nm. A tilt angle of 20 ~ towards the detector was used for all analyses. After background elimination, intensities were converted to analyses using k factors derived from the spectra of standard minerals (Jepson and Rowse, 1975; Lorimer, 1987).
The samples (clay fraction, <2 I~m), after chemical treatment, were examined also by EPR to investigate the nature and content of iron in the kaolinite. These data were compared to the morphological and XRD results (Hinckley and HB indexes). X-band EPR spec- tra were obtained using and ESP 300E (Brncker) spec- trometer with an ER41025T cavity. The magnetic field was calibrated using a ~H-NMR (nuclear magnetic res- onance) gaussmeter probe placed at the pole face of the magnet. The microwave modulation was 0.2 mW and spectra were obtained at 120 K from 50-mg sam- ples.
RESULTS AND DISCUSSION
X R D and DTA measurements
The XRD patterns of the unfractionated samples show the dominant presence of kaolinite with minor amounts of gibbsite, quartz, goethite, hematite, and an- atase. The iron oxides and gibbsite are concentrated in the upper part of the profile and the former was elim-
inated by the chemical extractions. The XRD patterns of the oriented clay fraction also show minor illite with a variable distribution throughout the profile (Figure 2).
Variations in the FWHM of basal reflections of ka- olinite for samples from the bottom (76 and 58 m) and higher are presented in Figure 2. For samples 76 and 58, the range of FWHM values of 0.21-0.26 ~ cor- responds to crystal thicknesses of 353-319 ,~. For samples 54, 24, 13, and 10, the range of FWHM val- ues of 0.36--0.44 ~ corresponds to crystal thickness values of 215-171 A, which is comparable in size to microcrystalline soil kaolinite described by Singh and Gilkes (1992a).
The Hinckley index (Hinckley, 1963), calculated from the random powder samples of the clay fraction (Figure 3) also showed systematic variations. For sam- ples 76 and 58, the high index values of 0.90 and 0.75 are characteristic of low- to medium-defect densities, respectively. This interpretation is supported by the presence of two sets of triplet peaks in the 35-40 ~ range which is a characteristic of low-defect kaolinite (Brindley, 1980, p. 146). For other samples, the ab- sence of discrete (110) with d = 4.36 A and (1 IT) with d = 4.18 A reflections, and the change of the triplet peaks to doublet peaks, characterizes the higher defect density of the kaolinite (Figure 3). As it is not possible to determine the Hinckley index for these high-defect kaolinites, the Hughes and Brown (I/B) index (Hughes and Brown, 1979) was calculated. The values of this index ranged from 3.0 to 5.0 (4.0 for sample 58, 5.0 for sample 54, 3.9 for sample 24, 3.2

48 Varaj~o, Gilkes, and Hart Clays and Clay Minerals
for sample 13, and 3.0 for sample 10) and are typical of soil kaot ini tes . For sample 76, a va lue of H B index of 26 is comparab le to values repor ted for re ference kaol ini tes (Hughes and Brown, 1979).
The X R D results are cons i s ten t wi th the D T A anal- yses (Figure 4) that show a peak tempera ture of kao- l inite dehydroxy la t ion of 530~ for sample 76, indi- ca t ing a low-defec t kaol in i te (Grim, 1968). F r o m sam- ples h igher in the deposit , dehydroxy la t ion tempera- tures are - 4 9 0 ~ which is ind ica t ive of a h igh-defec t concen t ra t ion and/or smal l crys ta l size. For sample 58, 490 and 540~ peaks occur, indica t ing the p resence of bo th forms of kaolinite.
<]
490 ~ 24
280 ~ \ / tl 54
500 ~ 76
0 ~ 460 660 ~ 1 ~ l~0 Temperature (oC)
Figure 4. Differential thermal analysis curves for the six samples. Note the variation of the kaolinite endotherm de- hydroxylation temperature between sample 76 (530~ and the other samples (--490~ and the double peak (540 and 490~ for sample 58, indicating the presence of two discrete kaolinite phase.
ATEM and image analysis
Typical m o r p h o l o g y and size of kaol ini te crys ta ls are shown in Figures 5 and 6, wh ich clear ly d e m o n - strate a sys temat ic t rend in c rys ta l morpho logy wi th dep th in the deposit . At the b o t t o m (sample 76), the crys ta ls are 1-0.5 Ixm, they occur as hexagona l plates, and have a narrow range in crysta l size. These hex- agonal crys ta ls are also present in sample 58 toge ther wi th m u c h smal ler crys ta ls (0 .1-0 .05 I~m). The smal l c rys ta ls b e c o m e the d o m i n a n t fo rm above 58 m. In samples 13 and 10, i r regular plates and laths are pre- sent toge ther wi th hexagona l plates. These qual i ta t ive obse rva t ions are conf i rmed by the results of quant i ta- t ive image analysis (Figures 7 and 8) as p resen ted in f requency h i s tograms for the basal area and shape ra- tio.
The basa l -a rea h i s tograms (Figure 7) are approxi- mate ly log normal for all samples. The basa l -a rea his- tog ram for sample 76 is roughly symmet r ic or nega- t ively skewed wi th a r ange of values be tween 0 . 0 4 7 6 - 0.8865 ixm 2 and a m e a n of 0 .2576 ixm 2 (s tandard de- v ia t ion = cr = 0.1567). For samples f rom 58 m and above, the h i s tograms are pos i t ive ly skewed towards larger values, but they nar row progress ive ly upwards by b e c o m i n g m u c h less skewed. The a s y m m e t r y is re la ted to the presence of large par t ic les wi th a basa l area of >0 .05 ixm 2. In cont ras t to sample 76, mos t part icles have basa l -a rea values o f < 0 . 0 5 ixm 2. The m e a n area decreases: 0 .0396 Ixm 2 (or = 0 .1567) for sample 58, 0.0481 txm 2 (~r = 0 .0584) for sample 54,
Figure 5. Electron micrographs showing the morphology of kaolinite crystals in the six samples studied. A = 76, B = 58, C = 54, D = 24, E = 13, and F = 10. Note the hexagonal plates ( - 1 Ixm) in sample 76; the smaller ( -0.1 I~m) hexagonal crystals in samples 58, 54, 24; the mixture of larger and smaller crystals in sample 58; and the presence of lath-shaped crystals in the shallower samples (13, 10). The scale represented in A (sample 76) is the same for all the other micrographs.
Figure 6. Morphology and size of the crystals in the six samples studied from TEM micrographs, crystal images were extracted using an image processing system from TEM photographs. A = 76, B = 58, C = 54, D = 24, E = 13, and F = 10. The grouping of large and small particles in B, C, and D is to demonstrate the presence of an almost bimodal population of larger and smaller particles. The scale represented in A (sample 76) is the same for all the other micrographs.
Figure 7. Histograms of particle basal areas. Note the largest particles in sample 76, the asymmetry of the histograms for samples 58-24, indicating mixing of two populations of kaolinites, and the highest concentration of small particles in samples 13 and 10.

Vol. 49, No. 1, 2001 Kaolinite crystal properties and the origin of materials 49

50 Varaj~o, Gilkes, and Hart Clays and Clay Minerals

Vol. 49, No. 1, 2001 Kaolinite crystal properties and the origin of materials 51
45
40
35
30
25
2 0
15
10
5
0
S A M P L E 76
I I I I I i
45
4 0 -
3 5 -
3 0 -
2 5 -
2 0 -
15
1 0 -
0 ! I
S A M P L E 58
I i I f f l
I I
~ r
30 S A M P L E 54
25
20
15
1 0
I !
25
2 0 -
15--
10--
-3.5 -3 -2.5 -2 -1.5 -1 -0.5 0 0.5 1
30
25
20
15
10 �84
5 -
25
2 0 -
15
10
J I
S A M P L E 24
i i I I I
S A M P L E 1 0
0 i" I i " l J i I .3.5 -3 -2.5 -2 -1.5 -1 -0.5 0 0.5
Log Basal Area (~tm 2)

52 Varajho, Gilkes, and Hart Clays and Clay Minerals
Z ~a
30 -] 30 - 98 % 2 %
25 1 25 - 93% 7% S A M P L E 76 S A M P L E 58
"~0 20 -
15 15 -
1 0 10 -
.11 n I I I I I I I I I I I
30 t 98% 2%
25 S A M P L E 54
20
15
10
3 0 -
25 -
20 -
15 -
10-
5 -
98% 2% SAMPLE 24
0 I I ! I I I I I I i I i I
3 0 -
2 5 -
20
15 �84
10
86% 14% SAMPLE 13
D,.,[11 n . n ~,, I I ] I I I I I I I I I ~ I I
3 0 -
2 5 -
2 0 -
1 5 -
1 0 -
94%
5 -
O ' k " l i i i
6%
SAMPLE 10
I I I I I I I I I
S H A P E R A T I O (L/W)

Vol. 49, No. 1, 2001 Kaolinite crystal properties and the origin of materials 53
0.0178 Ixm 2 (tr = 0.0166) for sample 24, 0.0072 la,m 2 (~r = 0.0061) for sample 13, and 0.0087 I~m 2 (tr = 0.0091) for sample 10, indicating that the number of large particles decreases. The wide variation of crystal size so evident in samples 58, 54, and 24, because some larger crystals are present, still persists in the upper samples as confirmed by the high standard de- viation. On the other hand, for sample 76, the standard deviation is --50% of the mean, which indicates a pop- ulation of particles with a more uniform area.
The shape-ratio (Sr = L/W, length/width) histo- grams (Figure 8) are asymmetric because of the pres- ence of elongated particles. The Sr values shift to larg- er values (Figure 8). To calculate the proportion of lath-shaped and equant (hexagonal or sub-hexagonal) particles, an arbitrary value of Sr = 2.0 was taken as the limit between the two shapes; Sr > 2.0 identifies a lath and Sr < 2.0 identifies an equant crystal. The proportion of lath particles is higher in the samples from the top of the profile, samples 13 and 10, than in samples 24, 54, and 58 (Figure 8). Whereas hex- agonal and sub-hexagonal plates are the most common morphological feature of kaolinite crystals (Dixon, 1989), laths are also of widespread occurrence. Both are typical morphologies of pseudomorphous kaolinite occurring in weathering profiles developed by in situ evolution. Laths are described by Singh and Gilkes (1992b) as a common morphological feature of kao- linite pseudomorphs after mica. These authors describe bundles of laths originating from a parallel fracturing of a larger plate at regular intervals. These parallel kaolinite laths may be an early stage of formation of halloysite tubes by rolling or folding (Brindley and Comer, 1956; Singh and Gilkes, 1992b). In the present work, we did not observe this last stage either because it requires an appropriate environment or because the laths are unrolled tubes. The quite high frequency (7%) of elongated particles in sample 76 appears to be a typical morphological feature of kaolinitic pseudo- morphs after mica in the saprolite. Similarly, the high frequency of elongated particles in the upper samples (samples 13 and 10) compared to the underlying sam- ples (24, 54, and 58) is evidence of a discontinuity in the profile and indicates that the upper samples are a mixture of saprolitic kaolinite crystals and soil kaolin- ite crystals.
Observations of the extent of uniform lattice fringes of kaolinite aggregates sectioned perpendicular to the basal plane show differences in crystal thicknesses be- tween samples from the saprolite (76 m) and other samples, from 58 m and upwards (Figure 9A and 9B). Defects in layer stacking are observed in all samples
and variations in the basal spacing with occasional 10- ,~ spacing are also present (Figure 9C). These varia- tions are common in natural kaolinite and are de- scribed as occasional interlayers of mica or smectite (Dixon, 1989). Ma and Eggleton (1999) indicated that kaolinite crystals containing 10-,~ layers are found in kaolinites of diverse origins and that defects, such as layer dislocation, lateral layer terminations, and cross fringes (Figure 9C and 9D), are common defects with- in both primary and secondary kaolinite particles. However, in the present work, deformations of the lay- ers (Figure 9D) were observed only in the samples from 58 m and upwards. According to Ma and Eggle- ton (1999), this kind of defect is particularly common in transported kaolinites, which is consistent with the allochtonous origin of the samples from 58 m and up- wards.
Elemental compositions obtained by EDS indicated the presence of only A1 and Si in the kaolinite crystals. Despite the presence of minor amounts of discrete il- lite and interlayers of illite in kaolinite (Figure 9C), the K content was always below the limit of detection, as were Fe and Ti contents. This lack of detection of K may also be partly related to K diffusion from the analyzed region owing to beam damage. Robertson and Eggleton (1991) reported that the replacement of K by H20 in the transformation of dioctahedrai phyl- losilicates may render mica less stable. In addition, Ma and Eggleton (1999) reported that beam damage may be concentrated at structural defects or local hetero- geneities in composition or structure. Lens-shape zones within the mica lattice were reported by Peacor (1992) as being caused by K diffusion. We have found the same feature within kaolinite, which might also be related to K diffusion from mica inclusions caused by the electron beam.
Figure 10 shows frequency histograms for the Si:AI atom ratio for single crystals in the six samples. The average Si:A1 ratio ranges from 0.96 to 1.01 which is close to the theoretical ratio of 1.00 in kaolinite. Sta- tistical analyses of these data indicate that the Si:A1 ratio was not significantly different among samples and was not significantly different from 1.00, the ideal value. Much of the variation in Si:A1 ratio in Figure 10 may be related to random counting errors and thus not reflect actual differences in composition. Varia- tions in the Si:A1 atom ratio are commonly associated with isomorphous replacements of A1 by Fe (Jepson and Rowse, 1975) and may be reflected in trends in crystal morphology. However, this was not the case here because no Fe was detected by EDS in the kao- linite crystals (i.e., <0.2%). As discussed below, EPR
4--
Figure 8. Histograms of shape ratio (Sr = L/W, length/width). L/W ratio of 2.0 was taken as the boundary between elongated (Sr > 2.0) and equant (Sr < 2.0) particles.

54 Varajfio, Gilkes, and Hart Clays and Clay Minerals
Figure 9. Transmission electron micrographs of microtome sections across the stacks of basally oriented kaolinite particles. A) and B) Low-magnification image showing a side view of plates of kaolinite; note the difference in crystal thickness between sample 76 (A), -0.03-0.05 Ixm, and sample 54 (B), --0.01~).02 txm. C) and D) are representative images of sample 54 showing the basal lattice fringes with abundant defects marked by arrows. C) Basal spacing of 10-7 A. D) Lateral layer termination and deformation or bending of several layers.
data indicate that all samples contain minor amounts of iron. Appreciable variations in the composition of individual crystals of kaolinite from soils from south- western Australia and Georgia kaolin were also de- scribed by Singh and Gilkes (1995). Variability in the silica and alumina composition may be useful to dis- criminate between separate types of kaolinite; Reyn- olds (1991) found discrete types of kaolinite from dif- ferent sources based on silica and alumina contents and Hinckley index values. These variations in com- position may be related to petrogenic parameters that may have existed at the time of crystallization. How- ever, in this present work, the near constant value of Si:AI of --1.00 and the similar range of variation in composition for each sample of the clayey sequence studied does not suggest contributions from quite dif- ferent kaolinitic parent materials.
Chemical composition o f the clay fraction
The chemical composition of the clay fraction, de- termined by XRF after chemical extraction and Ca 2§ saturation, is presented in Table 1. The Si:AI atom ra- tios of 1.01, 1.02, 1.00, and 1.02 for samples 76, 58, 54, and 24, respectively, are not significantly different from those obtained from EDS (Figure 10) and from the theoretical ratio of 1:00 for kaolinite. However, Si: A1 atom ratios of 1.75 and 1.14, for samples 10 and 13, respectively, reflect the presence of gibbsite as shown in the XRD patterns (Figure 3). Gibbsite in the
clay fraction is --29 and --8% for samples 10 and 13, respectively. The T i t2 content indicates the boundary between the saprolite (sample 76) and samples from 58 m and above. The latter samples with higher Ti t2 contents indicate their residual character.
The appreciable K20 content in samples 54 and 24 reflect the presence of illite, as indicated also in the XRD patterns. This variable illite distribution in the column is consistent with the allochtonous origin of samples from 58 m and upwards and the variable con- tribution of illitic sediment.
CEC values are low as is consistent with kaolinitic clay and these values also indicate differences in the nature of the samples. At the bottom, in the saprolite (sample 76), which is characterized by hexagonal par- ticles, the value of CEC of 1.78 cmol/kg is similar to values for low-defect kaolinite in pallid-zone clay and standard kaolinites (Singh and Gilkes, 1992a). For oth- er samples, values range from 3.21 to 4.27 cmol/kg, which are typical of soil kaolinite of pedogenic origin (Singh and Gilkes, 1992a). The presence of small amounts of illite may be responsible for the higher value of 6.42 cmol/kg obtained for sample 54. This value is based on a K20 content of 6% in soil illite, which represents - 1 2 % illite in this clay. Soil illite has a CEC of --30 cmol/kg, and therefore 12% illite in the clay soil contributes to --3.6 cmol/kg of CEC to the clay fraction (Norrish and Pickering, 1983).

Vol. 49, No. 1, 2001 Kaolinite crystal properties and the origin o f materials 55
Z
45-
40-
35
30
25-
20-
15-
10-
:::: S a m p l e 7 6 :::: M e a n = 0 . 9 7 :i:i
:::: i:::: . : , : I . : . : : , : . , : . : ,
0 I I ~:':1 I I I I
45
40-
35-
30-
25-
S a m p l e 5 4 M e a n = 0 . 9 7 s d = 0 . 0 9
20-
15-
10-
5
0 I I I I I I I !
4 5 -
40-
35-
30 - ::::--.' 25 - ~ ::i:i.. ,,.-, ,-..
o i ilil i - !iiii 5-
0 I I I
S a m p l e 13 M e a n = 0 . 9 6 s d = 0 . 0 9
I I ~ I
4 5 -
40
35
30-
25-
20-
15
10
5-
0
45-
40-
35-
30-
25-
20-
15
10
5
S a m p l e 5 8 M e a n = 0 . 9 8 s d = 0 .11
i i
;::::
!!i!i I
I I I I I I I
S a m p l e 2 4 M e a n = 0 . 9 7 s d = 0 . 0 9
::::,
I I I I I I I I
r r r r ,.; , ; , ;
4 5 -
4 0 - S a m p l e 10
3 5 - M e a n = 1 . 0 1
3 0 - a d = 0 . 1 4
25
20 ~
15
10
5 : , ' . ' l . ' . ' . |
0 I I ; I I I I !
Si/Al ATOM RATIO Figure 10. Histograms of a tom ratio Si/A1 for individual kaolinite crystals plotted against analysis number; sd = standard deviation.

56 Varajfio, Gilkes, and Hart Clays and Clay Minerals
Table i. Chemical composition (%) and CEC (cmol/kg) of the clay fraction after chemical extractions and Ca 2§ satura- tion.
Samples
Analysis i 0 13 24 54 58 76
SiO2 30.40 40.00 43.20 43.80 44.00 45.20 AleO 3 45.30 38.70 37.50 37.30 38.50 38.90 FezO3 0.97 1.82 0.85 0.80 0.58 0.39 CaO 0.07 0.12 0.12 0.18 0.09 0.05 MgO 0.03 0.05 0.08 0.13 0.04 0.03 Na20 0.04 0.06 0.08 0.10 0.06 <0.01 KzO 0.05 0.21 0.34 0.70 0.18 0.03 TiO z 1.96 1.93 2.25 1.64 1.11 0.50 H:O (105~ 0.91 1.15 1.01 1.71 1.06 0.59 LOI 21.20 17.20 15.60 15.30 15.50 15.00 CEC 2.49 4.27 4.26 6.42 3.21 1.78
Surface area
The values of N2-BET surface area and the calcu- lated surface area based on crystal size as der ived f rom the Scherrer method are represented in Figure 11. Thickness data obtained f rom the Scherrer method are consistent with observat ions f rom micro tome sections in the T E M (Figure 9A and 9B). There is good agree- ment also with values o f surface area obtained by BET and Scherrer methods and the plotted data lie close to the line of unit slope. The calculated surface areas, based on the Scherrer equation are higher in value be- cause some particles are compound, i.e., twin-like (Figure 9A and 9B). Thus, the entire surface o f the sub-crystals was not accessible for N2 adsorption. Sample 76 has a surface area f rom B E T o f - -10 m2/g and a calculated area o f - -20 m2/g, which is consistent with its large crystal size and presence of many com- pound crystals. These values are comparable with those for other standard kaolinites (Dixon, 1989). The value for sample 58 is intermediate be tween the value for sample 76 and the higher values for samples dom- inated by pedogenic kaolinite (samples 54, 24, 13, and 10). Soil kaolinites commonly have surface areas o f --35 m2/g (Singh and Gilkes, 1992a). The anomalous value of sample 10 may be related to the high content o f gibbsite with crystal-size values greater ( - 4 8 0 ,~) than the kaolinite crystals present in the soil samples ( ~ 2 0 0 ,~), as indicated f rom the Scherrer equation.
Electron paramagnet ic resonance spectroscopy (EPR)
The first-derivative EPR spectra is characterized by the g value, i.e., the spectroscopic splitting factor (Clozel et al., 1994). The g value is an informative parameter, because unpaired electrons in different en- vironments have slightly different g factors, resulting in the appearance of characteristic signals for different centers at different magnet ic field strengths. The first- der ivat ive EPR spectra o f kaolinite usually consist o f two regions, low-field resonances with g = 3.5-4.9,
50
45
40
3'3
30
25
20
15
"-~ L i n e o f s l o p e = 1 / /
/ I"11:] 2454
/ 13 / O
/ 10 �9 ~ /121
/ 58 / .< /
10 n / 76
5 / /
0 t / I I I I I I I I ! I
SURFACE AREA: SCHERRER (m 2 /g)
Figure 11. Diagram showing the values of N2-BET surface area plotted against the values of calculated surface area based on crystal size using Scherrer method.
which are associated with Fe 3§ substituting for A13+, and high-field resonances with g = 2.0, which are as- sociated with 'A' type radiat ion-induced defects (R/D) (Clozel et aL, 1994). In some kaolins, particularly soil kaolins with appreciable iron contents, a ve ry broad resonance extending f rom g -= 3.5 to g ~ 1.5 (de- scribed also as a broad g = 2 peak) occurs. The low- field resonances have been interpreted as the sum of two spectra, F%) and Fe~l~). The F%~ spectrum (g = 4.3) is associated with stacking disorder and is usually well developed in high-defect and highly iron-substi- tuted kaolinite f rom soils (Mestdagh et aL, 1980). The Fen) signal in high-defect kaolinites has recently been associated with dickite C layers (Balan et al., 1999). The F%I) spectrum (g = 3.5, 3.7, 4.9, and 9.2) is a consequence of Fe 3§ for A13§ substitution in low-defect kaolinites. The Q-band spectrum of low-defect kaolin- ite shows additional resolution of the Fe~u) spectrum for iron. The spectrum is resolved into discrete bands for the two unique octahedral positions in the triclinic unit cell (Gaite et al., 1993).
The first-derivative EPR spectra for the clay frac- tions of six samples are shown in Figure 12. Samples 54, 24, 13, and 10 show spectra typical o f high-defect kaolinite with the g ~ 4.3 peak f rom the F%) spectrum dominant in the low-field resonances. Parts of the F%I) spectrum are also observable for these samples, g ~- 9.2 is present but is broad and g -~ 4.9 is distinguish- able as a small shoulder on the main g ~ 4.3 peak. Sample 76 has a spectrum that is typical of low-defect kaolinite. The peaks at g -~ 4.9, 3.7, and 3.5 are more prominent; although this resolution is partly related to a reduction in the intensity and width o f the g = 4.3

Vol. 49, No. 1, 2001
i 4.3
Kaolinite crystal properties and the origin of materials 57
2.01 2.05
l0
Table 2. Relative concentration of radiation induced defects (RID) and concentration of elements that are potential sources of radiation gamma in whole samples.
RID Sample Rel. conc. %Fe~O3 K (ppm) U (ppm) Th (ppm) Pb (ppm)
10 40 6.02 210 4 41 29 13 41 13.69 424 2.80 24 29 24 29 3.29 895 3.9 34 44 54 136 3.83 1083 3.6 28 44 58 34 Ln.d. n.d. n.d. n.d. n.d. 76 45 4.10 59 1.1 10 62
13 n.d.: not determined.
24
4.9
2.01
g - F a c t o r
~ 5 4
76
Figure 12. First derivative, X-band EPR spectra of the six samples. Note the typical spectrum of low-defect kaolinite in sample 76 characterized by the prominent peaks at g ~- 4.9, 3.7, and 3.5 and by the sharp peak at g ~ 9.2. Note spectra typical of high-defect kaolinite for samples 54, 24, 13, and 10 with the main signal at g ~ 4.3. Sample 58 shows peaks at g ~ 4.3 and g ~ 4.9, 3.7, and 3.5 indicating the presence of a mixture of low- and high-defect kaolinites.
peak. The g ~- 9.2 peak is sharper, wh ich is cons i s ten t wi th the low-defec t charac te r of this sample (Gai te et aL, 1997). Sample 58 is s imi lar bu t has a s t ronger g ~- 4.3 s ignal wh ich is cons i s ten t wi th the p resence o f a mix ture of smal le r par t ic les o f h igh-defec t kaol in i te and larger part icles of low-defec t kaolinite.
All samples display s ignals f rom " A " type RID cen- ters at g -~ 2.0, w h i c h occur in m a n y kaol ins and were ass igned to a S i -O- center (Clozel et al., 1994). H o w - ever, no t all kaol ins display RID, for example soil ka- ol ins f rom re la t ively young red soils in Indones i a and wi th re la t ively shor t exposure to cosmic and mine ra l rad ia t ion sources do not d isplay RID (Hart et al., un- publ. data). Mul l e r and Calas (1989) demons t r a t ed the poss ib i l i ty of de t e rmin ing the re la t ive concen t ra t ions of s table defec t centers i f all o ther exper imen ta l pa- r amete r s ( sample mass , sample packing , p l a c e m e n t o f sample in cavity, m i c r o w a v e modu la t ion and power, etc .) are constant . The re la t ive in tensi t ies o f the RID in the E P R spectra are g iven in Table 2 toge ther wi th analyses of the concen t ra t ions o f sources of na tura l -/- rad ia t ion in the whole sample ; K, U, Th, Pb. The i ron- oxide concen t ra t ion is also g iven as Mul l e r and Calas (1989) found a re la t ionship sugges t ing that i ron oxy- hydrox ides m a y absorb and re ta in the ~/-emitting ele- men t s U and Th in close p rox imi ty to the kaol in dur ing the ear ly s tages o f weather ing . The in tens i ty of the RID signals does not change s ignif icant ly b e t w e e n samples excep t for sample 54, w h i c h has a va lue ap- p rox imate ly four t imes greater than those o f the o ther samples . There does not appear to be a re la t ionship be tween RID and any o f the o ther var iab les ident i f ied b y Mul l e r and Calas (1989). Perhaps these d i f ferences are re la ted to di f ferent exposures to cosmic rays or d i f ferent exposures to regol i th i sotopes w h i c h have n o w b e e n part ly changed.
C O N C L U S I O N
The resul ts ob ta ined f rom this s tudy clear ly show that the deposi t consis ts o f a d o m i n a n t pedogen ic ka- olin, o f col luvia l or igin, ove r a saprol i t ic kao l in wi th a m i x e d in te r face at ~ 5 8 m tha t charac te r izes the b o u n d a r y wi th the saprol i te ( sample 76). The saprol i te is ma in ly represen ted by the p resence of large (1 -0 .5 p,m) platy part icles wh ich are also present to a m i n o r ex tent in the over ly ing t ranspor ted cover ( sample at 54 m and upwards) . In this cover, var ia t ions in shape and size o f kaol in i te part icles define two discre te sources tha t have cont r ibu ted to the kaol in deposit .

58 Varajfio, Gilkes, and Hart Clays and Clay Minerals
The chemical , XRD, DTA, BET, ATEM, and EPR data each define a discontinui ty be tween the saprolite (sample 76) and the overlying cover of t ransported overburden (sample at 58 m and upwards) . The clear- est definit ion of the two types of kaolinite was provid- ed by image analysis o f TEM images. Despi te mor- phological changes of kaolinite crystals throughout the profile and their dist inctly different origins, the ele- mental compos i t ion of single crystals did not change.
Phys ica l pa r ame te r s of kaol in i te c rys ta l s were shown to be the best way to differentiate variations in the kaolin deposi t and to provide a basis for interpre- tations of temporal relat ionships. The he terogenous as- sociat ion in size and morpho logy of the kaolinite crys- tals, in the middle and upper part o f the profile, may reflect cl imatic changes after the Miocene, which is the age of format ion of the lateritic material in stable soils on the adjoining slopes. During the Pliocene, un- der arid condit ions, erosion became widespread and generated sediments consis t ing of a mixture of lateritic pedogenic kaolinite and saprolitic kaolinite.
A C K N O W L E D G M E N T S
The authors thank FAPEMIG, CAPES, and CNPq for fi- nancial support, and the Mineraqres Brasileiras Reunidas S.A. (MBR) for providing samples and other data. We are grateful to the staff of the Centre for Microscopy and Micro- analysis (CMM) at UWA, particularly A. Johnson and J. Mur- phy, for their assistance. We gratefully acknowledge the as- sistance of A. McKinley with the EPR analysis.
R E F E R E N C E S
Angel, B.R., Jones, LEE., and Hall, EL. (1974) Electron spin resonance studies of doped synthetic kaolinite. I. Clay Min- erals, 10, 247-255.
Aylmore, L.A.G., Sills, I.D., and Quirk, J.R (1970) Surface area of homoionic illite and montmorillonite clay minerals as measured by sorption of nitrogen and carbon dioxide. Clays and Clay Minerals, 18, 91-96.
Balan, E., Allard, T., Boizot, B., Morin, G., and Muller, J.-R (1999) Structural Fe 3' in natural kaolinites: New insights from electron paramagnetic resonance spectra fitting at X and Q-band frequences. Clays and Clay Minerals, 47, 605- 616.
Barbosa, G.V. (1980) Superficies de erosgo no Quadrilfitero Ferrffero, Minas Gerais. Revista Brasileira de Geocigncias. 10, 89 101.
Blakemore, L.C., Searle, EL., and Daly, B.K. (1981) A. Methods for chemical analysis of soils. New Zealand Soil Bureau Scientific Report, IOA, DSIRO, New Zealand.
Brindley, G.W. (1980) Order-disorder in clay mineral struc- tures. In Crystal Structures o f Clay Minerals and Their Identification, G.W. Brindley and G. Brown, eds., Miner- alogical Society, London, 125-195.
Brindley, G.W. and Comer, J.J. (1956) Structure and mor- phology of a kaolin clay from Les Eyzies (France). Clays and Clay Minerals, 4, 61-66.
Brindley, G.W., Kao, C-C., Harrison, J.L., Lipsicas, M., and Rayathatha, R. (1986) Relation between structural disorder and other characteristics of kaolinites and dickites. Clays and Clay Minerals, 34, 239-249.
Clozel, B., Allard, T., and Muller, J.R (1994) Nature and sta- bility of radiation-induced defects in natural kaolinites:
New results and a reappraisal of published works. Clays and Clay Minerals, 42, 657-666.
Dixon, J.B. (1989) Kaolinite and serpentine group minerals. In Minerals in Soils Environments. 2nd edition. J.B. Dixon and S.B. Weed, eds., Soil Science Society of America, Madison, Wisconsin, 357-403.
DolT, J.V.N. (1969) Physiographic, Stratigraphic and Struc- tural Development o f the Quadrilrtero Ferr(fero, Minas Gerais, Brazil. U.S. Geological Survey Professional Paper 641C, Washington, D.C., 1-58.
Fleisher, R. and Oliveira, V.P (1969) Bauxitas do Quadril~i- tero Ferrifero. Minera~'~o e Metalurgia, 50, 25-32.
Gaite, J.-M., Ermakoff, P., and Muller, J.-P (1993) Charac- terization and origin of two Fe 3+ spectra in kaolinite. Phys- ics and Chemistry of Minerals, 20, 242-247.
Gaite, J.-M., Ermakoff, P., Allard, TH., and Muller, J.-P. (1997) Paramagnetic Fe3+: A sensitive probe for disorder kaolinite. Clays and Clay Minerals, 45, 496-505.
Gilkes, R.J., Scholz, G., and Dimmock, G.M. (1973) Lateritic deep weathering of granite. Journal of Soil Science, 24, 523-536.
Grim, R.E. (1968) Clay Mineralogy, 2nd edition. McGraw- Hill, New York, 596 pp.
Guggenheim, S., Alietti, A., Drits, V.A., Formoso, M.L.L., Galfin, E., Krster, H.M., Paquet, H., Watanabe, T., Bain, D.C., and Hudnall, W.H. (1997) Report of the Association Internationale pour L'rtude des Argiles (AIPEA) Nomen- clature Committee for 1996. Clays and Clay Minerals, 45, 298 300.
Herbillon, A.J., Mestdagh, M.M., Vielvoye, L., and Derou- ane, E.G. (1976) Iron in kaolinite with special reference to kaolinite from tropical soils. Clay Minerals, 11, 201-220.
Hinckley, D.N. (1963) Variability in "crystallinity" values among the kaolin deposit of the coastal plain of Georgia and South Carolina. Clays and Clay Minerals, 11, 229-- 235.
Holmgren, G.G.S. (1967) A rapid citrate-dithionite extract- able iron procedure. Soil Science Society of America Pro- ceedings, 31, 210-211.
Hughes, J.C. and Brown, G. (1979) A crystallinity index for soil kaolins and its relation to parent rock, climate and soil maturity. Journal o f Soil Science, 30, 557-563.
Jepson, W.B. and Rowse, J.B. (1975) The composition of kaolinite--An electron microscope microprobe study. Clays and Clay Minerals, 23, 310-317.
Jones, J.RE., Angel, B.R., and Hall, EL. (1974) Electron spin resonance studies of doped synthetic kaolinite, lI. Clay Minerals, 10, 257-270.
Keller, W.D. (1978) Classification of kaolins exemplified by their textures in scan electron micrographs. Clays and Clay Minerals, 26, 1-20.
Klug, H.R and Alexander, L.E. (1974) X-ray Diffraction Pro- cedures ,['or Polycrystalline and Amorphous Materials, 2nd edition. John Wiley and Sons Inc., New York, 966 pp.
Lorimer, G.W. (1987) Quantitative X-ray microanalysis of thin specimens in the transmission electron microscope; A review. Mineralogical Magazine, 51, 49-60.
Ma, C. and Eggleton, R.A. (1999) Surface layer types of ka- olinite: A high resolution transmission electron microscope study. Clays and Clay Minerals, 47, 181-191.
McCrea, A.E, Anand, R.R., and Gilkes, R.J. (1990) Miner- alogical and physical properties of lateritic pallid zone ma- terials developed from granite and dolerite. Geoderma, 47, 33 57.
McKeague, J.A. and Day, J.H. (1966) Dithionite and oxalate extractable Fe and A1 as aids in differentiating various clas- ses of soils. Canadian Journal of Soil Science, 46, 13-22.

Vol. 49, No. 1, 2001 Kaolinite crystal properties and the origin of materials 59
Meads, R.E. and Maiden, P.J. (1975) Electron spin resonance in natural kaolinites containing Fe 3+ and other transition metal ions. Clay Minerals, 10, 313-345.
Mestdagh, M.M., Vielvoye, L., and Herbillon, A.J. (1980) Iron in kaolinite: II. The relationship between kaolinite crystallinity and iron content, Clay Minerals, 15, 1-13.
Mulcahy, M.J. (1973) Landforms and soils of south-western Australia. Journal of the Royal Society of Western Austra- lia, 56, 16-22.
Muller, J-R and Calas, G. (1989) Tracing kaolinites through their defect centers: Kaolinite paragenesis in a laterite (Cameroon). Economic Geology, 84, 694-707.
Muller, J-R, Manceau, A., Calas, G., Allard, T., Ildefonse, P, and Hazemann, J-L. (1995) Crystal chemistry of kaolinite and Fe-Mn oxides: Relations with formation conditions of low temperature systems. American Journal of Science, 295, 1115-1155.
Norrish, K. and Pickering, J.G. (1983) Clay minerals. In Soils: An Australian Viewpoint. CSIRO, Melbourne, Aca- demic Press, London, 281-308.
Peacor, D.R. (1992) Analytical electron microscopy: X-ray analysis. In Minerals and Reactions at the Atomic Scale: Transmission Electron Microscopy, Reviews in Mineralo- gy, Volume 27, RR. Buseck, ed., Mineralogical Society of America, Washington, D.C., 113-140.
Pomerene, J.B. (1964) Geology and Ore Depositis of the Belo Horizonte, lbiritd and Macacos Quadrangles, Minas Ger- ais, Brazil U.S. Geology Survey Professional Paper 341- D, Washington, D.C., 84 pp.
Reynolds, W.R. (1991) Discrimination of kaolinite varieties in Porters Creek and Wilcox sediments of north-central Mississipi. Clays and Clay Minerals, 39, 316-323.
Robertson, I.D.M. and Eggleton, R.A. (1991) Weathering of granitic muscovite to kaolinite and halloysite and of pla- gioclase-derived kaolinite to halloysite. Clays and Clay Minerals, 36, 113-126.
Robertson, R.H.S., Brindley, G.W., and Mackenzie, R.C. (1954) Mineralogy of kaolin clays from Pugu, Tanganiyka. American Mineralogist, 39, 118-138.
Robson, A.D. and Gilkes, R.J. (1981) Fertiliser responses (N, R K, S micronutrients) on lateritic soil in south western
Australia--A review. In Lateritisation Processes, A.A. Bal- kema, Rotterdam, The Netherlands, 381-390.
Singh, B. and Gilkes, R.J. (1992a) Properties of soil kaolinites from south-western Australia. Journal of Soil Science, 43, 645-647.
Singh, B. and Gilkes, R.J. (1992b) An electron optical inves- tigation of the alteration of kaolinite to halloysite. Clays and Clay Minerals, 40, 212-229.
Singh, B. and Gilkes, R.J. (1995) Application of analytical transmission electron microscopy to identifying intercrystal variations in the composition of clay minerals. Analyst, 120, 1335-1339.
Souza, J.M. (1983) Relat6rio de Pesquisa de Bauxita e Argila no Local Denominado Cap6o Xavier e Ouro Padre, Nova Lima, MG. MBR Minera~6es Brasileiras Reunidas S.A., Belo Horizonte, 25 pp.
Spurr, A.R. (1969) A low viscosity epoxy resin: Embedding medium for electron microscopy. Journal of Ultrastructure Research, 26, 31-43.
Stone, W.E.E. and Torres-Sanchez, R.-M. (1988) Nuclear magnetic resonance spectroscopy applied to minerals. Jour- nal of the Chemical Society, Faraday Transactions L 84, 117-132.
Tamm, O. (1922) Eine method zur Geotemmung de anorgan- ischen komponente des glekomplexes in Baden. Meddelan- den fran Statens SkogsfOrs6ksanstalt, 19, 387-404.
Varaj~o, A.ED.C., Boulange, B., and Melfi, A.J. (1989) The petrologic evolution of the facies in the kaolinite and baux- ite deposits of Vargem dos (Sculos, Quadrilfitero Ferrffero, Minas Gerais, Brazil. Travaux, 19, 137-146.
Varaj~o, A.ED.C., Boulange, B., and Melfi, A.J. (1990) Car- acterizaq~o morfol6gica, mineral6gica e qufmica das fiicies estruturais da jazida de caulinita de Vargem dos Oculos, Quadrilfitero Ferrlfero, MG. Revista Brasileira de Geoci~n- cias, 20, 75-82.
Varajao, A.ED.C., Rocha, L.A., Boulange, B., and Moreira, A.EA. (2000) Colluvial features of clayey deposits of the Moeda Syncline, Quadrilatero Ferrifero, Minas Gerais, Bra- zil. Zentralblat Fur Geologie und Palaontologie, Teil 1, 7/ 8, 957-968. E-mail of corresponding author: [email protected].
ufop.br (Received 31 January 2000; accepted 8 August 2000, Ms.
425; A.E. Jessica Elzea Kogel)