Embed Size (px)
Citation preview

Simple Linear Regression
• Conditions• Confidence intervals• Prediction intervals
Section 9.1, 9.2, 9.3 Professor Kari Lock MorganDuke University

• Homework 8 (due Monday, 4/9)
• Project 2 Proposal (due Wednesday, 4/11)
To Do

Hypothesis Test
7n
0 1
1
: 0
: 0aH
H
0.23116.21
0.014t
> 2*pt(16.21,5,lower.tail=FALSE) [1] 1.628701e-05
There is strong evidence that the slope is significantly different from 0, and that there is an association between cricket chirp rate and temperature.

Test for a correlation between temperature and cricket chirps (r = 0.9906).
Correlation Test
0 : 0
: 0aH
H
0.9906
7
r
n
2 2
0 0.990616.21
1 1 0.99062 7 2
rt
rn
> 2*pt(16.21,5,lower.tail=FALSE) [1] 1.628701e-05

Two Quantitative Variables
• The t-statistic (and p-value) for a test for a non-zero slope and a test for a non-zero correlation are identical!
• They are equivalent ways of testing for an association between two quantitative variables.

• Simple linear regression estimates the population model
• with the sample model:
Simple Linear Regression
0 1i i iy x
0 1ˆ ˆˆi iy x

Inference based on the simple linear model is only valid if the following conditions hold:
1) Linearity2) Constant Variability of Residuals3) Normality of Residuals4) Independence
Conditions

• The relationship between x and y is linear (it makes sense to draw a line through the scatterplot)
Linearity
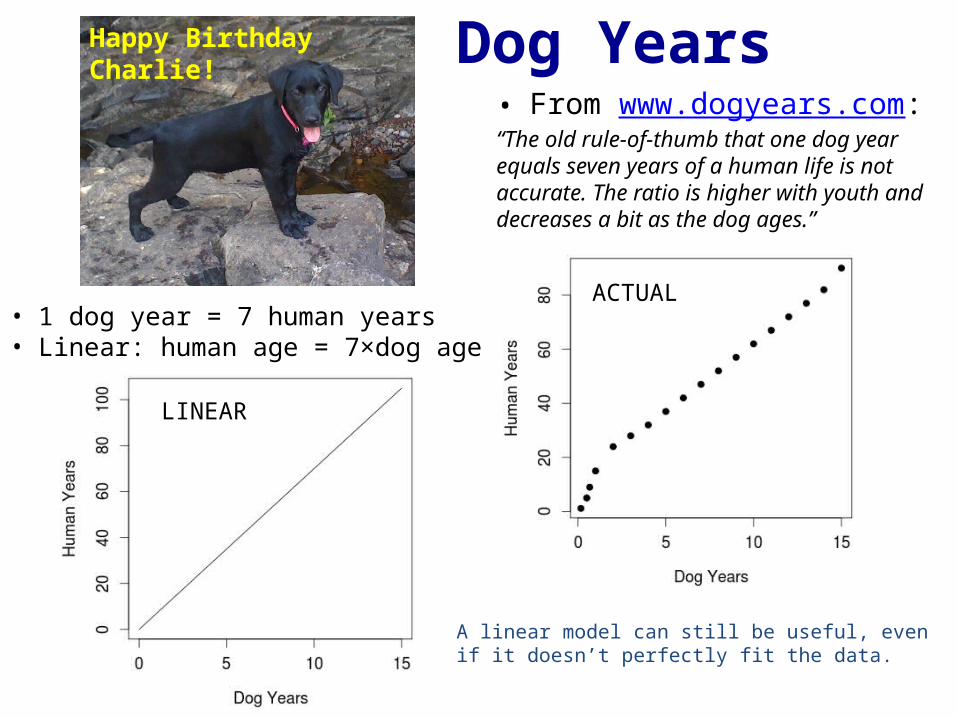
Dog Years
• 1 dog year = 7 human years• Linear: human age = 7×dog age
Happy Birthday Charlie!
• From www.dogyears.com:“The old rule-of-thumb that one dog year equals seven years of a human life is not accurate. The ratio is higher with youth and decreases a bit as the dog ages.”
LINEAR
ACTUAL
A linear model can still be useful, even if it doesn’t perfectly fit the data.

“All models are wrong, but some are useful”
-George Box

0 1i i iy x ò
Simple Linear Model ~ 0,i N òò

Residual Plot• A residual plot is a scatterplot of the
residuals against the predicted responses
Should have:1) No obvious pattern or trend2) Constant variability

Residual Plots
Obvious pattern Variability not constant

Residuals (errors)
~ 0,i N
The errors are normally distributed
The average of the errors is 0
The standard deviation of the errors is constant for all cases
Conditions for residuals:
Check with a histogram
(Always true for least squares regression)
Constant vertical spread in the residual plot

• The independence assumption is that the residuals are independent from case to case
• The residual of one case is not associated with the residual of another case
• This condition is confirmed by thinking about the data, not necessarily by looking at plot
• Can you think of data for which the independence assumption doesn’t hold?
Independence

• Data collected over time usually violates the independent condition, because the residual of one case may be similar to the residuals of the cases directly before or after
• Dow Jones index over the past month:
Data over Time

• If the association isn’t linear: Try to make it linear (next week) If can’t make linear, then simple linear
regression isn’t a good fit for the data
• If variability is not constant, residuals are not normal, or cases are not independent: The model itself is still valid, but
inference may not be accurate
Conditions not Met?

1) Plot your data! (linear association?)
2) Fit the model (least squares)
3) Use the model (interpret coefficients and/or make predictions)
4) Look at residual plot (no obvious pattern? constant variability?)
5) Look at histogram of residuals (normal?)
6) Cases independent?
7) Inference (extend to population)
Simple Linear Regression

• Can we use Obama’s approval rating to predict his margin of victory (or defeat) when he runs for re-election?
• Data on all* incumbent U.S. presidential candidates since 1940 (11 cases)
• Response: margin of victory (or defeat)• Explanatory: approval rating
President Approval and Re-Election
Source: Silver, Nate, “Approval Ratings and Re-Election Odds", fivethirtyeight.com, posted on 1/28/11.
*Except 1944 because Gallup went on a wartime hiatus

President Approval and Re-Election1. Plot the data:
Is the trend linear?(a) Yes (b) No

President Approval and Re-Election
2. Fit the Model:
36.5 0.84Margin Approval

President Approval and Re-Election3. Use the model:
36.5 0.84Margin Approval
Which of the following is a correct interpretation?a) For every percentage point increase in margin of
victory, approval increases by 0.84 percentage pointsb) For every percentage point increase in approval,
predicted margin of victory increases by 0.84 percentage points
c) For every 0.84 increase in approval, predicted margin of victory increases by 1

President Approval and Re-Election3. Use the model:
36.5 0.84Margin Approval
Obama’s current (based on polls 3/26/12 – 4/1/12) approval rating is 46%. Based only on this information, do you think Obama will
a) Winb) Lose
Source: http://www.gallup.com/poll/116479/barack-obama-presidential-job-approval.aspx
Predicted margin of victory = -36.5 + 0.84*46 = 2.14, which is positive

President Approval and Re-Election4. Look at residual plot:
Is there no obvious trend?(a) Yes (b) No
Is the variability constant?(a) Yes (b) No

President Approval and Re-Election5. Look at histogram of residuals:
Are the residuals approximately normally distributed?
(a) Yes (b) No

President Approval and Re-Election6. Cases independent?
Are the cases independent?
a) Yesb) No

President Approval and Re-Election7. Inference
Should we do inference?
(a) Yes(b) No
Due to the non-constant variability, the non-normal residuals, and the small sample size, our inferences may not be entirely accurate.
However, they are still better than nothing!

President Approval and Re-Election7. Inference
Give a 95% confidence interval for the slope coefficient.
Is it significantly different than 0?
(a) Yes(b) No

President Approval and Re-Election7. Inference:
We don’t really care about the slope coefficient, we care about Obama’s margin of victory in the upcoming election!
How do we create a 95% interval predicting Obama’s margin of victory???

• We would like to use the regression equation to predict y for a certain value of x
• This includes not only a point estimate, but interval estimates also
• We will predict the value of y at x = x*
Prediction

• The point estimate for the average y value at x=x* is simply the predicted value:
• Alternatively, you can think of it as the value on the line above the x value
• The uncertainty in this point estimate comes from the uncertainty in the coefficients
Point Estimate
*0 1ˆ ˆy x

• We can calculate a confidence interval for the average y value for a certain x value
“We are 95% confident that the average y value for x=x* lies in this interval”
• Equivalently, the confidence interval is for the point estimate, or the predicted value
• This is the amount the line is free to “wiggle,” and the width of the interval decreases as the sample size increases
Confidence Intervals

• We need a way to assess the uncertainty in predicted y values for a certain x value… any ideas?
• Take repeated samples, with replacement, from the original sample data (bootstrap)
• Each sample gives a slightly different fitted line
• If we do this repeatedly, take the middle P% of predicted y values at x* for a confidence interval of the predicted y value at x*
Bootstrapping

Bootstrap CI
Middle 95% of predicted values gives the confidence interval for average (predicted) margin of victory for an incumbent president with an approval rating of 46%

Confidence Interval

Confidence Interval• For x = 46%: (-2.89, 6.80)
• For an approval rating of 46%, we are 95% confident that the average margin of victory for incumbent U.S. presidents is between -2.89 and 6.80 percentage points
• But wait, this still doesn’t tell us about Obama! We don’t care about the average, we care about an interval for one incumbent president with an approval rating of 46%!

• We can also calculate a prediction interval for y values for a certain x value
“We are 95% confident that the y value for x = x* lies in this interval”
• This takes into account the variability in the line (in the predicted value) AND the uncertainty around the line (the random errors)
Prediction Intervals

Intervals

• A confidence interval has a given chance of capturing the mean y value at a specified x value
• A prediction interval has a given chance of capturing the y value for a particular case at a specified x value
• For a given x value, which will be wider?
a) Confidence intervalb) Prediction interval
Intervals

Intervals--- Prediction--- Confidence

• As the sample size increases:• the standard errors of the coefficients decrease• we are more sure of the equation of the line• the widths of the confidence intervals decrease• for a huge n, the width of the CI will be almost 0
• The prediction interval may be wide, even for large n, and depends more on the correlation between x and y (how well y can be linearly predicted by x)
Intervals

Prediction Interval
• Based on the data and the simple linear model (and using Obama’s current approval rating):
• The predicted margin of victory for Obama is 2.14 percentage points
• We are 95% confident that Obama’s margin of victory (or defeat) will be between -12.36 and 16.26 percentage points