Embed Size (px)
Citation preview

INDIAN INSTITUTE OF SPACE SCIENCE
AND TECHNOLOGY,
THIRUVANANTHAPURAM
PROJECT REPORT
On
SILICON DRIFT DETECTOR (SDD)
CHARACTERISATION AND ITS APPLICATION IN
X_RAY FLUORESCENCE (XRF) ANALYSIS
Submitted by
ANKUSH KUMAR
And
KOUSHAL VADODARIYA
Of
B.Tech. PHYSICAL SCIENCES
AT
PHYSICAL RESEARCH LABORATORY,
AHMEDABAD
JULY-AUGUST, 2010

BONAFIDE CERTIFICATE
This is to certify that this report entitled “study of silicon drift detector and its
characterization” submitted to Indian Institute of Space Science and
Technology, Thiruvananthapuram in connection with the Institute Internship
Program is a bonafide record of work done by Mr. Ankush Kumar and Mr.
Koushal Vadodariya under my supervision at the Physical Research Laboratory,
Ahmedabad from 5th
July to 13th
August, 2010.
Place :
Date:
Dr. Santosh Vadawale
Reader, Astronomy and astrophysics division
Dr. T. Chandrasekhar
Chairman, Astronomy and Astrophysics Division,
Physical Research Laboratory, Ahmedabad

CERTIFICATE
This is to certify that the student named Mr. Ankush Kumar of Indian
Institute of Space Science and Technology has successfully completed the
Summer Internship Program from July 5th
to August 13th in Physical Research
Laboratory, Ahmedabad under the supervision of Dr. Santosh Vadawale (Reader)
of Astronomy and Astrophysics division.
Place:
Date:
Name of the center director
Designation with seal
(Official seal

ABSTRACT
This report is the brief description of the X-ray detectors specially SDDs, its characterization
with the known X-ray source and application in X-Ray Fluorescence (XRF) analysis. SDD is
semiconductor detector used for detection of electromagnetic radiations (especially high energy
radiation like X-rays). The report contains working principle, construction of the commercially
available SILICON DRIFT DETECTORS (SDDs) and its application in the field of
observational astronomy with the proper electronic block diagram. The report consist the studies
on the SDD, analysis and characterization of SDD using source spectra of certain elements Cd-
109(cadmium), Fe-55(iron), Am-251(americium) which are all radioactive X-ray sources used
for the calibration of SDD output data. It also contains the study of the variation of the sensitivity
and resolution of the SDD data with the variation of temperature of the detector and observed
pattern in the data in terms of noise with the variation of the digitization of data like 10 bit or 11
bit, with the variation of the integration time. Various advantages of SDD over other detectors
are also mentioned.
.
INDEX
1. Introduction………………………..………………………….…...(1)
2. Aim and Objectives…………………………………….…………(2)
3. X-ray Detectors……………………..………………………….....(3)
3.1 Gas Proportional Counter……………………………………..…………..(3)
3.2 Gas Proportional Scintillation Counter………….……………..………….(4)
3.3 Scintillation Detector…………………………………………..….……....(4)
3.4 Semiconductor Detectors………………………………………..………. (4)
4. Silicon Drift Detectors……………………………….….……....…(6)
4.1 Working Principle…………………………………….……..……………(6)
4.2 SDD for X-ray Spectroscopy………………………….……..……………(9)
4.3 On Chip Electronics……………………………………………………...(10)
5. The Main Advantages of SDD over PIN Diode Detector…..........(11)
6. Signal Electronics ……………………………………….…..…..(12)
6.1 Electronics of XRF Detection System……………………..…………….(13)
6.2 The ENC of the Detection System………………………..……………...(14)
7. Phenomenon of X-ray Fluorescence ……………………..…......(15)
8. Results and discussions………………………………….….…...(17)
9. Conclusion……………………………………………….….…...(28)
10. References……………………………………………...….….(29)

1. INTRODUCTION
X-rays are high energy electromagnetic radiations having energies of the order of keV
originated due to the electronic transition between the inner orbits. Various detectors exist for
their detection. But for critical applications special semiconductor detectors are needed e.g.,
Silicon Drift Detector (SDD). SDD is semiconductor detector used for detection of
electromagnetic radiations (especially high energy radiation like X-rays). SDD technology has
been in advancement since 1980’s when the first practical SDD was made and matured enough
at present. Due to its low output capacitance, it is suitable for X-ray Fluorescence (XRF) analysis
at high read-out count rate and due to small pulse shaping time it has good energy resolution.
XRF is the re-emission of the X-rays (called secondary X-rays) after the absorption of the
primary X-rays (i.e., from the main source of the X-rays). XRF analysis involve a numbers of
steps starting from radiation detection after its interaction with the detector material, charge
collection, pulse forming, pulse amplification, pulse shaping and data analysis.
X-ray interaction can be photoelectric emission, Compton scattering or Rayleigh
scattering, but in general photoelectric emission is dominating. For data analysis the reference
materials (like 109
Cd(Cadmium), 55
Fe(Iron),241
Am(Americium)) are used whose energy peaks
(corresponding to the certain emission lines) are narrow and well defined. Data analysis is
mainly done with the electronics and the appropriate programming, and a little involvement of
visual interpretation. We have also studied the various characteristics of the SDD detector, e.g.
variation of energy resolution (in terms of FWHM) with respect to the energy to be detected and
the temperature etc. For the analysis and to read the data we are using IDL ver. 6.3 and MS
Excel.
1

2. AIM AND OBJECTIVES
Our main aim during the course of internship is to get the idea on the working principle,
construction of the commercially available SILICON DRIFT DETECTORS and its application
in the field of observational astronomy. The work we have done here consist mainly the study of
the SDD and the analysis and characterization of SDD using source spectra of certain elements
109Cd(Cadmium),
55Fe(Iron),
241Am(Americium) which are all radioactive X-ray sources used for
the calibration of SDD output data.
Next was the study of the variation of the sensitivity and resolution of the SDD data with
the variation of temperature of the detector. The next was to see the pattern in the data in terms
of noise with the variation of the digitization of data like 10 bit or 11 bit or 12 bit, with the
variation of exposure time i.e. the integration time for the study of spectra by SDD.
2

3. X-RAY DETECTORS
An X-ray detector is used to convert the energy released by an X-ray photon in the detector
material into an electric signal. The readout and processing of this electric signal by means of a
suitable electronics chain is used to measure the energy released by the photon and the arrival
time of the event. The interaction of X-rays in the detector material is mainly determined by
Photoelectric effect, Compton scattering, and Rayleigh scattering. For most of the detector
materials, the Photoelectric effect is dominant for photon energies up to 100 keV. Compton
scattering is significant in radiation absorption at high energy (> 100 keV) and increases linearly
with Z (atomic no. of the X-ray source). Rayleigh scattering does not usually exceed 10–20% of
the total absorption probability and it is higher than Compton at low energies (up to 20–50 keV,
depending on the atomic number). The energy released in the detector material during the
radiation interaction is converted into an electrical signal by means of a direct or an indirect
process and with a conversion factor which depends on the specific type of detector considered.
3.1 GAS PROPORTIONAL COUNTER
The gas proportional counters are X-ray detectors characterized by moderate energy resolution,
room temperature operation, large detection areas, and high counting rates capability. A gas
proportional counter consists of a volume of gas with an electric field applied across it.
Typically, the container of the gas is cylindrical with one electrode being the outside surface
(cathode) and the other a wire along the axis of the cylinder (anode), positively biased with
respect to the cathode. The electrons produced in the gas under irradiation with X-rays, mainly
by photoelectric effect, are accelerated on their way to the anode by a suitable voltage difference
applied between the two electrodes (proportional regime of a gas detector), producing ionization
by their collision with atoms of the gas. The amplitude of the resulting signal is therefore
proportional to the energy of the incoming photon (and to the applied voltage) by means of the
number of electrons generated by the ionization and a multiplication factor M for these electrons.
The most commonly used gases are high purity argon, xenon, neon, and krypton. Typical values
for ε range from 25 to 35 eV/ion pair while M could range from 10 to 104.
3

3.2 GAS PROPORTIONAL SCINTILLATION COUNTER (GPSC)
In a GPSC, the applied electric field allows the primary electrons to excite but not ionize the gas
atoms (as occurs in a conventional gas proportional counter), producing a light pulse as a result
of the gas atoms de-excitation. These secondary scintillation photons are then collected by a
suitable photodetector, like a photomultiplier tube or an avalanche photodiode. The signal
amplification is therefore achieved without spatial charge accumulation effects due to the
generation of electron–ion pairs, as occurs in gas proportional counters. GPSCs have shown to
reach remarkable performances for large detection areas in a 0.1–100 keV X-ray energy range.
3.3 SCINTILLATION DETECTORS
In scintillation detectors a considerable number of visible light photons is generated during
interaction of X-rays with crystal scintillators, such as NaI(Tl) or CsI(Tl), and the following de-
excitation process. These photons are converted into electrons by means of a photo-detector,
typically a photomultiplier tube. In comparison to the gas detectors, the scintillation detectors are
based on a higher Z material with a higher density and often they have a larger thickness. This
means that they have a high probability of detecting photons in a wider X-ray energy range.
However, the energy resolution offered by this detector is the poorest among X-ray detectors,
especially in the low energy range.
3.4 SEMICONDUCTOR DETECTORS
In semiconductor detectors, electron–hole pairs are generated by direct interaction of the photon
inside the detector material, similar to the primary electron–ion pairs generation in a gas
proportional counter. In contrast, the output signal is generated by the collection of this primary
charge without any multiplication process (except in the silicon avalanche photodiode). With
respect to gas detectors, semiconductor detectors have higher density and Z. Moreover, in a
semiconductor material the average energy required to produce a charge–carrier pair is of few
electron-volts while for gases this quantity is about 30 eV and for a scintillators photo-detector
system could be, at best, of the order of 25 eV. According to these energy/charge conversion
factors, the number of charge carriers generated for a given energy is higher for semiconductor
4

detectors than for gases, leading to a much smaller statistical broadening of the peaks produced
in the X-ray spectrum. For this reason, semiconductor detectors are nowadays the most preferred
detectors in X-ray spectroscopy, especially when energy resolution is of primary concern.
Energy resolutions much better than the ones achievable even by the best nitrogen-cooled
semiconductor detectors can be provided by cryogenic detectors. Semiconductor detectors can
be PN detector, PIN detector or the Drift Detector.
FIG: Si(Li) PIN detector
LIMITATION OF THE DETECTORS AND NEED OF SILICON DRIFT
DETECTOR (SDD)
Proportional counter has the limitation due to the optimum concentration of the gas and the
detector size. For the ionization of the gas atoms 25 to 35 eV (relatively high w.r.t.
semiconductor detectors) of energy per ion pair is required which the multiplication factor and in
turn sensitivity. The energy resolution of a gas proportional is (poorer than the semiconductor
detectors) of the order of 12% at 5.9 keV. The scintillation detectors have even poorer energy
resolution. Semiconductor detectors like PN detector, PIN detector can give better performance
than the other w.r.t. energy resolution and sensitivity with compact size. But for certain
application we need special type of semiconductor detector which high sensitivity, best energy
resolution and high count rate. These entire requirements are fulfilled by the special detector
called Silicon Drift Detector (SDD).
5

4. SILICON DRIFT DETECTORS
4.1 WORKING PRINCIPLE
The Silicon Drift Detector (SDD), introduced by E. Gatti and P. Rehak in 1983, is a detector of
ionizing radiation characterized by a very low capacitance of the electrode collecting the signal
charge. This capacitance is, moreover, independent of the active area of the device. This feature
allows achieving a low electronics noise, obtained, moreover, by using short shaping times.
Since its invention, the SDD has been developed in a large variety of topologies for applications
in the field of high-energy physics and in the field of X-ray spectroscopy.
Fig. 1 Sideward depletion concept
6

The working principle of this device can be understood starting from the sideward depletion
concept shown in Fig.1. The working principle of this device can be understood starting from the
sideward depletion concept shown in figure 1. With respect to a conventional p-n diode detector
(Fig. 1(a)), where the ohmic n+ contact extends over the full area on one wafer side, in the
structure shown in Fig. 1(b) the depletion of the bulk can be also achieved by positively a small
n+ electrode with respect to p+ covering both sides of the wafer. When the n+ voltage is high
enough, the two space charge regions separated by the undepleted bulk region only close to the
n+ electrode. The depletion of the bulk is achieved in this way with an applied voltage which is
four times lower with respect to the voltage needed for a conventional diode of the same
thickness. This technique allows us to have a potential minimum at the center of the bulk wafer
where the electrons generated during the detection will travel.
In the silicon drift detector (SDD), based on the principle of sideward depletion described above,
an additional electric field parallel to the surface of the wafer is added in order to force the
electrons in the energy potential minimum to drift towards the n+ anode. This is achieved by
implanting two arrays of p+ electrodes on both sides of the wafer (Fig. 2), instead of the single
p+ implants shown in Fig. 1(b). These electrodes are suitably biased with a voltage gradient in
order to provide an electric field parallel to the surface. A drawing of the potential energy in the
drifting region is shown in Fig. 3(a). Once generated by the ionizing radiation, the electrons are
focused in the bottom of the potential channel and driven towards the anode region of the
detector while the holes, driven by the depletion field, are quickly collected by the nearest p+
electrodes. In the region close to the collecting anode (Fig 3(b)), the bottom of the potential
channel is shifted towards the surface where the anode is placed, by suitably biasing the
electrodes on the opposite side.
7

Fig. 2 The SDD working principle
Fig. 3 Electron energy potential diagrams in the drifting region of the SDD (a), and in the region
close to the anode where the potential valley is directed towards the surface (b)
The cloud of electrons induces to the anode an output pulse only when the electrons arrive close
to it because of the electrostatic shield of the p+ electrodes. The drift time of the electrons may
be used to measure one of the interaction coordinates while the collected charge allows to
measure the energy released by the incident ionizing event. The main advantage of an SDD with
respect to a conventional p-n diode of equivalent active area and thickness is the low value of the
capacitance of the collecting anode, which is of the order of 100 fF. This value is moreover
independent of the active area of the device. As will be shown later in the section describing the
electronics noise of a detector-preamplifier system, this feature allows reducing both the
electronics noise and the value of the shaping time to be used for the processing of the signal.
8

4.2 SDD FOR X-RAY SPECTROSCOPY
SDD is an ideal detector for high-resolution X-ray spectroscopy measurements. For this purpose,
in order to enhance the quantum efficiency in the soft X-ray region (E<5 keV), particular care
has been used in the design of the radiation entrance window, limiting as much as possible the
insensitive area and optimizing the doping profile to minimize the charge loss. In a detector of
the type shown in Fig. 2, the surface areas between p+ strips are covered by thermally grown
SiO2. The fixed positive charges, always present within the oxide, bend the potential distribution
downward at the detector surface and create local potential minima for electrons which could
collect the signal electrons generated close to the surface. This is an important limitation for the
detection of soft X-rays, which are totally absorbed within a few μm from the surface.
For soft X-ray detection a suitable topology has been designed with the radiation entrance
window of the detector consisting of a continuous p+ implant without oxide gaps. The schematic
view of an SDD for X-ray spectroscopy based on this design is shown in Fig. 4. By using an
equipotential electrode on the p-side, only the potential on the opposite side of the detector is
varied to provide the drifting field, as shown in Fig. 5. As can be easily understood from the
figure, also for this device, as in the case of the SDD shown previously, wherever the electrons
are generated inside the detector volume, they are driven to the small collecting anode. An
integrated voltage divider can be used to bias the p+ rings by just contacting externally the first
ring next to the anode and the last one at the edge of the detector.
Fig. 4: Schematic diagram of the SDD for X-ray spectroscopy with integrated n-channel JFET.
The transistor gate is connected to the anode ring by a metal strip.
9

Fig. 5: Energy potential for electrons inside an SDD with homogeneous entrance window.
Possible electrons paths are shown in figure.
4.3 ON-CHIP ELECTRONICS
To fully exploit the benefit in terms of energy resolution and short shaping time arising from the
low output capacitance typical of the SDD, both the preamplifier’s input capacitance and stray
capacitances of the connection between detector and preamplifier have to be kept as small as
possible. This goal can be achieved by means of the integration of the front-end transistor of the
amplifying electronics directly on the detector wafer. This solution allows minimizing the stray
capacitance of the connections because the bond wire connecting the detector and an external
amplifier is substituted by a short metal strip on the chip. By a proper design of the input
transistor, also the capacitative matching condition, Cdetector = CFET, can be achieved.
Moreover, the detector–preamplifier sensitivity to microphonic noise (mechanical vibrations)
and electrical pickups is highly reduced. SDDs with on-chip JFET have allowed reaching state-
of-the art energy resolutions in X-ray spectroscopy at room temperature or with moderate
cooling by a single-stage Peltier cooler. In Fig. 6, two 55
Fe spectra measured at optimum
operating conditions at two different temperatures.
10

Fig. 6: 55
Fe spectra measured with an SDD (5 mm2), at 25
oC with 0.25µs shaping time (left) and
at -10 oC with 0.5µs shaping time (right) respectively.
5. THE MAIN ADVANTAGES OF SDD OVER PIN
DIODE DETECTOR:
The main advantage of the silicon drift detector (SDD) is that it has much lower electronic noise
than a planar device at short shaping times, i.e. at high count rates. Lower noise implies better
resolution, particularly at low energies. With an SDD, the resolution is good even for large areas.
Overall, the resolution of the SDD is better than that of the planar detector, but the advantages
are particularly important at low energies, high count rates, and for larger areas. The resolution
of an SDD is much less dependent on area: a 25 mm2 SDD has somewhat better resolution than 6
mm2 Si-PIN and much better than the 25 mm
2 Si-PIN. The SDD can maintain good resolution
over large areas. It shows that, for a planar detector, the resolution degrades significantly worse
as the area increases.The SDD had shorter peaking time and 3x the count rate then the planar Si
PIN detector with the same area. At the highest energies, the Sn Ka and Kb lines are
indistinguishable. Statistical broadening is so dominant that the lower noise of the SDD is not
important here. At the moderate energies, 10 to 15 keV, the SDD clearly has better resolution:
the peak widths are a bit less and the peak heights slightly greater. But all of the peaks can be
resolved from each other and the background equally well. The SDD has better resolution but it
is unlikely to affect the analysis very much. At the lowest energies, below 5 keV, the difference
is quite significant. Peaks are resolved with the SDD which overlap with the Si PIN and the peak
11

to background ratio is much better. The small area of the anode keeps the capacitance very small.
Since the active volume of the diode is enlarged by adding more electrodes with the same anode
area, the input capacitance is independent of detector area. This is important because the
dominant noise source in silicon X-ray spectroscopy is voltage noise, which is proportional to
the total input capacitance and increases at short shaping times. The SDD, with its low
capacitance, has lower noise, particularly at very short shaping times.
In a Si PIN X ray detector the make-up of the detector is just similar to a parallel plate capacitor
which makes the capacitance value of the detection system higher and so it does not allow the
readout frequency of the system to go above a certain limit at which it will become impossible
for the system to differentiate between the charge collected at different times and thus the
effective volume of the bulk silicon material which is ionized which tells about the frequency or
energy property of the incident photon. The time-domain current pulse shape is thus the primary
source of information which needs to be read out with least noise possible. Since in SDD the
structure of the detector is such that its capacitance does not depends on its area and also its
capacitance is very less compared to other available detectors, in the order of few femto-farads ,
the limit of readout frequency is increased drastically so the acquisition of data at the primary
level is done properly on which , other noises are added later by the signal electronics, random
noise ,statistical noise etc.
6. SIGNAL ELECTRONICS
The purpose of the electronic chain is to measure the value of the charge Q delivered by the
detector when an ionizing particle interacts in its active volume with the maximum accuracy and
precision compatible with many physical and practical constraints. The charge Q is supposed to
be proportional to the energy released by the ionizing particle in the detector. The presence of
several unavoidable noise sources in the detector and in the electronic circuits affects the
precision of the measurement of the charge Q. The precision of the measurement is usually
defined in terms of the S/N (signal-to-noise) ratio. An alternative concept, very often used in the
field of radiation detection, is the equivalent noise charge (ENC). The ENC is, simply, the charge
delivered by the detector which makes the S/N equal to one. We will base our presentation on the
ENC concept.
13
12

6.1 ELECTRONICS OF XRF DETECTION SYSTEM
An XRF detection system is basically composed of a detector, of a signal processor and of a unit
for storing and analyzing the acquired spectra. The detector can be usually modelled as
capacitance in parallel with a current generator, which delivers a current pulse carrying a charge
Q proportional to the energy E released by the ionizing particle in the detector. The charge Q is
affected by statistical fluctuations considered above in this chapter. An analog signal processor
for radiation detection is usually composed of the following basic units: a charge preamplifier, a
“pulse shaping amplifier”, a peak sampler, an analog-to-digital converter and a digital unit for
the storing and processing of the acquired data.
The charge preamplifier usually provides the first level of amplification of the detector signal.
The detector is connected to the virtual ground of the amplifier and the charge Q is integrated on
its feedback capacitance CF. The preamplifier output signal is a step-like voltage waveform
whose amplitude is proportional to the charge Q delivered by the detector. Alternatively, a
Voltage preamplifier can be used. In this case, the charge Q is integrated on a capacitance CIN
which is the sum of the capacitance CD of the detector and the input capacitance CA of the
voltage amplifier. The configuration based on the charge preamplifier has the main advantage of
making the gain of the input stage insensitive to the variations of the detector capacitance.
The charge preamplifier is followed by the pulse-shaping amplifier, (also called “filtering
amplifier”), whose main duties are a further amplification of the signal and the improvement of
the S/N (and equivalently, of the ENC). It provides an output voltage pulse whose peak
amplitude is proportional to the amplitude of the step-like waveform provided by the charge
preamplifier (or by the voltage preamplifier).
The electronic stages which follow the pulse-shaping amplifier are related to the digitalization of
its output peak value. A sampler detects the peak value of the output pulse and provides a stable
signal suitable for the operation of the analog-to-digital converter (ADC).We will here suppose
that the sampling and the digitalization processes do not affect the S/N at the output of the
Pulse-shaping amplifier.
13

Fig. 7: Elements of the detection system.
6.2 THE ENC OF THE DETECTION SYSTEM
The square value of the ENC can be expressed as the sum of three independent contributions:
*a* *A1 + *c*A2 + b*T*A3 … (1)
Where, CD is the detector capacitance , CG is the gate to source capacitance of FET ,
characteristic time T is shaping time and a,b,c(detector dependent),A1,A2,A3 (output pulse shape
dependent)are constants.
The first contribution is due to the channel thermal noise of the input FET. The second one is due
to the 1/f noise associated with the drain current. The third contribution is due to the Shot noise
of the leakage current of the detector and of the FET and to the thermal noise of any resister
connected to the gate of the input FET. By equation no. 1 we can observe that the ENC has a
direct relation to the capacitance of the detector. Less the capacitance lesser will be the ENC and
hence the data will be read with better accuracy.
14

7. PHENOMENON OF X-RAY FLUOROSCENCE
X-ray fluorescence (XRF) is the emission of characteristic "secondary" (or fluorescent) X-rays
from a material that has been excited by bombarding with high-energy X-rays or gamma rays.
FIG.8: Physics of X-ray fluorescence
The phenomenon is widely used for elemental analysis and chemical analysis. When materials
are exposed to short-wavelength X-rays or to gamma rays, ionization of their component atoms
may take place. Ionization consists of the ejection of one or more electrons from the atom, and
may take place if the atom is exposed to radiation with energy greater than its ionization
potential. X-rays and gamma rays can be energetic enough to expel tightly held electrons from
the inner orbitals of the atom. The removal of an electron in this way renders the electronic
structure of the atom unstable, and electrons in higher orbitals "fall" into the lower orbital to fill
the hole left behind. In falling, energy is released in the form of a photon, the energy of which is
equal to the energy difference of the two orbitals involved. Thus, the material emits radiation,
which has energy characteristic of the atoms present. The term fluorescence is applied to
phenomena in which the absorption of radiation of a specific energy results in the re-emission of
radiation of a different energy (generally lower).
Incident high
energy photon
X-ray
fluorescent
photon
Electronic transition
between inner orbits
15

FIG.9: Possible emission lines for the electronic transition (e.g., XRF) which are the
characteristic of the particular atom because emitted photon energy depends upon atomic number
and the orbits taking part in transition.
Characteristic radiation
Each element has electronic orbitals of characteristic energy (depending upon Z). Following removal of
an inner electron by an energetic photon provided by a primary radiation source, an electron from an outer
shell drops into its place. There are a limited number of ways in which this can happen, as shown in
FIG.9. The main transitions are given names: an L→K transition is traditionally called Kα, an M→K
transition is called Kβ, and an M→L transition is called Lα, and so on. Each of these transitions yields a
fluorescent photon with a characteristic energy equal to the difference in energy of the initial and final
orbital. The wavelength of this fluorescent radiation can be calculated from Planck's Law:
The fluorescent radiation can be analyzed either by sorting the energies of the photons (energy-dispersive
analysis) or by separating the wavelengths of the radiation (wavelength-dispersive analysis). Once sorted,
the intensity of each characteristic radiation is directly related to the amount of each element in the
material.
16

8. RESULTS AND DISCUSSIONS
At the first we have dealt with the data for the reference X-ray sources Fe-55, Cd-109, Am-241
whose spectra is shown below as graph (due to large data it can’t be tabulated here)
Here the plot has been shown b/w the channel number of the ADC used (which is a 10 bit
converter, 1024 channels) v/s the count corresponding to that channel. Channel to energy
conversion will be shown later.
Fig. 10: Spectra of radioactive X-ray sources taken with SDD
Now for finding the correct relation b/w the channel number of the ADC and the energy we have
used IDL software where we have plotted the data and used one of its inbuilt function
GAUSSFIT by which we got the position of the peaks and their FWHM (which decides the
resolution of the detector) with sigma-1 error. The program for plotting the generated MCA and
the program for fitting the best suitable Gaussian fit curve and to find its parameters like the peak
position and FWHM along with their errors has been shown in the next page.
17

Program for plotting:
pro plotonly
file=dialog_pickfile()
rows=file_lines(file)
print,rows
header=strarr(12)
data=dblarr(1,rows-13)
openr, 4,file
readf,4,header
readf,4,data
close,4
free_lun,4
x=indgen(1024)
plot,x,data
end
Program for fitting is as follows:
pro plotandfitiron
file=dialog_pickfile()
rows=file_lines(file)
print,rows
header=strarr(12)
data=dblarr(1,rows-13)
openr, 4,file
readf,4,header
readf,4,data
close,4
free_lun,4
x=indgen(1024)
y_fit=gaussfit(x(550:650),data(550:650),nterms=3,coef,sigma=coeff)
print,coef
print,coeff
plot,x(550:650),data(550:650)
oplot, x(550:650),y_fit,color='fff300'x
end
18

To find the approximated parameters according to the Gaussian fit, a sample fit curve computed
by the program is shown.
Fig. 11: Curve fitting done by IDL.
Now by proper fitting of the data of all sources following set of results (with 1σ error) obtained:
Element channel number sigma (gauss parameter) FWHM (eV)
Fe 5.9 keV (Kα) 169.649 ± 0.027 3.503 ± 0.034 281.0 ± 2.7
Am 13.9 keV (Lα) 409.786 ± 0.50 4.406 ± 0.067 353.5 ± 5.4
Am 17.8 keV (Lβ) 521.177 ± 0.032 4.660 ± 0.045 373.8 ± 3.6
Cd 22.16 keV (Kα) 646.534 ± 0.045 5.228 ± 0.058 419.4 ± 4.6
Cd 24.96 keV (Kβ) 729.509 ± 0.045 4.635 ± 0.073 371.8± 5.8
19
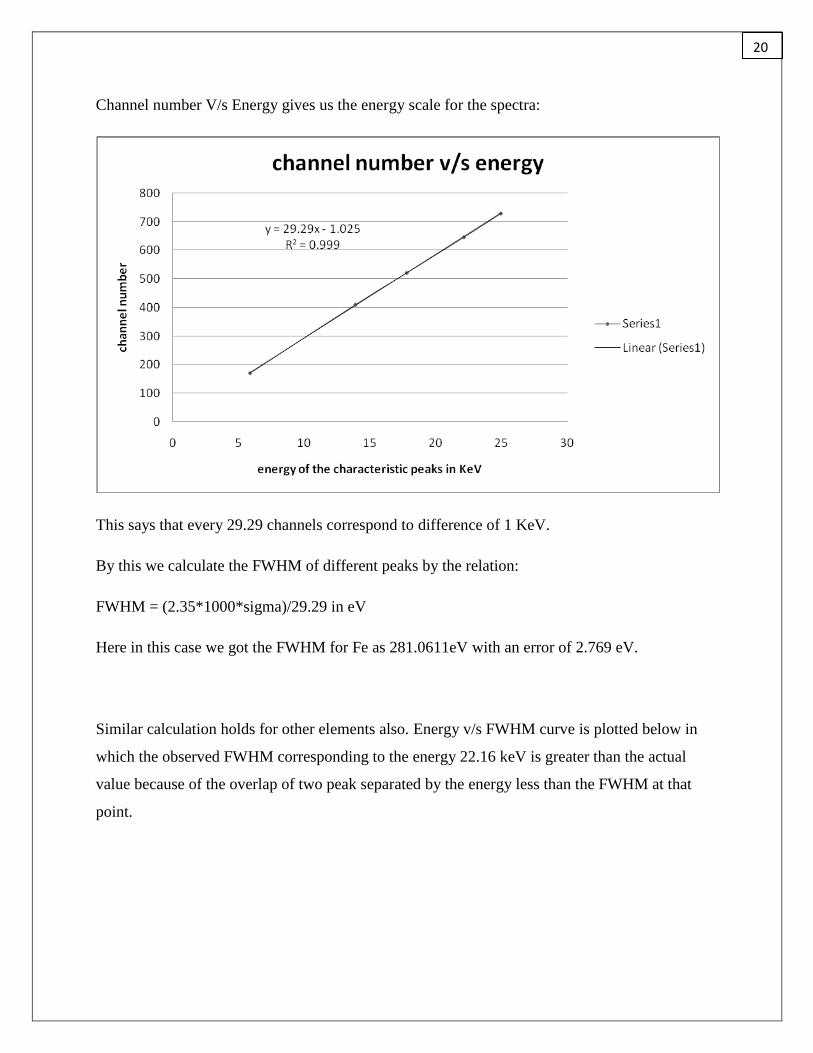
Channel number V/s Energy gives us the energy scale for the spectra:
This says that every 29.29 channels correspond to difference of 1 KeV.
By this we calculate the FWHM of different peaks by the relation:
FWHM = (2.35*1000*sigma)/29.29 in eV
Here in this case we got the FWHM for Fe as 281.0611eV with an error of 2.769 eV.
Similar calculation holds for other elements also. Energy v/s FWHM curve is plotted below in
which the observed FWHM corresponding to the energy 22.16 keV is greater than the actual
value because of the overlap of two peak separated by the energy less than the FWHM at that
point.
20

Now we deal with the characteristic variation of the SDD with temperature. The temperature of
detector is controlled electronically. 509 mV is required to maintain detector at room temperature
(27 o
C). And every increase of 2.35 mV reduces the temperature by 1oC. A sample spectra has
been shown here where the useful part of the spectra i.e. k-alpha line of Fe has very less counts
with respect to the noise in low energy region. The spectra for the data taken at 560mV have
been shown here which corresponds to a temperature of 5oC.
21

Whereas the K-alpha peak which comes at around 650th
channel looks like :
Similar plot was observed for other temperature data too and their FWHM was recorded as
follows:
FWHM FWHM-error temperature
539 24 5
349 7 -2
302 6 -5
269 5 -11
264 6 -14
22

The plot for temperature v/s FWHM for Fe is observed as follows:
From the above it can observe that FWHM is less for low temperature means energy resolution is
better at low temperature. If we see the full plot of the data of the detection system then we will
find that near 1keV a peak with very high count present. The reason for this is electronic noise
which can be minimized by operating the detector assembly at the lower temperature. Position of
this noise peak and its tail part decide them minimum threshold for the detection of the energy
below which the results will not be reliable.
Next was to analyze the data taken with KETEK detector with company made electronics
The plot of the spectra has been shown below
23

Here using the standard lines for the sources similar to that of the First data, we got the following
relation b/w energy in terms of KeV and the Channel number in this 11 bit data.
In this case we have 63.86 channels corresponds energy of 1 KeV.
And FWHM of the iron peak here is measured (by fitting with best suitable Gaussian fit) to be
equal to 140.3528 eV .
24

The Channel-energy relation curve is shown below
And the energy FWHM relation curve is as
This resembles with the energy –FWHM curve for the source spectra. In the above plot the
observed FWHM corresponding to the energy 22.16 keV is greater than the actual value because
of the overlap of two peak separated by the energy less than the FWHM at that point.
25

Now the data with KETEK detector with the electronics developed at PRL laboratories.
The plot for the Channel number v/s energy of standard peaks of sources is
Where from we can see that 98.72 channel number difference would correspond to a unity
energy difference (in KeV). Using this relation we can calculate the FWHM for the peaks.
26
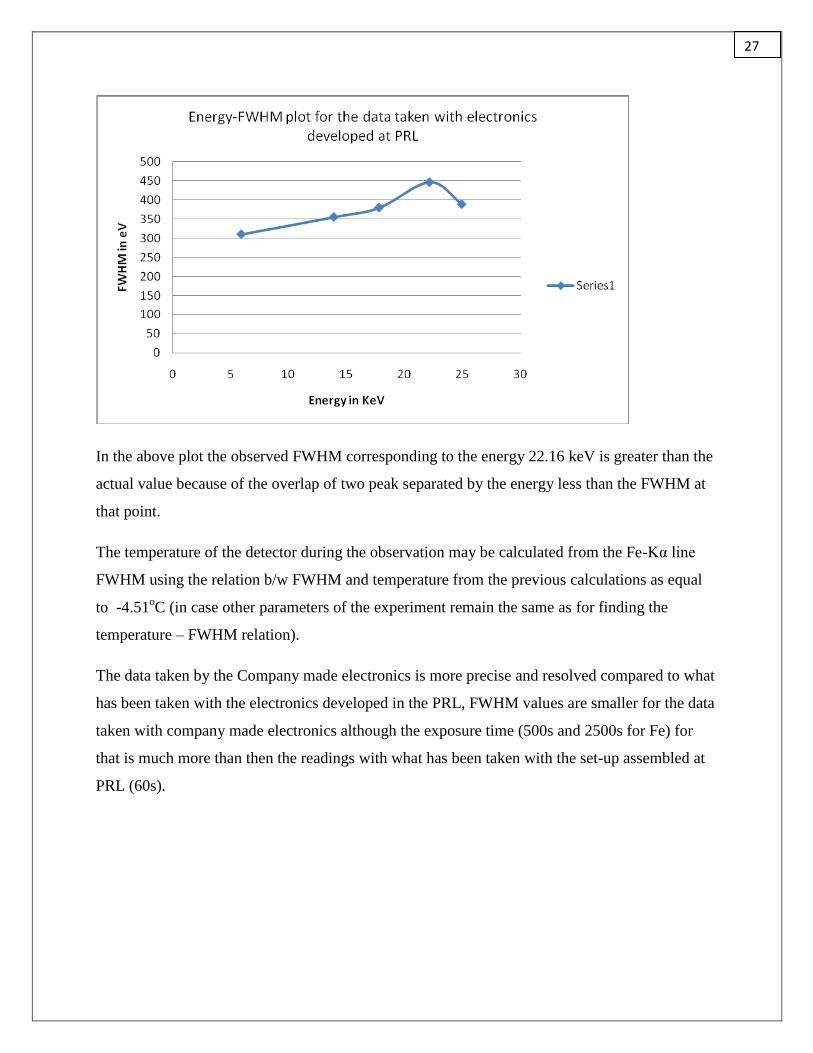
In the above plot the observed FWHM corresponding to the energy 22.16 keV is greater than the
actual value because of the overlap of two peak separated by the energy less than the FWHM at
that point.
The temperature of the detector during the observation may be calculated from the Fe-Kα line
FWHM using the relation b/w FWHM and temperature from the previous calculations as equal
to -4.51oC (in case other parameters of the experiment remain the same as for finding the
temperature – FWHM relation).
The data taken by the Company made electronics is more precise and resolved compared to what
has been taken with the electronics developed in the PRL, FWHM values are smaller for the data
taken with company made electronics although the exposure time (500s and 2500s for Fe) for
that is much more than then the readings with what has been taken with the set-up assembled at
PRL (60s).
27

9. CONCLUSION
We have studied the various characteristic of the silicon drift detector(SDD), namely Detector
energy resolution (FWHM) is better for the lower energy (~5keV) values and degrade gradually
for the higher energy (~30keV) values. Detector energy resolution and the sensitivity becomes
better and better as temperature of detector system decreases. Total noise in the output data is the
cumulative effect of the detector noise, electronic noise and the quantum statistical nature of the
radiation. Detector noise and electronic noise can be minimized by operating the system at lower
temperature by providing it with cooling agents. Depending upon the amount of the noise we
defined the minimum threshold for the energy detection below which we cannot have reliable
(precise/accurate) energy detection. For the purpose of scaling we prefer the radioactive isotopes
as source over vacuum tubes because of their narrow and well defined peaks (corresponding to
certain emission lines) which make it easier to calibrate the ADC output for the study of mix-
spectra formed by compounds or alloys or any kind of material.
Various x-ray detector exists but SDD is best suited for the critical applications where best
energy resolution, good sensitivity and high count rate is needed along with the constraint of size
of the detector. Such detectors can be used for space applications including the study of X-ray
fluorescence from terrestrial bodies under observation where detector may be satellite borne or
rover borne. For average flux values these detectors do not require focusing system. Also SDD’s
are energy dispersive detector which only requires a finite integration time to form the spectra, as
can be seen from the observations that the 1-σ error value decreases with increase in integration
time.
28

10. REFERENCES
1. Handbook of Practical X-Ray Fluorescence Analysis, B. Beckhoff B. Kanngießer
N. Langhoff R.Wedell H.Wolff(Eds.)
2. www.ketek.net
3. www.google.com
4. www.wikipedia.com
29