Embed Size (px)
Citation preview
154 S I G T T O – 3 0 Y e a r S O f S e r v I n G T h e I n d u S T r Y
l LNG information portal
It has long been understood that compatibility
between ship and shore is an essential safety
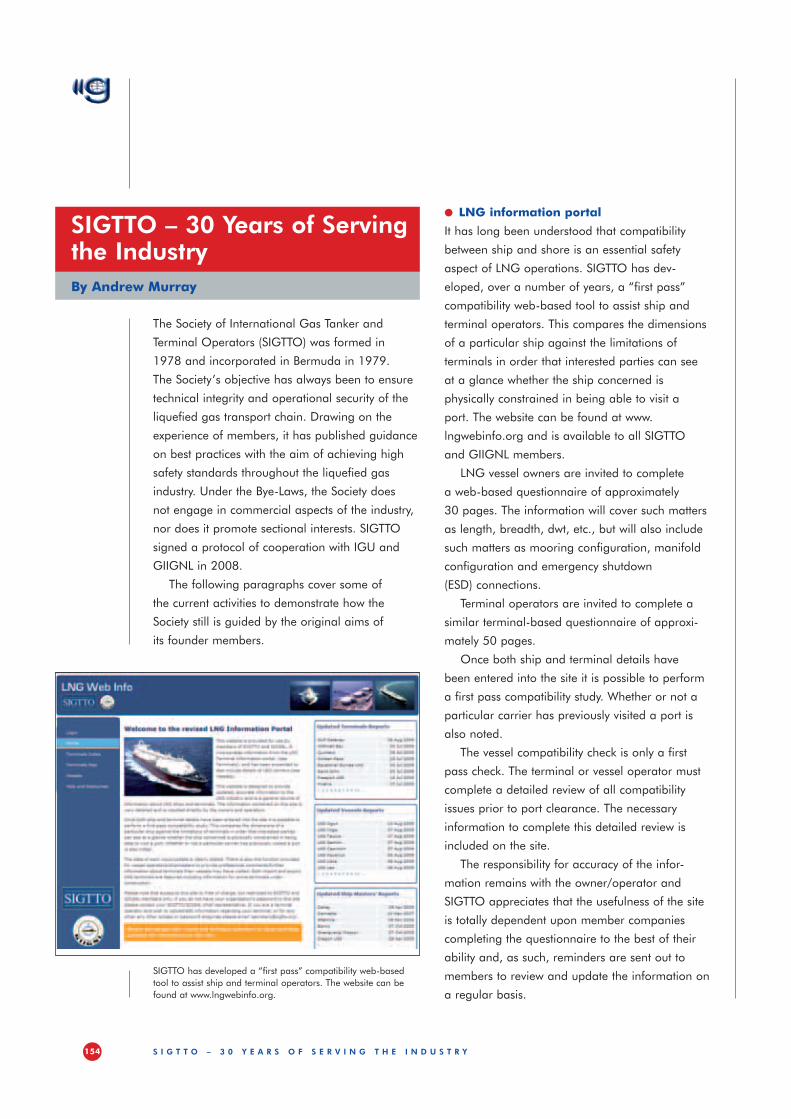
aspect of LNG operations. SIGTTO has dev-
eloped, over a number of years, a “first pass”
compati bility web-based tool to assist ship and
terminal operators. This compares the dimensions
of a particular ship against the limitations of
terminals in order that interested parties can see
at a glance whether the ship concerned is
physically con strained in being able to visit a
port. The website can be found at www.
lngwebinfo.org and is available to all SIGTTO
and GIIGNL members.
LNG vessel owners are invited to complete
a web-based questionnaire of approximately
30 pages. The information will cover such matters
as length, breadth, dwt, etc., but will also include
such matters as mooring configuration, manifold
configuration and emergency shutdown
(ESD) connections.
Terminal operators are invited to complete a
similar terminal-based questionnaire of approxi-
mately 50 pages.
Once both ship and terminal details have
been entered into the site it is possible to perform
a first pass compatibility study. Whether or not a
parti cular carrier has previously visited a port is
also noted.
The vessel compatibility check is only a first
pass check. The terminal or vessel operator must
complete a detailed review of all compatibility
issues prior to port clearance. The necessary
information to complete this detailed review is
included on the site.
The responsibility for accuracy of the infor-
mation remains with the owner/operator and
SIGTTO appreciates that the usefulness of the site
is totally dependent upon member companies
completing the questionnaire to the best of their
ability and, as such, reminders are sent out to
members to review and update the information on
a regular basis.
The Society of International Gas Tanker and
Terminal Operators (SIGTTO) was formed in
1978 and incorporated in Bermuda in 1979.
The Society’s objective has always been to ensure
technical integrity and operational security of the
liquefied gas transport chain. Drawing on the
experience of members, it has published guidance
on best practices with the aim of achieving high
safety standards throughout the liquefied gas
industry. Under the Bye-Laws, the Society does
not engage in commercial aspects of the industry,
nor does it promote sectional interests. SIGTTO
signed a protocol of cooperation with IGU and
GIIGNL in 2008.
The following paragraphs cover some of
the current activities to demonstrate how the
Society still is guided by the original aims of
its founder members.
SIGTTO – 30 Years of Serving the IndustryBy Andrew Murray
SIGTTO has developed a “first pass” compatibility web-based tool to assist ship and terminal operators. The website can be found at www.lngwebinfo.org.

155S I G T T O – 3 0 Y e a r S O f S e r v I n G T h e I n d u S T r Y
considered mandatory. However they do represent
the current best practice for operating standards
for officers. The requirements were aligned as
closely as possible to the certification levels
l LPG shipping suggested competency
standards
In 2006, SIGTTO published a set of standards for
the LNG shipping industry, a move that was wel-
comed by both members and the LNG industry in
general. The positive response received prompted
the Society to investigate the need for a similar set
of standards for the LPG shipping industry. Feed-
back from members showed that such a publi-
cation would make a positive contribution to
maintaining the industry’s excellent safety record.
SIGTTO publications are based on what is
accepted to be “Industry Best Practice” and as
such it was necessary to form a working group
com prised of a broad knowledge base of
industry expertise.
The final document adopted for publication by
the SIGTTO Board in April 2008 comprises of a
set of standards that are not, and can not be,
SIGTTO has published sets of guidelines for the LNG (above) and LPG (below) shipping sectors.
156 S I G T T O – 3 0 Y e a r S O f S e r v I n G T h e I n d u S T r Y
focused group of LNG experts are working
on updating the existing document with a
final document due to be published in the
final quarter of 2009.
l It has been brought to the Society’s attention
that conflicts between vessel charterers and
vessel operating companies exist regarding
LNG officer experience. The Society has
formed a small working group whose aim
is to produce a model experience matrix
that will be acceptable to all sides of
the industry.
l IGC Code
The current version of the International Code
for the Construction and Equipment of Ships
Carrying Liquefied Gases in Bulk (IGC Code)
remains substantially as drafted some 30 years
ago. Increasingly, the membership has
expressed concerns that it no longer fully
fitted the needs for modern ships and their
technology. The IGC Code is “owned” by
IMO and a submission was made to IMO
to update the document. Uniquely for IMO,
the Organisation agreed that the industry
should take the lead on the revision work
with a plan to return a completed document
to IMO for its consideration.
SIGTTO has taken on the role of coordi-
nating what is a truly industry-wide commitment.
There are currently 10 Working Groups under
the guidance of a Steering Group. In total about
130 people from 18 countries representing
some 48 companies/industry bodies are
engaged in the work. The target date for return
of the revised document to IMO is 2010.
The foregoing paragraphs give a snapshot
of how the Society continues to serve the lique-
fied gas industry after more than 30 years in
existence.
Captain Andrew Murray is SIGTTO’s Technical
Advisor (www.sigtto.org).
required by the International Maritime
Organisation (IMO) and adhere to the
management/operations principle.
The book is written in two distinct sections,
a summary of tasks required and the under-
pinning knowledge required for carrying out
those tasks.
Subsequent to publication of LPG Shipping
Suggested Competency Standards, the LNG
standards were revisited by the secretariat and
although content was not changed, the format
of the publication was altered to bring it into
line with the LPG publication. LNG Shipping
Suggested Competency Standards (Second
Edition) was published in the latter half of 2008.
l Future publications
SIGTTO is committed to ongoing safety within
the liquefied gas shipping industry and is
constantly working on revisions of older publi-
cations in addition to new publication titles.
Some of the publications currently being
reworked/newly written include:
l Suggested Competency Standards for LNG
Steam Engineers
It is recognised by the Society and its
members that steam-powered LNG vessels
are the only merchant vessels employing
steam propulsion systems. Steam LNG
vessels are still being built and will be trading
for many more years, yet, clearly, the industry
knowledge base is contracting. The
members felt that, if steps were not taken by
the Society to protect the knowledge base,
nobody else would do it for them.
l Liquefied Gas Sampling Procedures
Following an incident during a cargo
sampling operation at a UK port, the UK
Marine Accident Investigation Branch
requested SIGTTO to review guidelines on
liquefied gas sampling procedures. After an
industry-wide search for available guidance
from other sectors of the industry, a small
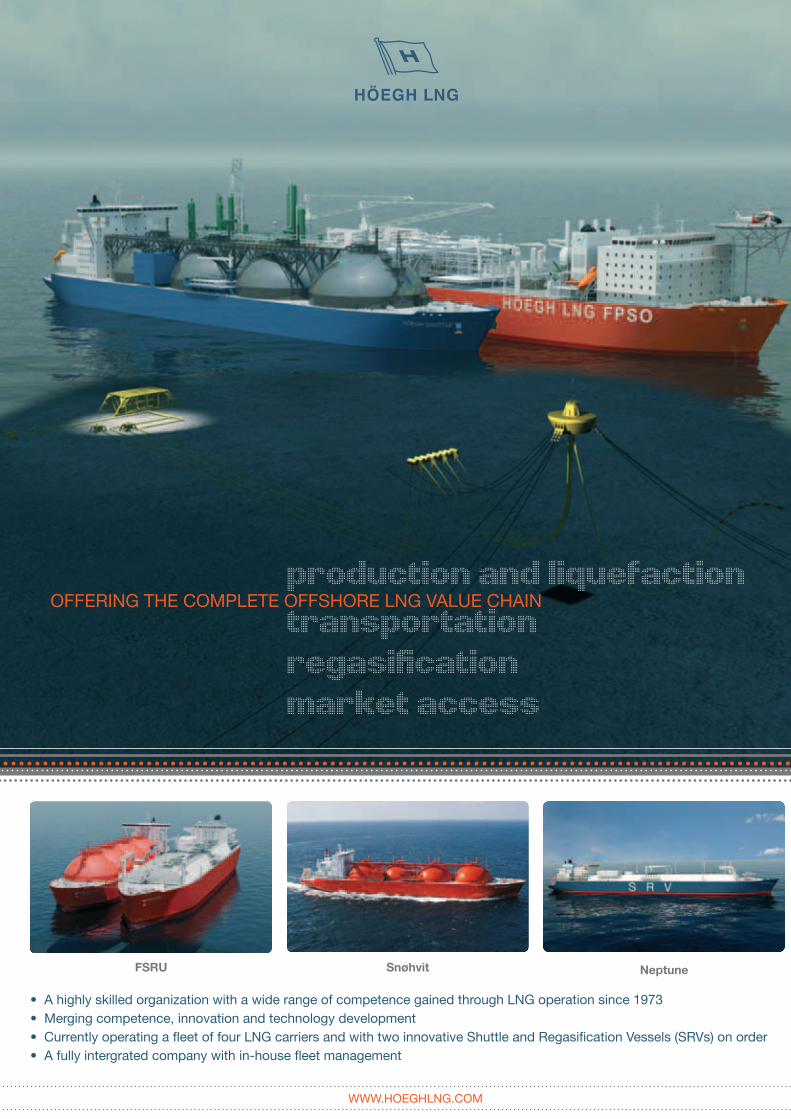
• A highly skilled organization with a wide range of competence gained through LNG operation since 1973• Merging competence, innovation and technology development• Currently operating a fleet of four LNG carriers and with two innovative Shuttle and Regasification Vessels (SRVs) on order• A fully intergrated company with in-house fleet management
www.hoeGhLNG.CoM
FSRU Snøhvit Neptune
158 L n G C a r r I e r f L e e T S u r G e S a S T r a d e S T a G n a T e S
new LNG production capacity are coming on
stream, as construction projects embarked upon
four and five years ago draw to a close. LNG
production capacity worldwide is on track for a
30% increase in 2009. Unfortunately, the demand
for the newly available LNG volumes and the
ships to carry these cargoes is nothing like what
had been forecast.
Demand for gas in many of the leading LNG
import nations is currently down by as much as
10% year-on-year. Overnight, the LNG sector has
been transformed from a sellers’ to a buyers’
market and as many as 50 ships in the LNG
carrier fleet of 325 vessels are effectively surplus to
current requirements.
l Newbuilding frenzy
Shipyards delivered a record 53 new LNG carriers
in 2008 and a further 49 are scheduled for
completion this year. The world’s three largest
shipbuilders, all Korean – Hyundai Heavy
Twelve months ago the wind was set fair for LNG
shipping. LNG carriers were being delivered at an
unprecedented rate from a select number of the
world’s leading shipbuilders and a surging
demand for gas promised a 10% per annum
growth in global LNG trade levels through 2015
at least. That was before September 2008, when
the perfect storm, combining a global credit crisis
with sharp downturns in consumer confidence and
industrial activity, unleashed its fury.
Today, the LNG industry, like most sectors of the
world economy, is in a chastened state. LNG
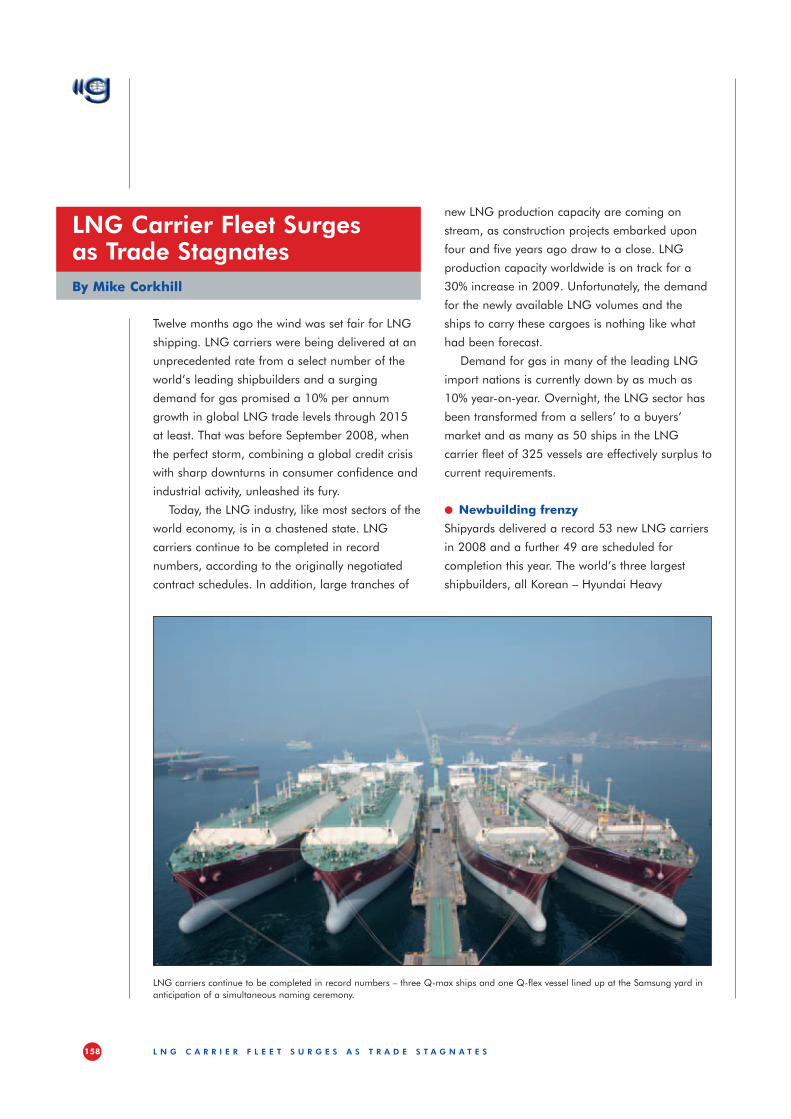
carriers continue to be completed in record
numbers, according to the originally negotiated
contract schedules. In addition, large tranches of
LnG Carrier fleet Surges as Trade Stagnates By Mike Corkhill
LNG carriers continue to be completed in record numbers – three Q-max ships and one Q-flex vessel lined up at the Samsung yard in anticipation of a simultaneous naming ceremony.

159L n G C a r r I e r f L e e T S u r G e S a S T r a d e S T a G n a T e S
LNG carriers remaining on order at presstime will
have been completed by the end of 2010. In
addition, the top LNG carrier builders are also
leading constructors of container ships and tankers
and the demand for these types of vessels has
also evaporated.
Because no one expects the rebound in either
economic activity or the demand for new ships to
be particularly strong, when they do occur, the end
result is that Hyundai, Daewoo and Samsung face
a lean spell commencing in 2011 and stretching
for two years at the very least. The need to absorb
existing tonnage surplus to present requirements
will further delay new orders.
As shipyards face up to the challenges of
retaining their skill base and production capabi-
lities during the coming period of severely restric-
ted ship construction activity, it is becoming more
and more likely that the number of LNG carriers
Industries (HHI), Daewoo Shipbuilding & Marine
Engineering (DSME) and Samsung Heavy Indus-
tries (SHI) – are responsible for the construc tion of
approximately 80% of these new ships. In recent
years the three yards have refined, stream lined
and increased their LNG carrier production capa-
bilities to the extent that no other yards are able to
construct such vessels as quickly, efficiently and
competitively as this Korean triumvirate.
The capabilities of the Korean shipbuilders
have helped to meet the LNG industry’s burgeon-
ing demand for new vessels over the past decade.
The delivery by Samsung of Tangguh Jaya, a
155,000 m3 membrane tank vessel, to K Line on
December 29, 2008, marked the entry into service
of the 300th vessel in the current world LNG
carrier fleet.
A measure of the pace at which the LNG
carrier fleet has expanded is given by the fact that
it took 34 years, until 1998, for the in-service fleet
of these ships to reach 100 vessels, and a further
eight years, until April 2006, for it to break through
the 200-vessel barrier. The 300-ship mark was
reached, with Tangguh Jaya, just over two and
one-half years later.
l Newbuilding tailspin
However, because no new ships are being
ordered, from 2010 onwards LNG carrier deli-
veries will tail off dramatically. The pace of new
ship ordering had already dropped markedly
before September 2008 due to the overheating
world economy. With rising costs and a lack of
skilled manpower and materials beginning to
delay final investment decisions on new LNG
liquefaction projects as far back as 2007, there
has been no further requirement for new ships.
The last order for conventional LNG carriers was
in January 2008 when Shell Brunei Tankers con-
tracted a pair of 148,000 m3 ships at Daewoo.
Few participants in LNG shipping will feel the
negative impact of the present boom and bust
cycle as much as shipbuilders. Most of the 58
Two Sakhalin II trains are amongst the new LNG production units on stream this year. From left to right at the export terminal’s inauguration ceremony are: HRH Prince Andrew, the Duke of York; Maria van der Hoeven, the Dutch Minister of Economic Affairs; Japanese Prime Minister Taro Aso; and Russian President Dmitry Medvedev.
160 L n G C a r r I e r f L e e T S u r G e S a S T r a d e S T a G n a T e S
Qatar Gas Transport Company, or Nakilat, part
owns or fully owns all 45 vessels in this fleet. By
mid-2009 and within the space of 20 months, the
three yards had delivered 27 of the Q-flex ships
and nine of the Q-maxes, all on time according to
the originally specified completion dates. The
remaining nine of these ships are due to be
completed by June 2010.
The Q-flex and Q-max ships are unlike any
other LNG vessels in service. Their slow speed
diesel propulsion systems are unique to the current
LNG carrier fleet as are their powerful relique-
faction systems which enable all cargo boil-off gas
to be processed and returned to the tanks as LNG.
Each ship is provided with a pair of diesel engines
and a twin propeller and rudder arrangement. The
resultant shallow-draught, wide beam design
provides for a readily manoeuvrable ship with a
hull of superior strength and a full measure of
propulsion system redundancy.
Q-flexes and Q-maxes carry 40 and 70% more
cargo, respectively, than “conventional size” LNG
carriers of 155,000 m3. Nakilat has invested $7.3
billion in the 25 Q-flex and Q-max vessels that it
fully owns, while the total investment for the full
45-ship fleet is $12.5 billion.
The first of the six mega-trains – Qatargas 2
Train 1 – loaded its first LNG cargo in April 2009
after a few minor start-up problems were rectified.
The bulk of this train’s output is earmarked for the
South Hook import terminal at Milford Haven in
South Wales. South Hook was commissioned in
March 2009 and forms part of the world’s first
fully integrated LNG supply chain with Qatar
holding a controlling stake in it as well as in the
production and shipping stages.
l Redirecting Qatar LNG
When the six mega-train projects were originally
conceived, it was envisaged that much of their
output would be directed to customers in the UK
and the US. The LNG market has altered since
then, not least through the discovery of significant
delivered in 2008 and 2009 will never be
equalled.
l Qatar’s large gas carriers
While acknowledging the tough times which lie
ahead, it is worth noting another recent major
achievement by the LNG shipping community, i.e.
the establishment of a 45-ship fleet of the largest
LNG carriers ever built. When Qatargas and
RasGas in Qatar decided earlier this decade to
build, between them, six mega-trains, each
capable of producing 7.8 mtpa of LNG, it was
agreed that optimum economy of scale benefits
could be achieved if the cargoes produced by
these units were carried in large gas carriers with
hull dimensions similar to those of very large
crude oil carriers.
Qatar Petroleum and ExxonMobil, its lead
partner in several of the Qatargas and RasGas
mega-train projects, established a ship design
team to study the options. It was decided that the
transport needs of the new trains could best be
met with the construction of a fleet comprising 31
Q-flex ships of approximately 216,000 m3 and 14
Q-max ships of 265,000 m3 in size and the ships
were duly ordered at the Hyundai, Daewoo and
Samsung yards.
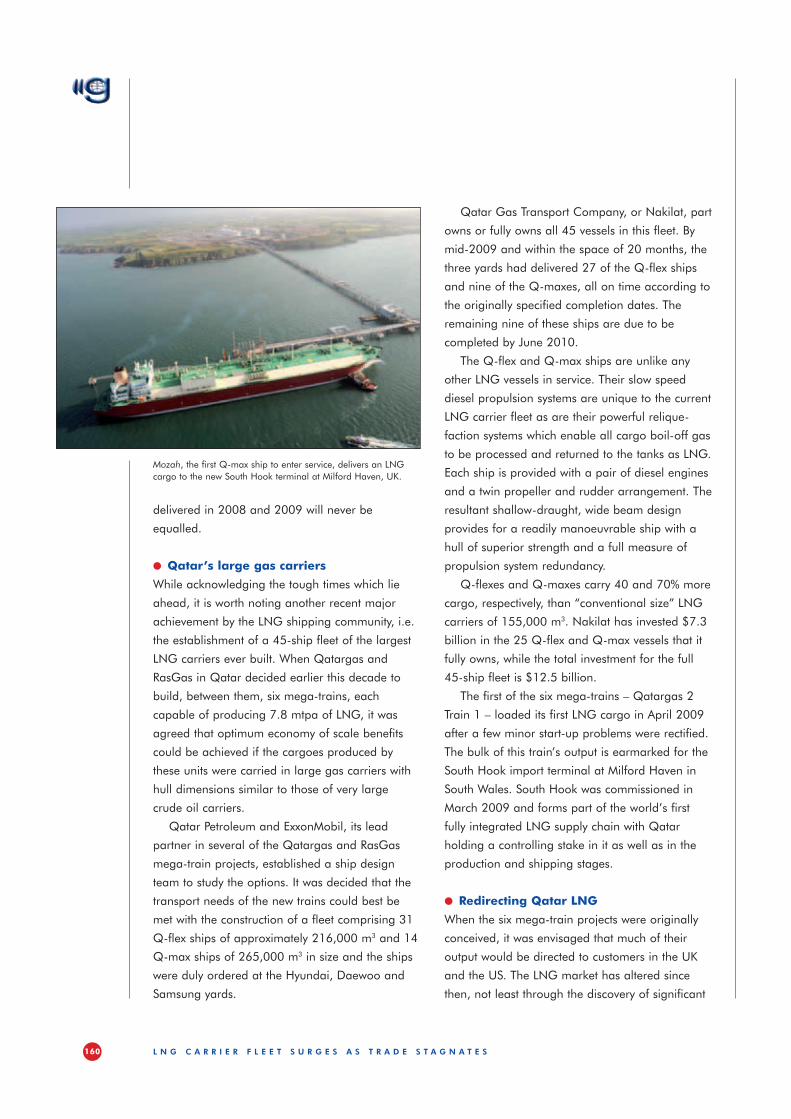
Mozah, the first Q-max ship to enter service, delivers an LNG cargo to the new South Hook terminal at Milford Haven, UK.

161L n G C a r r I e r f L e e T S u r G e S a S T r a d e S T a G n a T e S
pulsion systems and cargo-handling plant on
older vessels are not as efficient as their counter-
parts on the new generation of ships. Today, there
are approaching 40 LNG carriers of 30 years of
age and over. Those not fixed to a particular trade
must be considered as prime candidates for the
breakers yards.
l Opening up offshore
Committed LNG carrier shipbuilders, too, have a
straw to clutch at when considering future oppor-
tunities, i.e. the construction of offshore vessels
and structures. Floating production storage and
offloading (FPSO) vessels, including LNG FPSOs,
represent a sector with particular potential. LNG
FPSOs are recognised as the cheapest, most cost-
effective and most expedient way to develop
stranded offshore gas fields previously considered
too marginal or too remote. The flexibility inherent
in such vessels enables them to be moved to a
new offshore location when one particular
resource is depleted.
The industry has been working for several years
to utilise and combine the technological advances
made in LNG liquefaction, shipping and oil FPSOs
in the development of LNG FPSOs. LNG transfers
at offshore locations present another challenge
that has been the focus of considerable attention.
The first of a number of LNG ship-to-ship (STS)
transfers in open water was carried out in 2005
and the industry has built on this experience in the
ongoing development of a range of loading arm
and cryogenic hose options for offshore transfers.
Samsung already holds orders for four LNG
FPSOs from Flex LNG. These so-called LNG
producers will have a storage capacity of 170,000
m3 for LNG and 50,000 m3 for condensate. Their
hulls will incorporate stainless steel tanks built to
the self-supporting, prismatic shape, IMO type B
(SPB) LNG containment system.
Daewoo is developing an LNG FPSO design in
tandem with Hoegh LNG which is based on the
GTT NO 96 containment system and features a
new sources of domestic gas in the US. While the
two countries will remain important destinations
for mega-train cargoes, a significant share has
become available to other interested customers.
A measure of the underlying strength of gas as
the fossil fuel of choice for the future, despite the
current recession, is given by the fact that a
number of other countries have recently agreed
gas purchase contracts for available cargoes from
the export complex at Ras Laffan in Qatar. Several
Chinese oil and gas companies, for example,
have lined up purchases and are providing the
many new import terminals being constructed in
China with the ability to handle ships up to the
266,000 m3 Q-max size.
l Fleet oversupply
Shipowners with their LNG carriers fixed on long-
term contracts are relatively insulated from the
current period of fleet oversupply and depressed
demand for LNG. In contrast, owners with
unchartered vessels serving the spot market are
faced with much fewer opportunities than were
available 12 months ago and, in cases where
employment can be found, much reduced rates.
Owners with idle vessels are reluctant to lay
them up, especially if the ships are new. The first
year after delivery is the shipyard guarantee
period and the time to discover any ship and
equipment faults that may arise. Also, having
invested in LNG crew training programmes,
shipowners with new ships are keen for crews to
become familiar with shipboard systems and
procedures. As a result, only a handful of LNG
ships are currently in full lay-up.
One possible safety valve for LNG carrier
owners is the scrapping of older LNG carriers.
Traditionally, the LNG shipping community has
been reluctant to countenance scrapping. Such
vessels have long services lives, traditionally of 40
years and prolonged by life extension pro-
grammes. On the other hand, fleet overtonnaging
has never been as great as it is today and pro-

162 L n G C a r r I e r f L e e T S u r G e S a S T r a d e S T a G n a T e S
gas-handling systems onboard the world’s second
floating storage and regasification unit (FSRU)
were being tested prior to the vessel’s commission-
ing. Both FSRUs are converted LNG carriers
owned and operated by Golar LNG and both
have been taken on 10-year charters by Petrobras
for operation at dedicated berths in Pecém port
and the Guanabara Bay. Golar has two more
LNG ships earmarked for FSRU conversions over
the coming year.
A second type of LNG ship capable of regasify-
ing cargo onboard is the LNG regasification
vessel. Excelerate Energy, a US-based LNG
importer and marketer, and the Belgian shipowner
Exmar cooperate in the operation of a fleet of five
Energy Bridge Regasification Vessels (EBRVs) with a
further three due for delivery by June 2010.
The capabilities of the EBRVs are realised
through the dockside GasPort and offshore
Gateway terminal facilities in which Excelerate has
double row of reinforced membrane tanks. For its
part, Hyundai has recently commissioned its H
Dock, the world’s first FPSO-specific drydock, at its
Ulsan yard. The facility is able to accommodate
vessels of up to 1 million tonnes displacement.
Additional contracts for LNG FPSOs are
believed to be imminent. Shell, SBM Offshore,
Teekay and MISC, amongst others, have dev-
eloped generic designs. Accommodating lique-
faction plants on the relatively limited space
available on an FPSO deck presents a particular
challenge and all the shipowners promoting LNG
FPSO projects have formed alliances with specialist
engineering firms which will take responsibility for
the units’ topsides.
l Offshore regasification underway
The drive for floating LNG production units is also
making use of the industry’s accumulating experi-
ence of offshore regasification. At presstime, the
Flex LNG’s first LNG producer vessel will introduce the floating LNG production era in a little over two years time.
163L n G C a r r I e r f L e e T S u r G e S a S T r a d e S T a G n a T e S
will the LNG industry, before long. Chinese
imports, Europe’s push to diversify its sources of
gas and increasing environmental concerns will be
key drivers in the LNG trade revival. A continu-
ation of the present low international gas prices
will also encourage increasing LNG shipments to
the US where a number of large new receiving
terminals have been brought on stream recently.
Shipbuilders will have a relatively long wait
before shipowners return to them with significant
numbers of orders for new LNG vessels. However,
the construction of LNG FPSOs offers one strand
of opportunity in the shorter term for the larger
yards with suitable facilities. While the frenetic
pace of the dash for gas in recent years is unlikely
to be repeated, a steady expansion of the global
LNG infrastructure is on the cards once the
industry emerges from the current trough.
Mike Corkhill is the Editor of LNG World Shipping
and LPG World Shipping, two journals published
by Riviera Maritime Media (www.rivieramm.com).
invested. On the Gateway front, the Northeast
Gateway facility off the coast of Massachusetts
entered into service in April 2009 as the eighth US
LNG import terminal. Gateways make use of
submerged turret loading buoys and subsea
pipelines through which regasified LNG is pumped
to the onshore grid. Northeast Gateway is the
second such facility, Gulf Gateway in the US Gulf
having handled its first cargo in 2005.
As regards GasPorts, the two-year old Teesside
GasPort in the UK received its first full cargo of
LNG earlier in 2009 while Argentina has recently
signed up for two more years of GasPort deliveries
at its Bahía Blanca facility. Bahía Blanca became
the first port in South America to import LNG
when operations started in May 2008. Elsewhere,
Kuwait is poised to inaugurate a GasPort oper-
ation at the port of Al-Ahmadi, while Belgium and
Pakistan are carrying out feasibility studies.
In a typical GasPort operation the EBRV
remains berthed at a dedicated dockside facility
and LNG is delivered to the vessel by means of
conventional LNG carriers. This operation makes
use of STS cargo transfers using special cryogenic
hoses. The EBRV then regasifies the LNG at the
required rate and discharges it directly into the
local gas grid via a high-pressure offloading arm.
Excelerate points out that it took less than six
months to construct the Bahía Blanca GasPort and
bring it into operation.
l Back to the future
Although the world LNG carrier fleet expanded by
20% in numerical terms in 2008, to reach 300
ships, it only completed approximately 3300
loaded voyages and delivered some 170 million
tonnes of LNG. This was marginally less than the
number of cargoes carried in 2007.
In the current economic climate, despite the
start-up of eight new LNG liquefaction trains in
2009, it is difficult to see much improvement in
the total number of LNG carrier voyages this year.
Nevertheless, the market for gas will rebound, as
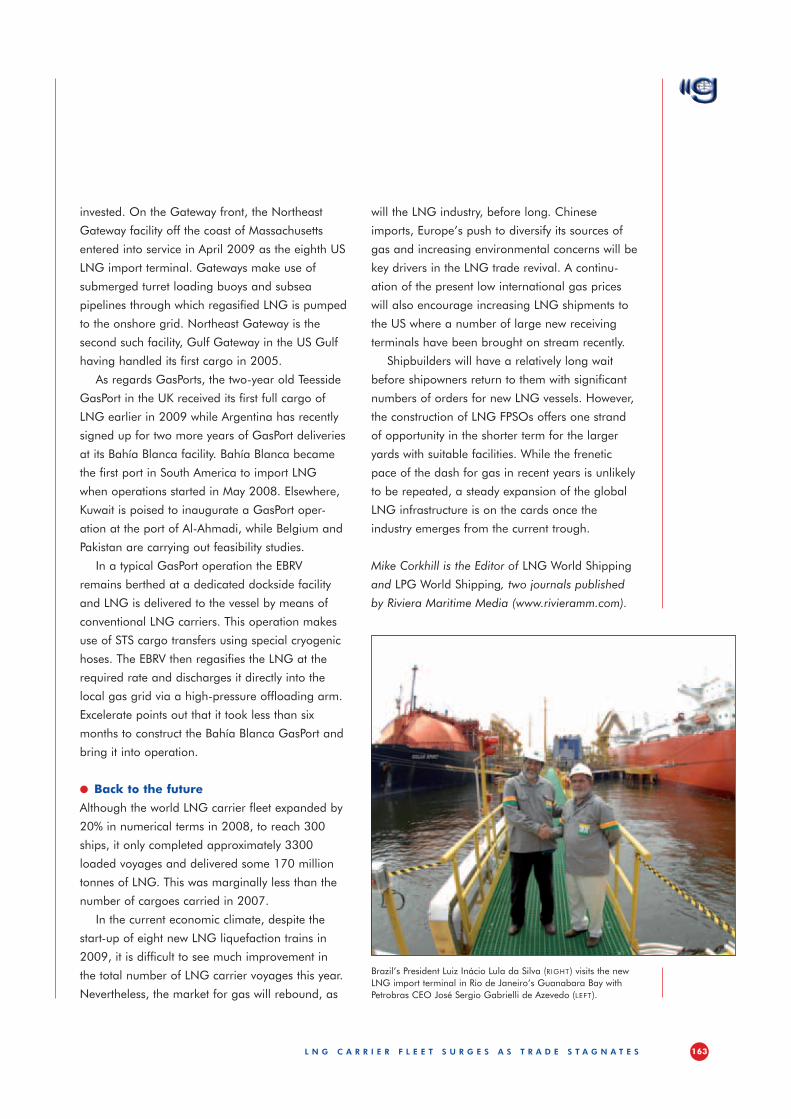
Brazil’s President Luiz Inácio Lula da Silva (right) visits the new LNG import terminal in Rio de Janeiro’s Guanabara Bay with Petrobras CEO José Sergio Gabrielli de Azevedo (left).
Non-stop LNG operationsby Kees den Bakker – Shell Global Solutions International B.V.
v Introduction - If you think safety is expensive then think about the cost of an accidentDo you feel comfortable driving a car at over 200 km/h or hanging off a cliff? We all know that exceeding safety limits means danger. So why would you risk operating a liquefied natural gas (LNG) plant outside its design limits?
Why is operating within limits important? Over the last few decades, several serious industrial incidents have occurred including: the Texas City refinery explosion, the Piper Alpha fire, the Longford gas explosion, the Bhopal toxic gas leak, and the Flixborough chemical plant explosion. These incidents cost lives and caused major damage to installations and the environment. The investigations have shown that the causes of these inci dents were very similar and were often related to oper ations outside the design limits (an abnormal situation).
Examples include the overriding of safeguarding functions, alarms not working and no handover between shifts. Why is it possible that these incidents could be repeated? The message here is clear: without a culture of learning in place, incidents can and do happen, irrespective of past experience.
LNG plants have hazards that can potentially lead to an incident when not managed well, for example:v LNG plants operate a continuous process with no
hold up vessels. Process upsets could result in flaring or, when not properly safeguarded, in gas releases into the atmosphere potentially resulting in an explosion.
v The operating environment is often corrosive (salt spray, high ambient temperatures). A particular hazard is corrosion under insulation, which is diffi cult to inspect. Such corrosion can cause leaks in a pipe or vessel that could release gas in to the atmosphere.
v Power generation is often in island mode (not connected to public power grid). Thunder storms (lightning) or other upsets can cause a power black-out that may disturb LNG produc tion for days.To prevent incidents LNG asset owners require
systems and processes that reduce the risks in their plant below acceptable levels.
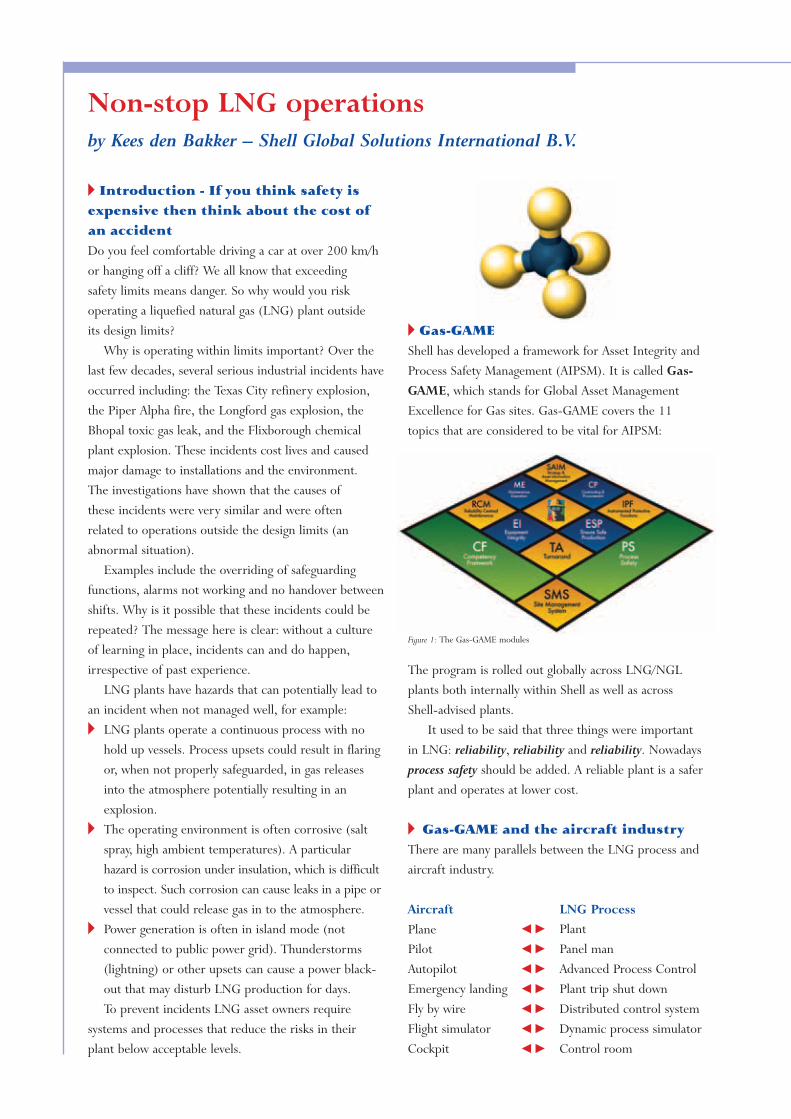
v Gas-GAMEShell has developed a framework for Asset Integrity and Process Safety Management (AIPSM). It is called Gas-GAME, which stands for Global Asset Management Excellence for Gas sites. Gas-GAME covers the 11 topics that are considered to be vital for AIPSM:
The program is rolled out globally across LNG/NGL plants both internally within Shell as well as across Shell-advised plants.
It used to be said that three things were important in LNG: reliability, reliability and reliability. Nowadays process safety should be added. A reliable plant is a safer plant and operates at lower cost.
v Gas-GAME and the aircraft industryThere are many parallels between the LNG process and aircraft industry.
Aircraft LNG ProcessPlane CV PlantPilot CV Panel manAutopilot CV Advanced Process ControlEmergency landing CV Plant trip shut downFly by wire CV Distributed control systemFlight simulator CV Dynamic process simulatorCockpit CV Control room
Figure 1: The Gas-GAME modules
The aircraft industry has an excellent safety record which is the result of putting in place the right framework of systems, procedures and behaviours. These include a safety management system, reliability management, standard ways of working such as procedures/checklists, training on abnormal situation management (ASM), learning from incidents, communication protocols and so on. Much of this can be applied to the gas processing industry and this is the aim in Gas-GAME.
Did you know that the best landings are made on autopilot? The best plant operations are carried out by automated procedures.
Gas-GAME builds on the following key elements:v the requirements for process safety and asset
integrity (the Standard);v the work process (go with the flow); andv key performance indicators (KPI) and audit protocol
(you cannot control what you do not measure).
Critical to the success of Gas-GAME is program change management (PCM). The implementation of Gas-GAME means changes in behaviours and organisation. PCM drives the effort from design to implementation and sustains the result. It addresses:v leadership alignment;v communication; andv stakeholder management.
PCM is all about getting Gas-GAME into the “hearts and minds” of people.
v Gas-GAME - Real at Nigeria LNGAt Nigeria LNG, the implementation of the Gas-GAME programme is halfway through but a number of interesting results have already been achieved. Four mini case studies outline the progress.
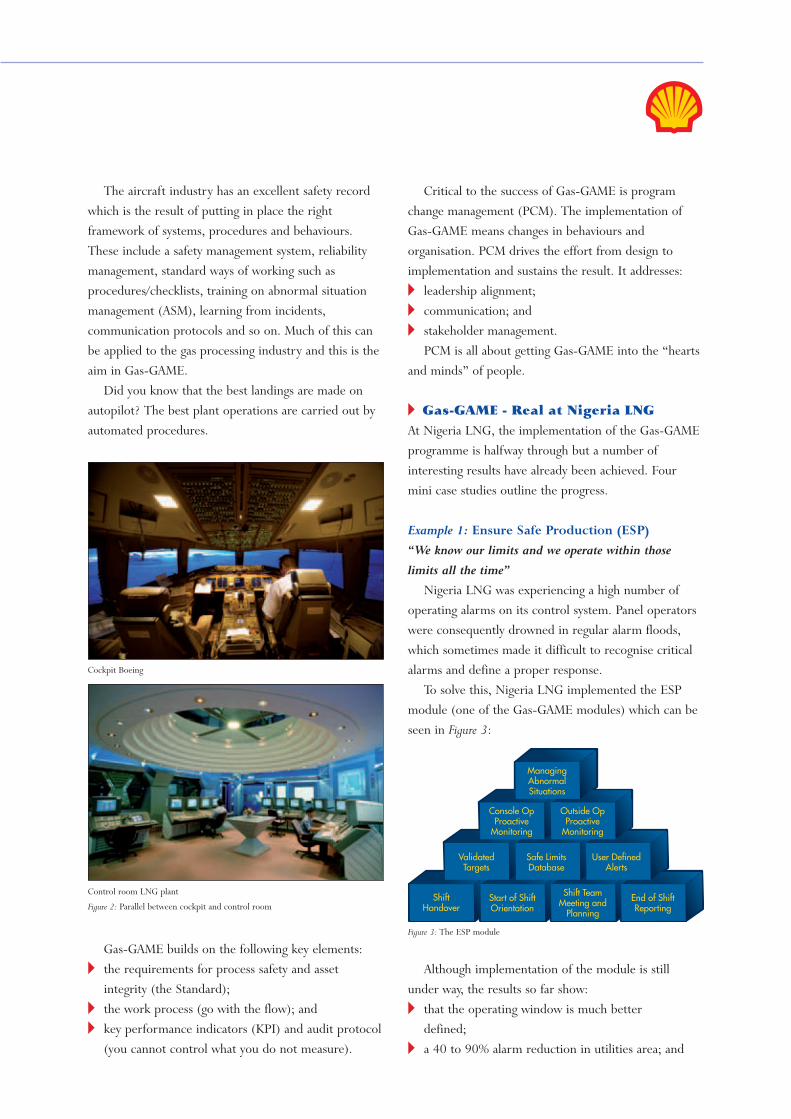
Example 1: Ensure Safe Production (ESP) “We know our limits and we operate within those limits all the time”
Nigeria LNG was experiencing a high number of operating alarms on its control system. Panel operators were consequently drowned in regular alarm floods, which sometimes made it difficult to recognise critical alarms and define a proper response.
To solve this, Nigeria LNG implemented the ESP module (one of the Gas-GAME modules) which can be seen in Figure 3:
Although implementation of the module is still under way, the results so far show:v that the operating window is much better
defined;v a 40 to 90% alarm reduction in utilities area; and
Figure 2: Parallel between cockpit and control room
Figure 3: The ESP module
ShiftHandover
Start of ShiftOrientation
Shift TeamMeeting and
PlanningEnd of ShiftReporting
ValidatedTargets
Safe LimitsDatabase
User DefinedAlerts
Console OpProactive
Monitoring
Outside OpProactive
Monitoring
ManagingAbnormalSituations
ShiftHandover
Start of ShiftOrientation
Shift TeamMeeting and
Planning
End of ShiftReporting
ValidatedTargets
Safe LimitsDatabase
User DefinedAlerts
Console OpProactive
Monitoring
Outside OpProactive
Monitoring
ManagingAbnormalSituations
Cockpit Boeing
Control room LNG plant

v that communication during shift handover has been improved.
Example 2: Operator task management (OTTER®) “Small tasks drive big results”At Nigeria LNG the outside operator is accompanied on his rounds by a ‘friend’. This is OTTER (Operational and Technical Tasks for Efficient Rounds), a handheld device comparable to a PDA or palmtop. OTTER contains operational or maintenance tasks obtained from a reliability integrity system (e.g. Reliability Centred Maintenance) and it is used to navigate the operator from location to location.
At Nigeria LNG the use of OTTER has empowered the field operators. The results from using OTTER are:v structured outside operator rounds;v well defined operating limits and abnormal
situation management;v improved situational awareness of the outside
plant condition;v reduced downtimes;v increased availability upon demand of standby
equipment; andv reliability improvements increased the mean time
between maintenance.The proactive monitoring strategy using
OTTER provides a platform to improve Nigeria LNG’s operations, environmental compliance and process safety.
Example 3 – Maintenance Execution“doing the right job, at the right place and time, with the right tools and the right people”Best-in-industry operations proactively plan over 95% of all their maintenance activities and have less than 5% of reactive maintenance (i.e. schedule breakers).
Properly prepared and scheduled work is three to four times less costly than unprepared work. Not having the correct parts, tools and skills in the right place at the right time can result in waste in the form of:v delays, confusion and lost time;v inadequate co-ordination of materials that results in
false starts, delays or makeshift repairs;v poor co-ordination of crafts/disciplines that means
excessive waiting time and idle personnel;v poor timing of equipment isolation and shutdown
leading to excessive downtime; andv poor quality of work which jeopardises future
reliability.The ME module provides the capability to move
towards “best-in-industry” performance. For example, at Nigeria LNG an “Efficiency Improve-
ment Programme” has been introduced to support their implementation of the maintenance execution module. Benefits realised from the program include:v production of a new (6th) LNG train started with
the same manpower as for 5 LNG trains;v better planning and scheduling to support the
drive towards a more proactive culture; andv improved discipline of people and productivity
through the use of robust maintenance management control systems.
v ConclusionIncidents have happened and, unfortunately, may happen again. But they should not happen so it is time for change.
Building on its many years of operational experience and knowledge in gas, Shell has created Gas-GAME, a framework to improve Asset Integrity and Process Safety.
Gas-GAME is applied to Shell-advised gas facilities around the world. Nigeria LNG, a Shell-advised Company, is a front-runner with Gas-GAME and is already experiencing the benefits.
Figure 5: OTTER handheld device
Figure 4: Alarm reduction after ESP introduction in May 2008.
No.
of A
larm
s
Month
Plantwide Total Alarms
Before ESP After ESP
TotalTarget
Oct - 07 Dec - 07 Jan - 08 Mar - 08 May - 08 Jun - 08 Aug - 08

THE
START
RIG
HT
AN
SWER
S WITH RIGHTQUESTIONS
THE
IT,S A STATEMENT OF THE OBVIOUS, BUTIN OUR EXPERIENCE, IT,S ONE THAT OFTENGETS OVERLOOKED — PARTICULARLYWHEN THE QUESTIONS BEING TACKLEDMAY BE HIGHLY COMPLEX. OUR GETTINGTO THE HEART OF SOMETHING COMESFROM BEING ABLE TO PUT TOGETHER ANINTEGRATED TEAM FROM DIFFERENTBACKGROUNDS — ONE THAT SPECIALISESIN ASKING THE RIGHT QUESTIONS. THISPRETTY MUCH SUMS UP HOW WE WORK,BOTH AMONG OURSELVES AND WITHOUR CLIENTS.
REAL SOLUTIONS FOR THE REAL WORLD.www.shell.com/globalsolutions
840316 Shell Q&A 297X210.qxd 12/11/08 12:47 Page 1

168 L I f e C Y C L e a S S e S S m e n T O f T h e e u r O p e a n n a T u r a L G a S C h a I n – a e u r O G a S - m a r C O G a z S T u d Y
associated with a product or activity over its life
cycle. Considering the whole life cycle helps to
ensure that no environ mental burdens are shifted
to other phases or among different impacts.
Until now, however, the European natural gas
industry has not developed a detailed LCA. Only
IGU has produced a worldwide LCA, which was
presented at the 23rd World Gas Conference
in 2006.
l Aims
In a context of development of life cycle oriented
regulations and the launching of the European
Reference Life Cycle Data System (ELCD) project
supporting business and policymaking in Europe
with reference data and recommended methods
on LCA, the Eurogas-Marcogaz Joint Group
“Environment, Health & Safety” decided to set up
a working group on this topic and to establish an
LCA of the European natural gas chain in order to
determine the environmental footprint of the whole
natural gas chain, utilisation included.
Life cycle assessment (LCA) is a method aimed at
assessing and accounting for the specific impacts
of all the contri butions from all the activities/
processes needed for the production of a
particular good or service in the whole chain
(“from cradle to grave”).
Initially, LCA was developed by and for industry
in order to make strategic decisions concerning
the environment and was broadly used in the
1990s to manage global environmental problems.
According to the ISO 14040 and 14044 stan-
dards, LCA is a global environmental assessment
method to evaluate the environmental burdens
(global warming, resource depletion, etc.)
Life Cycle assessment of the european natural Gas Chain – a eurogas-marcogaz StudyBy M. Papadopoulo, S. Kaddouh, E. Dridi-Dastrevigne, A. Cigni and D. Hec
The Eurogas-Marcogaz LCA covers all steps of the natural gas chain – a gas-fired combined cycle power plant under construction in Kårstø, Norway.

169L I f e C Y C L e a S S e S S m e n T O f T h e e u r O p e a n n a T u r a L G a S C h a I n – a e u r O G a S - m a r C O G a z S T u d Y
Marcogaz LCA are the following:
l Global warming potential (GWP);
l Acidification potential (AP);
l Non-renewable energy demand.
l Results and conclusions
A confirmation of the good performances
of natural gas
The results of the Eurogas-Marcogaz LCA confirm
the good performances of natural gas as a fuel
(see Figure 1). One kWh of useful heat produced
from natural gas with a best available technology
generates about 230 grams of CO2-equivalent on
its whole life cycle; the kWh of electricity produced
with a natural gas combined cycle emits 393
grams of CO2-equivalent. Generally the results
support the figures used in existing generic LCA
databases [2] for global warming and non-
renewable energy resources depletion although
both impacts are slightly lower in this study.
A low contribution of the natural gas
upstream chain to the total GWP of heat
and electricity supply
The utilisation phase (combustion at power plant
or boiler) is predominant in terms of greenhouse
gas emissions: its contribution exceeds 85% of the
total GHG emissions. CO2 is by far the main sub-
l Scope of the study
The Eurogas-Marcogaz LCA covers all steps of the
natural gas chain for the year 2004: from produc-
tion to utilisation, including transport by pipelines
and tankers, liquefaction, gasification and distri-
bution of natural gas. Three different utilisations
based on the best available technologies (BAT) are
considered [reference 1]:
1 Electricity production with a natural gas
combined cycle;
2 Heating with condensing boilers (domestic and
commercial use);
3 Combined heat and power production
(domestic and commercial use).
l Substances and impacts considered
It was decided to focus on the main environmental
impacts of the systems studied, for which
Marcogaz can provide a real added value
regarding the data quality [3]. The following
substances have therefore been considered:
l Atmospheric emissions: greenhouse gases
(CO2, CH4, CO, N2O), acidifying emissions
(NOx, SOx), particulate matters, non methane
volatile organic compounds;
l Energetic consumptions: natural gas, oil, coal,
uranium, hydropower.
The associated impacts used in Eurogas-
For 1kWh GWP (geq CO2) AP (mg eq SO4) Non renewable energy depletion (kWh)
Heat at boiler – domestic use 236 129 1.12
Heat at boiler – services and buildings 224 120 1.09
Heat at CHP – domestic use 243 168 1.15
Heat at CHP – services and buildings 232 189 1.07
Electricity at CHP – domestic use 243 168 1.15
Electricity at CHP – services and buildings 228 186 1.06
Electricity at combined cycle plant 393 257 1.90
reSuLTS Of The eurOGaS -marCOGaz LCaleft
Figure 1.

170 L I f e C Y C L e a S S e S S m e n T O f T h e e u r O p e a n n a T u r a L G a S C h a I n – a e u r O G a S - m a r C O G a z S T u d Y
environmental per-
formances of the
different supply chains
of natural gas arriving
in Europe1 (see Figure
3) as is illustrated in
the following
examples:
l The production of
heat with a condensing
boiler from natural
gas coming to Europe
as LNG emits about
27% more GHG than
heat production with
natural gas coming
from European
countries through
conventional pipelines.
This is mostly due to
the high energetic
consumption of
existing liquefaction units and shows the
strategic importance of investing in highly
efficient liquefaction plant projects, such as the
Snøhvit liquefaction plant in Norway, which
should be two times less energy-consuming
than existing liquefaction plants.
l Heat production from Russian natural gas emits
about 20% more GHG than heat production
with natural gas coming from European
countries. This is mainly due to the distance
covered from the Siberian fields to the EU-25
(about 5000 kilometres); in comparison, the
distance covered from the European production
fields is 1000 kilometres on average. The
choice of a specific leakage rate on the Russian
export pipeline systems has a low impact on
the final results: a sensitivity analysis showed
1 European gas chains: mix of natural gas coming from Norway, Great Britain, Germany and The Netherlands to EU-25. LNG chains: mix of natural gas coming as LNG from Algeria, Qatar and Nigeria to EU-25. Russian chain: natural gas coming from Russia to EU-25.
stance contributing to climate change, accounting
for about 95% of the GHG emissions, while
methane emissions account for the remaining 5%.
In terms of acidification, utilisation (40 to 53%),
production/processing (27 to 35%) and inter-
national pipeline transmission (12 to 15%) are the
main steps contributing to this impact. NOx
emissions occurring during natural gas com-
bustion in power plants and boilers and in
compressor drivers (for liquefaction and pipeline
transmission) account for about 80% of the
acidifying emissions, SOx emissions representing
the other 20%. Those are mainly emitted during
production/sweetening of the sour natural gas
produced in Russia and Germany, as well as
during LNG transport through the use of heavy
fuel oil as propulsion energy. (See Figure 2.)
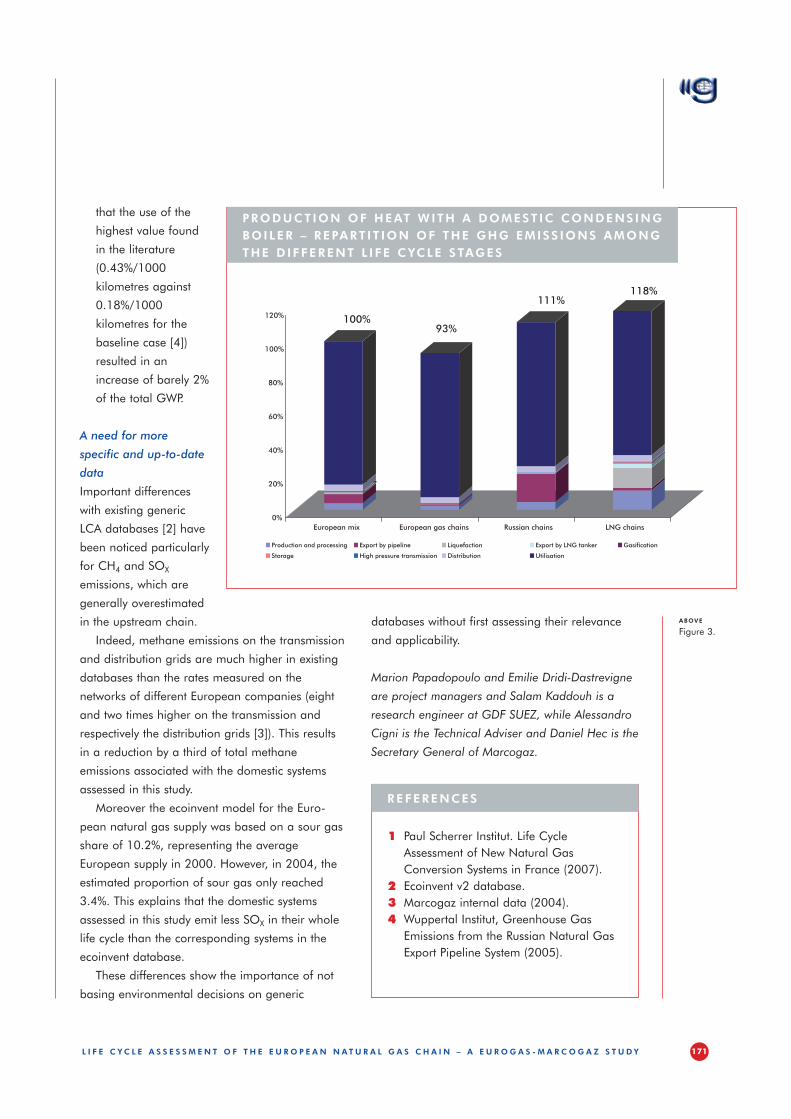
A possibility to identify differences between the
supply chains
This LCA also allows the assessment of the
89% 85%
31%
14%
48%
35%
15%
40%
0%
20%
40%
60%
80%
100%
Electricity at NGCC Heat at boiler, domestic use Electricity at NGCC Heat at boiler, domestic use
Global warming Acidification
Production/Processing Transmission by pipeline LiquefactionExport by LNG tanker Gasification in Europe Storage in EuropeHigh pressure transmission in Europe Low pressure distribution in Europe Utilisation
COnTr IbuT IOn Of eaCh STep TO GLObaL warmInG and aC Id If ICaT IOn fOr eLeCTr IC I TY prOduCT IOn wITh a COmbIned (nGCC) CYCLe and heaT prOduCT IOn wITh a dOmeST IC bOI Ler
above
Figure 2.
171L I f e C Y C L e a S S e S S m e n T O f T h e e u r O p e a n n a T u r a L G a S C h a I n – a e u r O G a S - m a r C O G a z S T u d Y
databases without first assessing their relevance
and applicability.
Marion Papadopoulo and Emilie Dridi-Dastrevigne
are project managers and Salam Kaddouh is a
research engineer at GDF SUEZ, while Alessandro
Cigni is the Technical Adviser and Daniel Hec is the
Secretary General of Marcogaz.
that the use of the
highest value found
in the literature
(0.43%/1000
kilometres against
0.18%/1000
kilometres for the
baseline case [4])
resulted in an
increase of barely 2%
of the total GWP.
A need for more
specific and up-to-date
data
Important differences
with existing generic
LCA databases [2] have
been noticed particularly
for CH4 and SOx
emissions, which are
generally overestimated
in the upstream chain.
Indeed, methane emissions on the transmission
and distribution grids are much higher in existing
databases than the rates measured on the
networks of different European companies (eight
and two times higher on the transmission and
respectively the distribution grids [3]). This results
in a reduction by a third of total methane
emissions associated with the domestic systems
assessed in this study.
Moreover the ecoinvent model for the Euro-
pean natural gas supply was based on a sour gas
share of 10.2%, representing the average
European supply in 2000. However, in 2004, the
estimated proportion of sour gas only reached
3.4%. This explains that the domestic systems
assessed in this study emit less SOx in their whole
life cycle than the corresponding systems in the
ecoinvent database.
These differences show the importance of not
basing environmental decisions on generic
1 Paul Scherrer Institut. Life Cycle Assessment of New Natural Gas Conversion Systems in France (2007).
2 Ecoinvent v2 database.3 Marcogaz internal data (2004).4 Wuppertal Institut, Greenhouse Gas
Emissions from the Russian Natural Gas Export Pipeline System (2005).
referenCeS
0%
20%
40%
60%
80%
100%
120%
European mix European gas chains Russian chains LNG chains
Production and processing Export by pipeline Liquefaction Export by LNG tanker Gasification
Storage High pressure transmission Distribution Utilisation
100%93%
111%118%
prOduCT IOn Of heaT wITh a dOmeST IC COndenS InG bOILer – reparT I T IOn Of The GhG emISS IOnS amOnG The d IfferenT L I fe CYCLe STaGeS
above
Figure 3.
Mokveld was founded in 1922 in Gouda in the Netherlands. In the mid-fifties the company started making valves, a development which accelerated when the Nederlandse Aardolie Maatschappij B.V. (joint ven-ture between Shell and ExxonMobil) discovered the Groningen gas field in 1959. Mokveld started delivering valves for the production of the billions of cubic meters of gas and over the years was challenged to respond to constant changes with respect to safety, noise and emissions.
Now, 50 years later, the company has gained an excellent reputation as an international supplier of quality valve products. Not just a valve manufacturer, however, a niche player committed to contribute to safe, reliable and sustainable dev-elopment of the world’s energy resources. Two important products in this perspective are the High Integrity Pressure Protection System (HIPPS) and the axial control valve.
v High Integrity Pressure Protection System (HIPPS)A HIPPS is a type of safety instru-mented system designed to prevent over-pressurisation of a plant or pipe-line. The HIPPS will shut-off the source of the high pressure before the design pressure of the system is exceeded, thus preventing loss of con-tainment through rupture (explosion).
In conventional systems over-pressure is dealt with through relief systems. Disadvantages are release of process fluids or their combustion
products into the environment and a large footprint of the installation. Con-ventional relief systems are no longer acceptable and HIPPS pro vides a popular solution in cases where:v high-pressures and/or flow rates
are processed v the environment is to be
protected v the economic viability of a
development needs improvement v the risk profile of the plant must
be reduced
In the early 1970s Mokveld supplied the first HIPPS to (EON-) Ruhrgas for protection of the German Gas Grid. As market leader Mokveld has developed and pro moted this technology for almost 40 years now. Final element in Mokveld HIPPS is the axial on-off valve and actuator with thoroughly docu mented reliability data
v Axial Control ValveControl valves are critical elements in a process loop. Malfunction or failure of a control valve can seriously affect safe plant operation and the environment. Selecting a valve with proven reliable performance will help to reduce costly maintenance and lost production time.
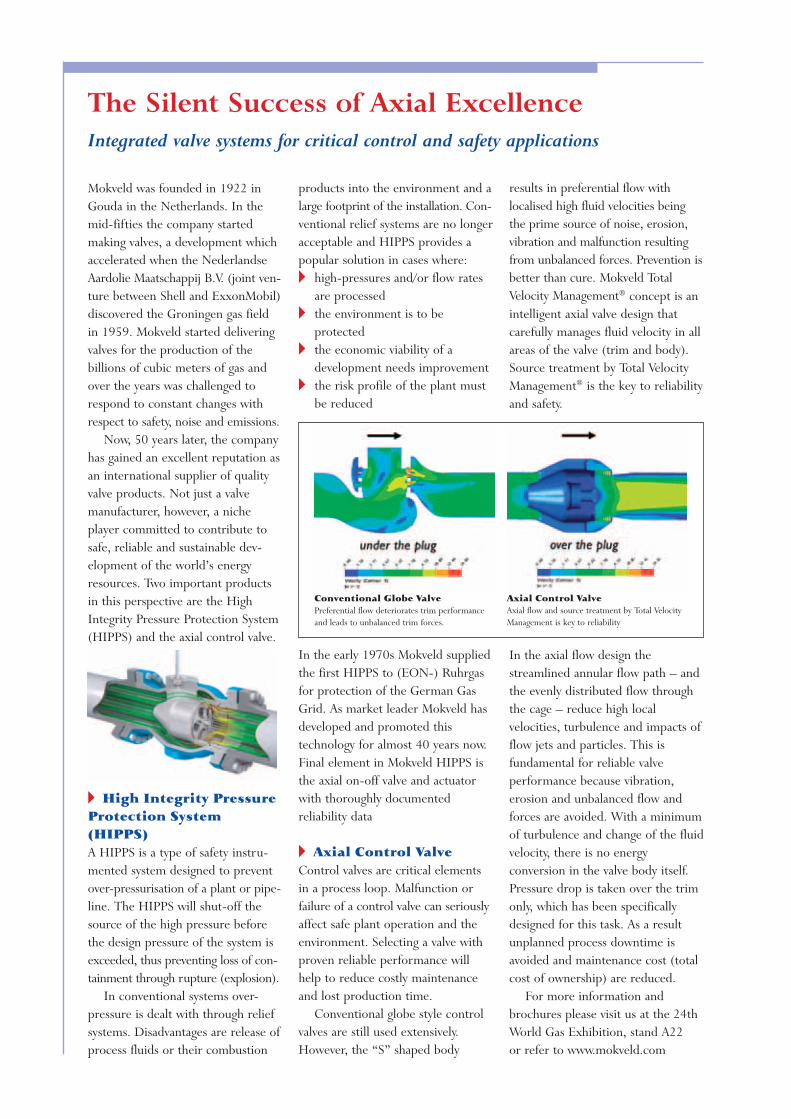
Conventional globe style control valves are still used extensively. However, the “S” shaped body
results in preferential flow with localised high fluid velocities being the prime source of noise, erosion, vibration and malfunction resulting from unbalanced forces. Prevention is better than cure. Mokveld Total Velocity Management® concept is an intelligent axial valve design that carefully manages fluid velocity in all areas of the valve (trim and body). Source treatment by Total Velocity Management® is the key to reliability and safety.
In the axial flow design the streamlined annular flow path – and the evenly distributed flow through the cage – reduce high local velocities, turbulence and impacts of flow jets and particles. This is fundamental for reliable valve performance because vibration, erosion and unbalanced flow and forces are avoided. With a minimum of turbulence and change of the fluid velocity, there is no energy conversion in the valve body itself. Pressure drop is taken over the trim only, which has been specifically designed for this task. As a result unplanned process downtime is avoided and maintenance cost (total cost of ownership) are reduced.
For more information and brochures please visit us at the 24th World Gas Exhibition, stand A22 or refer to www.mokveld.com
The Silent Success of Axial ExcellenceIntegrated valve systems for critical control and safety applications
Conventional Globe ValvePreferential flow deteriorates trim performance and leads to unbalanced trim forces.
Axial Control Valve Axial flow and source treatment by Total Velocity Management is key to reliability

Excellent valvesonly the looks can be improved
First-class valve systems - high qualityand reliable performance according to customer satisfactory survey.
other masterpieces?www.mokveld.com
MZ-14597_adv DutchMasters.indd 1 11-12-2008 10:23:09

174 r e S e a r C h C O L L a b O r a T I O n
time, the ability to fund new projects anywhere in
the world was expanding apace. In short, the gas
industry had entered one of the most energised
phases in its history, and was positioned to
rightfully take its place as the essential fuel that
would enable the next generation of energy to
develop, take hold and flourish.
Three years later, the world is dramatically
different. The challenges above, then seen as the
stimuli of opportunity, are now being felt as a
significant drag on the ability of the industry to
achieve sustainability, let alone predominate, in
the energy mix. In the face of these dramatically
changed circumstances, it is increasingly clear that
the industry must recommit to innovation in order
to achieve significant progress while optimising its
resources and increasing its efficiency and
effectiveness.
Production and utilisation are the two terminal
links of the natural gas value chain, and each will
require new investment in innovation, the primary
component of which is research.1 However, as the
safety razor was to the blade, the cell phone is to
mobile communication services and the medical
device is to life-saving drugs, so pipelines are the
core component to delivering the value and
impact of natural gas. The ability of the pipeline
industry to play its vital role will depend heavily
upon innovation through research. As the natural
gas industry redefines and repositions itself in a
rapidly evolving world – economically, environ-
mentally and socially – the role and value of
pipelines will be essential to the industry’s success.
In 2006, PRCI, in conjunction with several US
pipeline industry stakeholders and regulators
published a report on “The Role of Energy
Pipelines and Research in the United States”.
Although focused on the natural gas and the oil
As IGU delegates left Amsterdam for home after
the 23rd World Gas Conference in June 2006, the
gas industry was, like most industries, riding the
crest of rapidly expanding opportunities brought
on by the new globalism in business and trade,
the growing need to confront serious, systemic
environmental threats, and a rapidly changing
workforce and the means and mechanisms by
which work would be performed. At the same
research Collaboration – meeting the Challenges facing the natural Gas pipeline IndustryBy George W. Tenley, Jr.
Pipelines such as the West-East in China are the core component to delivering the value and impact of natural gas.
1 As used here, research is comprised of two elements developed either independently or, more commonly, in concert: “knowledge”, its generation, enhancement and application; and “technology”, the development of new mechanisms, tools and equipment used in all aspects of the operation of the pipeline infrastructure.

175r e S e a r C h C O L L a b O r a T I O n
l Pipelines are thoroughly regulated to assure
both economically-sound and safe operations;
thus, a key research emphasis has been, and
will continue to be, the development of sound
technical bases for standards, regulations and
best practices.
When the current global challenges are
overlaid on these characteristics, a picture
emerges of where the pipeline industry must focus
its research resources. Increasingly, the natural gas
pipeline industry will need to respond to the
following needs:
l Optimising the costs of the new and
replacement infrastructure, including –
z New pipeline designs that better account for
the actual operating parameters under which
the pipe will operate.
z Stronger, higher-grade, thinner-wall pipe and
and petroleum products pipeline industries (hence
the term “energy pipelines”) in the US, several of
the unique characteristics described in the report
apply to pipelines around the world. Key among
those characteristics with the widest global
relevance are the following:
l Pipelines are the safest mode of transpor tation,
and offer the greatest opportunity to trans port
massive quantities of essential fuels over great
distances in the most cost-effective and timely
manner.
l Pipelines are capital-intensive, long-lived assets
and complete replacement is rarely an option,
so robust maintenance regimes are essential.
l Pipelines are generally buried, making
evaluation of the line’s condition by visual
inspection difficult; thus, research by pipeline
operators and their vendors has resulted in
mechanisms to inspect the lines internally and
to detect leaks.
l Pipeline failures, while rare, can have cata-
strophic consequences due to the hazardous
commodities they carry and the threat they
pose to life, health and the environment; thus,
research has focused on understanding failure
mechanisms and developing practices to
prevent and mitigate failures.
l Transmission pipelines are generally made of
steel, and therefore are susceptible to corro-
sion; thus, research has supported a wide and
intensive programme for corrosion prevention
and control.
l Pipelines operate in right-of-ways across pro-
perty typically owned by others thus presenting
pipeline security and protection challenges.
Accordingly, pipeline research has focused on
how to protect the assets outside of company-
controlled facilities.
l Pipelines are designed and constructed with
large margins of safety, and the industry is
continually developing ways to set and measure
operating parameters that were previously not
measurable. Route markers for a gas pipeline in Italy – pipelines operate in right-of-ways across property typically owned by others.

176 r e S e a r C h C O L L a b O r a T I O n
expansions and enhancements to meet new
system demands, opportunities and mandates.
l Assuring the industry can effectively discharge
its responsibilities to operate in an environ-
mentally sound manner, including –
z Reducing greenhouse gas emissions.
z Enabling the continuing service of older
engines while more effectively monitoring and
controlling emissions.
z Assuring that products flow with the lowest
practicable loss to the atmosphere.
Given the wide diversity these characteristics,
challenges and needs suggest – in location, age,
operating parameters and products – the focus
and outcomes of research must be equally diverse.
To develop and achieve a diverse research agenda
with the resources available, the pipeline industry
depends heavily upon collaboration. This is true
even for companies who have their own, relatively
robust research programmes. In terms of inter-
national reach, breadth of participants and
impact, one of the most significant collaborations
in pipeline research is the one formed by the
tripartite partnership of the European Pipeline
Research Group (EPRG), Australian Pipeline
Industry Association (APIA) and Pipeline Research
Council International (PRCI), each of whom
operates under its own collaborative, voluntary
model. Together, the three organisations have 110
members operating on five continents, the majority
of whom are pipeline operating companies. This
pipeline membership is augmented by steel and
pipe manufacturers, inspection tool and equip-
ment manufacturers, engineering and construction
firms and field service providers.
Beginning 34 years ago as a bilateral relation-
ship between EPRG and PRCI, the partnership was
formally expanded in 2005 to a trilateral arrange-
ment with the addition of APIA, operating through
its Research and Standards Committee. The
cornerstone of the partnership is a biennial joint
technical meeting on pipeline research, the 17th
of which was held in Milan, Italy in May 2009.
the welding means and mechanisms to
enable its widest use, particularly in harsh
environments.
z Construction and installation enhancements
that enable faster and more cost-effective
project completion consistent with safety and
a smaller environmental footprint.
z More efficient (e.g., flexible) and environ-
mentally-sound engines and facilities that
provide system flexibility while reducing
emissions and fuel usage.
l Enabling the pipeline infrastructure to transport
emerging non-traditional products in a safe
and cost-effective manner, including ethanol,
biofuels, CO2 and hydrogen.
l Assuring the integrity and reliability of the
existing infrastructure upon which new service
will be built, including –
z Effectively, including cost-effectively, identify-
ing damage to pipelines and determining the
best means to prevent or manage it.
z Deploying the means to determine the status
of the right-of-way to prevent intrusion and
impact on the pipe.
z Improving pipeline facilities to enable future
One of the most significant collaborations in pipeline research is the one formed by EPRG, APIA and PRCI.
177r e S e a r C h C O L L a b O r a T I O n
these assets across such a diverse spectrum of
need and opportunity, every form of leverage is
necessary, and the key leveraging mechanism in
pipeline research is collaboration.
When IGU’s 2006-2009 Triennium comes to a
close with the 24th WGC in Buenos Aires in
October, the natural gas industry will be well on its
way to understanding how it will need to meet the
present challenges to assure it remains the world’s
best hope for what remains of the hydrocarbon
future. That future will be characterised increas-
ingly by government policies designed to reconcile
the environmental challenges of climate change
with the growing world demand for energy. This
reconciliation will require a broad commitment to
innovation across all of the natural gas value
chain. Fortunately for the pipeline sector, research
continues to be a key source of innovation
because of the commitment to collaboration in all
dimensions of the effort.
However, to sustain its remarkable success over
the years, the research enterprise must continue to
attract the industry’s leading companies who will
be called upon to commit their resources in the
form of both funding and, as important, their
technical and operating expertise. Without
question, the ability of the industry to continue to
sustain and grow its research collaboration, and
for leading companies to play their essential role
in it, will depend heavily upon how they confront
the challenges of a rapidly changing workforce.
Because collaborative research depends so heavily
upon the technical and operating expertise that
participating companies contribute to the effort,
the declining knowledge base and the large
infusion of junior engineers and technicians will
mean the overall pool of participating companies
must expand. For the 2009-2012 Triennium, this
challenge may turn out to be the most significant
one facing the pipeline industry.
George W. Tenley, Jr. is the President of Pipeline
Research Council International, Inc. (www.prci.org).
Although well-established as a forum for the
members to share recent and emerging research
results, for the first time the Milan meeting set the
course for direct research project interaction, fund-
ing and management via interactive workshops.
The topics to be considered during the next
biennium are:
l Assessing the role and impact of human factors
in damage and damage prevention.
l The development of shock tube testing as a
means for fracture control.
l Assessing and controlling the delayed fracture
phenomenon in mechanical damage.
l The development of a comprehensive database
on stress corrosion cracking (SCC) experience.
l Development of new means to reduce con-
struction and installation costs. (Note: In this
work, the tripartite partnership will be expanded
to include the International Pipeline and
Offshore Contractors Association – IPLOCA.)
l Development of standards on the assessment
of corrosion on pipelines not suited for in-line
inspection.
l Establishing the criteria for assessing,
monitoring and controlling corrosion
growth rates.
l Developing the criteria and practices for the
integrity management of subsea pipelines.
The final component of the diverse collabor-
ative research enterprise is comprised of the firms,
institutions and universities whose laboratories,
field facilities, researchers and technologists form
an enormous asset base from which the pipeline
industry can draw. Throughout the history of the
tripartite organisations the membership has been
served well by the research conducted by such
organisations as Battelle, CSM, C-FER, TWI, DNV,
EWI, ICF, Southwest Research Institute and the
Universities of Ghent, Woolongong, Adelaide,
Colorado State, Queens College and Kansas
State. These represent only a fraction of the
research capability available to the worldwide
pipeline industry. However, in order to optimise

Your Partner in Gas Research & Technology
v BackgroundThe approach to national resource base optimisation, to investment decision support and to regulatory policy-making by TNO, as a main advisor to the national gas sector, is to study and model the full gas value chain. This includes not only the geological and infrastructural conditions, but also the interactions between the various actors/competitors, state monopolists and regulatory authorities. Rather than making projections based on a limited scope of the relevant environment, it is believed that modeling the full system is a better approach for studying changes in part of the system. In addition, TNO provides many technical solutions around natural gas flows
v Gas compositional considerations for exploration in a mature basinAny new gas has to be accommodated in the total system. In The Netherlands, the gas compositions from the different gas fields producing into the national grid have to be carefully balanced. Therefore, the gas composition of exploration prospects, including their production streams, needs to be predicted to test their impact on the total system.
v Underground Gas Storage: arbitrage vs. rental contractsUnderstanding how a new UGS fits in the local or regional market and which opportunities and risks exist, can only be achieved using a holistic approach. Exploiting price differentials by arbitrage can be more beneficial than fixed rental contracts. Combinations of both strategies can also be considered.
v Gas exchange development Understanding how to stimulate the trade on the gas exchange, at the expense of the OTC market (Over The Counter) and/or long-term contracts, depends on the interactions in the total system. The reliability of the price information generated at a super-critical trade on the gas exchange may be beneficial to all and outweigh the additional transaction costs.
v Third Party Access The various TPA regimes influence the investments made by companies. Predicting the company behaviours and their impact on Security of Supply again requires a total-system approach. TNO is currently developing new methods to research questions such as described above. Prototype models, EXPLOSIM and ENETSIM, are operational and ready to simulate the complex gas market. The models can also serve as a communication platform for the various stakeholders.
v Compression FacilitiesTNO has a track record of 40 years in designing safe and reliable compressor installations. We carry out full dynamic optimisation studies, in order to minimise dynamic forcing on the installations caused by unsteady flow and to minimise the resulting vibrations on the piping structure. For existing installations, we carry out debottle-necking studies and root cause analysis in case of failures or accidents. TNO has extensive proprietary software tools for process dynamic simulation.
v Ship to ship transfer of LNGTNO is appointed to define the qualification program for their system and to execute a complete test program. To expand the LNG market and add flexibility to the supply chain floating liquefaction is being developed besides the conventional LNG transport vessels and dedicated regasification vessels. These new developments however require offshore transfer of LNG from ship to ship. Until recently it was not possible to reliably transfer LNG which is typically done at 3 bar pressure and a temperature of -162°C. Good design of flow systems is essential to prevent high maintenance cost, reduced safety, increased environmental pollution, excessive energy consumption and poor reliability. A qualification test program is developed based on the requirements of the guideline pr-EN1474-II, and will be released by the end of 2009.
v Optimisation of Production and Transport FacilitiesAs a gas field is depleted and reservoir pressure is reduced, the production is severely limited due to liquid loading. Below a certain gas velocity, liquid is no longer transported to the wellhead and a column of liquid builds up. Various solutions have been developed to delay the onset of liquid loading. Modeling multiphase flows in production facilities is a key activity of TNO. Applications of integrated well and reservoir modeling are Operator Support Tool for stabilising gas or water coning in these complex wells; TNO assist in the development of smart well control schemes; Furthermore we are developing down hole instrumentation and control hardware.
TNOP.O. Box 80015NL-3508 TA UtrechtThe NetherlandsE: [email protected]: +31 30 256 4600F: +31 30 256 4605W: www.tno.nl/geoenergy
• Exploration & Production• Compression and Transport Facilities• Underground Gas Storage• Gas Market Simulation• Sustainable Geo Energy
T +31 30 256 46 00F +31 30 256 46 05E [email protected]
Your partner in gas research & technology
The value of integration
TNO.NL
Advertentie Watertreatment 08RS ENG A4 fc 13-7-09 15:21 Pagina 1
180 p r O m O T I n G d e C e n T r a L I S e d e n e r G Y I n C h I n a
decentralising the points of generation and
bringing them closer to the point of use. The
wider use of decentralised energy (DE) is a key
solution for bringing about the cost-effective
modernisation and development of the world’s
electricity systems.
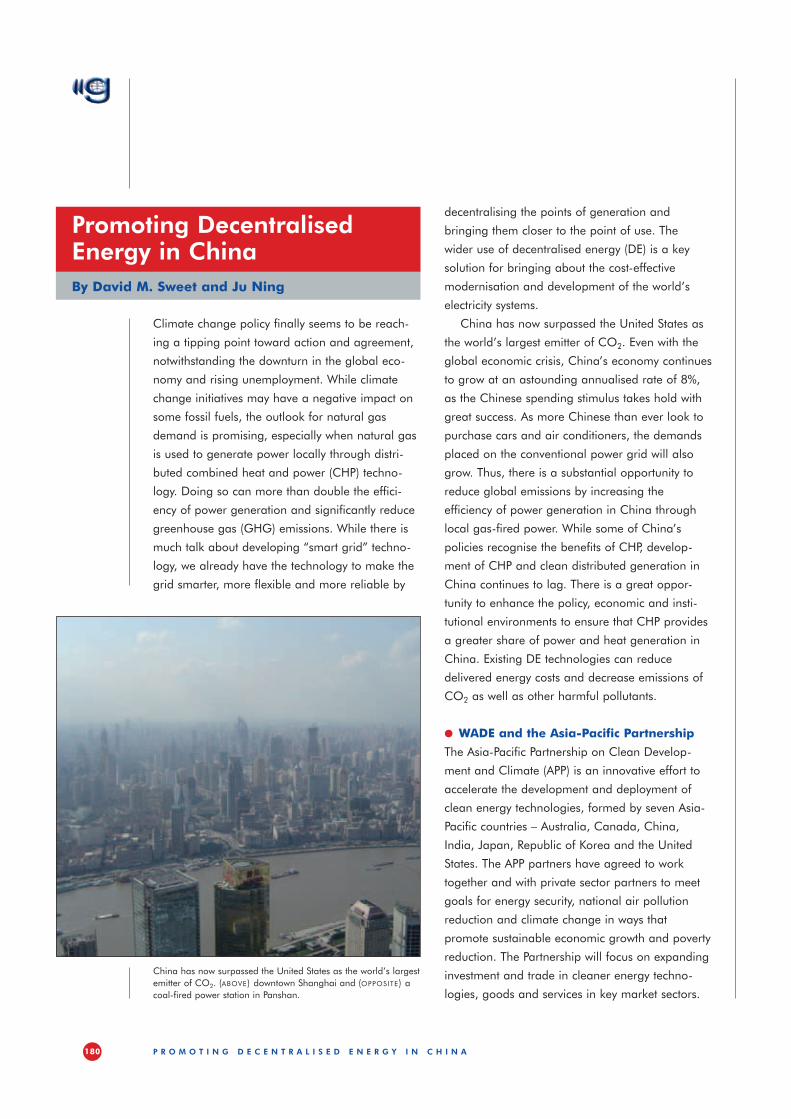
China has now surpassed the United States as
the world’s largest emitter of CO2. Even with the
global economic crisis, China’s economy continues
to grow at an astounding annualised rate of 8%,
as the Chinese spending stimulus takes hold with
great success. As more Chinese than ever look to
purchase cars and air conditioners, the demands
placed on the conventional power grid will also
grow. Thus, there is a substantial opportunity to
reduce global emissions by increasing the
efficiency of power generation in China through
local gas-fired power. While some of China’s
policies recognise the benefits of CHP, develop-
ment of CHP and clean distributed generation in
China continues to lag. There is a great oppor-
tunity to enhance the policy, economic and insti-
tutional environments to ensure that CHP provides
a greater share of power and heat gen eration in
China. Existing DE technologies can reduce
delivered energy costs and decrease emissions of
CO2 as well as other harmful pollutants.
l WADE and the Asia-Pacific Partnership
The Asia-Pacific Partnership on Clean Develop-
ment and Climate (APP) is an innovative effort to
accelerate the development and deployment of
clean energy technologies, formed by seven Asia-
Pacific countries – Australia, Canada, China,
India, Japan, Republic of Korea and the United
States. The APP partners have agreed to work
together and with private sector partners to meet
goals for energy security, national air pollution
reduction and climate change in ways that
promote sustainable economic growth and poverty
reduction. The Partnership will focus on expanding
investment and trade in cleaner energy techno-
logies, goods and services in key market sectors.
Climate change policy finally seems to be reach-
ing a tipping point toward action and agreement,
notwithstanding the downturn in the global eco-
nomy and rising unemployment. While climate
change initiatives may have a negative impact on
some fossil fuels, the outlook for natural gas
demand is promising, especially when natural gas
is used to generate power locally through distri-
buted combined heat and power (CHP) techno-
logy. Doing so can more than double the effici-
ency of power generation and significantly reduce
greenhouse gas (GHG) emissions. While there is
much talk about developing “smart grid” techno-
logy, we already have the technology to make the
grid smarter, more flexible and more reliable by
promoting decentralised energy in ChinaBy David M. Sweet and Ju Ning
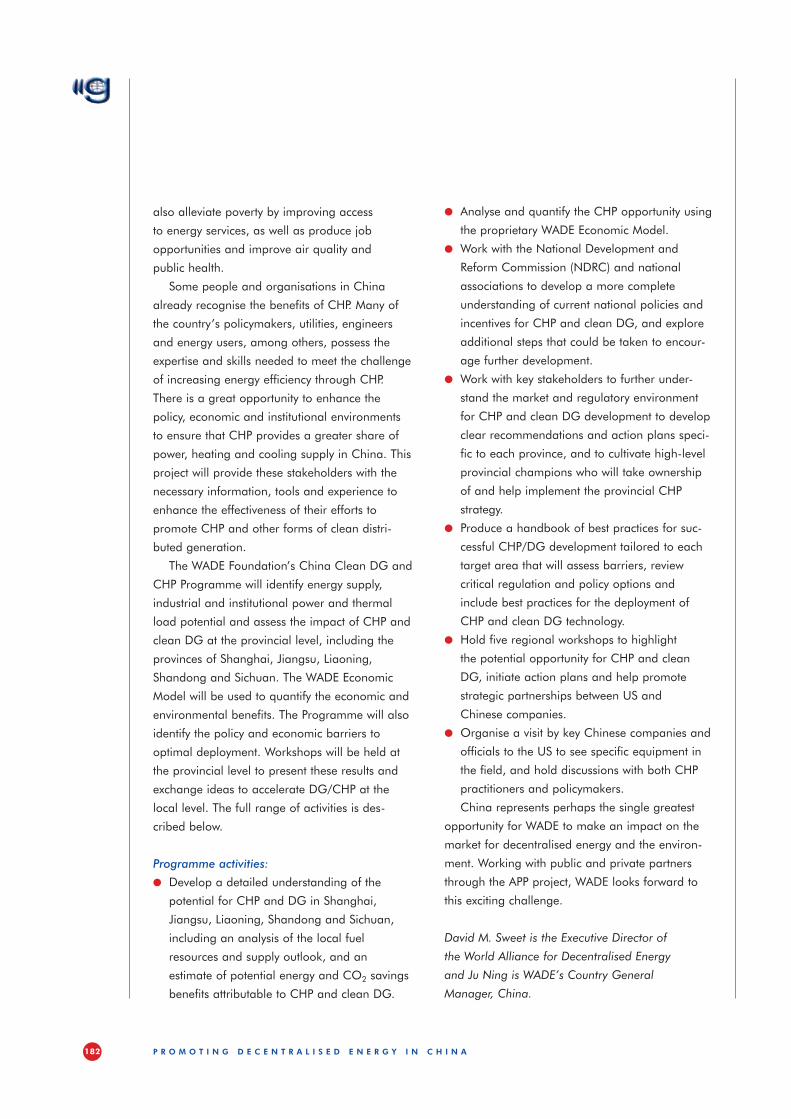
China has now surpassed the United States as the world’s largest emitter of CO2. (above) downtown Shanghai and (opposite) a coal-fired power station in Panshan.
181p r O m O T I n G d e C e n T r a L I S e d e n e r G Y I n C h I n a
l The Programme – Accelerate clean
distributed generation and CHP
applications in China
Clean distributed generation (DG) and waste heat
to power has the potential to significantly reduce
GHG emissions and promote greater cost and
network efficiencies. The wide-scale deployment of
clean distributed generation technologies increases
the diversity of energy supply, and can improve
energy security and reduce fuel supply risks, par-
ticularly in remote areas. These efficient distributed
generation technologies, which are ideally suited
to mid-sized and smaller-scale applications, can
The APP employs a unique public-private par-
tnership model that brings together industry stake-
holders and government officials to achieve Par-
tnership goals. The APP is an integral component
of US efforts to combat climate change, promote
energy security and foster international economic
growth and cooperation. As part of the US
Government’s participation in the APP, the US
Department of State recently announced funding
for several projects in China. Through a rigorous
competition the WADE Foundation was chosen as
a recipient of APP funding with its proposal to
accelerate distributed generation/CHP in China.
The APP aims to accelerate the development and deployment of clean energy technologies
182 p r O m O T I n G d e C e n T r a L I S e d e n e r G Y I n C h I n a
l Analyse and quantify the CHP opportunity using
the proprietary WADE Economic Model.
l Work with the National Development and
Reform Commission (NDRC) and national
associations to develop a more complete
under standing of current national policies and
incentives for CHP and clean DG, and explore
additional steps that could be taken to encour-
age further development.
l Work with key stakeholders to further under-
stand the market and regulatory environment
for CHP and clean DG development to develop
clear recommendations and action plans speci-
fic to each province, and to cultivate high-level
provincial champions who will take ownership
of and help implement the provincial CHP
strategy.
l Produce a handbook of best practices for suc-
cessful CHP/DG development tailored to each
target area that will assess barriers, review
critical regulation and policy options and
include best practices for the deployment of
CHP and clean DG technology.
l Hold five regional workshops to highlight
the potential opportunity for CHP and clean
DG, initiate action plans and help promote
strategic partnerships between US and
Chinese companies.
l Organise a visit by key Chinese companies and
officials to the US to see specific equipment in
the field, and hold discussions with both CHP
practitioners and policymakers.
China represents perhaps the single greatest
opportunity for WADE to make an impact on the
market for decentralised energy and the environ-
ment. Working with public and private partners
through the APP project, WADE looks forward to
this exciting challenge.
David M. Sweet is the Executive Director of
the World Alliance for Decentralised Energy
and Ju Ning is WADE’s Country General
Manager, China.
also alleviate poverty by improving access
to energy services, as well as produce job
opportunities and improve air quality and
public health.
Some people and organisations in China
already recognise the benefits of CHP. Many of
the country’s policymakers, utilities, engineers
and energy users, among others, possess the
expertise and skills needed to meet the challenge
of inc reasing energy efficiency through CHP.
There is a great opportunity to enhance the
policy, econo mic and institutional environments
to ensure that CHP provides a greater share of
power, heating and cooling supply in China. This
project will provide these stakeholders with the
necessary information, tools and experience to
enhance the effectiveness of their efforts to
promote CHP and other forms of clean distri-
buted generation.
The WADE Foundation’s China Clean DG and
CHP Programme will identify energy supply,
indus trial and institutional power and thermal
load potential and assess the impact of CHP and
clean DG at the provincial level, including the
provinces of Shanghai, Jiangsu, Liaoning,
Shandong and Sichuan. The WADE Economic
Model will be used to quantify the economic and
environmental bene fits. The Programme will also
identify the policy and economic barriers to
optimal deployment. Workshops will be held at
the provincial level to present these results and
exchange ideas to accelerate DG/CHP at the
local level. The full range of activities is des-
cribed below.
Programme activities:
l Develop a detailed understanding of the
potential for CHP and DG in Shanghai,
Jiangsu, Liaoning, Shandong and Sichuan,
including an analysis of the local fuel
resources and supply outlook, and an
estimate of potential energy and CO2 savings
benefits attributable to CHP and clean DG.
183p r O m O T I n G d e C e n T r a L I S e d e n e r G Y I n C h I n a
WADE (www.localpower.org) is the world’s leading non-profit organisation focused on distributed generation technology, policy and investment issues.
WADE works to accelerate the worldwide development of high efficiency cogeneration, onsite power and decentralised renewable energy systems that deliver substantial economic and environmental benefits. In an effort to raise the profile of cogeneration as a climate change mitigation strategy in the 1997 UNFCCC climate change negotiations, the International Cogeneration Alliance was founded. In 2002, the group changed its name to WADE and broadened its scope to include all manner of DE technologies.
WADE’s five key objectives and programmes are to:l Provide its Members and supporters with
value added market intelligence, information and business opportunities;
l Bring about effective power sector reform which eliminates barriers to DE and creates real market opportunity for DE;
l Coordinate the creation and monetisation of high quality carbon credits from DE projects;
l Compile global data on all aspects of DE development; and
l Support the establishment of DE groups in every country.
WADE China MissionThe Mission of WADE China is to accelerate the development of decentralised renewable energy, high efficiency cogeneration and onsite power systems that deliver substantial economic and environmental benefits to China. WADE China can accomplish this through targeted advocacy, outreach and researchl Advocacy of policies designed to advance DE;l Outreach through conferences, workshops
and communications; andl Economic and policy research, including
quantification of the benefits of DE through use of the WADE Model.For further information about WADE and
WADE’s activities in China, please contact:
uSa ChIna David M. Sweet Ju Ning Executive Director Country General WADE Manager, China 1513 16th Street, NW WADE Foundation Washington DC 20036 Room 3D, Block G, Golden Resources Business Centre Haidian District, Beijing 100097 Tel: + 1 202 667 5600 China tel: + 86 139 173 08740 Fax: + 1 202 315 3719 US tel: + 1 703 598 8032 Email: [email protected] Email: [email protected]
The wOrLd aLL IanCe fOr deCenTraL ISed enerGY (wade )

C
M
Y
CM
MY
CY
CMY
K
对开报广.pdf 2009.8.3 1:46:33 PM
C
M
Y
CM
MY
CY
CMY
K
对开报广.pdf 2009.8.3 1:46:33 PM