Embed Size (px)
Citation preview
www.SandV.com INSTRUMENTATION REFERENCE ISSUE 7
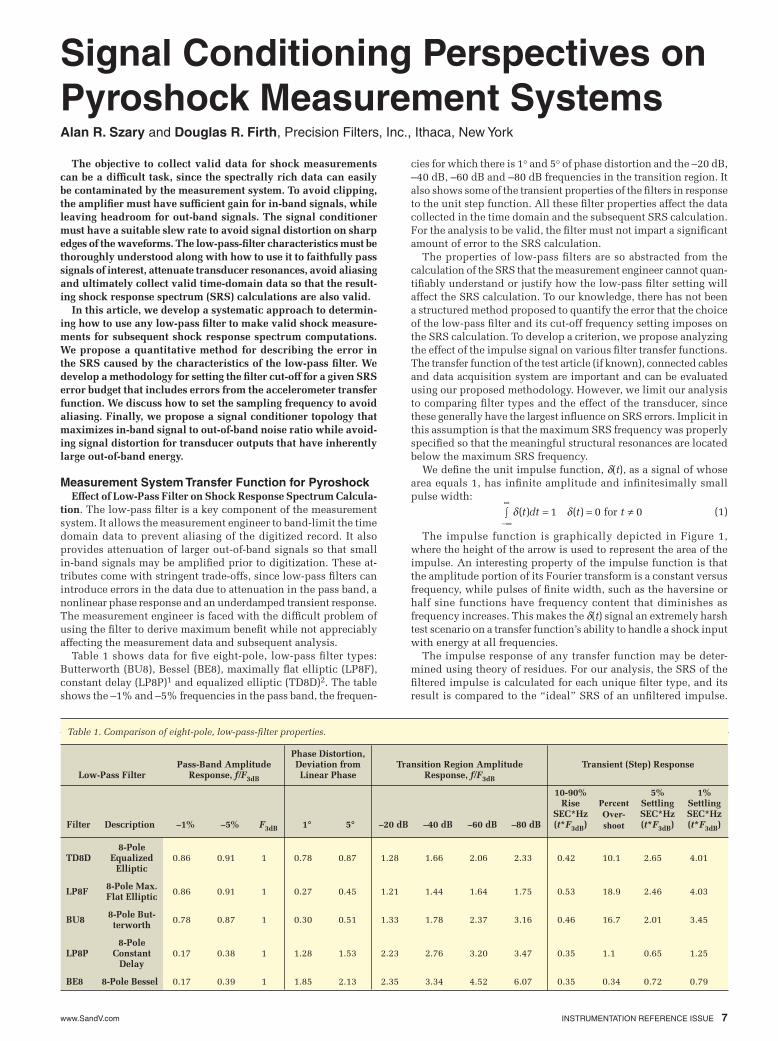
Signal Conditioning Perspectives on Pyroshock Measurement SystemsAlan R. Szary and Douglas R. Firth, Precision Filters, Inc., Ithaca, New York
The objective to collect valid data for shock measurements can be a difficult task, since the spectrally rich data can easily be contaminated by the measurement system. To avoid clipping, the amplifier must have sufficient gain for in-band signals, while leaving headroom for out-band signals. The signal conditioner must have a suitable slew rate to avoid signal distortion on sharp edges of the waveforms. The low-pass-filter characteristics must be thoroughly understood along with how to use it to faithfully pass signals of interest, attenuate transducer resonances, avoid aliasing and ultimately collect valid time-domain data so that the result-ing shock response spectrum (SRS) calculations are also valid.
In this article, we develop a systematic approach to determin-ing how to use any low-pass filter to make valid shock measure-ments for subsequent shock response spectrum computations. We propose a quantitative method for describing the error in the SRS caused by the characteristics of the low-pass filter. We develop a methodology for setting the filter cut-off for a given SRS error budget that includes errors from the accelerometer transfer function. We discuss how to set the sampling frequency to avoid aliasing. Finally, we propose a signal conditioner topology that maximizes in-band signal to out-of-band noise ratio while avoid-ing signal distortion for transducer outputs that have inherently large out-of-band energy.
Measurement System Transfer Function for PyroshockEffect of Low-Pass Filter on Shock Response Spectrum Calcula-
tion. The low-pass filter is a key component of the measurement system. It allows the measurement engineer to band-limit the time domain data to prevent aliasing of the digitized record. It also provides attenuation of larger out-of-band signals so that small in-band signals may be amplified prior to digitization. These at-tributes come with stringent trade-offs, since low-pass filters can introduce errors in the data due to attenuation in the pass band, a nonlinear phase response and an underdamped transient response. The measurement engineer is faced with the difficult problem of using the filter to derive maximum benefit while not appreciably affecting the measurement data and subsequent analysis.
Table 1 shows data for five eight-pole, low-pass filter types: Butterworth (BU8), Bessel (BE8), maximally flat elliptic (LP8F), constant delay (LP8P)1 and equalized elliptic (TD8D)2. The table shows the –1% and –5% frequencies in the pass band, the frequen-
cies for which there is 1° and 5° of phase distortion and the –20 dB, –40 dB, –60 dB and –80 dB frequencies in the transition region. It also shows some of the transient properties of the filters in response to the unit step function. All these filter properties affect the data collected in the time domain and the subsequent SRS calculation. For the analysis to be valid, the filter must not impart a significant amount of error to the SRS calculation.
The properties of low-pass filters are so abstracted from the calculation of the SRS that the measurement engineer cannot quan-tifiably understand or justify how the low-pass filter setting will affect the SRS calculation. To our knowledge, there has not been a structured method proposed to quantify the error that the choice of the low-pass filter and its cut-off frequency setting imposes on the SRS calculation. To develop a criterion, we propose analyzing the effect of the impulse signal on various filter transfer functions. The transfer function of the test article (if known), connected cables and data acquisition system are important and can be evaluated using our proposed methodology. However, we limit our analysis to comparing filter types and the effect of the transducer, since these generally have the largest influence on SRS errors. Implicit in this assumption is that the maximum SRS frequency was properly specified so that the meaningful structural resonances are located below the maximum SRS frequency.
We define the unit impulse function, d(t), as a signal of whose area equals 1, has infinite amplitude and infinitesimally small pulse width:
The impulse function is graphically depicted in Figure 1,
where the height of the arrow is used to represent the area of the impulse. An interesting property of the impulse function is that the amplitude portion of its Fourier transform is a constant versus frequency, while pulses of finite width, such as the haversine or half sine functions have frequency content that diminishes as frequency increases. This makes the d(t) signal an extremely harsh test scenario on a transfer function’s ability to handle a shock input with energy at all frequencies.
The impulse response of any transfer function may be deter-mined using theory of residues. For our analysis, the SRS of the filtered impulse is calculated for each unique filter type, and its result is compared to the “ideal” SRS of an unfiltered impulse.
(1)
Table 1. Comparison of eight-pole, low-pass-filter properties.
Low-Pass FilterPass-Band Amplitude
Response, f/F3dB
Phase Distortion, Deviation from Linear Phase
Transition Region Amplitude Response, f/F3dB
Transient (Step) Response
Filter Description –1% –5% F3dB 1° 5° –20 dB –40 dB –60 dB –80 dB
10-90% Rise
SEC*Hz (t*F3dB)
Percent Over-shoot
5%SettlingSEC*Hz (t*F3dB)
1%SettlingSEC*Hz (t*F3dB)
TD8D8-Pole
Equalized Elliptic
0.86 0.91 1 0.78 0.87 1.28 1.66 2.06 2.33 0.42 10.1 2.65 4.01
LP8F 8-Pole Max.Flat Elliptic 0.86 0.91 1 0.27 0.45 1.21 1.44 1.64 1.75 0.53 18.9 2.46 4.03
BU8 8-Pole But-terworth 0.78 0.87 1 0.30 0.51 1.33 1.78 2.37 3.16 0.46 16.7 2.01 3.45
LP8P8-Pole
Constant Delay
0.17 0.38 1 1.28 1.53 2.23 2.76 3.20 3.47 0.35 1.1 0.65 1.25
BE8 8-Pole Bessel 0.17 0.39 1 1.85 2.13 2.35 3.34 4.52 6.07 0.35 0.34 0.72 0.79
d d( ) ( )t dt t t= = πÚ-•
•1 0 for 0
www.SandV.com8 SOUND & VIBRATION/FEBRUARY 2013
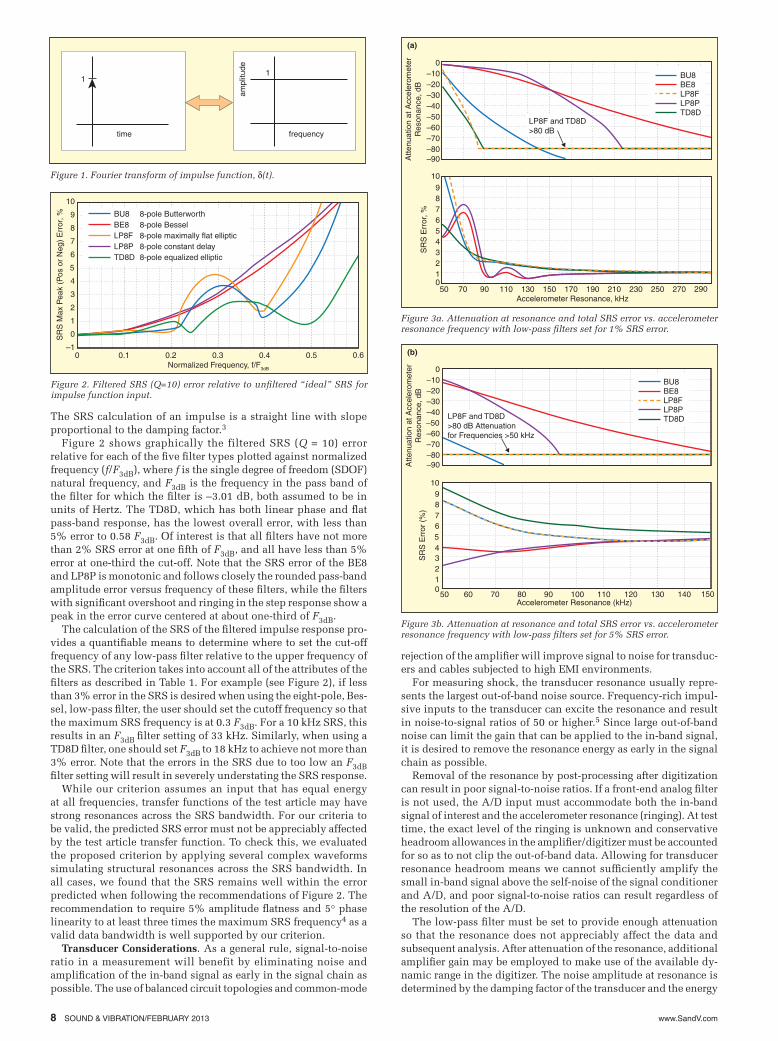
The SRS calculation of an impulse is a straight line with slope proportional to the damping factor.3
Figure 2 shows graphically the filtered SRS (Q = 10) error relative for each of the five filter types plotted against normalized frequency (f/F3dB), where f is the single degree of freedom (SDOF) natural frequency, and F3dB is the frequency in the pass band of the filter for which the filter is –3.01 dB, both assumed to be in units of Hertz. The TD8D, which has both linear phase and flat pass-band response, has the lowest overall error, with less than 5% error to 0.58 F3dB. Of interest is that all filters have not more than 2% SRS error at one fifth of F3dB, and all have less than 5% error at one-third the cut-off. Note that the SRS error of the BE8 and LP8P is monotonic and follows closely the rounded pass-band amplitude error versus frequency of these filters, while the filters with significant overshoot and ringing in the step response show a peak in the error curve centered at about one-third of F3dB.
The calculation of the SRS of the filtered impulse response pro-vides a quantifiable means to determine where to set the cut-off frequency of any low-pass filter relative to the upper frequency of the SRS. The criterion takes into account all of the attributes of the filters as described in Table 1. For example (see Figure 2), if less than 3% error in the SRS is desired when using the eight-pole, Bes-sel, low-pass filter, the user should set the cutoff frequency so that the maximum SRS frequency is at 0.3 F3dB. For a 10 kHz SRS, this results in an F3dB filter setting of 33 kHz. Similarly, when using a TD8D filter, one should set F3dB to 18 kHz to achieve not more than 3% error. Note that the errors in the SRS due to too low an F3dB filter setting will result in severely understating the SRS response.
While our criterion assumes an input that has equal energy at all frequencies, transfer functions of the test article may have strong resonances across the SRS bandwidth. For our criteria to be valid, the predicted SRS error must not be appreciably affected by the test article transfer function. To check this, we evaluated the proposed criterion by applying several complex waveforms simulating structural resonances across the SRS bandwidth. In all cases, we found that the SRS remains well within the error predicted when following the recommendations of Figure 2. The recommendation to require 5% amplitude flatness and 5° phase linearity to at least three times the maximum SRS frequency4 as a valid data bandwidth is well supported by our criterion.
Transducer Considerations. As a general rule, signal-to-noise ratio in a measurement will benefit by eliminating noise and amplification of the in-band signal as early in the signal chain as possible. The use of balanced circuit topologies and common-mode
rejection of the amplifier will improve signal to noise for transduc-ers and cables subjected to high EMI environments.
For measuring shock, the transducer resonance usually repre-sents the largest out-of-band noise source. Frequency-rich impul-sive inputs to the transducer can excite the resonance and result in noise-to-signal ratios of 50 or higher.5 Since large out-of-band noise can limit the gain that can be applied to the in-band signal, it is desired to remove the resonance energy as early in the signal chain as possible.
Removal of the resonance by post-processing after digitization can result in poor signal-to-noise ratios. If a front-end analog filter is not used, the A/D input must accommodate both the in-band signal of interest and the accelerometer resonance (ringing). At test time, the exact level of the ringing is unknown and conservative headroom allowances in the amplifier/digitizer must be accounted for so as to not clip the out-of-band data. Allowing for transducer resonance headroom means we cannot sufficiently amplify the small in-band signal above the self-noise of the signal conditioner and A/D, and poor signal-to-noise ratios can result regardless of the resolution of the A/D.
The low-pass filter must be set to provide enough attenuation so that the resonance does not appreciably affect the data and subsequent analysis. After attenuation of the resonance, additional amplifier gain may be employed to make use of the available dy-namic range in the digitizer. The noise amplitude at resonance is determined by the damping factor of the transducer and the energy
Figure 1. Fourier transform of impulse function, d(t).
time frequency
11
ampl
itude
Figure 2. Filtered SRS (Q=10) error relative to unfiltered “ideal” SRS for impulse function input.
–1
2
1
0
3
4
6
7
8
9
10
0.60.50.40.30.20.10
5
SR
S M
ax P
eak
(Pos
or
Neg
) E
rror
, %
Normalized Frequency, f/F3dB
BU8 BE8 LP8F LP8PTD8D
8-pole Butterworth8-pole Bessel8-pole maximally flat elliptic8-pole constant delay8-pole equalized elliptic
Figure 3a. Attenuation at resonance and total SRS error vs. accelerometer resonance frequency with low-pass filters set for 1% SRS error.
0150130 190170 270230 290250210110907050
1234
6789
10
5
SR
S E
rror
, %
Accelerometer Resonance, kHz
–90–80–70–60
–40–30–20–10
0
–50
Atte
nuat
ion
at A
ccel
erom
eter
Res
onan
ce, d
B
BU8 BE8 LP8F LP8PTD8D
LP8F and TD8D >80 dB
(a)
Figure 3b. Attenuation at resonance and total SRS error vs. accelerometer resonance frequency with low-pass filters set for 5% SRS error.
015010090 120110 14013080706050
1234
6789
10
5
SR
S E
rror
(%
)
Accelerometer Resonance (kHz)
(b)
–90–80–70–60
–40–30–20–10
0
–50
Atte
nuat
ion
at A
ccel
erom
eter
Res
onan
ce, d
B
BU8 BE8 LP8F LP8PTD8D LP8F and TD8D
>80 dB Attenuation for Frequencies >50 kHz
www.SandV.com INSTRUMENTATION REFERENCE ISSUE 9
in the input about the resonant frequency. Attenuating the noise at resonance with the low-pass filter should reduce the level so that it is well below the in-band signal level. The required attenuation will depend on an estimate of the in-band signal level relative to the out-band resonance noise level.
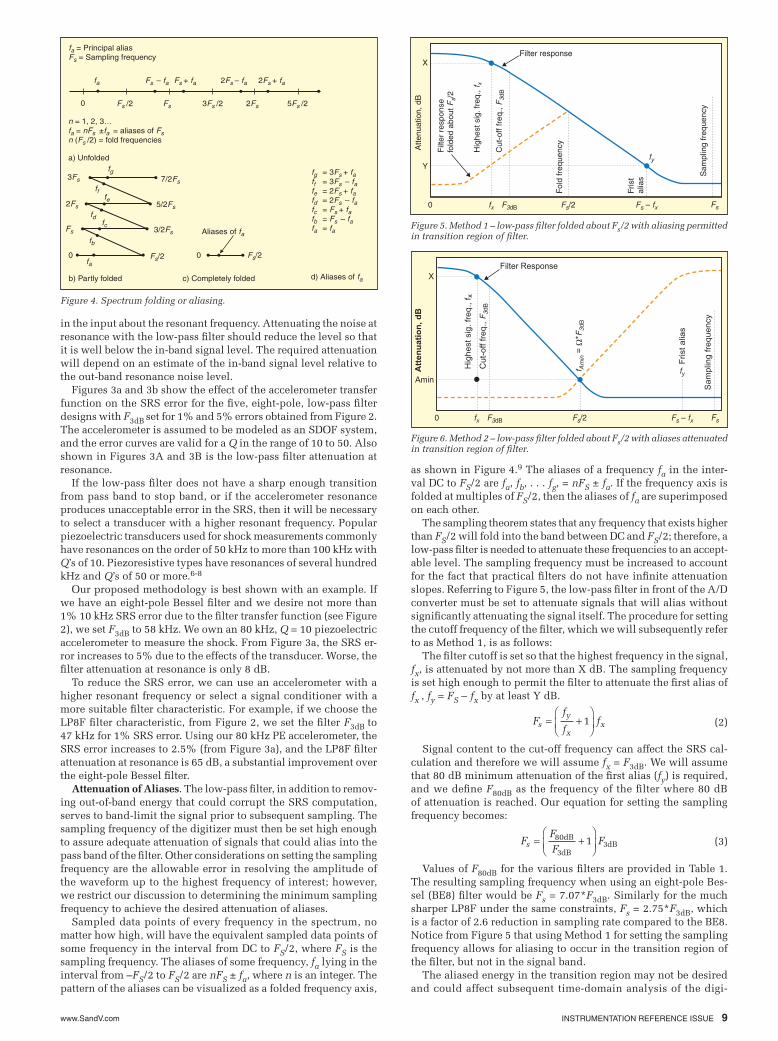
Figures 3a and 3b show the effect of the accelerometer transfer function on the SRS error for the five, eight-pole, low-pass filter designs with F3dB set for 1% and 5% errors obtained from Figure 2. The accelerometer is assumed to be modeled as an SDOF system, and the error curves are valid for a Q in the range of 10 to 50. Also shown in Figures 3A and 3B is the low-pass filter attenuation at resonance.
If the low-pass filter does not have a sharp enough transition from pass band to stop band, or if the accelerometer resonance produces unacceptable error in the SRS, then it will be necessary to select a transducer with a higher resonant frequency. Popular piezoelectric transducers used for shock measurements commonly have resonances on the order of 50 kHz to more than 100 kHz with Q’s of 10. Piezoresistive types have resonances of several hundred kHz and Q’s of 50 or more.6-8
Our proposed methodology is best shown with an example. If we have an eight-pole Bessel filter and we desire not more than 1% 10 kHz SRS error due to the filter transfer function (see Figure 2), we set F3dB to 58 kHz. We own an 80 kHz, Q = 10 piezoelectric accelerometer to measure the shock. From Figure 3a, the SRS er-ror increases to 5% due to the effects of the transducer. Worse, the filter attenuation at resonance is only 8 dB.
To reduce the SRS error, we can use an accelerometer with a higher resonant frequency or select a signal conditioner with a more suitable filter characteristic. For example, if we choose the LP8F filter characteristic, from Figure 2, we set the filter F3dB to 47 kHz for 1% SRS error. Using our 80 kHz PE accelerometer, the SRS error increases to 2.5% (from Figure 3a), and the LP8F filter attenuation at resonance is 65 dB, a substantial improvement over the eight-pole Bessel filter.
Attenuation of Aliases. The low-pass filter, in addition to remov-ing out-of-band energy that could corrupt the SRS computation, serves to band-limit the signal prior to subsequent sampling. The sampling frequency of the digitizer must then be set high enough to assure adequate attenuation of signals that could alias into the pass band of the filter. Other considerations on setting the sampling frequency are the allowable error in resolving the amplitude of the waveform up to the highest frequency of interest; however, we restrict our discussion to determining the minimum sampling frequency to achieve the desired attenuation of aliases.
Sampled data points of every frequency in the spectrum, no matter how high, will have the equivalent sampled data points of some frequency in the interval from DC to FS/2, where FS is the sampling frequency. The aliases of some frequency, fa lying in the interval from –FS/2 to FS/2 are nFS ± fa, where n is an integer. The pattern of the aliases can be visualized as a folded frequency axis,
as shown in Figure 4.9 The aliases of a frequency fa in the inter-val DC to FS/2 are fa, fb, . . . fg, = nFS ± fa. If the frequency axis is folded at multiples of FS/2, then the aliases of fa are superimposed on each other.
The sampling theorem states that any frequency that exists higher than FS/2 will fold into the band between DC and FS/2; therefore, a low-pass filter is needed to attenuate these frequencies to an accept-able level. The sampling frequency must be increased to account for the fact that practical filters do not have infinite attenuation slopes. Referring to Figure 5, the low-pass filter in front of the A/D converter must be set to attenuate signals that will alias without significantly attenuating the signal itself. The procedure for setting the cutoff frequency of the filter, which we will subsequently refer to as Method 1, is as follows:
The filter cutoff is set so that the highest frequency in the signal, fx, is attenuated by not more than X dB. The sampling frequency is set high enough to permit the filter to attenuate the first alias of fx , fy = FS – fx by at least Y dB.
Signal content to the cut-off frequency can affect the SRS cal-culation and therefore we will assume fx = F3dB. We will assume that 80 dB minimum attenuation of the first alias (fy) is required, and we define F80dB as the frequency of the filter where 80 dB of attenuation is reached. Our equation for setting the sampling frequency becomes:
Values of F80dB for the various filters are provided in Table 1. The resulting sampling frequency when using an eight-pole Bes-sel (BE8) filter would be Fs = 7.07*F3dB. Similarly for the much sharper LP8F under the same constraints, Fs = 2.75*F3dB, which is a factor of 2.6 reduction in sampling rate compared to the BE8. Notice from Figure 5 that using Method 1 for setting the sampling frequency allows for aliasing to occur in the transition region of the filter, but not in the signal band.
The aliased energy in the transition region may not be desired and could affect subsequent time-domain analysis of the digi-
Figure 4. Spectrum folding or aliasing.
fa = Principal aliasFs = Sampling frequency
fa
0
Fs – fa
Fs /2 3Fs /2 2Fs 5Fs /2Fs
Fs + fa 2Fs – fa 2Fs + fa
n = 1, 2, 3…fa = nFs ±fa = aliases of Fs n (Fs /2) = fold frequencies
b) Partly folded c) Completely folded d) Aliases of fa
a) Unfoldedfg
ff
fd
fb
3Fs
2Fs
Fs
7/2Fs
3/2Fs
Fs/2
5/2Fs
0
Aliases of fa
fg ff fe fd fc fb fa
= 3Fs + fa= 3Fs – fa= 2Fs + fa= 2Fs – fa= Fs + fa= Fs – fa= fa
Fs/20
fe
fc
fa
Figure 5. Method 1 – low-pass filter folded about Fs/2 with aliasing permitted in transition region of filter.
Y
X
FsFs – fxFs/2F3dBfx
fy
0
Atte
nuat
ion,
dB
Filter response
Filt
er r
espo
nse
fold
ed a
bout
Fs/
2
Hig
hest
sig
. fre
q., f
x
Cut
-off
freq
., F
3dB
Fol
d fr
eque
ncy
Sam
plin
g fr
eque
ncy
Fris
tal
ias
(2)Ff
ffs
y
xx= +
Ê
ËÁˆ
¯1
(3)FFF
Fs = +Ê
ËÁˆ
¯80
331dB
dBdB
Figure 6. Method 2 – low-pass filter folded about Fs/2 with aliases attenuated in transition region of filter.
FsFs – fxFs/2F3dBfx0
Amin
X
fyAtte
nuat
ion,
dB
Filter Response
Hig
hest
sig
. fre
q., f
x
Cut
-off
freq.
, F3d
B
f Am
in =
Ω*F
3dB
Sam
plin
g fre
quen
cy
Fris
t alia
s

www.SandV.com10 SOUND & VIBRATION/FEBRUARY 2013
tized data. A more conservative approach (Method 2) is shown in Figure 6. Here, the sampling frequency is set to attenuate aliases throughout the transition region of the filter. The required sampling frequency to meet this criterion is:
Using Method 2 yields a sampling frequency of 12.14*F3dB for the BE8 and 5.5* F3dB for the LP8F, which we note are significantly higher than when using Method 1.
Setting the sampling frequency with this procedure may result in a rate that is too sparse for subsequent analysis methods on the data. A popular recommendation for shock type measurements is to sample the data at a rate of at least 10¥ the highest frequency of interest.10
Practical Application. In the preceding section, we developed a method for determining the cut-off frequency of the low-pass filter for a given SRS error. We then discussed how the accelerometer affects the SRS error and how to determine the filter attenuation at resonance. Finally, we provided two methods to calculate the sampling frequency to achieve the desired attenuation of aliases.
To collect valid data for a subsequent SRS calculation requires proper consideration be given to choosing the filter transfer func-tion, sensor and sampling frequency. Tables 2A and 2B show minimum F3dB for 1% and 5% SRS errors for the various eight-pole filter types. We compute the overall SRS error with sensors having three assumed resonances. Next, we list the attenuation that the filter provides at the resonant frequency and finally we compute the sampling frequency for 80 dB attenuation of aliases using the two methods described in this article.
The TD8D and LP8F provide the most attenuation at resonance and require the lowest sampling rates. The eight-pole Bessel is the least selective filter and has the lowest attenuation at resonance. Interestingly, when the transfer function of the accelerometer is introduced, the errors are actually reduced in most cases when using BE8 and LP8P filters. This is due to the fact that the roll-off
of these filters compensates for accelerometer peaking, illustrating the importance of including the accelerometer transfer function in the overall design.
Practical Implementation of Signal ConditionersAs discussed in the previous section, the accelerometer resonant
frequency is an important design variable in the construction of the overall measurement system. Adhering to that criteria, we see that higher resonance can reduce the error of the SRS and lessens the requirement for very sharp analog filters. In general, higher resonant frequencies are advantageous, and accelerometer manu-facturers have responded with new designs incorporating highly undamped piezoresistive devices with resonant frequencies as high as 1.2 MHz and Q’s as high as 50.
While higher resonances are advantageous, the high Q’s pose unique challenges to the filter-amplifier intended for pyroshock. Simply put, it is difficult to condition the relatively small in-band acceleration signals in the presence of the large out-band ringing of the accelerometers. As discussed in many technical articles dating back to the early days of shock testing, there are still two funda-mental problems that plague signal conditioners for pyroshock, namely the inability of the signal conditioner to tolerate the high
Table 2a. Minimum parameters for 10-kHz SRS (Q=10); filter designed for 1% maximum SRS error; sensor fn = 80 kHz, 100 kHz, 200 kHz; Fs set for 80 dB minimum attenuation of aliases.
Filter Low-Pass Filter
F3dB (kHz)for 1%
SRS Error
Max SRS Error w/Sensor fn=80
kHz, %Attn. (dB) @ 80 kHz
Max SRS Error w/Sensor fn=100 kHz, %
Attn. (dB) @ 100 kHz
Max SRS Error w/Sensor fn=200 kHz, %
Attn. (dB) @
200 kHzFs (kHz) w/Method 1
Fs (kHz) w/Method 2
TD8D 8-Pole Equal-ized Elliptic 38 2.6 65 2.0 >80 1.2 >80 127 177
LP8F 8-Pole Max. Flat Elliptic 47 2.4 65 2.1 >80 1.2 >80 129 165
BU8 8-Pole Butter-worth 44 2.3 42 2.0 57 1.2 >80 183 278
LP8P 8-Pole Constant Delay 63 7.0 5 0.7 7 0.9 59 219 437
BE8 8-Pole Bessel 58 6.2 8 0.6 10 0.9 43 410 704
Table 2b. Minimum parameters for 10-kHz SRS (Q=10); filter designed for 5% maximum SRS error; sensor fn = 50 kHz, 75 kHz, 100 kHz; Fs set for 80 dB minimum attenuation of aliases.
Filter Low-Pass Filter
F3dB (kHz)for 5%
SRS Error
Max SRS Error w/Sensor fn=50
kHz, %Attn. (dB) @ 50 kHz
Max SRS Error w/Sensor
fn=75 kHz, %
Attn. (dB) @ 75 kHz
Max SRS Error w/Sensor fn=100 kHz, %
Attn. (dB) @
100 kHzFs (kHz) w/Method 1
Fs (kHz) w/Method 2
TD8D 8-Pole Equal-ized Elliptic 18 9.5 >80 6.8 >80 5.9 >80 60 84
LP8F 8-Pole Max. Flat Elliptic 22 8.2 >80 5.6 >80 4.8 >80 61 77
BU8 8-Pole Butter-worth 20 8.2 63 5.6 >80 4.8 >80 83 126
LP8P 8-Pole Constant Delay 27 2.1 10 3.5 41 4.3 >80 94 187
BE8 8-Pole Bessel 26 3.9 13 3.8 28 4.2 50 184 316
Figure 7. Frequency domain response of 350 kHz accelerometer with Q of 50.
0.1
1
10
100
1 MHz100 kHz10 kHz
Mass
Spring Damper
2-pole SDOF systemFn = 350 kHzQ = 50
Nor
mal
ized
Am
plitu
de
(4)FFF
F Fs =Ê
ËÁˆ
¯=2 280
33 80
dB
dBdB dB

www.SandV.com INSTRUMENTATION REFERENCE ISSUE 11
Figure 8. Response of high-Q accelerometer to burst of energy at resonance (Red trace = Input, Blue trace = Output).
2-pole SDOF systemFn = 350 kHzQ = 50
Response to burst of 5cycles of 350 kHZ 100 g@t = 20 µsec
–1.2
–0.8
–0.4
0.4
0.8
1.2
0kg
220200180160140120100806040200µs
Figure 9. Test waveform (green) used to evaluate transfer characteristics of shock amplifier.
Tone 1:3.33 kHz
Tone 2:10 kHz
Valid sum
–1.0
–0.6
–0.8
–0.4
–0.2
0.2
0.4
0.6
0.8
1.0
0
Am
plitu
de
44040036032028024020016012080400µs
Figure 10. Unequal peaks of test waveform caused by 5° phase nonlinearity in shock amplifier.
–0.68
0.76
0.72
0.80
0.84
0.92
0.96
1.00
1.04
1.08
0.88
+2% error
–2% error
4% difference in peaks
Am
plitu
deSignal conditioner
Gain = 2000Filter
Fc = 44 kHz
DAS
–12mV
+12mV
+12 V
–13 V +2 V
–2 V
A
B
C
Figure 11. In-band signal distortion caused by clipping of accelerometer ringing.
levels and the fast rise times of the accelerometer ringing.Distortion Caused by Clipping. A resonant accelerometer be-
haves as a single degree of freedom (SDOF) second-order system with a natural frequency and damping determined by the mechani-cal design. Many piezoelectric accelerometers intended for shock are modeled with resonant frequencies between 50 and 100 kHz and Q’s of around 10, while modern piezoresistive accelerometers have resonant frequencies as high as 1.2 MHz and Q’s of 50 or more. Figure 7 shows the frequency domain response curve of the popular Endevco 7270-20K with a resonant frequency of 350 kHz and Q of 50.
While analysis in the frequency domain is useful for stationary signals, it is more complex to analyze the behavior of a resonant accelerometer responding to a sudden transient shock event. Figure 8 shows the time-domain result of stimulating such an accelerom-eter with a very short burst of high-frequency energy; in this case, five cycles of a relatively small 350-kHz sinewave. This example illustrates the problems associated with undamped accelerometers and their uncanny ability to bury the in-band signal of interest in huge levels of out-band noise.
To explore the effect of this ringing on in-band signals, we con-struct a test waveform that challenges the in-band transfer function characteristics of the shock amplifier. As shown in Figure 9, the test waveform is made up of the first two harmonics of a square wave (sin (f)+1/3 sin(3f)). The 10 kHz component is intentionally placed at the highest SDOF frequency in the 10-kHz SRS. The second component of the test waveform at 3.33 kHz is well within the 10-kHz SRS bandwidth.
This is a useful test waveform11 because we can quickly tell by inspection that the two tones pass through the shock amplifier with equal gain (flat amplitude response) and equal time delay (linear phase response). Passing this test waveform through an amplifier with inadequate amplitude or phase response will result in a visibly distorted waveform. As shown in Figure 10, even 5° of phase non-linearity is evident by the unequal peaks in the output waveform.
If we apply this test waveform to the accelerometer model at the same time we stimulate the accelerometer’s resonance with the high-frequency burst, a very difficult and challenging waveform results for a shock amplifier to properly handle. Assuming both the in-band test waveform and the out-band energy burst are both
100 gpk and the piezoresistive accelerometer has a sensitivity of 10 µV/g, we would expect to see waveform A shown in Figure 11 at the input to the pyroshock amplifier.
If the signal conditioner has a full-scale output of 10 V and we desire scaling to allow 500 g of full-scale input, then we would require a channel gain of 2,000. Adhering to the filtering guidelines described previously, an eight-pole, Butterworth, low-pass filter is properly set to 44 kHz to provide 1% maximum SRS errors. If a general-purpose amplifier was used rather than an amplifier designed specifically for pyroshock, there is a chance that all of the channel gain was placed before the filter.
This is an adequate signal conditioner topology for measuring low-level signals as it maximizes SNR; however, it does so at the expense of out-of-band protection. If this signal conditioner was spanned for the expected in-band signal, it would saturate on the unexpectedly large out-band resonance and produce a distorted waveform bounded by the upper and lower signal swing capabili-ties of the amplifier.
The limiting of the ideal waveform, often called “clipping,” re-sults in a distorted signal, as shown in the blue trace in waveform B of Figure 11. We can see in waveform B that the signal is clipped at +12 V on the positive portion of the waveform, but –13 V on the negative portion. This illustrates an important characteristic of components used throughout the amplifier that do not have identical positive and negative clipping limits.
Note that regardless of the complexity of the wave shape, true undistorted acceleration data always has an equal amount of area above and below the waveform’s zero level and always integrates to zero after the shock event is over (unless the test article has velocity after the test). Similarly, ideal accelerometer ringing, al-though hostile in its magnitude, is also a symmetrical waveform, has equal area above and below the zero level and will always integrate to zero.
Waveform B shows that the unsymmetrical signal clipping has re-moved a disproportionate amount of area from the positive portion

www.SandV.com12 SOUND & VIBRATION/FEBRUARY 2013
Figure 12. Using distributed gain to avoid clipping on accelerometer reso-nance.
Signal conditioner
Pre-filterGain = 500
Post-filterGain = 4
FilterFc = 44 kHz
DAS
–6V
+6V
–0.5V
+0.5V
A
B
–2 V
+2 V C
Shock waveform
compared to the negative portion of the waveform, and we would expect that this waveform if averaged (filtered) would produce an instantaneous level shift for the duration of the clipping. After the low-pass filter removes the large out-band resonance, we can see that the clipping has caused a gross distortion in the in-band signal of interest as shown in waveform C of Figure 11.
Note that the amplitude of the output waveform is well below the full-scale signal level, leaving no “warning signs” that the data should be considered suspect. To solve this problem, a signal conditioner intended for pyroshock measurements must distribute the gain around the low-pass filter, apportioning some gain before the filter, which, based on a most conservative worst-case analysis, will not cause clipping. The balance of the required gain must be placed after the low-pass filter, where, after removal of resonance, it will amplify only the desired in-band portion of the test data. As shown in Figure 12, with pre-filter gain of 500, waveform A is safely within the 10V operating range of the signal conditioner. The filter removes the out-band resonance as shown in waveform B; then a post-filter gain of 4 is used to establish the required overall gain of 2000, resulting in an undistorted representation of the test waveform.
Having the capability to distribute gain before and after the low-pass filter is no guarantee that at test time the right assumptions were made and that gain was properly apportioned to prevent clip-ping. As shown in waveform C of Figure 11, it is very likely that a corrupted waveform will be safely within the 10 V operating range and offer no indication that it is invalid. A properly constructed pyroshock signal conditioner must monitor the waveform prior to the low-pass filter and provide an indication that no internal clipping occurred for the duration of the transient shock event.
Given the high resonant frequency of modern accelerometers, the design of the overload detector can be very challenging, requiring accurate level detection and fast response times. In addition, the overload detector for shock measurements must be of a latching type that incorporates a two-step “arm and clear” methodology. Prior to a shock test, the overload detectors are cleared and armed. After the test, the overload registers are interrogated to determine whether the amplifier clipped during the test, corrupting the test data.
Slew-Rate Distortion. Even if gain is properly distributed to prevent clipping, in-band acceleration data can be distorted by a second common source of error.12 All gain stages prior to the filter are subjected to the harsh out-band energy of the accelerometer resonance. Operational amplifiers (op amps) used in modern signal conditioning systems have a specification that defines the fastest rate of change of a voltage (dV/dt) that can be supported by its internal circuitry. Expressed as volts per microsecond (V/µSec), the slew-rate specification is a key design parameter in amplifiers intended for pyroshock.
Figure 13 shows an alternate gain distribution scenario for the
Figure 13. In-band signal distortion caused by inadequate slew rate on positive waveform edge.
11 V/µSec
40 V/µSec
–10V
+10 V B
Signal conditioner
Pre-filterGain = 750
Post-filterGain = 2.667
FilterFc = 44 kHz
DAS
–2.0 V
+2.0 V
Shock waveform
C
–10 V
+10 V
Figure 14. Slew limiter designed to limit dV/dt to 11 V/µSec
0
11
10
9
8
7
6
5
4
3
2
1
96 7 853 41 20
V (in) V (out)
Stepinput
11 V/µS
Slew limiteroutput
µs
V
same measurement example described above. In this example, a less conservative estimate of out-band noise was assumed and more gain was used in the pre-filter gain stage. Referring to waveform A at the pre-filter gain stage output, there is no signal clipping, and if the overload detectors were set to 10 V, there would be no overload reported and no reason to expect the data to be corrupt. However, waveform B shows an expanded view of the largest portion of the signal and an example of an amplifier with insufficient slew rate to support the desired waveform.
The internal op-amps used for this example had a negative slew rate of –40 V/µSec, more than enough to accurately reproduce the negative-going portion of the waveform; however, the positive edge of the waveform is severely distorted due to a positive slew rate of only 11 V/µSec. Although this is a dramatic case, these are actual slew rate specifications for a “precision, high-speed” op-amp still in use today. It is clear to see that the inadequate slew rate on the positive waveform edge removes a disproportionate amount of wave-shape area from the positive portion of the waveform com-pared to the negative portion. We would expect that if averaged with a low-pass filter, an instantaneous level shift would be added to the in-band signal of interest. Waveform C of Figure 13 shows the filtered output, and that the slew distortion on the positive edge of the high-frequency, out-band signal causes gross distortion in the test waveform.
Therefore it would seem that a crucial design aspect for shock signal conditioners is to have internal amplifiers with high slew rate to accurately pass the large signals at the high resonant frequency of shock accelerometers. However, note that the accelerometer ringing is an out-band noise source and not our data of interest;

www.SandV.com INSTRUMENTATION REFERENCE ISSUE 13
perform a valid 10 kHz SRS. Using the design methodology, the filter can be optimally set to achieve the desired SRS error while maximizing attenuation of accelerometer resonance. Finally, we proposed two methods for setting the digitizer sampling frequency to achieve a desired attenuation of aliases.
In the second part of the article, we have set forth some practi-cal rules for the proper design of a signal conditioner intended for pyroshock measurements. First, it was shown that gain must be distributed around the low-pass filter assuring that pre-filter gain will not cause clipping and distortion of the in-band signal. Second, a latching overload detector must be armed prior to the shock event, and then interrogated after the event to assure the test data is not corrupt. Third, a slew limiter must be placed as early in the signal path as possible to protect all downstream amplifiers from excessive dV/dt of the out-band accelerometer resonance.
Acknowledgements The authors wish to thank S. Smith of Structural/Signal Analysis
Consultants and C. P. Wright of the Aerospace Corporation for their valuable suggestions.
References1. LP8FP Spec Sheet, Precision Filters, Inc., 240 Cherry Street, Ithaca, NY.2. TD8D Spec Sheet, Precision Filters, Inc., 240 Cherry Street, Ithaca, NY.3. Rubin, S., “Concepts in Shock Data Analysis,” Shock and Vibration
Handbook, Cyril M. Harris and Allan G. Piersol, Eds., McGraw Hill, Fifth Edition, 2002.
4. Wright, C. P., “Effective Data Validation Methodology for Pyrotechnic Shock Testing,” 25th Aerospace Testing Seminar, October 2009.
5. Smith, S., “Why Shock Measurements Performed at Different Facilities Don’t Agree,” 66th Shock and Vibration Symposium Proceedings, Biloxi, MS, October 1995.
6. PCB Piezotronics, 3425 Walden Avenue, Depew NY.7. Endevco Corporation, 30700 Rancho Viejo Road, San Juan Capistrano
CA.8. Kistler Instrument Corporation, 75 John Glenn Drive, Amherst NY.9. Aliasing and Anti-Aliasing Filters, Precision Filters, Inc., 240 Cherry
Street, Ithaca, NY.10. Walter, Patrick L., “Selecting Accelerometers for Mechanical Shock
Measurements,” Sound and Vibration, December 2007.11. Wright, C. P., Applied Measurements Engineering – How to Design Ef-
fective Measurement Systems, Prentice Hall, Englewood Cliff, NJ, ISBN 0-13-253477-0, 1995.
12. Smith, S., “The Effect of Out-of-Band Energy on the Measurement and Analysis of Pyroshock Data,” 80th Shock and Vibration Symposium Proceedings, San Diego, CA, October 2009.
Figure 15. 11 V/µSec slew limiter used to prevent distortion caused by ac-celerometer ringing.
Signal conditioner
Pre-filterGain = 750
Post-filterGain = 2.667
FilterFc = 44 kHz
DAS
–2.0 V
+2.0 V
–10 V
+10 V
Shock waveform
w/ slew limiterw/o slew limiter
the high dV/dt of the accelerometer ringing does NOT have to be supported by high-slew-rate op-amps. The proper design criteria is to have sufficient slew rate to support the highest expected in-band signal of interest and then to incorporate a slew limiter to limit the signal dV/dt to the minimum slew rate of all downstream circuit components. The slew limiter must be placed as early in the signal path as possible. Figure 14 shows a slew limiter that is designed to reduce the dV/dt of a pulse waveform to a maximum of 11 V/µSec in both positive and negative directions.
Figure 15 shows the result of placing the 11 V/µSec slew limiter in the signal path prior to any amplifier stages. The slew limiter reduces out-band content such that the signal at the output of the pre-filter gain stage will have a dV/dt not greater than 11 V/µSec. By limiting the signal slew rate to the maximum that can be sup-ported by the downstream circuitry, slew distortion will not occur and the in-band data is faithfully reproduced.
Summary We have proposed a set of design criteria for a shock measure-
ment system based on a chosen SRS error target. Rather than fol-low a set of strict rules for measurement system specification, our methodology allows the engineer to navigate the tradeoffs between the filter type and setting and the accelerometer resonant frequency in order to keep within a maximum SRS error. By properly specify-ing the low-pass filter in accordance with our criteria, even lower resonance (≤100 kHz) piezo-electric transducers may be used to The author may be reached at: [email protected].