Embed Size (px)
Citation preview

Strengthening National Comprehensive Agricultural Public
Expenditure in Sub-Saharan Africa
SIERRA LEONE
BASIC AGRICULTURAL PUBLIC EXPENDITURE DIAGNOSTIC
REVIEW (2003-2012)
FEBRUARY 2015
FINAL REPORT
97403 P
ublic
Dis
clos
ure
Aut
horiz
edP
ublic
Dis
clos
ure
Aut
horiz
edP
ublic
Dis
clos
ure
Aut
horiz
edP
ublic
Dis
clos
ure
Aut
horiz
ed

2
TABLE OF CONTENTS
ACKNOWLEDGMENTS.............................................................................................................. 6
ACRONYMS AND ABBREVIATIONS ...................................................................................... 7
EXECUTIVE SUMMARY ............................................................................................................ 9
INTRODUCTION ...................................................................................................................... 15
1. BACKGROUND TO SIERRA LEONE’S AGRICULTURE PUBLIC EXPENDITURE REVIEW ...................................................................................................................................... 17
1.1 Methodology and scope of the review ............................................................................... 17 a) Definition of the Agricultural Sector .......................................................................................... 17
1.2 Economic, policy and institutional context ..................................................................... 18 a) Rapid overview of the Economic Context ................................................................................ 18 b) Public Financial Management in Sierra Leone ...................................................................... 20 c) Decentralization in Sierra Leone ................................................................................................. 22
1.3 Agriculture Sector : policy framework, institutions involved, past and recent performances .................................................................................................................................... 23
a) Agriculture Sector framework ..................................................................................................... 23 b) Public Institutions in Sierra Leone’s Agriculture Sector ................................................... 25 c) Overview of Projects and Programs Implemented in the Agricultural Sector ......... 28 d) Conclusions of the recent Agriculture Sector Review on the agriculture sector contribution and challenges ................................................................................................................... 29 e) The evolution of the Agriculture GDP in recent years in Sierra Leone: ...................... 29
2 LEVEL OF PUBLIC EXPENDITURE IN AGRICULTURE ........................................... 35 2.1 Projected And Executed Budgets of MAFFS, MLCP, MFMR ......................................... 37
a) Budget funded by domestic resources ...................................................................................... 37 b) Internally funded decentralized expenditure ........................................................................ 42 c) Budget funded by external resources ........................................................................................ 44
2.2 TRENDS IN AGRICULTURAL SECTOR EXPENDITURE AND THE MAPUTO TARGET ................................................................................................................................................................ 47
a) A sector predominantly funded by ODA .................................................................................. 47 b) Expenditure levels consistently bellow the Maputo statement of intent ................... 48
2.4 Expenditure per capita ........................................................................................................... 52
3. PUBLIC EXPENDITURE IN AGRICULTURE: ECONOMIC AND FUNCTIONAL COMPOSITION, REGIONAL DISTRIBUTION ................................................................... 54
3.1 Objective of the Analysis ........................................................................................................ 54 3.2 Economic Composition of Expenditure ............................................................................ 54 3.3 Functional Composition of Expenditure .......................................................................... 56
a) Functional analysis of Development Partners funded expenditure in the agriculture sector ........................................................................................................................................ 57
3.4 Regional distribution of expenditure................................................................................ 62 a) Centralized versus decentralized spending ................................................................................ 62 b) Regional Allocation of public agricultural Expenditure .................................................... 62 c) Funds devolved to districts ............................................................................................................ 63
4. TECHNICAL EFFICIENCY IN THE PREPARATION, IMPLEMENTATION, AND MONITORING OF AGRICULTURE EXPENDITURE ........................................................ 66

3
4.1 Planning and budgeting procedure ................................................................................... 66 a) Overview Of Past And Current Budget Planning Procedures .............................................. 66 b) Quality of annual budget and plans ........................................................................................... 67
4.2 Execution rates .......................................................................................................................... 67 4.3 Management of ODA in the Agriculture Sector .............................................................. 70
a) Fragmentation of Aid, high number if PIUs................................................................................. 70 b) Mis-alignment between national and projects’ budget preparation processes .......... 71
4.4 Resources allocation process, efficiency of spending ................................................. 72 4.5 Revenues and their management ....................................................................................... 74
5. CONCLUSIONS AND RECOMMENDATIONS: How could the quality of spending be strengthened ? .................................................................................................................. 76
5.1 Factors affecting the quality of spending ......................................................................... 76 5.2 Proposed actions for improving the efficiency of public expenditure in agriculture.......................................................................................................................................... 77 5.3 Addressing aid fragmentation ............................................................................................. 79 5.4 Working towards a Sector-Wide Program ...................................................................... 79
ANNEXES
Annex 1: Terms Of References Of The Agriculture Sector Public Expenditure Review ..................................................................................................................................................................... 80
Annex 2: Tors And Composition Of The Technical Working Group And Of The Steering Committee............................................................................................................................. 89
Annex 3: MAFFS organogram .......................................................................................................... 90
Annex 4: Ministry of Land and Country Planning organogram ......................................... 91
Annex 5: Data collection strategy .................................................................................................. 92
Annex 6: Level of expenditure in comparison to Maputo Targets (in Billion Leones) ..................................................................................................................................................................... 95
Annex 7: functional classification used by MAFFS under the MAFSAN project .......... 96 LIST OF BOXES
Box 1 : Steps taken ............................................................................................................................... 16
Box 2: Medium-Term Macroeconomic Framework ............................................................... 19
Box 3: The four strategic aims pursued under the Sierra Leone 2014-2017 PFM reform strategy ..................................................................................................................................... 21
Box 4 : Sierra Leone’s Public Sector Hierarchy ........................................................................ 22
Box 5: Measuring the Local Public Sector Expenditures in Sierra Leone ...................... 23
Box 6: Data collection process. ...................................................................................................... 36
Box 7: limits of functional analysis of agriculture expenditure ......................................... 61
Box 9: MAFFS reporting .................................................................................................................... 73

4
LIST OF FIGURES
Figure 1: Historical growth of GDP per capita since independence ................................. 18
Figure 2 : Annual Agriculture GDP growth 1998-2011 (%) ................................................ 30
Figure 3 : Evolution of the AgGDP and GDP annual growth over the period 2003-2012 .......................................................................................................................................................... 31
Figure 4: Evolution of the agricultural Value Added per worker, per ha of arable land and cereal production per 100 inhabitant (1980-2012) ...................................................... 32
Figure 5 : Main organizations conducting agricultural extension in Sierra Leone .... 33
Figure 6. Evolution of the MAFFS provisional and implemented budget from domestic resources in current and constant terms, 2004–2012 ...................................... 38
Figure 7. Evolution of provisional budget from domestic resources in current terms, 2004–2012 ............................................................................................................................................. 40
Figure 8: Evolution of implemented budget from domestic resources in current terms, 2004–2012 ............................................................................................................................... 40
Figure 9: Evolution of the agriculture sector institutions executed expenditure (cumulated, in ‘000 Le) ...................................................................................................................... 41
Figure 10: Compared evolution of implemented budget from domestic resources in current terms, for the agriculture, health and education sector (2004-2012) ............ 42
Figure 11: Local level expenditure (spent budget), by sector (2007-2012) ................. 43
Figure 12: Externally funded expenditure (agriculture sector), 2003-2012 ............... 44
Figure 13: Externally funded expenditure (across sectors), 2003-2012 ....................... 45
Figure 14: Comparison of agriculture sector expenditure (various sources of funding and spending agencies, in million Leones) ................................................................................ 47
Figure 15: Evolution of combined agriculture expenditure (% of total) in Sierra Leone and comparison to the Maputo Target. .......................................................................... 49
Figure 16: Trends in Agricultural Sector Expenditure, percent of GDP and AgGDP, 2004-2012 .............................................................................................................................................. 50
Figure 17: Per agricultural capita government expenditure on agriculture by area, 1980 – 2007 ........................................................................................................................................... 53
Figure 18: Evolution of personnel, recurrent non-wage and development expenditure over the period 2004-2012 .................................................................................... 54
Figure 20: Sub-sector contributions to AgGDP (av. 2003-2012) ..................................... 59
Figure 21: Relation between Poverty rates and Agriculture sector district allocations for the 13 rural districts of Sierra Leone ............................................................. 64
Figure 22: Relation between percentage of food insecure households and Agriculture sector district allocations for the 13 rural districts of Sierra Leone ........ 65
5
Figure 23: Actual vs budgeted expenditure 2004-2012 (MAFFS, agriculture sector, Domestic Development Expenditure in the Agriculture Sector). Internal Resources. ..................................................................................................................................................................... 68
Figure 24: Execution rate of budget transferred to the local councils (2007-2011). Agriculture (COFOG) and all sectors. ........................................................................................... 69
Figure 25: Number of projects and average amount disbursed annually by project (in $US) over the period 2003-2012 ............................................................................................ 71 LIST OF TABLES
Table 1: List of SLARI supervised agencies involved in agricultural R&D ..................... 28
Table 2: Summary of aggregate expenditure (as a share of total expenditure) for the ministries and entities considered in the AgPE review (years 2011 and 2012) ......... 39
Table 3: Evolution of devolved spending in selected sub-saharian Africa countries 44
Table 4: Share of various sectors in total externally funded expenditure in Sierra Leone (2003-2012) ............................................................................................................................. 46
Table 5: Share of domestic fund in total agriculture expenditure .................................... 48
Table 6: Percentage of total expenditure executed in the agriculture sector (2007-2012) ........................................................................................................................................................ 49
Table 7: International comparison of budget transfers to agriculture, 2002–2012.. 51
Table 8: Expenditure per capita (USD) in various Sub-Saharan countries ................... 52
Table 9: Share of wages and non wages expenditure in various sub-saharian African countries (2009) .................................................................................................................................. 55
Table 10: Funds budgeted for agricultural R&D in sub-Saharan Africa ......................... 61
Table 11: Centralized vs decentralized spending in various sub-Saharan Africa countries. ................................................................................................................................................. 62
Table 12: DP funded project expenditure by region vs population repartition .......... 63
Table 13: District level expenditure in the agriculture, health and education sectors (Le. Millions). ......................................................................................................................................... 63

6
ACKNOWLEDGMENTS
This Agriculture Public Expenditure Review analysis was carried out by a team of consultants under the guidance of the Sierra Leonean Ministry of Agriculture, Forestry and Food Security (MAFFS) and the World Bank. The core work was undertaken by Niels Morel (Agriculture Specialist – Consultant), Dr Bob Conteh (Economist – Consultant), and Abdulaye Kamara (Data collection specialist - Consultant). The consultants presented the preliminary findings during a Video Conference organized by the World Bank on October the 9th 2014.
The consultants wish to express their gratitude to the Sierra Leonean authorities, the technical and financial partners, and other non-governmental partners for their warm welcome, their availability, and their excellent collaboration. In particular, they wish to Mr. Prince Kamara, National SCP Coordinator and all the members of the Technical Working Group for the support they gave to the work of the Review. The consultants also wish to thank Stephen Mink (Lead Economist, TTL, Word Bank) and Hardwick Tchale (Agricultural Economist, World Bank) for their support, advice, and comments throughout the duration of this work.
The cost of this Review was met by the Strengthening National Comprehensive Agricultural Public Expenditure in Sub-Saharan Africa Program, co-funded by the Bill and Melinda Gates Foundation and the Comprehensive Africa Agriculture Development Program (CAADP) Multi-Donor Trust Fund, and executed by the World Bank.

7
ACRONYMS AND ABBREVIATIONS
ABC Agriculture Business Centre
AFAIP Agriculture, Fishery and Agro-Industry Program
AfDB African Development Bank
AgGDP Agric. Gross Domestic Product
AgPER Agriculture Sector Public Expenditure Review
CAADP Comprehensive Africa Agriculture
Development Programme
CGE Computable General Equilibrium
CILSS Comité permanent Inter-Etats de Lutte contre la
Sécheresse dans le Sahel
COFOG Classification of the Functions of Government
CORAF West and Central Africa Council for Agriculture
Research and Development
ECOWAS Economic Community of West African States
ER External Resources
EU European Union
FAO Food and Agriculture Organization
FARA Forum for Agricultural Research in Africa
FFLS Farmer Field and Life School
FFS Farmer Field School
GAFSP Global Agriculture and Food Security Program
GDP Gross Domestic Product
GIZ German Federal Enterprise for International
Cooperation
GoSL Government of Sierra Leone
IAR Institute of Agricultural Research
IDB Islamic Development Bank
IFAD Islamic Fund for Agricultural Development
IFPRI International Food Policy Research Institute
IMF International Monetary Fund
IR Internal Resources
IVS Inland Valley Swamp
JICA Japan International Cooperation Programme
MAFFS Ministry of Agriculture, Forestry and Food
Security
MDA Government Ministries, Departments and
Agencies
MDG Millennium Development Goal
MLCP Ministry of Land and County Planning
MFMR Ministry of Fisheries and Marine Resources
MoFED Ministry of Finance and Economic
Development
MTEF Medium Term Expenditure Framework

8
MTI Ministry of Trade and Industry
NaCSA National Commission for Social Action
NAFSL National Association of Farmers for Sierra
Leone
NATC National Agriculture Training Center
NEPAD New Partnership for Africa’s Development
NGO Non Government Organization
NRDS National Rice Development Strategy
ODA Official Development Assistance
PEFA Public Expenditure and Financial
Accountability
PER Public Expenditure Review
PETS Public Expenditure Tracking Survey
PRSP Poverty Reduction Strategy Paper
ReSAKSS Regional Strategic Analysis Knowledge Support
System-West Africa
RRS Rice Research Stations
SCP Smallholder Commercialization Program
SLANGO Sierra Leone Association of NGO
SLARI Sierra Leone Agricultural Research Institute
TWG Technical Working Group
UNDP United Nations Development Programme
USAID United States Agency for International
Development
WB World Bank
WDI World Development Indicators
WHH Welt Hunger Hilfe

9
EXECUTIVE SUMMARY
Despite the civil conflict which affected the country from the early 1990s to the beginning of 2000, Sierra Leone economy has shown significant improvement during the last decade starting in 2003. While agriculture has also shown remarkable improvement, more needs to be done to achieve higher and sustainable level of sector growth. Agricultural value-added has picked up after the end of the civil war and growth has averaged around 6 percent or more per annum over the last few years. Labor and land productivity remain however, leading invariably to depressed rural wages, limiting the ability of the sector to contribute to poverty reduction. Since 2002, with the help of financial and technical assistance from several Development Partners the GoSL has made good progress in strengthening its PFM framework and systems although emerging challenges – such as the rapid devolution process - need to be managed so as to consolidate on these achievements and build on them. As illustrated during the recent Consultative Workshop on Agriculture (Consultative Dialogue on the Path to Prosperity, Nov 2013) chaired by HE. Ernest Bai Koroma, President of the Republic of Sierra Leone, agriculture is increasingly seen in Sierra Leone as a sector involving multiple government institutions and it is in the context of a broader Agriculture Sector Review that the Ministry of Agriculture, Forestry and Food Security commissioned this Agriculture Public Expenditure Review (AgPER). The key objective of the AgPER were to collect and analyze key historic data on public spending on agriculture, examining the efficiency of spending, and identifying areas where additional funds could be applied effectively to achieve national agricultural policy and CAADP objectives. The main findings of this review are the following: Expenditure levels in the sector – while tripling over the period - remain consistently below the Maputo statement of intent Under the Maputo Declaration of 2003, African governments committed to increasing the share of their national budgets devoted to agriculture, with a target of at least 10% so as to achieve agricultural growth of at least 6% per year. While this level of growth was achieved, the analysis of past expenditures shows that combined spending from internal resources and donors on broad agriculture was approximately 4% percent in FY 2004 to 2007, reaching 9% in FY 2008 and 2009 and approximately 6-7% in the recent years. The overall trend in terms of budget allocated to the agriculture sector (which has tripled in nominal terms over the period) however clearly reflects an increased attention paid to the sector during the period of re-construction and concomitant with the Maputo statement of intent. To demonstrate a level of support in line with the Maputo statement of intent, Sierra Leone would have to reach a level of agricultural support in the order of USD 92.7 million per year. The current report shows also that external resources are a very significant portion of the budget allocated to / spent in the agriculture sector (as well as in many other key sectors

10
such as health and education) in Sierra Leone and donor funded expenditure in the agriculture sector have increased very sharply with DP funded annual expenditure fluctuating around 40 million $US since 2010 in the agriculture sector.
Local spending have seen a massive increase over the period and this sustained increase while potentially positive, raise important questions in terms of capacity building for the local government officials in charge of administering these resources. The report provides cautionary notes in this regard, recommending that the authorities build more capacity and improve procedure and oversight. Economic and functional composition of expenditure appears broadly adequate given existing constraints but could see improvements An analysis of the economic composition of spending shows (on internal resources) shows that recurrent expenditure (salaries and non-salary recurrent expenditure) represent by far the largest share of total spending (close to 80%) at central level on internal resources. The situation is however not un-common in low income sub-Saharan Africa countries and a positive aspect of how the Sierra Leonean situation has evolved over the last 10 years is the fact that the share of Domestic development expenditure is on the increase: representing less 10% in 2004 they hovered around 20% in recent years. In terms of regional evolution of expenditure, a comparison of the Sierra Leonean situation regarding decentralized spending (on internal resources) puts the country in an intermediate situation between the countries that have already achieved a good degree of decentralization (Ghana for example) and those who did little or no implementation (Togo, Liberia notably). The level of agriculture expenditure in the various regions is consistent with the repartition of the population but do not appear strongly correlated with poverty levels and food insecurity. Technical efficiency in the preparation, implementation, and monitoring of agriculture expenditure could be greatly improved, notably by reducing the fragmentation of ODA. Among the weaknesses of the planning/budgeting process in Sierra Leone is the fact that investment is not sufficiently linked to its recurrent expenditure implications. Also, The budget formulation process is generally weak and would require a substantial overhaul to link policy and planning to expenditures. Changes also need to be made to make it easier to analyze budget data and comparing outturns with budget estimates. Execution rates in the sector have been lower than execution rates of the overall State budget, though they are improving. The MoFED ODA database shows that the number of project in the agriculture sector has constantly increased during the period 2003-2012 while at the same time, the average amount disbursed by project was decreasing. In all logic, the trend should be exactly the reverse, with less and less larger and larger projects. This situation creates a roadblock to the quality of the management of ODA, considerable coordination challenges and reductions in aid effectiveness.

11
In addition, there is clearly a mis-alignment between national and projects’ budget preparation processes (in terms of format and timing) and a large portion of aid is ‘off-budget’. Effectiveness of spending may remain limited
Available data do not allow analysis of effectiveness in great depth. Hard evidence on the effects of government spending is not available, as the MAFFS’s monitoring system is not yet operational. However, the recent Agricultural Household Tracking Survey (AHTS, 2011) contains rather detailed information on access to all types of agricultural services at the level of the household. Overall, access to affordable agricultural services remain very limited for the majority of the farmers and efforts done by MAFFS to enhance service delivery needs to be improved. Conclusions and recommendations In addition to increasing the volume of public expenditure to achieve appropriate levels of growth of agricultural production and poverty reduction, the available funds need to be spent in a focused and efficient manner. Level of spending is in effect important and quality of spending is most critical. For better-quality public expenditures in agriculture that generate a greater degree of ownership, incidence, impact, and sustainability, the authors recommend to apply the following policy options and specific recommendations:
Actions Responsibility
Budget
programming and
level of spending
- Establish medium-term expenditure
frameworks as a budget planning tool.
- Increase the resources allocated to the
agriculture sector as the current share of the
State budget appears inadequate in terms of
the Maputo statement of intent.
State House,
MoFED, Line
Ministries
- Reduce the number of DP funded projects
and increase size of each projects by more
systematically using pooled fund (basket
funds, etc) in order to reduce the
transactions costs of ODA management;
- Include in the budgets of the agricultural
sector ministries all agricultural
development projects, in particular those of
DPs that are currently not monitored by
MEF or the Ministry of Planning.
MoFED,
Ministries, DPs
(Ag. Sector
Working Group)
- Formulation of project to be made on the
basis of past experience (evaluations,
capitalization on success and failures).
Ministries and
other institutions
involved in the
Ag. Sector, DPs

12
- Establish a mechanism for budgeting for
operating expenditure on maintenance of
capital items.
- Divide coherently roles and means for
investment maintenance between central
level and Local Councils
MoFED,
Ministries and
other institutions
involved in the
Ag. Sector
- Improve cost accounting at the development
funded project level to identify the operating
costs incurred by the project management
- Identify project management functions
which cost could be reduced by pooling
resources across projects.
Ministries and
other institutions
involved in the
Ag. Sector, DPs
Budget
Implementation and
Procurement
- Present commitment and procurement plans
at the same time as the annual budget, and
make tender documents available before the
start of the budget year so that calls for
tender can be issued in January.
- Better monitoring of investments made at
the level of support services and of
beneficiaries, and better monitoring of the
regional distribution of expenditures;
MoFED,
Ministries and
other institutions
involved in the
Ag. Sector
Decentralization /
devolution - Develop and implement a comprehensive
capacity building plan at Local Council
level.
- Transfer staff (and corresponding budget)
from central level payroll to Local Council
payroll
Ministry of Local
Planning, MoFED,
Ministries and
other institutions
involved in the
Ag. Sector.
Monitoring and
Evaluation
- Implementation at all levels of an effective
M&E system coupled with an efficient
information archiving and dissemination
mechanism
- Draw up a system for monitoring
performance in the agricultural sector with
the use of quantifiable and verifiable
performance indicators, potentially based on
PNDSA indicators
- Institutionalize the AgPER process, with
light annual AgPE reviews and in-depth
reviews every 3-5 years.
- Strengthen annual assessments of
ministries’ progress, detailing monitoring of
actions and activities.
- Overhaul MAFFS (and other public
institutions reports involved in the
agriculture sector) annual reports
- Improve information feedback on actual
expenditure by all services and make this
information available through annual
reports.
Ministries and
other institutions
involved in the
Ag. Sector

13
- Ensure the introduction of an effective
system for monitoring program budgets in
aggregated fashion (not just PIU by PIU).
- Produce evaluation reports for all projects.
Establish an Evaluation Unit under PEMSD.
- Produce impact studies for major projects.
Functional
allocation - Better functional distribution of
expenditures is needed.
- The livestock (including veterinary services)
subsector as well as R&D appear to be
largely under-funded and require immediate
attention.
- Agriculture extension received only 2.11%
of the total spent in the sector through the
projects, which appears as a low figure in
comparison to the central role that extension
can play in the dissemination of agricultural
technologies. Since private extension
services are quasi inexistent, a higher level
of spending into public advisory services is
necessary, especially in a context where
efforts are put into decentralization and
devolution
Ministries and
other institutions
involved in the
Ag. Sector
Policy Development - Elaborate a strategy for agricultural
extension so as to include the role of all the
parties involved (MAFFS, private sector,
NGOs, local councils)
Ministries and
other institutions
involved in the
Ag. Sector
- Study how to end the duplications observed
between existing project and future PIUs.
Give support to pooling resources and
ensuring their ownership by the sectors
institutions. Enact MAFFS ODA
management decree / guidelines.
Ministries and
other institutions
involved in the
Ag. Sector
- Evaluate past expenditure in support to
mechanization and develop a strategic
framework for mechanization development
Ministries and
other institutions
involved in the
Ag. Sector
Working towards a Sector-Wide Program
The preparation of the SCP and its subsequent implementation were positive steps towards
making donor interventions and GoL spending consistent and coordinated under the umbrella of
the NSADP. The challenge now is to maintain the momentum and develop this approach further
into a SWAP-like arrangement with ideally pooled funding arrangements for the required
financial requirements1. The preparation of this future Sector Wide approach could also be the
1 The present AgPER evaluates future desirable levels of spending at around 100 million USD per year

14
opportunity to translate into concrete decision and actions numerous of the recommendations of
this Ag-PER, in particular with regard to Donor Coordination, M&E, strengthening Local
Council capacities and alignment of planning procedures.

15
INTRODUCTION
1. As illustrated during the recent Consultative Workshop on Agriculture (Consultative
Dialogue on the Path to Prosperity, Nov 2013) chaired by HE. Ernest Bai Koroma, President of
the Republic of Sierra Leone, agriculture is increasingly seen in Sierra Leone as a sector
involving multiple government institutions. At least five key Ministries were represented at high
level at the workshop and the necessity to establish coordination mechanism and effective
complementarities at policies and programmatic levels were highlighted repeatedly. The AgPER
methodology builds on this approach by reviewing past expenditures at a sectoral level (based on
the COFOG definition).
2. It is in the context of a broader Agriculture Sector Review that the Ministry of
Agriculture, Forestry and Food Security expressed its desire for an agricultural public expenditure
review to be carried out in order to increase the level of performance in the medium term by
learning from past experience of the use of public funds. This request was accepted by NEPAD’s
Planning and Coordinating Agency. The costs of this Review were met by the Strengthening
National Comprehensive Agricultural Public Expenditure in Sub-Saharan Africa Program and co-
funded by the Bill and Melinda Gates Foundation and the CAADP Multi-Donor Trust Fund. This
program, to be implemented by the World Bank, aims to improve the impact of public resources
at the disposal of governments in Sub-Saharan Africa, foster agricultural development, and
reduce rural poverty, which in most countries affects the majority of the poor.
3. This Agriculture Public Expenditure Review (AgPER) provides key background
information and guidance in this endeavor by presenting and analyzing historic data on public
spending on agriculture, examining the efficiency of spending, and identifying areas where
additional funds could be applied effectively to achieve national agricultural policy and CAADP
objectives.
4. The goals of the Agricultural Public Expenditure Review in Sierra Leone are as follows:
o Gain a better understanding of the country's performance in the context of the
2003 Maputo Declaration;
o Draw lessons from the past in terms of budget execution in the agricultural sector
and identify bottlenecks, inefficiencies, and deviations from goals;
o Seek and recommend corrective actions for existing and future programs with a
view to improving their impact and making them more efficient and equitable;
o Initiate the implementation of the databases and methodology required for
conducting similar reviews regularly and thus contribute to the
institutionalization of the process;
o Help the government establish an environment and capabilities for results-based
management, with particular emphasis on improving planning, execution, and
monitoring and evaluation; and
o Increase visibility for the government and the financial and technical partners
over the sector's absorptive capacity so that the decision may be made to allocate
more resources to agricultural development.
5. This report consists of five chapters: o The first chapter introduces the strategic and institutional context; o The second chapter studies the level of public agricultural expenditure in
Sierra Leone; o The third chapter analyzes the economic and functional composition of
public agricultural expenditure (allocative efficiency);

16
o The fourth chapter assesses the technical efficiency of the processes of preparation, execution, and monitoring and evaluation of agricultural budgets; and
o The fifth chapter contains our findings and recommendations.
6. In accordance with the terms of reference, the review covers the 10-year period 2003-2012.
Box 1 : Steps taken
An inception workshop for the AgPE Review was held on Thursday November the 14th 2013 at the
Ministry of Agriculture, Forestry and Food Security, chaired by the Honorable Minister. The meeting was
attended by 21 participants, representing various administrations (MAFFS, MoFED, SLARI, Statistics
Sierra Leone, Ministry of Lands, Country Planning and the Environment, Ministry of Fisheries and Marine
Resources) and Development Partners (AfDB, GIZ, + WB consultants). During the workshop,
presentations were made by the consultant team, highlighting: (i) the objectives of doing an AgPER; (ii)
steps and processes; (iii) data requirement; and (iv) working modalities.
The Honorable Minister of Agriculture, Forestry and Food Security nominated during the inception
workshop the members of the Technical Working Group to meet regularly with the AgPER consultant team
and review / discuss: progress made, difficulties encountered (notably in terms of data collection) and
processing / analysis of the data collected. It was agreed that the group could meet on a weekly basis during
the time the full team of consultant would be mobilized in Sierra Leone. The first meeting of the technical
working group took place on November 19, 2013.
Next steps focused primarily on data collection and subsequently data analysis. Progress and difficulties
were regularly reported by the World Bank consultant team to the Technical Working Group. Data
collection was conducted essentially through individual meetings with information-holders: DPs, GoSL,
and NGOs (through the NGO network SLANGO).
The AgPER team progressed alongside the team recruited specifically to produce the broader Agriculture
Sector Review and information was regularly exchanged between the two teams. A first presentation of the
preliminary results of the AgPER was made on October the 9th, 2014 through Video-Conference with the
participation of a number of officials from the GoSL including high level officials from the Ministry of
Agriculture, Forestry and Food Security and the State House. The AgPER preliminary results were
presented alongside a presentation of the draft Agriculture Sector Review Synthesis report. During the
Video-Conference, information was also given by Prof. Dr. Monty Jones (State House) on the current
Agriculture, Fishery and Agro-Industry Program (AFAIP) being currently launched.

17
1. BACKGROUND TO SIERRA LEONE’S AGRICULTURE PUBLIC EXPENDITURE REVIEW
1.1 METHODOLOGY AND SCOPE OF THE REVIEW
a) Definition of the Agricultural Sector
7. In the Maputo declaration in 2003, African governments made the commitment to
increase the share of their national budgets going to agriculture. Following this declaration,
NEPAD detailed the terms and conditions for calculating the share of agricultural expenditure in
national budgets by issuing a methodology document (AU/NEPAD 2005). This document defined
effective public expenditures (not allocated budgets) following the United Nation’s Classification
of the Functions of Government (COFOG) in the extended agricultural sector, which includes the
domains of agriculture (crop and animal productions), forestry (including silviculture other than
timber production), and hunting and fishing. Expenditures for applied research in each of these
sectors was taken into account. However, expenditures for supplying drinking water and feeder
roads as well as purely environmental expenses were not taken into consideration as expenditures,
following NEPAD procedures.
8. The AgPER has followed strictly the guidance note issued by the AU-NEPAD in 2005
relatively to the definition of the agriculture sector. Using the COFOG definition of the
Agriculture sector and translating it to the Sierraleonese context, the TWG and the consultant
team have agreed to consider the following set of data for inclusion in the AgPER work :
o Expenditure data of the following Ministries/institutions : MAFFS (401 2 ),
MFMR (402), Ministry of Land and County Planning (306), National
Commission on Environment and Forestry (410), Sierra Leone Agricultural
Research (418), Sierra Leone environmental Protection Agency (420).
o Externally funded project as recorded by the MoFED/ Development Assistance
Database (categories : agriculture + Natural Resources Management projects if
related to agriculture)
o District level expenditure (internally funded)
o Expenditure by NGOs to promote agricultural development was only considered
when they acted as implementing agencies as part of projects included or not in
the government budget.
9. In accordance also with NEPAD recommendations (AU/NEPAD 2005), the budgets of
public or commercially focused semi-public bodies were not taken into account as only net
subsidies transferred to these bodies from the government budget were considered public
expenditure. Similarly, private investment, including by producers, was not considered.
10. Expenditure related to rural/feeder roads were not taken into account, again in accordance
with the NEPAD guidelines. Taking into account the important role that feeder roads play in
agriculture development, it was however agreed initially that the AgPER work could be
conducted using a “COFOG+” definition (incorporating rural/feeder roads) in addition to the
basic COFOG definition. In practice, however, this was not possible because of lack of access to
reliable data on spending on rural roads. It is not impossible however that some of the DP funded
projects included in the agriculture sector in this review have executed expenditure relating to
rural roads.
2 Codes used in Sierra Leone public accounts to designate expenditure by institution.

18
1.2 ECONOMIC, POLICY AND INSTITUTIONAL CONTEXT
a) Rapid overview of the Economic Context
11. Despite the civil conflict which affected the country from the early 1990s to the
beginning of 2000, Sierra Leone has shown significant improvement over the years since the end
of the conflict in 2002. Economic performance since 2010 has been quite robust as the per capita
growth has increased to levels that surpass the levels achieved at any time since independence.
Following better spending controls and improved revenue collection, the fiscal deficit is expected
to narrow to 3.9% of GDP in 2014. After an estimated leap in real GDP growth, to 17.9% in
2012, due to the onset of iron ore production, growth will remain brisk in 2013-14, at an average
of 12.3%, supported by continued expansion in the mining sector. Average inflation is set to
moderate, to 12.2% in 2013 and 10.4% in 2014, as domestic agricultural production improves,
world food prices fall and the currency appreciates, only partly offset by a reduction in fuel
subsidies. The current-account deficit is forecast to shrink from an estimated 19.8% of GDP in
2012 to 7.7% of GDP in 2014 as mining exports increase. Strong export growth means that the
trade balance will move into surplus by 2014.
Figure 1: Historical growth of GDP per capita since independence
Source: Statistics Sierra Leone, IMF and Bank staff estimates.
12. Despite the strong post-conflict growth, significant challenges still remain. First, poverty
levels are still high. Poverty is heavily concentrated in the rural and other urban areas outside
Freetown. According to the Sierra Leone Integrated Household Survey (SLIHS) conducted in
2011, the poverty rate declined from 66.4 percent in 2003 to 52.9 percent in 2011. The overall
reduction was led by strong growth in rural areas, where poverty declined from 78.7 percent in
2003 to 66.1 percent in 2011, yet this figure was overall still higher than urban poverty. Urban
poverty declined from 46.9 percent in 2003 to 31.2 percent in 2011, though poverty increased in
Freetown from 13.6 percent to 20.7. The causes behind the increase in poverty in Freetown are
not completely explained by the available data, and further research is needed to fully understand
the dynamics. While the characteristics of poor households varied between urban and rural areas,
a common factor was those with less education had higher likelihoods of being poor. This was
especially true in urban areas. In addition, those households which were engaged in a non-farm

19
enterprise in urban areas and female headed households were less likely to be poor. In rural areas,
households in which the household head’s primary occupation was agriculture, as well as those
with smaller landholdings, were more likely to be poor.
Box 2: Medium-Term Macroeconomic Framework
Economic growth (excluding iron ore) is projected to reach 7 percent in 2017, up from 6 percent
in 2013, due to continued public investment scaling up, increased productivity, notably in
agriculture, and sustained activity in construction and services. Non-iron ore activity will also
benefit from upstream activity in iron ore mining where production (under phase I of the largest
mine) is expected to increase through 2015, and level off starting in 2016. Consequently, total
real GDP growth is forecast to rise from 13.3 percent in 2013 to 14 percent in 2014 and
decelerate to 12.4 percent in 2015 and 5.2 percent by 2017.
Inflation is projected to decline from 9 percent in 2013 to 5.4 percent in 2017, on account of
continued prudent monetary and exchange rate policies. It is also expected that government
supported programs in agriculture would contribute to increased supply of rice and other key food
crops, and help dampen food inflation. In addition, monetary policy would be adequately
calibrated to contain inflationary pressures, and macro-prudential measures would be geared
towards a healthy expansion of private credit.
In the external sector, the current account deficit would narrow from about 20 percent of non-iron
ore GDP in 2013 to around 7 percent by 2017 as exports are projected to increase, notably in
mining and agriculture, while imports would moderate over the medium term, partly reflecting
lower FDI flows than in 2011–12. The improvement in the external current account, combined
with sustained capital inflows is expected to increase gross international reserves from 3.2 months
of imports (excluding iron-ore related imports) in 2013, to 4.1 months by 2017.
The government’s medium-term fiscal strategy aims to strengthen revenue collection, improve
expenditure management, and reduce domestic debt. The revenue efforts will focus on: (i)
broadening the tax base; (ii) reducing customs and GST duty waivers; (iii) combating tax evasion;
and (iv) strengthening the National Revenue Administration through administrative reforms and
increased use of Information Technology. The projected expansion in economic activity and
increased iron ore exports will also support the government’s revenue mobilization efforts. On
this basis, revenue is projected to increase from 12.4 percent of non-iron ore GDP in 2013, to
13.5 percent in 2017; with revenue from mining rising from 1.2 percent of non-iron ore GDP
to1.8 percent for the period. Total expenditure will decline from 21.9 percent of non-iron ore
GDP in 2012 to 19.7 percent in 2013, which reflects the unwinding of one-off expenditure related
to elections and emergency programs. Total expenditure is projected to average about 20.5
percent of non-iron ore GDP for 2014–17, with more resources channeled to investment. It is
projected that wages and salaries will stabilize at 6 percent of non-iron ore GDP under the
ongoing pay reform. Under this strategy, domestic borrowing would gradually decline, allowing
the stock of public domestic debt to decline from 12.7 percent of non-iron ore GDP in 2013, to
11.2 by 2018.
Extracted from: IMF. Sierra Leone: Letter of Intent, Memorandum of Economic and Financial
Policies and Technical Memorandum of Understanding. Attachment 1.
13. With regard to trade and business environment, Sierra Leone conducted and validated
an initial DTIS report in 2006, supported by the World Bank. This included an extensive action
matrix aimed at prioritizing and sequencing policy reforms and other interventions for

20
mainstreaming trade into national poverty reduction and development strategies. Despite
considerable constraints Sierra Leone has achieved significant progress in a range of areas
specified in the action matrix, including legislative and regulatory changes to improve the overall
business climate and expanding institutional capacity for formulation and implementation of trade
policies. Implementation remains however partial in a number of areas, in particular those
relating to cross–cutting issues like trade facilitation and logistics, as evidenced by Sierra Leone’s
position in the latest Global Competitiveness Rankings which places the country second from
last.
14. The United Nations' Human Development Index, which focuses on the challenge of
sustainable and equitable progress, ranked Sierra Leone 180 out of 187 countries and territories
based on 2011 data. In 2012, Sierra Leone moved up to 177 out of 187 countries. Significant
challenges still remain in infrastructure including roads and energy, low public sector
implementation capacity, youth unemployment, and high maternal and infant mortality.
b) Public Financial Management in Sierra Leone
15. Since 2002, with the help of financial and technical assistance from the European
Commission (EC), the UK Department for International Development (DFID), the African
Development Bank (AfDB) and the World Bank, the GoSL has made good progress in
strengthening its PFM framework and systems. This has resulted in major PFM achievements
over the years, including the establishment of the legal and regulatory framework for budgeting,
accountability and procurement, implementation of a financial management information system
(FMIS) in the Accountant General’s Department in 2005 and its roll-out to several ministries,
departments and agencies (MDAs), and the removal of the backlog of annual financial statements
(over the last 4 years, the public accounts have been produced within the statutory deadline of 3
months of end of fiscal year). Independent external audit quality and scope has improved, as has
timeliness in the completion of audits. Basic budgeting, procurement, accounting, and reporting
procedures have been established in local councils. As a result, despite the very low starting point
at the end of the civil war, the scores from the Public Expenditure and Financial Accountability
(PEFA) assessment for Sierra Leone carried out in 2007 and 2010 show some clear improvements
(30 percent of the indicators improved).
16. The country faces significant new PFM opportunities that need to be harnessed and
emerging challenges to be managed so as to consolidate on these achievements and build on
them. The expected revenue streams from natural resource assets are very material and the A4P
highlights the significant funding gap required for the Government to close its infrastructure
deficit and cater to other development challenges. This requires the ability to transparently and
effectively translate financial resources into human and physical capital, a critical function of the
PFM system.
17. Recent observations by internal and external review missions (the World Bank, IMF and
EU mid-term review of Integrated Public Financial Management Reform Project) and the Audit
Service Sierra Leone reports indicate that areas of major weakness remain. Issues identified
include budget credibility and predictability, fiscal management challenges, weaknesses in
expenditure control (particularly development expenditure), and low levels of transparency.
Added to these are issues related to incomplete collection and reporting of revenues including
from the natural resource sectors and, hitherto, the lower than expected tax collections (making
the available resource envelope insufficient to fund rising expectations for service delivery); the
lack of a robust cash management system as there is no Treasury Single Account; fragmentation
between the budget and planning process; recurring off-budget expenditures; and a budget system

21
largely based around inputs rather than achievement of results. These make management of
public finances susceptible to allocative inefficiency and distract from the PFM system’s key role
of supporting effective service delivery.
18. In order to build on the progress of reforms achieved to date and to respond to the
inherent challenges, the GoSL has prepared a comprehensive program of PFM reform strategy.
This process is directed by the PFM Reforms (Oversight) Steering Committee and the strategy
targets improvements in the quality of PFM. There is a Medium Term Expenditure Framework
(MTEF), but in reality, the budget is annual and the medium term forecasts of future expenditure
plans are not robust nor are they coherently linked to policy or plans.
Box 3: The four strategic aims pursued under the Sierra Leone 2014-2017 PFM reform strategy
Budget Planning Comprehensiveness, and Credibility
Under this theme, the primary aims are that to establish a credible and stable budget process,
particularly to establish a transformational public investment program (PIP) and link investment
to recurrent operations and maintenance spending through the MTEF process.
Financial Control and Accountability, Service Delivery and Oversight
For the next phase of the strategy, the most critical objective is to complete the roll-out of IFMIS
to major spending MDAs and bring all CG public accounts--including sub-vented accounts and
DP project accounts--on to IFMIS. It is of utmost importance to note at this stage that this will
require substantial investment in the ICT infrastructure for the IFMIS. This will be a crucial step
toward establishing a TSA, as discussed below. Equally importantly, it will be the basis for a
comprehensive budget covering the whole of central government, and eventually general
government.
Revenue Mobilization
Two objectives will be stressed under this theme: (1) Consistently with likely developments in
resource-related industries, major efforts are being made to establish more effective tax and
control regimes for extractive industries through the Extractive Industries Revenue Act and the
Oil Exploration Act. (2) Challenges identified in revenue collection, reporting and reconciliation
will be addressed by improved systems and interfaces, which aims at improving the system for
recording and reconciling payment and receipts. A new MOU with the banks has already been
established.
Strengthening Local Governance Financial Management through Local Councils for
Effective Decentralization
The next phase shall emphasize a transfer of authority to the Councils, combined with effective
use of systems to meet both community and national goals of service delivery. These aims will be
reflected in the revised legislative framework. A critical objective shall be the consolidation of
the implementation of the Petra Accounting Package in all local councils including the real time
processing of transactions by selected councils. PETRA-based reports by councils could be
consolidated at the national level by the LGFD. Improved sectoral reporting from the Council
level should in turn allow redesign of the process of allocating grants and give greater authority to
councils over a smaller number of grants.

22
c) Decentralization in Sierra Leone
19. Devolution / decentralization is a strong commitment of the GoSL and has the potential
of resulting in more efficient spending in the agriculture sector. Sierra Leone began its transition
towards decentralized government in 2002, following the peace process that ended over a decade
of civil war and strife. Since 2004, significant progress has been made in devolving public service
delivery functions from the central line ministries to the 19 Local Councils. So far however,
Local Councils remain seriously constrained by limited devolution of administrative powers, as
all ‘local’ public servants -such as teachers and health workers- in practice remain staff of their
respective line ministries. In addition, limited local own-source revenues as well as limits on the
provision of intergovernmental fiscal transfers constrain the ability of Local Councils to improve
the quality of and access to local public services.
Box 4 : Sierra Leone’s Public Sector Hierarchy
Sierra Leone's public sector hierarchy comprises governmental entities operating at the National,
District, and Chiefdom levels. The Local Government Act (2004) established thirteen District
Councils, five Town Councils, and the Freetown City Council. The 19 Local Councils are further
subdivided into wards, the smallest level of local political organization. Sierra Leone's 149
Chiefdoms overlap with these District Councils, and are governed by Paramount Chiefs and
Chiefdom Councils drawn from eligible families. Some governance responsibilities, notably poll
tax collection, are shared between councils and chiefdoms, although the precise limits of the
authority of Chiefdoms are still being negotiated.
Functional Responsibilities of the Local Public Sector
20. Sierra Leone's Local Government Act (2004) provides for the devolution of all aspects of
some 80 functions to Local Councils, with funding for these services to be secured through a
combination of Local Council own-source revenues and formula-based grant allocations. As of
2011, 47 functions had been partially devolved, including the responsibility for basic education,
basic health services, agricultural extension services, water provision, solid waste management,
fire protection, and other community-level services. Although the responsibility for these
functions has been formally transferred to the Local Councils, the sectoral functionaries at the
local level continue to be appointed and managed by the central government.

23
Box 5: Measuring the Local Public Sector Expenditures in Sierra Leone
Measuring public sector expenditure is a complex endeavor that must recognize de existence of
three types of local expenditures:
1. Devolved expenditures – made by local governments;
2. Deconcentrated expenditures – made by deconcentrated units of the national government;
and
3. Other local public sector expenditures – expenditures that are made directly (or through
delegation) by the central government for “localized” public services.
In theory also, a good measure of Local Public Sector finances should not simply aggregate the
different funding streams into a single measure of local public sector expenditures, since
different types of political, administrative and fiscal arrangements at the subnational level are
likely to result in different levels and quality of public services.
In practice, the AgPER work in Sierra Leone has, as a first approach to measuring public
expenditure at local level, used the “devolved expenditures” (made by local governments) only.
21. Local Councils remain highly dependent on intergovernmental fiscal transfers. Sectorally
earmarked intergovernmental transfers account for 78% of local financial resources; no
unconditional grants are provided. Local own-source revenues, including poll taxes, fees, and all
other local revenues account for a minute share (about 1 percent) of national revenue collections.
An increasing share of national financial resources is dedicated to local, front-line services.
Despite these increases, only a small share of these resources is currently managed by the elected
Local Councils. Instead, central line ministries continue to retain control over the bulk of
localized expenditures, in conflict with the spirit of the Local Government Act (2004). If Sierra
Leone wishes to continue its post-conflict progress towards more responsive, more efficient and
more equitable public services, policy makers will need to consider moving wage payments and
development expenditures associated with devolved functions out of the central ministry budgets,
as a first step towards greater responsibility over these expenditures by local councils.
1.3 AGRICULTURE SECTOR : POLICY FRAMEWORK, INSTITUTIONS INVOLVED, PAST AND
RECENT PERFORMANCES
a) Agriculture Sector framework
22. The policy framework through which Government has been addressing these challenges
over the years includes the Agenda for Change (2004-2012) and the Agenda for Prosperity (2013-
2018). In the agricultural sector, the Government has operationalized these development
strategies through the National Sustainable Agriculture Development Plan (NSADP) which was
developed in line with the requirements of the Comprehensive African Agriculture Development
Program (CAADP) compact. The flagship program under NSADP is called the Smallholder
Commercialization Program (SCP). The SCP has the overall aim of making agriculture the
‘engine’ for socio-economic growth and development through the development of commercial
agriculture. The program has over the last few years been focusing on intensification,
diversification and commercialization of smallholder agriculture (through improving value-
addition and access to marketing). The priority areas for the Sierra Leone Agriculture
Development Strategy, as per the NSADP, include promoting commodity commercialization,

24
rehabilitating and upgrading the agriculture infrastructure, creating incentives for private sector
investment, and coordinating the sector’s activities. This is to support the Agenda for Prosperity’s
(AfP) sector focus which is to increase agricultural productivity and value‐ addition. This
program was implemented with support through the Global Agriculture and Food Security
Program (GAFSP). There are also a number of projects supported by various development
partners including the World Bank which are aligned to the objectives of the sector strategy3.
23. Overarching development Framework :
o Agenda for Change (2004-2012): Roadmap for the country from 2007 to 2012
to combat poverty as part of its post-conflict peacebuilding process in the
aftermath of a decade of civil war; and
o Agenda for Prosperity (2013-2018) : Roadmap for the next five years, to guide
the country to meet its goal of becoming a middle income country and donor
nation within the next 25 to 50 years.
Overarching agricultural development Framework :
o National Sustainable Agricultural Development Program (NSADP) – 2010-
2030: Broad framework for putting the objectives of the Government’s Agenda
for Prosperity into action in the agricultural sector; and
o Smallholder Commercialization Program (SCP) – 2010-2014: Flagship
program for operationalizing the NSADP – commercializing agriculture through
linking large and small farmers to markets.
24. In addition to the above, a number of Strategies (or other document of a policy/strategic
nature) have been elaborated in Sierra Leone during the last decade, and notably :
o The National Rice Development Strategy (NRDS, 2009) : the goal of the
National Rice Development Strategy (NRDS) is to lay out a framework for
significant increases in rice production in order to contribute to the improvement
of food security and economic development in Sierra Leone. The specific
objectives are to:
1. Ensure an increase in the sustainable productivity and production of rice
in Sierra Leone
2. Promote appropriate post harvest handling, processing and marketing of
rice
3. Develop appropriate infrastructure for rice production and marketing
4. Improve the capacity of stakeholders and institutions involved in rice
sector
This strategy targets a land area of 830,000 ha and an increase in the average rice yield/ha
to 2 mt/ha to realize the government’s goal of rice self-sufficiency. Furthermore, an
extension of the area to 1,100,000 ha over the following years, coupled with an increase
in the average yield of rice to 4 mt/ha (ranging from 1.5 mt/ha in the uplands to 4.0 mt/ha
in the IVS) is expected to result in the production of over 3 million tons of rice in 2018.
o The Sierra Leone National Export Strategy 2010-2015 prepared under the
leadership of the Ministry of Trade and Industry with the assistance of the
Commonwealth Secretariat which presents specific strategies for several sectors/
commodities including : “Agriculture, Cocoa Coffee, Oil Palm, Cashew, Ginger,
Chili, Rice, Cassava, Sugar, and Fisheries”. Each commodity export plan is
3 Extracted from the recent ASR

25
associated with an action matrix and Investment Plan. The National Export
Strategy promotes a strong private sector participation and addresses issues of
competitiveness through its strategic objectives as follows:
improving productivity and enhancing value addition
diversifying the current export base
strengthening the human and financial capacity of all stakeholders along
the value chain.
b) Public Institutions in Sierra Leone’s Agriculture Sector
The Ministry of Agriculture, Forestry and Food Security
25. The Ministry of Agriculture Forestry and Food Security (MAFFS) is the arm of
Government, responsible to achieve sustainable food security and reduce poverty through
agricultural intensification, diversification and efficient management of the natural resource base.
MAFFS has the mandate to support the production of all crops and livestock in an
environmentally sustainable manner and to ensure the achievement of Food Security.
26. MAFFS seeks to provide an enabling environment for farmers and by promoting
appropriate research, extension, input delivery and market systems. To this end, MAFFS
formulates and implements policies, and coordinates, designs and monitors programs for the
development of the agricultural sector. It works with the following objectives:
o To increase diversified domestic production of food, with a view to achieving
food security in the medium to long term;
o To increase agricultural productivity, output, rural incomes and employment,
while ensuring adequate protection of the environment;
o To ensure balanced regional agricultural growth and equitable distribution of
income; and
o To maximize foreign exchange earnings from the agricultural sector.
27. The Headquarters of MAFFS is in Freetown and the ministry is divided into a
professional wing headed by the Director General and an administrative wing headed by the
Permanent Secretary. The Honorable minister, assisted by two deputy ministers, is the political
head of the ministry4.
28. The office of the Director General is directly responsible for overseeing all activities of
Food Security, thereby ensuring that its objectives are achieved. The Director General supervises
4 technical Divisions (Crop, Livestock, Forestry, agriculture engineering, agricultural services) as
well as the Planning, M&E and Statistic Division (PEMSD) and the District Director. The later,
as a result of the devolution process, liaises with the Local councils and other Non-Governmental
Organizations involved in agricultural activities at grass-root level. He is also fully involved in
the preparation of activity plans at district level and monitors the use of assets belonging to the
ministry.
29. The number of Divisions and their respective scopes of intervention have fluctuated
during the period under study (2003-2012). The Ministry has staff and activities at District and
local council levels. Despite of the ongoing devolution process, all the technical staff positioned
at decentralized level is still on the payroll of the ministry at central level.
4 See organogram in appendix 3

26
30. Based on the COFOG definition adopted throughout this review, all of MAFFS
expenditures are to be accounted for in the AgPER.
The Ministry of Fisheries and Marine Resources (MFMR)
31. MFMR is in charge of undertaking all fisheries management and development activities.
The legal framework for fisheries management in Sierra Leone is the 1994 Fisheries
(Management and Development) Act, complemented by the Fisheries Regulations from 1995 and
amended in 2007. New Draft Fisheries Regulations were prepared in 2010. The Local
Government Act of 2004 regulates the functions of local councils.
32. MFMR is entrusted with an oversight responsibility of making sure that required fishing
facilities such as jetties, fish processing facilities, fishing gear are available in the respective
fishing communities and monitored to uphold good fishing standards.
33. MFMR’s vision is to ensure the sustainable use and management of the fish resources of
Sierra Leone. The policy objectives of MFMR include the following:
o improving national nutrition and food security through increased fish production
based on responsible fishing and reduction of spoilage
o increasing employment opportunities
o enhancing livelihoods in fishing communities with emphasis on women and
youth
o improving skills in the fishing communities and increasing wealth through
rational management based on scientific research
o promoting marine and inland artisanal fishery for local affordable animal protein
production in Sierra Leone
o strengthening regional and international collaboration in the sustainable use,
management and conservation of fish resources in shared water bodies
34. Based on the COFOG definition adopted throughout this review, all of MFMR
expenditure are to be accounted for in the AgPER.
The Ministry of Land and Country Planning
35. The mandate of the Ministry as summarized in the National Land Policy (2005) gives it
“a central role in the management of state lands, compulsory acquisition of lands for
development, surveying and surveyors, mapping, planning, town planning schemes, development
standards, building codes, etc., but not registration of deeds’’.
36. The Ministry’s broad policy objectives are to:
o Enhance proper land administration and management, land use planning and
environmental management;
o Lay the foundation for the development of planned settlements all over the
country ;
o Enhance planning and development of control measures for proper infrastructural
development. 37. The respective divisions in the Ministry of Lands are briefly described below:
o Administration :This division which performs a significant role in policy
formulation, implementation and monitoring has the responsibility of
coordinating the daily administrative activities of the three divisions of the
Ministry for proper management and equitable distribution of state lands,
effective development of control measures and sound environmental

27
management in the country. It also has the responsibility of ensuring that there is
compliance with regulations related to the proper management of Lands, Town
and Country Planning and Environment in order to achieve the successful
implementation of the Ministry’s policy directives.
o Surveys and Lands: The division is primarily responsible for the surveying and
mapping of all lands and the administration of state lands. The division keeps
record of all licensed surveyors and approves all survey plans, both for state and
private lands. It is responsible for the effective management of state lands, the
setting up of a land management and information system, the establishment of
ground control points and the mapping and supervision of all surveying activities
throughout the country.
o Country Planning: This division is responsible for physical/land use planning,
providing guidelines for the growth of settlements within the context of a plan,
indicating the nature, form and direction of such settlements. Furthermore, it is
also responsible for the preparation, implementation and monitoring of various
town planning schemes including urban structured plans, detailed plans, action
area plan and subject plans.
o Environment: This division is responsible for ensuring that land use occurs in a
responsible manner with minimal negative impact on the natural environment.
The Environment division is responsible for the coordination of all the
environmentally related activities of the Ministry and Local Authorities. It
monitors the implementation of national environmental policies, programmes and
projects. It is also responsible for international cooperation in the global effort for
the protection of the environment. It takes care of all policies, programmes and
projects, environmental education and awareness raising, the collection of
environmental research and baseline data and information on land management.
38. Based on the COFOG definition of the agriculture sector, the expenditure of the
following divisions only are included in the present AgPER: Surveys and Lands division,
Environment division as well as a fraction of the administration expenditure. The expenditures
on Country Planning are almost all urban related
National Committee for Social Action
39. NaCSA was set up by an Act of Parliament in 2001 as successor to the National
Commission for Reconstruction, Resettlement and Rehabilitation (NCRR), a ministerial-level
government commission that coordinated humanitarian relief and reconstruction assistance and
implemented donor-funded projects during and after the war. Community Driven Development
approaches supported by NaCSA were introduced in a gradual and politically sensitive way, and
therefore as a partnering project which helped the Government to achieve its own goals of
community reintegration and decentralization after the war. NACSA has administered programs
involving agricultural activities, especially right after the end of the war. NACSA interventions in
this sector have however gradually phased out.
40. According to the NEPAD guidance note for agriculture expenditure tracking system in
African countries (Sept 2005), if a large project has multi-sectoral objectives including ones
related to agriculture, its expenditure should be include in agriculture sector only if 70 percent or
more of the cost of the project is justified for or related to agriculture sector.

28
41. According to the information collected by the AgPER team during the data collection
phase, for the period considered (2003-2012) while numerous NACSA implemented projects and
programs included agriculture sector activities, these activities never represented more than 70
percent of the total cost of the project, and consistent with the COFOG Guidance Note these
expenditures are therefore not included in the AgPER.
Sierra Leone Agricultural Research Institute
42. SLARI was established in 2007 as the primary national agricultural research institute. It
is planned that SLARI will operate eight research centers focusing on various commodities and
research themes, but as of 2009 only two of the eight centers were operating; the remaining
centers are in the process of being rehabilitated and staffed.
Table 1: List of SLARI supervised agencies involved in agricultural R&D
43. Based on the COFOG definition adopted throughout this review, all of SLARI
expenditures are to be accounted for in the AgPER.
c) Overview of Projects and Programs Implemented in the Agricultural Sector
44. Multiple projects and programs are implemented in the agriculture sectors and more than
15 Development Partners are currently (2012) financing projects / programs.
45. Currently, the 20 years NSADP National Sustainable Agricultural Development Plan
(NSADP) is the comprehensive framework to promote agricultural development in Sierra Leone
based on the principles of the Comprehensive Africa Agricultural Development Programme
(CAADP). The National Sustainable Agricultural Development Plan’s primary goal is to address
on a sustainable basis the recurring problem of food insecurity and hunger including disasters and
emergencies. In theory at least, all project and programs should align on the structure of the
NSADP and contribute to its objectives. In practice, such alignment is often unclear5.
46. The section 4 of this AgPER review provides an analysis of the evolution of the portfolio
of projects managed by various government entities in the agriculture sector and draws
conclusions and recommendations for a more ambitious rolling out of the Paris Declaration on aid
effectiveness in the Sector.
5 For a more detailed description and discussion on Development Partners funded activities, see chapter 4.3.

29
d) Conclusions of the recent Agriculture Sector Review on the agriculture
sector contribution and challenges
47. The following is an extract of the Agriculture Sector Review (2014). It summarizes the
key recent sector evolution and remaining challenges.
48. “For the last decade since 2003, agriculture in Sierra Leone has shown remarkable
improvement, but more needs to be done to achieve higher and sustainable level of sector growth.
Agricultural value-added has picked up after the end of the civil war and growth has averaged
around 5 percent or more per annum over the last few years. As such, agriculture has maintained
its position as the key sector of the economy, contributing nearly half of the Gross Domestic
Product (GDP), even after the country experienced a significant surge in mineral output,
particularly iron ore, since 2011.
49. As demonstrated by the sector review, agricultural value-added per agricultural worker
started improving after the civil war, but is still yet to catch up with the pre-war years. The
historical trend shows that since independence, sector value-added had been growing at an
average of 0.8% per year until 1980s, and surged to an average of 8.5% between 1981 and 1990
and thereafter declined sharply during the period of the civil war. However, agricultural
productivity in terms of yields per hectare has been relatively low (even by sub-Saharan African
standards), with cereal yields averaging less than 1.2 metric tones per hectare, and cocoa yields
averaging less than 400 kg/ha.
50. The low levels of agricultural labor and land productivity invariably lead to depressed
rural wages rendering the sector less competitive and a disincentive especially among the youth
who are the most non/under-employed in the country. For the country to achieve the twin goals of
reducing extreme poverty and improving shared prosperity, there is need for renewed focus to
transform the largely subsistence low-input, low-output agriculture into more productive and
commercialized system capable of creating decent gainful employment as a basis for broad-based
poverty reduction.
51. In terms of food security, the overall food balance analysis shows that at the national
level, kilocalories consumed per capita are on average less than the required amount. Although on
average food quantity and kilocalories consumed have been improving, with a cereal-dominated
diet, the level still falls short of meeting the recommended intake level of 2100 kilocalories per
capita per day. Projecting into the future, based on the 2011 estimated food balance sheet, it
means food production has to increase more than the rate of population growth in order to catch
up with the shortfall.
52. The main binding constraints in the sector include: low productivity and competitiveness;
ineffective delivery of public goods and services leading to low farmer access to technology
through public research and extension; low private sector participation in agriculture; low and
unreliable sources of agricultural financing; increased land tenure insecurity among investors, low
level of farmers’ organization, including the capacity and organization of other stakeholders
along the agricultural value-chain; degradation of natural resources and environmental; and
inadequate sector coordination, capacity and governance. Many of these constraints were
identified a decade ago, and a lot of effort has been undertaken to address them over the years.
However, many of them linger on and continue to stifle sector growth.”
e) The evolution of the Agriculture GDP in recent years in Sierra Leone:
53. The Maputo declaration was made with a stated objective reaching a 6% annual growth
the agriculture sector. In Sierra Leone, the following graph shows the longer term evolution of the
Agriculture GDP.

30
Figure 2 : Annual Agriculture GDP growth 1998-2011 (%)
Source: Statistic Sierra Leone in WB-WDI (website accessed)
54. During all this period, agricultural growth contributed to only 45-50% to overall growth
in current terms over the period, which is highly insufficient for a sector that supports over 80%
of the country’s population. As a result, rural poverty decreased slowly during the period.
55. The next figure focuses on the period considered by this AgPER and shows that annual
AgGDP growth evolved during this period (2003-2011) between a minimum of 3.5% and a
maximum of 9.5%, averaging at around 7%. One can see also that the AgGDP would have been
slightly superior to the GDP growth during almost all the period before that evolution actually
reversed in 2011. The latter is essentially attributable to the surge in mining revenues (= non
agriculture growth).
-40
-30
-20
-10
0
10
20
30
40
1998 1999 2000 2001 2002 2003 2004 2005 2006 2007 2008 2009 2010 2011
AgGDP annual Growth (%)

31
Figure 3 : Evolution of the AgGDP and GDP annual growth over the period 2003-2012
Source: Statistic Sierra Leon in WB-WDI.
56. Overall, despite a level of spending sensibly below the target set in Maputo, an annual
growth of over 6% was achieved for the agriculture sector. While this performance is important
and positive, it should be kept in perspective that this has been achieved in a period of post-
conflict recovery, when much needed to be re-built. Also, while certainly not negligible, the
extent to which agriculture sector public expenditure may have contributed to this growth cannot
be estimated. Finally, since 2009, annual AgGDP growth has evolved below the 6% target and a
rebound of this growth would be needed in the coming years.
a) Production, yields, self-sufficiency, food security
57. The following figure illustrates a long term perspective on the evolution of three
important parameters :
o The Agricultural Value Added Per Agricultural Worker
o The Agricultural Value Added Per Hectare of Arable Land
o The Cereal production (in metric tons per 100 inhabitant)
58. Based on existing statistics, one can conclude that the cereal production per inhabitant
increased, as well as the value added per ha (with an acceleration since the last years, probably
correlated to the global food prices increases), both being positive outcomes. On the other hand,
0
2
4
6
8
10
12
14
2003 2004 2005 2006 2007 2008 2009 2010 2011
AgGDPGrowth(%)
GDPGrowth(%)

32
agricultural productivity (expressed in “Agricultural Value Added Per Agricultural Worker)
decreased in average over this same period. The combination of these indicators tends also to
infer that the production increase (kg of cereal/inhabitant) has essentially been driven by an
increase in the area farmed rather than by an increase in productivity (Ag-VA per worker
decreasing). This latter fact would confirm the still valid issue of the necessary improvement of
access to basic agricultural goods (improved varieties, chemical inputs) and services (finance,
extension…) by farmers in Sierra Leone.
Figure 4: Evolution of the agricultural Value Added per worker, per ha of arable land and cereal production per 100 inhabitant (1980-2012)
Source: Statistic Sierra Leon in WB-WDI.
b) Delivery of agricultural services to farmers
59. As mentioned in chapter 1, sources of information on the delivery of services in the
agriculture sector, be it public or private services, are scarce and often unreliable. In particular,
MAFFS annual report only offer a partial account of all the activities carried out by MAFFS and
likely to generate directly agricultural services or enhance their delivery by third parties.
0
200
400
600
800
1000
1200
1400
1600
1800
2000
19
80
19
82
19
84
19
86
19
88
19
90
19
92
19
94
19
96
19
98
20
00
20
02
20
04
20
06
20
08
20
10
Agricultural Value AddedPer Agricultural Worker
Agricultural Value AddedPer Hectare of Arable Land
Cereal production (metrictons per 100 inhabitant)
Linear (Agricultural ValueAdded Per AgriculturalWorker)
Linear (Agricultural ValueAdded Per Hectare ofArable Land)
Linear (Cereal production(metric tons per 100inhabitant))

33
60. The services section of the recent Agricultural Household Tracking Survey (AHTS6,
2011) contains however rather detailed information on access to all types of agricultural services
at the level of the household, including training and extension services, farmer field schools
(FFS), financial services (access to credit), relevant agricultural infrastructure, in particular,
drying and storage facilities and finally markets. However, it is practically impossible in general
to link the existence / delivery of these services to specific sector expenditure.
61. With regard to agricultural training and extension, extension officers were found to be
the most frequently cited source of agricultural information, with 18% of farming households
having spoken to an extension officer in the past 12 months. This number varies from 8% in
Bonthe to 31% in Kailahun, with 18% being the national average. When asked which
organization the extension officer belonged to, the majority of respondents cited MAFFS (39%)
while international NGOs (World Vision, CRS) were also frequently cited. The following graph,
extracted from the AHTS reports illustrates the situation.
Figure 5 : Main organizations conducting agricultural extension in Sierra Leone
Source: AHTS, 2011
62. While it is not surprising to see NGOs being active in providing extension services, the
fact that MAFFS was cited in “only” 39% of the case, while at the same time MAFFS resources
(including DP funded projects) are considerably higher than NGO resources should call to
attention (even though the idea of devolving agricultural extension services to third party
organization wouldn’t lack sense in theory).
6 The AHTS is based on a sample of 8840 Households

34
63. Disparities across districts were found to be important with regard to farmer field schools
(FFS). Kailahun (15%), Koinadugu (14%) and Kono (13%) had the largest proportions of farmers
who had been a member of a farmer field school (FFS) in the past month, while this percentage
was lowest in Bombali, Kambia, Moyamba and the Western Area Rural (2%), and Port Loko
(1%). These important differences should call the attention of the authorities overseeing the sector
as it raises questions in terms of equity of the access to extension services by farmers.
64. The AHTS provides also a disaggregated analysis of the access to services across the core
crops cultivated in Sierra Leone. Access to extension and information services is relatively
homogenous amongst households cultivating food crops (rice, cassava, sweet potato, groundnut
and maize). However, there is a greater proportion of households reporting access to extension,
training and FFS amongst those cultivating tree/cash crops. Thus, about one quarter of the subset
of farmers cultivating cacao, coffee and/or oil palm reported having spoken to an extension
officer.
65. The AHTS mentions that the adoption of improved seed varieties remains low: only 2%
of rice farming households having ever cultivated one of the NERICA varieties. Here also, there
is substantial room to improve the situation with a substantial overhaul needed of the way
MAFFS is strategically tackling this issue (see also section 4.4 reporting of the allocation of
resources by MAFFS for the procurement and distribution of improved rice seeds pointing to
significant inefficiencies).
66. With regard to the use of fertilizer, on average, about 7% of households use fertilizer, a
strikingly low figure. These data were collected in 2010, prior to the effective start of the SCP
program which has taken the option to set up Agribusiness Services Centers in order to boost
access to fertilizers (notably). Elements are however not available yet to evaluate the impacts of
this new governmental strategy.
67. The AHTS survey also reports that 51% of households had borrowed money (access to
credit) for any agricultural purpose in the past 12 months. In the majority of cases (56%) the
lender was a friend or relative and the analysis of responses confirms the scarcity of lending
through the formal credit market. This situation most certainly calls for an increased effort to
promote the emergence of reliable and self-sustained sources of credit (such as micro-finance).
68. The AHTS questionnaire also explored the access to drying facilities for cereals. The
responses most frequently given were a tarp (used by 31% of the farmers harvesting cereals), a
straw mat (22%), the ground (37%), and a cement floor (17%). Since cement drying floors are
considered the best drying space for farmers, the figure above would call for an increased use of
sector resources to (co-)finance these very simple and small scale (usually) individually managed
investments.
69. Finally, the AHTS also reveals that the distance from the community interviewed to the
closest market avec in average of about 6.6 miles nationally (8.8 miles for permanent markets)
with quite important regional variations. While this distance could seem relatively low, it is
nevertheless certainly dis-incentivizing the commercialization of bulky agricultural products.
Here again, the situation revealed could call for better strategizing of the investments on rural
infrastructures (dimension that is not salient in the current MAFFS plans).

35
2 LEVEL OF PUBLIC EXPENDITURE IN AGRICULTURE
70. Chapter II provides a detailed presentation of the size and structure of public spending on
agriculture. The definition of agriculture used follows strictly that of the international COFOG,
complemented by the NEPAD’s guidance note7. Agriculture includes crops, livestock, inland and
ocean fisheries, forestry, and the management of agricultural land. Excluded are multi-purpose
projects unless 70 percent or more of their expenditure benefits agriculture.
71. Downstream functions such as marketing, storage, processing, access roads, and means
of transport are on the principle not included in the concept of “agriculture” as defined in
technical guidance. However projects in Sierra Leone that include activities to promote
agricultural value chains and rural trade were systematically included in the expenditure shown in
the following analysis. Throughout this report, spending data are shown in nominal terms only,
not deflated.
7 African Union (2005).
36
Box 6: Data collection process.
Overall, expenditures (budgeted and actuals) are thought to have been satisfactorily enough captured in this
study. Details on the type of analysis to be carried out in the study as well as the source of data for each of
the analyses were discussed with the counterpart team at the inception workshop to reach a common
understanding of the scope and nature of the study. Required data included: approved budget; actual
expenditure; and releases under the main budget line items disaggregated by functional directorates and
units. On a case by case basis, templates for the basic data collection were prepared and agreed between the
consultants, the counterpart team, and the Technical Working Group. In addition, the consultant team
elaborated and discussed with the TWG a “data collection roadmap” which can be found in annex 3 to this
report.
“On budget” planned and executed expenditure were captured in full detail from printed copies of the
“Recurrent and Development Expenditure Actuals” (detailed versions, parliamentary copy) for the years
2004 to 2012 included. Although some inconsistency or errors were spotted in these documents, they have
proved to be good sources of information for the AgPER.
Development Partner funded expenditures were captured using the ODA database maintained by the
Ministry of Finance and Economic Development. While this source of information can ben considered as
solid enough (high and consistent number of projects recorded), data only include spent budget (and not
planned expenditure), and only aggregate information is available (level of expenditure by project and by
year) and it is quite likely that a number of project of regional dimension or implemented directly by
multilateral agencies were not recorded. Steps were taken by the consultant to complement this source of
information with project specific information extracted from project completion reports or evaluations8.
NGO expenditures were captured from the analysis of the annual reports of the MAFFS “NGO Bureau”.
However data collection through this office only started effectively in 2011 and data were consistent only
for 2012 and only for NGOs in direct contact with the MAFFS. This initiative needs however to be
encouraged as a genuine effort is being produced by this office to interact in a constructive and organized
manner with NGOs active in the sector and to track expenditure on the basis of the current NSADP (NGOs
are asked to report on expenditure by pillar of the NSADP).
District level expenditures (using GoSL internal resources) were accessed easily through the MoFED Local
Government Finance Department. The level of detail available however did not allow for a functional
analysis of expenditure. It was initially planned to devote some time during the consultants’ 3rd mission to
Sierra Leone to interact with a sample of the districts. The Mission discussed the matter with the Technical
Working Group and agreed that the four districts would be Bo, Kailahun, Moyamba and Port Loko (or
alternatively Kambia). Time did not allow however for these on-site interactions to take place. In view of
the increasing share of public expenditure transiting through local government office, it can be
recommended that future AgPERs in Sierra Leone devote the time needed for these local interactions in
order to analyze qualitatively at least the expenditure incurred for the agricultural sector at the district level.
8 The difficulty to access detailed data on DP funded projects calls for attention and agriculture sector GoSL institutions should more systematically keep track of project documents (at least the project document, the project execution report, including financial data, and – if any – the final evaluation of the project) while Development Partners could strengthen their effort to make this information available and archived in a convenient manner at country level.

37
2.1 PROJECTED AND EXECUTED BUDGETS OF MAFFS, MLCP, MFMR
a) Budget funded by domestic resources
MAFFS Budget: General Overview
72. The budget allocated to MAFFS every year by the Budget Act includes:
o The budget of the Office of the Permanent Secretary. Attached to the Office of
the Permanent Secretary budget line are two line items: National Farmer
Association, Support to Agricultural Financial Management and Support to
Agricultural Financial Management (IFMIS).
o The budget of the Office of the Director General. A key budget line of MAFFS
was until 2005 attached to the office of the Director General: the “food security”
budget line (individualized since 2006). This budget line usually represents more
than 65% of the recurrent non-wage expenditures of the Ministry and usually
largely consists in subsidies over fertilizer and other agricultural equipment and
inputs.
o The budget of the Technical Divisions. There are five Technical divisions since
2009: Agriculture, Livestock, Land & Water/Agricultural Engineering, Food
Security (see above) and Forestry. The Land & Water/Agricultural Engineering
division was called simply Land and Water Division up to 2005. The number of
divisions has varied over the period considered by the AgPER Work.
o The budget of the Planning / M&E / Statistics Division.
o Allocations to Extension Services (which started in FY 2010).
o Allocations to various “Agricultural Institutions” including: the National
Agriculture Coordination Council, the Institute of Agricultural Research, the
Rice Research Stations (RRS) and the National Agriculture Training Center
(NATC) (which was until 2008 included under the Permanent Secretary Office
budget).
73. The Office of the Permanent Secretary, Technical Divisions, PEMSD, the Extension
Services and the Agricultural Institutions have separate lines of funding in their provisional
budgets for staff expenses (called recurrent personnel expenditures), operating expenditures
(called recurrent Other), and their capital expenditures from domestic (called domestic
development expenditures) and external resources (called foreign development expenditures). In
practice however, the capital expenditures are not attached to any MAFFS division in particular.
They consist essentially in a list of agricultural development projects for which the government
contribution (counterpart funds) is presented as “domestic development expenditure”.
74. It is likely that a number of MAFFS entities / divisions have also their own resources.
Some of the Technical Divisions were reported to have put in place “cost-recovery mechanisms”
for services provided (ex.: veterinary services, provision of seeds on cost-recovery basis). It is not
clear however if these Divisions have a MoFED-certified advance funds administrator who turns
this revenue over to the Treasury. In theory, this revenue should figure in the State budget and
represents relatively substantial sums (based on the fact that the food security division budget line
has represented 17 billion Leones per year in average for the last two years). It may also well be
that a certain percentage of this revenue is placed in a special account that the divisions concerned
can use for operating expenses, but these revenues are then not included in the State budget (and
probably managed by an accountant assigned to each of these institutions). The recent

38
establishment of the ABCs may have modified this situation but the information available at the
time of the completion of the AgPER was too little to ascertain this9.
Level and Evolution of the MAFFS Provisional and implemented Budget
75. The MAFFS provisional budget (Figure 1) increased almost 1.5 times in current terms
between 2004 and 2012, increasing from 23 to 34 billion Leones, which is an increase of around
50% in real terms. A peak can be observed in 2009 (40 billion Leones), followed by a relative
stable trend. The executed budget has followed a similar trend during the same period. This
increase in the core of the MAFFS budget over the 10 year period considered obviously illustrates
the desire of public authorities to increase support to the agricultural sector. It should be noted
however that the MAFFS budget estimates increased however less rapidly than the State’s
aggregate expenditure which, over the same period, increased nearly fourfold in current terms.
Figure 6. Evolution of the MAFFS provisional and implemented budget from domestic resources in current and constant terms, 2004–2012
Source: Expenditure actuals, Parliamentary copy (years 2004 to 2012).
Level and Evolution of the Provisional and Implemented Budget of the other ministries and entities having expenditures in the agriculture sector
76. Besides MAFFS, two other ministries have budgeted activities (and expenditures) in the
Agriculture Sector, namely the Ministry of Marine Resources and Fisheries and a fraction of the
budget/expenditure of the Ministry of Land and County Planning10. In addition, the AgPER has
9 For a more extended discussion on revenue generation at MAFFS, see chapter 4.5. 10 See explanation in chapter 1.3 b) Public Institutions in Sierra Leone’s Agriculture Sector
10,000
15,000
20,000
25,000
30,000
35,000
40,000
2004 2005 2006 2007 2008 2009 2010 2011 2012
Budget(current)
Actual(current)
Actual(constant)

39
considered the following budget lines / expenditures as pertaining to the Agriculture Sector
(based on the COFOG definition) : National Commission on Environment and Forestry (code
410), Sierra Leone Agricultural Research (code 418), Sierra Leone environmental Protection
Agency (code 420). Table XX provides a summary table of the aggregate expenditures from these
agencies and the MAFFS for the last two years and allows to get a quick sense of their relative
importance. Figures 3 and 4 respectively illustrate the evolution of the provisional and
implemented budget for these two ministries and the three additional areas entities considered.
Table 2: Summary of aggregate expenditure (as a share of total expenditure) for the ministries
and entities considered in the AgPE review (years 2011 and 2012)
2011 2012
Ministry of Agriculture, Forestry and Food Security 67% 62%
Ministry of Lands and County
Planning
6% 5%
Ministry of Marine Resources and Fishery 4% 13%
National Commission on Environment and Forestry 0% 0%
Sierra Leone Agricultural Research
20% 17%
Sierra Leone Environmental Protection Agency 3% 3%
Source: Expenditure actuals, Parliamentary copy (years 2004 to 2012). Note: 2011-2012 data for “Sierra Leone Agriculture Research” are presented as found in the officially published Government yearly “Actuals” (parliamentary copy) but could not be verified.

40
Figure 7. Evolution of provisional budget from domestic resources in current terms, 2004–2012
Source: Expenditure actuals, Parliamentary copy (years 2004 to 2012). Note: 2010-2012 data for “Sierra Leone Agriculture Research” are presented as found in the officially published Govt yearly “Actuals” (parliamentary copy) but could not be verified.
Figure 8: Evolution of implemented budget from domestic resources in current terms, 2004–2012
Source: Expenditure actuals, Parliamentary copy (years 2004 to 2012). Note: 2010-2012 data for “Sierra Leone Agriculture Research” are presented as found in the officially published Government yearly “Actuals” (parliamentary copy) but could not be verified.
-
2,000
4,000
6,000
8,000
10,000
12,000
2004 2005 2006 2007 2008 2009 2010 2011 2012
Ministry of Landsand County Planning
Ministry of MarineResources
NationalCommission onEnvironment andForestrySierra LeoneAgriculturalResearch
Sierra LeoneenvironmentalProtection Agency
-
2,000
4,000
6,000
8,000
10,000
12,000
2004 2005 2006 2007 2008 2009 2010 2011 2012
Ministry ofLands andCounty Planning
Ministry ofMarineResources
NationalCommission onEnvironmentand ForestrySierra LeoneAgriculturalResearch
Sierra LeoneenvironmentalProtectionAgency

41
77. The overall trend shows a vigorous increase (+20% annual) for the sector expenditure
spent (coming internal resources). One can notice that provisional and implemented budgets have
increased in average more rapidly for the MFMR and the MLCP than for MAFFS over the period
2004-2012.
Average annual increase in
spending on IR (2004-2012)
MAFFS 14%
MLCP 35%
MFMR 68%
78. And as illustrated by the following charts, MAFFS retains the largest share of the sector
expenditure (IR).
Figure 9: Evolution of the agriculture sector institutions executed expenditure (cumulated, in ‘000 Le)
Source: Expenditure actuals, Parliamentary copy (years 2004 to 2012).
-
10,000
20,000
30,000
40,000
50,000
60,000
70,000
2004 2005 2006 2007 2008 2009 2010 2011 2012
Sierra LeoneenvironmentalProtection Agency
Sierra LeoneAgriculturalResearch
NationalCommission onEnvironment andForestry
Ministry of MarineResources andFishery
Ministry of Landsand CountyPlanning
Ministry ofAgriculture,Forestry and FoodSecurity

42
Level and Evolution of the Provisional and Implemented Budget of other selected other key ministries (education / Health)
79. The figure 10 illustrates how expenditure (on internal resources) have comparatively
evolved for the agriculture sector and for two key ministries (namely Health and Education).
Figure 10: Compared evolution of implemented budget from domestic resources in current terms, for the agriculture, health and education sector (2004-2012)
Source: Expenditure actuals, Parliamentary copy (years 2004 to 2012).
80. The overall trend in terms of budget allocated to the agriculture sector (which has tripled
in nominal terms over the period) certainly reflects an increased attention paid to the sector
during the period of re-construction and concomitant with the Maputo declaration. This fact must
nevertheless be nuanced insofar to the extent that other sectors have also benefited from increased
attention. In 2012, MAFFS actual expenditure ranked #10, behind Education, Works, Health,
Defense, Energy, Police, Foreign Affairs, Social Security and Office of the President.
b) Internally funded decentralized expenditure
81. As Sierra Leone has engaged a vigorous devolution process, expenditure directed at local
level have increased significantly over the period considered and agriculture is definitely part of
2004 2005 2006 2007 2008 2009 2010 2011 2012
Agriculture Sector - Cofog (IR) 19,39226,18125,44617,16429,35937,83330,97946,97661,345
Ministry of Health (IR) 29,24437,89744,97815,45632,03854,816104,89134,99140,72
Ministry of Education (IR) 51,41551,41351,12429,94352,28268,11978,20781,361135,82
-
20,000
40,000
60,000
80,000
100,000
120,000
140,000
160,000
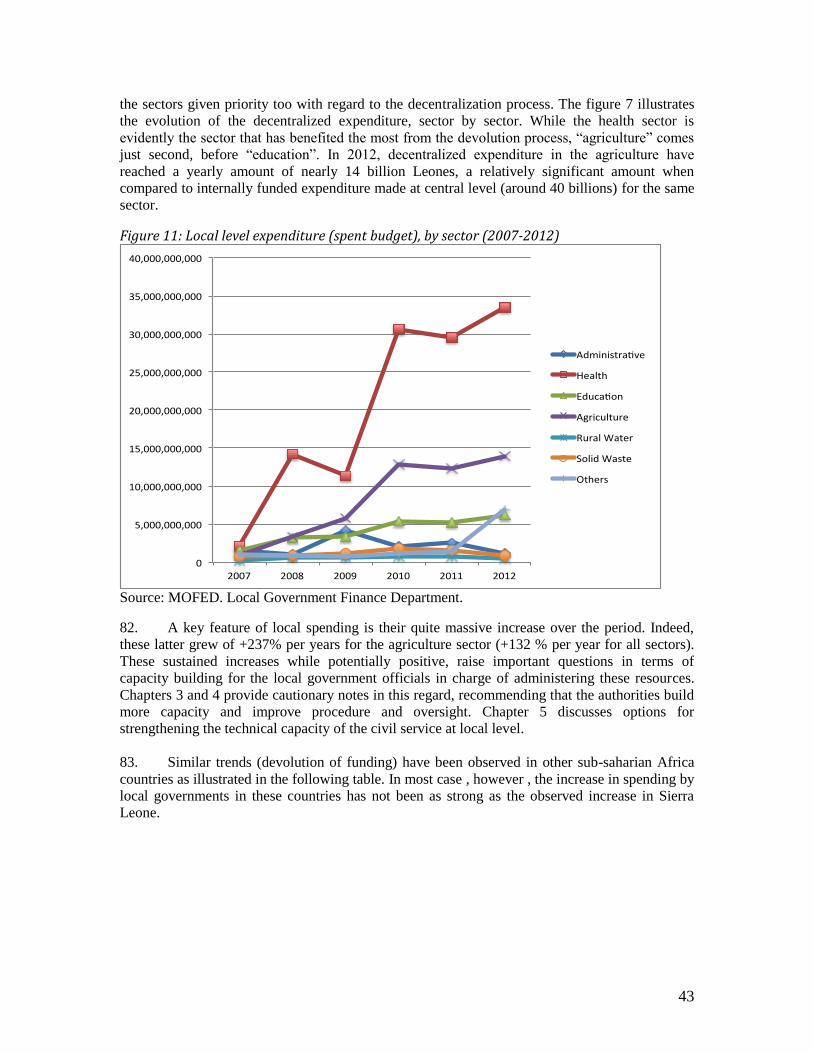
43
the sectors given priority too with regard to the decentralization process. The figure 7 illustrates
the evolution of the decentralized expenditure, sector by sector. While the health sector is
evidently the sector that has benefited the most from the devolution process, “agriculture” comes
just second, before “education”. In 2012, decentralized expenditure in the agriculture have
reached a yearly amount of nearly 14 billion Leones, a relatively significant amount when
compared to internally funded expenditure made at central level (around 40 billions) for the same
sector.
Figure 11: Local level expenditure (spent budget), by sector (2007-2012)
Source: MOFED. Local Government Finance Department.
82. A key feature of local spending is their quite massive increase over the period. Indeed,
these latter grew of +237% per years for the agriculture sector (+132 % per year for all sectors).
These sustained increases while potentially positive, raise important questions in terms of
capacity building for the local government officials in charge of administering these resources.
Chapters 3 and 4 provide cautionary notes in this regard, recommending that the authorities build
more capacity and improve procedure and oversight. Chapter 5 discusses options for
strengthening the technical capacity of the civil service at local level.
83. Similar trends (devolution of funding) have been observed in other sub-saharian Africa
countries as illustrated in the following table. In most case , however , the increase in spending by
local governments in these countries has not been as strong as the observed increase in Sierra
Leone.
0
5,000,000,000
10,000,000,000
15,000,000,000
20,000,000,000
25,000,000,000
30,000,000,000
35,000,000,000
40,000,000,000
2007 2008 2009 2010 2011 2012
Administra ve
Health
Educa on
Agriculture
RuralWater
SolidWaste
Others

44
Table 3: Evolution of devolved spending in selected sub-saharian Africa countries
Countries 2005 2009 2011 % Change*
Burkina Faso 125 250 274 119%
Côte d’Ivoire 72 133 - 85%
Ghana* 125 251 333 167%
Liberia 1 45 56 1580%
Senegal* 190 360 - 89%
Togo 15 37 66 352%
Source: World Bank, various AgPERs.
* over the period 2005-2011
c) Budget funded by external resources
84. External resources are a very significant portion of the budget allocated to / spent in the
agriculture sector (as well as in many other key sectors such as health and education) in Sierra
Leone. Figure 8 (based on the MoFED ODA monitoring system) shows that donor funded
expenditure in the agriculture sector have increased very sharply (more than ten-fold) from 2003
to 2009 from just around 3 million $US annually to more than 50 million $US per year. Since
2010, a more stable situation can be observed with annual expenditure fluctuating around 40
million $US.
Figure 12: Externally funded expenditure (agriculture sector), 2003-2012
Source: MoFED / DAC database11
11 Note: the distinction between Agriculture and “NRM related agriculture expenditure” comes from the MoFED ODA database classification. The sum of the two is assumed to represent the total agriculture (COFOG) expenditure externally funded.
0
10,000,000
20,000,000
30,000,000
40,000,000
50,000,000
60,000,000
2003 2004 2005 2006 2007 2008 2009 2010 2011 2012
NRM relatedAgricultureexpenditure
Agriculture
Sum inconstant(2005 &US)

45
85. A similar increasing trend was at play over the same period of time for the overall (all
sectors aggregated) externally funded expenditure in Sierra Leone (as illustrated by figure 9). In
effect, DP funded agriculture sector expenditure have increased annually by 50% over the period,
while this increase was higher for all sectors (+110% annually).
Figure 13: Externally funded expenditure (across sectors), 2003-2012
Source: MoFED / DAC database
86. Regarding the share of agricultural expenditure in total expenditure, the following table
shows that they have averaged slightly above of 10% during the period 2004-2012, ranking
second behind DP funded health sector expenditure.
0
50000000
100000000
150000000
200000000
250000000
300000000
350000000
400000000
450000000
500000000
2003 2004 2005 2006 2007 2008 2009 2010 2011 2012
Ax
is T
itle
Donor funded expenditure - US$ (2003-2012). All sectors.
US$Current
US&constant(2005)

46
Table 4: Share of various sectors in total externally funded expenditure in Sierra Leone (2003-
2012)
SECTOR Share of total Expenditure (externally funded)
Agriculture (Cofog) 10,38%
Education 7,18%
Health (incl. HIV) 14,95%
Road Network 8,36
Source : MoFED / DAC database

47
2.2 TRENDS IN AGRICULTURAL SECTOR EXPENDITURE AND THE
MAPUTO TARGET
a) A sector predominantly funded by ODA
87. The following figure offers of comparison of agriculture sector expenditure evolution
over time, for three types of expenditures : expenditure spent by local and central governments
(Internal Resources) and Development Partners funded expenditures. MAFFS expenditure (IR)
are individualized in order to better visualize the weight of this key ministry in the total.
Figure 14: Comparison of agriculture sector expenditure (various sources of funding and spending agencies, in million Leones)
Source: MoFED, expenditure actuals (parliamentary copy), DAC database and author’s calculations.
88. As can be seen, the expenditure financed by donors represents a largely dominant share
of total expenditures. These expenses represented 75% of total expenditure over the period and
this trend does not appear to vary much during the period. This percentage is generally high,
although it is not a characteristic uniquely of the agricultural sector in Sierra Leone (similar
percentages are observable in other key sectors). The following table offers a quick comparison
with other countries in the sub-region :
0
50,000
100,000
150,000
200,000
250,000
300,000
2007 2008 2009 2010 2011 2012
Donor fundedexpenditure
Tranfers toDistrict Councils
Other (COFOG)ministries andentities
MAFFS

48
Table 5: Share of domestic fund in total agriculture expenditure
Countries 2005 2009 2011
Sierra Leone 54% 20% 26%
Burkina Faso 24 37 48
Côte d’Ivoire 62
Ghana* 73 61 63
Liberia - 21 38
Senegal* 45 41 -
Togo 64
Source: Hourticq J., Zorya S. WB. Dar Es Salaam Workshop.
89. Chapters 3 and 4 provide cautionary notes in regard to the weight of development
partners funded expenditure in total expenditure, especially in a context / sector where ODA is
highly fragmented. Chapter 5 discusses options for improving this situation.
b) Expenditure levels consistently bellow the Maputo statement of intent
90. Under the Maputo Declaration of 2003, African governments committed to increasing the
share of their national budgets devoted to agriculture, with a target of at least 10% so as to
achieve agricultural growth of at least 6% per year. The expenditure target refers to all funding
sources combined. While the level of public resource allocated to and spent for the agriculture
sector in Sierra Leone has increased considerably over the period considered, it is worth
examining briefly here how the level of financing compare with the Maputo target set in 2003.
The graph hereafter allows visualizing this evolution over the period 2004-2012.

49
Figure 15: Evolution of combined agriculture expenditure (% of total) in Sierra Leone and comparison to the Maputo Target.
Source: MoFED (DAC database and Local Government Finance Department data), Expenditure
actuals (Parliamentary copy, years 2004 to 2012).
91. Combined spending from internal resources and donors on broad agriculture was
approximately 4% percent in FY 2004 to 2007, reaching 9% in FY 2008 and 2009 and
approximately 6-7% in the recent years.
92. A conclusion is that the level of financing for the sector was below the 10% target for the
years 2004-2012 included. In average, Agriculture sector expenditures have represented 6.04% of
the overall implemented expenditure during this period, all sources of funding taken into account
This “below target” level of spending seems to originate essentially from the low level of
allocation (and therefore spending) on internal resources to the agriculture sector, in particular at
central level. Table 5 below provides a breakdown of the expenditure levels by source of funding
and destination over the period 2007-2012.
Table 6: Percentage of total expenditure executed in the agriculture sector (2007-2012)
YEARS 2007 2008 2009 2010 2011 2012
Transfers to district council (IR)
Share of Ag Sector in total disbursement
11.10%
13.59%
21.37%
23.47%
22.95%
22.11%
Dev. Partners funded Expenditure (ER)
Share of Ag Sector in total disbursement 5.47%
15.70%
14.78% 7.82%
12.15%
10.75%
Govt Expenditure at central level (IR)
Share of Ag Sector in total disbursement 1.99% 2.61% 2.79% 3.32% 3.67% 2.45%
Source: MoFED (DAC database and Local Government Finance Department data), Expenditure
actuals (Parliamentary copy, years 2007 to 2012).
0.00%
2.00%
4.00%
6.00%
8.00%
10.00%
12.00%
2004 2005 2006 2007 2008 2009 2010 2011 2012
Agriculture Exp.(COFOG)
MaputoTarget

50
93. One can notice that the agriculture sector has quite systematically benefited from a level
of expenditures above the 10% target when it comes to externally funded expenditure. On the
other hand, internally funded central level expenditure for the agriculture sector (in other words
the budget spent by the agric. sector ministries coming from IR) has systematically evolved well
below the 10% target (highest figure being 3.67% in 2011, lowest 1.99% in 2007), while transfer
to the district councils earmarked for the agriculture sector always reached more than 10% of the
total transfers, reaching 22% in 2012.
94. To demonstrate a level of support in line with the Maputo declaration, Sierra Leone
would have to reach a level of agricultural support in the order of USD 92.7 million per year12. It
is interesting to compare this figure with the needs as estimated by the Sierraleonese government
when the National Sustainable Agriculture Development Plan was elaborated under the CAADP
auspices in 2009. The NSADP/CAADP was estimated to require a total outlay of USD 333.5
million for its implementation in the first five years (2010-2015), equivalent to around USD 67
million per year. Similarly, the 2010 elaborated Smallholder Commercialization Plan (SCP)
indicates a total provisional implementation cost of USD 402 million over a period of 5 years,
equivalent to approximately USD 80 Million per year.
2.3 Share of Agriculture Expenditure Relative to GDP and AgGDP
95. When it comes to agricultural support expressed in shares of GDP and agricultural GDP,
Sierra Leone places itself in the mid-range of sub-Saharan African countries and (like many other
low income countries) and for obvious reasons far below the level of spending of middle- and
high-income countries (Table 6) if we are looking specifically at the support to agriculture in
shares of the AgGDP.
Figure 16: Trends in Agricultural Sector Expenditure, percent of GDP and AgGDP, 2004-2012
Source: Source: MoFED (DAC database and Local Government Finance Department data),
Expenditure actuals (Parliamentary copy, years 2007 to 2012) and Statistic Sierra Leone (for
GDP and AgGDP
12 Based on 2012 total expenditure level. See Table 1. Estimate of implemented agricultural public expenditures using NEPAD’s COFOG methodology, 2007–2012 (in millions $US) for the details.
0.00%
1.00%
2.00%
3.00%
4.00%
5.00%
6.00%
2004 2005 2006 2007 2008 2009 2010 2011 2012
Ex
pe
nd
itu
re S
ha
re i
n G
DP
an
d
Ag
GD
P (
%)
Year
Agric Sector Expenditure as % of GDP Agric Sector Expenditure as % of AgGDP

51
96. Here we can see that to demonstrate a level of support in the lower range of middle-
income countries (10% of agricultural GDP), Sierra Leone would have to reach a level of
agricultural support in the order of USD 136 million per year. It is interesting to compare this
figure with the needs as estimated by the Sierraleonese government when the National
Sustainable Agriculture Development Plan was elaborated under the CAADP auspices in 2009.
The NSADP/CAADP was estimated to require a total outlay of USD 333.5 million for its
implementation in the first five years (2010-2015), equivalent to around USD 67 million per year.
Similarly, the 2010 elaborated Smallholder Commercialization Plan (SCP) indicates a total
provisional implementation cost of USD 402 million over a period of 5 years, equivalent to
approximately 80 million per year.
Table 7: International comparison of budget transfers to agriculture, 2002–2012
Region/Country Share of
agriculture in GDP
Share of agricultural public expenditures in
national GDP
Share of agricultural public expenditures in
agricultural GDP
High-income countries
Australia 3% 0.30% 10%
Canada 2% 0.50% 22%
EU 2% 0.70% 28%
USA 2% 0.70% 46%
Middle- income countries
Turkey 13% 2.00% 15%
Mexico 4% 0.70% 18%
Venezuela 5% 0.50% 12%
China 15% 1.20% 8%
Brazil 9% 0.70% 8%
Russia 6% 1.00% 16%
Ghana 34% 1.43% 4.31
Ukraine 12% 1.30% 11%
Low-income countries
Sierra Leone (avg. 2007-2012)
48% 1.72% 3.70%
Uganda 32% 1.50% 5%
Tanzania 45% 1.20% 3%
Ethiopia 44% 2.70% 6%
Kenya 29% 1.30% 4%
Cameroon (2012) 21% 0.90% 4.10%
Burkina Faso (2004–
2011) 33% 2.70% 8.20%
Senegal (2009) 14% 2.80% 20.40%
Côte-d'Ivoire 23% 0.60% 2.50%
Guinea (2003–12) 22% 1.50% 6.80%
Togo 41% 1.90% 4.60%

52
Note: the data shown refers to different years within the 2002 and 2011 period, depending on the country.
Source: World Bank 2010a; and various authors of country specific AgPER country reports
2.4 EXPENDITURE PER CAPITA
The level of agriculture public expenditure per capita in Sierra Leone can be considered as relatively low in absolute terms and in comparison to other sub-Saharan countries. Table 8: Expenditure per capita (USD) in various Sub-Saharan countries
Countries 2005 2009 2011
Sierra Leone 1.75 13.11 8.61
Burkina Faso 11.2 20.8 22.0
Côte d’Ivoire 12.3 19.1 -
Ghana* 13.0 25.8 33.9
Liberia 0.7 4.7 10.0
Senegal* 29.8 51.1 -
Togo 4.5 11.0 19.3
* Off-budget expenditure not included.
Source: Hourticq J., Zorya S. WB. Dar Es Salaam Workshop.
97. The figures above are illustrating clearly how scarce resources are and therefore how
important an efficient use of these resources is in this context. One should note here that in
overall, low levels of expenditure in the agriculture sector has been a common characteristic of
many sub-Saharan countries for the last decades. The following graphs offer an interesting
comparison of long terms trends in terms of public agriculture expenditure across continents.
Over the period 1980-2007 studied, spending on agriculture per agricultural population has
increased in all regions except Latin America and the Caribbean (LAC) and Sub-Saharan Africa
(SSA). Even more striking, the level of expenditure per capita in sub-Saharan Africa is
significantly lower than that observed in Latin America for example.

53
Figure 17: Per agricultural capita government expenditure on agriculture by area, 1980 – 200713
Source: Sarah K. Lowder and Brian Carisma, FAO. 2011.
13 Source: Financial resource flows to agriculture. A review of data on government spending, official development assistance and foreign direct investment. Sarah K. Lowder and Brian Carisma ESA Working paper No. 11-19. Dec-11. Agricultural Development Economics Division. Food and Agriculture Organization of the United Nations. www.fao.org/economic/esa.

54
3. PUBLIC EXPENDITURE IN AGRICULTURE: ECONOMIC AND FUNCTIONAL COMPOSITION, REGIONAL DISTRIBUTION
3.1 OBJECTIVE OF THE ANALYSIS
98. In this chapter, we analyze the economic expenditure to determine whether available
resources are allocated in a way that maximizes desired outcomes, and whether inefficiencies in
allocations are identifiable. The aim is to answer the questions: “Are the agricultural expenditures
that are being financed best suited to achieving the country’s agricultural policy goals? Is the
spending sound?”. Allocative efficiency will primarily be determined by the efforts made in
budget preparation to align the budget with sectoral goals. Allocative efficiency will be analyzed
as follows:
o Economic breakdown of expenditure: wage expenditure, non-wage recurrent and
development expenditures;
o Functional breakdown of expenditures: distribution among the various subsectors
(agriculture, livestock, research, etc.); and
o Regional distribution of expenditures: we analyze expenditure allocation by
region to determine whether allocations are consistent with indicators such as the
size of the rural population, spatial distribution of poverty and food insecurity.
3.2 ECONOMIC COMPOSITION OF EXPENDITURE
99. The analysis starts with the expenditure of the three ministries (MAFFS, MMFMR and
MLCP) and the three other institutions identified as being part of the agriculture sector (COFOG).
The overall budget as set forth in budget laws and actuals reports provides the following picture
of the economic composition of their expenditure over the period covered by this review.
Figure 18: Evolution of personnel, recurrent non-wage and development expenditure over the period 2004-2012
Source: expenditure actuals, Parliamentary copy (2004-2012)
0%
10%
20%
30%
40%
50%
60%
70%
80%
90%
100%
2004 2005 2006 2007 2008 2009 2010 2011 2012
DomesticdevelopmentExpenditure
Non salarynon interestrecurrentexpenditure
PersonnelExpenditure

55
100. As can be seen, recurrent expenditure (salaries and non-salary recurrent expenditure)
represent by far the largest share of total spending (close to 80%) at central level on internal
resources. Personnel expenditures are relatively stable, absorbing in average 40% of the annual
budget (IR) of these institutions. This situation is not uncommon in low income Sub-Saharan
Africa countries. Both wage and non-wage shares of total expenditure in the agriculture sector
vary from one country to another as illustrated in the table below :
Table 9: Share of wages and non wages expenditure in various sub-saharian African countries
(2009)
Countries Share of wages in expenditure (IR)
2009
Share of non-wage recurrent exp. In total
exp. (IR) 2009
Ghana 22 60
Liberia 48 83
Senegal 6 39
Togo 17 73
Sierra Leone 35 56
Source: Hourticq J., Zorya S. WB. Dar Es Salaam Workshop.
101. A positive aspect of how the Sierra Leonean situation has evolved over the last 10 years
is the fact that the share of Domestic development expenditure is on the increase: representing
less 10% in 2004 they hovered around 20% in recent years. This leaves however very limited
margin of action for these institutions to play their role as the majority of their budget is used to
cover recurrent expenditures.
102. Limiting the analysis to expenditure funded on internal resources and spent by central
level administrations is however very partial as the majority of expenditure are actually funded by
external resources in the sector (see Chapter 1). However, it has not been possible for the
consultant team to collect a detailed enough database of project expenditure over the period
covered by the review (see 3.3.2. for a limited only analysis). Some of the project expenditure are
labeled as “foreign development expenditure” in the yearly “actuals” books, and it would suggest
that it is essentially capital expenditure when actually projects are funding significantly for
operating expenses and personnel. It is clear that the personnel costs and operating expenditures
paid for by project funds therefore supplement ministries’ official resources including by
financing salaries (technical assistance) and non-wage recurrent expenditure.
103. Another area that would need further analysis is the economic composition of
expenditure devolved to local government. Here again unfortunately, not enough detail was
available for the consultant team to conduct such an analysis.

56
Economic Composition of the externally-funded projects’ Budgets
104. Running an analysis of the economic composition of externally funded projects in the
agriculture sector in Sierra Leone remains a challenge. Firstly, the data collection phase of the
AgPE study did not allow for the collection of a comprehensive set of project expenditure data
set. The archival system within the administrations of the sector is very weak and actually not in
place. It has been even difficult to access this information from the ongoing projects. This is
certainly an area that needs further attention from the GoSL and the DPs. In many cases, external
PIUs were formed for the purpose of administering and implementing these projects but once
these projects are completed, these PIUs were disbanded and the information is simply lost.
105. The other reason why it is difficult to perform such an analysis comes from the fact that
the vast majority of the externally funded project budgets and accounting systems are not actually
organized by economic type of expenditures but rather following an activity based system of
budgeting with some functional breakdown encompassing: components, sub-components,
activities, technical assistance, etc. Even though the economic nature of some budget lines can be
relatively easily identified (if one can access detailed accounts of these projects expenditure) such
as the cost of TAs, it is nearly impossible to differentiate operating costs, from investments, etc.
106. Ideally, all these projects should adopt an accounting system where activity based
planning and budgeting is the norm. And reporting should be executed along a double system
allowing to track each expenditure according to the functional and economic category it belongs
to. If a transition to program budgets is confirmed in Sierra Leone, it would be desirable to adopt
a budgetary nomenclature that allows a more precise analytical accounting of expenditure for
externally funded project by economic category, namely personnel costs, operational expenses,
and investment. It would also be useful to begin making a distinction between investments made
on behalf of government entities (e.g., office building, vehicle purchases, computer equipment,
provision of training, etc.), and investments made in the field (e.g., productive and social
infrastructure, training and equipment of beneficiaries, etc.) in order to measure more precisely
the impact and effectiveness of programs. A more precise accounting of capital formation at the
different levels should also highlight the issue of recurring costs of operation and maintenance—
which has been mostly neglected until now—for equipment made available to government
entities, public infrastructure implemented, and infrastructure transferred to beneficiaries.
107. On average more than two-thirds of allocated costs are borne by projects and do not
officially appear in the ministries’ budgets. This poses two fundamental questions:
o First, this situation prevents these ministries from effectively managing their
recurrent costs since they lack a clear picture of those costs and have only a few
levers for controlling them, which may allow them to take advantage of
economies of scale. Truthful budgeting needs to be reestablished in order to lay a
foundation for an effective and sustainable approach within the sector in
collaboration with the DPs;
o Second, this situation begs the question of the sustainability of actions: What
happens to the provisions needed to supervise and maintain the investments made
once the project that supported them comes to an end? At present, this question
does not appear to be addressed systematically.
3.3 FUNCTIONAL COMPOSITION OF EXPENDITURE
108. The analysis of the functional composition of expenditure in the agriculture sector looks
first at the functional breakdown of expenditures i.e. their distribution among the various

57
subsectors (agriculture, livestock, research, etc.). Ideally, the objective of such an analysis would
to measure how far the government has ensured that its policy intents and priorities, which are
normally explicitly stated in its policy document, are reflected in annual budgets. However, the
budgeting / reporting process is not based on the current policy / programmatic framework14 (the
NSDAP essentially) making it actually impossible to track expenditure by Program and Sub-
Program of the NSADP.
a) Functional analysis of Development Partners funded expenditure in the
agriculture sector
109. The functional analysis of expenditure is hereafter conducted by comparing the sub-
sectoral composition of the expenditure to the actual value added created by each of these sub-
sectors. The analysis is based on data assembled by the MAFFS in 2011 with support from a
FAO funded Food Security project (called MAFSAN). The objective of this project was to
evaluate and track expenditure at country level on food security.
110. The data were extracted directly from the project website (at www.mafsan.org) and
sorted to suit the AgPE needs and methodology (in particular the COFOG perimeter). It
assembles expenditure data coming from 65 projects that were active during the period 2008-
2011 (4 years). The portfolio includes projects funded by bilateral and multilateral donors, as well
as NGO and projects implemented by UN organizations.
111. In total, the data assembled on the 65 projects represent a volume of expenditure of over
140 million $US, a figure that is quite consistent with the figures available through the MoFED
ODA database. The expenditures in agriculture over the 2008–2011 period were classified
according to the MAFSAN project classification. The following pie-chart provides a quick
picture of the functional composition of the DP funded expenditures by main categories:
14 There is to our knowledge one exception to this situation. The MAFFS NGO bureau actually request NGOs to report on their expenditure using a format that follows the NSDAP structure. This is an initiative to encourage and that should be applied systematically to every DP funded project in the Agriculture Sector in Sierra Leone.

58
Figure 19: functional composition of Agriculture Sector spending (external resources)
Source: MAFFS/MAFSAN database15
15 The “agriculture development sub-sector” (as defined by the MAFSAN/MAFFS team) is a diverse collection of themes including support to Livestock, Livestock, Integrated agriculture projects, Agriculture infrastructure, etc. and totals 43% of the expenditure. A more fine-tuned analysis would be therefore required to understand their signification.
Agricultural development (Subsector)
43%
Agricultural education/trainin
g (Subsector) 2%
Agricultural inputs
(Subsector) 3%
Agricultural land resources
(Subsector) 0,03%
Agricultural policy and
administrative management (Subsector)
6%
Agricultural research
(Subsector) 0,64%
Agricultural services
(Subsector) 23%
Agricultural water resources
(Subsector) 5%
Food aid/Food security
programmes (Subsector)
15%
Fishery development (Subsector)
3%
Forestry development (Subsector)
0,07%

59
112. The next pie-chart shows the relative weight of various sub-sectors in the overall
Agriculture GDP, in average, over the period 2003-2012.
Figure 20: Sub-sector contributions to AgGDP (av. 2003-2012)
Source : World Bank, WDI. IMF.
Food Security and Agriculture Services
113. The two major areas of expenditure funded by Development Partners are :
o “Agricultural services” (which include according to the MAFSAN classification :
Agricultural co-operatives, Agricultural financial services, Agricultural services,
Plant and post-harvest protection and pest control, Livestock/veterinary services)
and;
o Food Aid / Food Security (15%).
114. The relatively high level of expenditure on “agricultural services” is probably reflecting
the effort put by the MAFFS in developing agriculture service centers through the ABCs. Effort
put on food security and notably food aid were also significant over the period and essentially
carried by the WFP in the form of food aid.
Crops 63%
Livestock 5%
Forestry 15%
Fishery 17%
Sub-sector contributions to AgGDP (av. 2003-2012)
60
Irrigation / Agriculture Water
115. Agriculture Water Resources sub-sector accounted for around 5% of the donor funded
expenditure during the period and this refers essentially to projects targeting the development of
rice cultivation in the inland valley swamps.
Livestock / Fishery
116. Expenditure related to supporting the livestock sector, estimated at USD 2,449,296 from
2003 to 2011, or 2% of total expenditures may be considered relatively low considering the role
that livestock plays in food security, savings, and income generation. More preoccupating is the
amount spent on Veterinary Service which by all standards can be considered suboptimal: less
than USD 200,000 in total over the 9 years considered (less than USD 20,000 per year). This
amount is also much lower than the sector’s weight in the agricultural economy (5% of
agriculture GDP in average during the period 2002–2011).
117. Similarly to the livestock sub-sector, the fishery sub-sector has accounted for only 0,2%
of the total donor funded expenditure, a figure in sharp contrast with the contribution of the sub-
sector to the Ag-GDP (16% in average over the period 2001-2012).
Agriculture policy / administrative management
118. Expenditures related to agriculture policy development and administrative management
have accounted for 6% of the total agriculture expenditure, reflecting the effort put by donor and
the GoSL in shaping a vision for the sector (substantial policy work has been undertaken since
2003, see chapter 1) and re-building the capacities at Central Level notably through trainings. It is
uncertain to what extent this figure includes or not the projects’ administration costs.
Agriculture extension
119. Agriculture extension (including District extension services, Agricultural extension,
Radio, TV, electronic extension messages) received only 2.11% of the total spent in the sector
through the projects, which appears as a low figure in comparison to the central role that
extension can play in the dissemination of agricultural technologies.
Agriculture Research Expenditure
120. The MAFSAN database identifies only very few DP-funded expenditure on agriculture
research (USD 900,000approximately, over a period of 4 years) and this does probably not
provide with an accurate picture of the recent (though modest) efforts put by development
partners in developing agriculture research in Sierra Leone. A recent publication derived from an
IFPRI managed program (ASTI16 ) provides a probably more accurate picture of the R&D
agriculture public expenditure in Sierra Leone. According to the authors and the database
available online at www.asti.cgiar.org/data, the following trend emerges: agricultural research
and development (R&D) expenditures in Sierra Leone would have more than doubled between
2001 and 2009 in response to the end of a decade of civil war and efforts to reconstruct the
country’s agricultural R&D system and donor support has been increasing since 2007.
16 ASTI /IFPRI / SLARI. Recent Development in Agricultural Research. Country Note : Sierra Leone. 2010.

61
121. Based on the ASTI/IFPRI/SLARI data, agriculture research expenditure in Sierra Leone
would have reached USD 5.1 million in 2009, a significant increase in comparison to 2001 (USD
2.8 million). This amount of USD 5,1 million represented 0,38% of agriculture’s share of GDP
and 0.21% of GDP overall for the year 2009, percentages which are still far below the objective
of earmarking 1% of (Ag)GDP for applied (agricultural) research set by the Executive Council of
the African Union in its Khartoum Decision regarding science and technology in 2006. The
following table provides elements to compare the Sierra Leonean situation with other Sub-
Saharan African countries. Sierra Leone actually ranks among the Sub-Saharan Africa countries
that have allocated the least amount of resources to agricultural R&D.
Table 10: Funds budgeted for agricultural R&D in sub-Saharan Africa
Year studied
Total
amount
(USD
millions)
Amount per
capita (USD) % of GDP
Malawi 2007 180.1 12.9 1.70
Uganda 2007 359.8 11.6 1.10
South Africa 2007 4976.6 102.4 1.05
Kenya 2007 277.8 7.4 0.48
Senegal 2008 99.0 8.0 0.48
Tanzania 2007 234.6 5.8 0.48
Gabon 2008 78.7 58.3 0.47
Ghana 2007 120.1 5.0 0.38
Zambia 2008 55.3 4.6 0.37
Mali 2007 37.4 3.0 0.28
Mozambique 2007 42.9 2.0 0.25
Nigeria 2007 583.2 3.9 0.20
Burkina Faso 2004–2011 8.1 0.5 0.10
Togo 2005–2010 2.0 0.4 0.07
Sierra Leone * 2009 5.1 0,38 0,21
Source: AU/NEPAD 2010; World Bank 2012; Authors’ calculations for Sierra Leone.
* data source : ASTI/IFPRI/SLARI database
122. It is anticipated that agricultural R&D capacity will increase in the coming years as more
SLARI research centers open. Also, the WAAP, a large scale World Bank funded regional project
funding agricultural R/D is currently active in Sierra Leone and one of the projects boosting
SLARI’s capacities, notably by synergizing its research programs with other western African
countries.
Box 7: limits of functional analysis of agriculture expenditure Analyzing the functional composition of expenditure coming from internal resources in the agriculture
sector, there again, the task is not easy with the sources of information currently available. The composition
of goods and services utilized for agriculture is not transparent. The chart of accounts includes a few object
codes that are overly broad. This includes code 2393 for agricultural expenses for example which
consumed 62 percent of actual spending on goods and services by MAFFS in 2006, 50 percent in 2007, and
67 percent in 2008. This makes it difficult to know how much was spent on agricultural inputs such as seed
rice and the conduct of annual crop surveys to more accurately determine output and yields. In addition, the
picture remains incomplete without an accounting for how the local councils have contributed to the sector.
At present, the IFMIS does not record Local Council spending by object code.

62
123. Conclusion on the functional allocation of expenditure : the analysis conducted on the
composition of spending shows that a significant share of the resource are spent through public
expenditure programs on private goods, in particular fertilizers, seeds and agricultural machinery
while on the other hand key public goods such as agricultural research appear to be significantly
underfunded. While the focus on delivering agricultural inputs in the direct post-war context can
be understood as a way to boost production rapidly and assist smallholders impacted by the
conflict to restore their productive capacities, the effects of such incentives may be
counterproductive on the longer term. More than ten years after the return of peace in the country,
a refocus of MAFFS expenditure programs on the delivery of essential public goods appears to be
desirable.
3.4 REGIONAL DISTRIBUTION OF EXPENDITURE
a) Centralized versus decentralized spending
124. Analysis of the data collected during the AgPE review shows that decentralized
expenditures have increased dramatically starting from 2007. The agriculture sector has largely
benefited from this important administrative reform, being the sector that has received the highest
amount of devolved funding after Health and before Education. The following table provides
elements of comparison of the Sierra Leonean situation regarding decentralized spending (on
internal resources). It puts the Sierra Leone in an intermediate situation between the countries that
have already achieved a good degree of decentralization (Ghana for example) and those who did
little or no implementation (Togo, Liberia notably).
Table 11: Centralized vs decentralized spending in various sub-Saharan Africa countries.
Burkina Faso
Ghana Liberia Togo Sierra Leone (2012)
HQ 51% 100% 70%
Technical Directorates 21% 28%
Total Central 92% 72% 100% 98% 81%
Regional & Local Offices
8% 27% 0% 2% 19%
Source: Hourticq and Zorya, and MoFED for Sierra Leone.
b) Regional Allocation of public agricultural Expenditure
125. The regional allocation of all the agriculture public expenditure cannot be ascertained in
Sierra Leone. For one, MAFFS (and other Ministries) does not report on the geography of its
expenditure. At best, some rather partial information is available in the MAFFS annual reports
but this concerns more activities usually without indication of budget spent. For example, simply
knowing the regional distribution of subsidized seeds or fertilizers across the country is not
possible.

63
126. Donor funded initiatives also rarely report on the geographical localization of
expenditure executed. Even though the districts of intervention of each projects can usually
relatively easily be known (by reading the project document), annual technical and financial
reports rarely provide a clear picture on what was spent where. In our case however, an inventory
of project expenditures realized by the MAFFS under the MAFSAN project allows us to provide
some analysis of the regional allocation of donor funded agricultural expenditure. This analysis
will however only show regional allocations and not expenditure at district level.
127. The following table presents the repartition of project reported expenditure by region and
the repartition of the population (2010 estimate).
Table 12: DP funded project expenditure by region vs population repartition
Southern Western Eastern Northern
Share of DP funded expenditure 26% 5% 24% 45%
Share of the total population 20% 28% 21% 31%
Sources: MAFFS/ MAFSAN data, author’s calculations and Statistic Sierra Leone.
128. One can notice here that the western region has received less funding (5%) comparatively
to the size of its population (28%). This situation can however be considered as relatively normal
since a very large share of the western area population is urban (Freetown). For the other regions,
repartition of project funding seems in relatively good accordance with population size.
c) Funds devolved to districts
129. Sierra Leone's Local Government Act (2004) provides for the devolution of all aspects of
some 80 functions to Local Councils, with funding for these services to be secured through a
combination of Local Council own-source revenues and formula-based grant allocations. The
following table, provides figures on cumulated district based agriculture spending (IR) per district
(in Million Leones) in Sierra Leone for the years 2007 to 2012 (+ equivalent data on health and
education for reference) :
Table 13: District level expenditure in the agriculture, health and education sectors (Le.
Millions).
COUNCIL AGRICULTURE
(COFOG)* HEALTH EDUCATION
Bo District 3,217 2,665 1,116
Bo City 735 8,581 1,373
Bombali District 4,028 2,713 1,384
Makeni City 796 7,569 912
Bonthe District 1,586 1,393 744
Bonthe Municipal 509 1,585 399
Freetown City 597 32,669 4,439
Kailahun District 3,270 6,193 1,293
Kambia District 3,040 5,080 1,202
Kenema District 4,556 3,136 1,372
Kenema City 765 7,886 1,095
Koinadugu District 5,493 5,392 1,120

64
Kono District 3,788 2,028 824
Koidu/New Sembehun City 705 3,284 860
Moyamba District 3,978 5,012 1,335
Port Loko District 4,404 9,695 1,807
Pujehun District 2,426 4,457 919
Tonkolili District 3,984 6,543 1,684
Western Area Rural District 1,568 5,533 992
Source: MOFED and Author’s calculation. * “Agriculture COFOG” combines Agriculture and Marine Resources and Fisheries except for FY '12 (Marine Resource and fisheries pertaining to ‘others’ and not dissociable in the data received)
130. When calculated per inhabitant and per year, these allocations can be relatively variable
per district. In average, allocations where around 1,818 SLL per inhabitant and per year (urban
average: SLL 546; rural average: SLL 2,146) for the agriculture sector, with the maximum
observed for Koinadugu district (SLL 3,086 per year per inhabitant) and the minimum for the
City of Freetown (SLL 109 per year per inhabitant), the lowest allocated to a rural district being
SLL 1,346 for Kailahun.
131. In theory, the size of the allocations granted to district councils is formula-based. This
formula takes into account the size of the population, the urban/rural ratio, the poverty rate (and
other parameters). The following graph brings together data on allocation and data on poverty
rates. One can see indeed a moderately strong relationship linking allocations the poverty rates
for rural districts (the relative exception being Koinadugu).
Figure 21: Relation between Poverty rates and Agriculture sector district allocations for the 13 rural districts of Sierra Leone
Source: MoFED data (for district council budget) and latest poverty data
Bo
Bombali Bonthe
Kailahun
Kambia Kenema
Koinadugu
Kono Moyamba
Port Loko Pujehun
Tonkolili
Western Area Rural
1.00
1.50
2.00
2.50
3.00
3.50
4.00
4.50
5.00
5.50
40 45 50 55 60 65 70 75 80Agr
icu
ltu
re l
oca
l co
un
cil e
xpen
dit
ure
(c
um
ula
ted
20
07
-20
12
, usd
)
Poverty rate
Relation between Poverty rates and Agriculture sector district allocations for the 13 rural districts of Sierra Leone

65
132. The next graph shows the relationship between food insecurity rate (% of household food
insecure) and allocations granted to local councils. Here again, one can see a relationship between
the two but agriculture sector allocations are not very significantly higher in districts where food
insecurity rates are much higher.
Figure 22: Relation between percentage of food insecure households and Agriculture sector district allocations for the 13 rural districts of Sierra Leone
Source: MoFED Data and WFP 2011 for food insecurity data
Bo
Bombali
Bonthe
Kailahun
Kambia
Kenema
Koinadugu
Kono Moyamba
Port Loko
Pujehun
Tonkolili
Western Area Rural
-
1.00
2.00
3.00
4.00
5.00
6.00
0.0 10.0 20.0 30.0 40.0 50.0 60.0 70.0 80.0 90.0
Agr
icu
ltu
re l
oca
l co
un
cil e
xpen
dit
ure
(cu
mu
late
d 2
00
7-2
01
2,
usd
)
Percent households food insecure
Relation between percentage of food insecure households and Agriculture sector district allocations for the 13 rural
districts of Sierra Leone

66
4. TECHNICAL EFFICIENCY IN THE PREPARATION, IMPLEMENTATION, AND MONITORING OF AGRICULTURE
EXPENDITURE
133. Technical efficiency is primarily determined by the effectiveness of the process of
preparing and implementing the budget. The most common approaches for assessing technical
efficiency include an alignment between the funds allocated in the budget and their actual use, the
budget implementation rate, and the cost-effectiveness of programs implemented.
4.1 PLANNING AND BUDGETING PROCEDURE
a) Overview Of Past And Current Budget Planning Procedures
134. The financial year runs from January the 1st
and budget preparation is driven by the
Ministry of Finance and Economic Development. Guidance provided is quite detailed as
according to the MAFFS Planning division, the budget circular (transmitted usually in June)
indicates budget ceilings by Divisions for each Ministry, raising the question of the margin of
manoeuvre that line ministries have to make the structure of their budget evolve. Cabinet is not
formally involved in the preparation of the Budget Call Circular and in general there are only few
opportunities for Cabinet officials and Parliamentarians to review policy options at a strategic
level before MDA budget proposals are completed.
135. The Budget Call Circular provides a calendar for the preparation of the MTEF and
Budget as a combined process. An MTEF thus exist but in practice the budget is annual and the
medium term forecasts are only partially used as a reference. Budget approval usually occurs
before the end of the FY. Budget approval has been on time these recent years (2010-2014 at the
exception of 2013, as 2012 saw elections), but substantial delays were not an exception during the
previous years.
136. Among the weaknesses of the planning/budgeting process in Sierra Leone is the fact that
investment is not sufficiently linked to its recurrent expenditure implications. The MoFED has
recently created a Public Investment Unit which could potentially improve this situation but no
such division/ unit exist within MAFFS and the linkages between investments and recurrent
expenditures are indeed weak in the MAFFS budget.
Box 8: Extracts from “Sierra Leone. Public Expenditure Review. October 28, 2010” Report No. 52817-SL.
PREM 4. Africa Region. World Bank.
On public investments :
“The laws and regulations governing public investment are reasonable but they focus on details at
the expense of strategy, cost-effectiveness, and accountability. At present, there is little required
from ministries and other Government institutions, or from donors, with regard to monitorable
outcome and progress indicators, or maintenance requirements after a project is completed.
Moreover, only a small portion of project proposals are carefully appraised by Government
officials. As a consequence, the Government has occasionally been unable to attract funding from
interested donors due to a lack of fully worked out project documentation. Since most of the
development budget is financed externally, Government officials often rely on the appraisals
done by donor agencies without developing Government capacity for project appraisal.”

67
b) Quality of annual budget and plans
137. While all MDAs in the agriculture sector have such strategic information as mission
statements, division and program purposes, strategic overview, key policy developments, and key
performance indicators (notably through the NSADP), linking policy objectives to activities,
funding sources and estimated costs, remain some of the key challenges. Objectives are rarely
presented in a specific, measurable, achievable, realistic, and time-bound way. The budget
formulation process is generally weak and would require a substantial overhaul to link policy and
planning to expenditures. Changes also need to be made to make it easier to analyze budget data
and comparing outturns with budget estimates.
138. One could also advocate for a strategy- and results-based approach of budgeting
instead of a means-based one in the sector and it should help resolve a good number of the
problems described above. Nevertheless, this would entail a substantial capacity building effort
as such an operation is of little interest unless it truly allows all levels of MAFFS to use it. In each
division at least, a small team responsible for leading the planning operations within their division
based on Result Based Management principles (and including M&E indicators) should be
intensively trained. This same team would later be responsible for monitoring the programs and
drafting performance reports.
139. In the event that a sectoral approach for agriculture were adopted for budgeting purposes,
needed would be a clearer definition of the various participants’ responsibilities, improved
compliance to the budget schedule, the organization of an Agriculture Sector budget seminar
before the distribution of the budget guideline letters, and the creation of specialized inter-
ministerial committees serving as a driving force for the entire process.
4.2 EXECUTION RATES
Internal resources / Central level
140. As can be seen from the graph bellow, the execution rate for the projected budgets of
the group of ministries and institutions in the agricultural sector came to 79% over the period
considered in average. This rate is not excellent but the figure shows that the trend is gradually
improving. One can see also from the graph bellow that it is for Domestic Development
Expenditure that execution rates have been the lowest although here again the situation is
improving.
141. For the MAFFS itself, the overall average execution rate for the same period is somewhat
better as it comes to 85%. Nevertheless, execution rate for Development Expenditure is low (54%
in average over the period), a point that critically deserves attention. It shows that planned
expenditures are rarely implemented fully and deviations from budgetary allocations are often
significant notably for domestic development expenditure at least. For 2012, the execution rate
was very high.

68
Figure 23: Actual vs budgeted expenditure 2004-2012 (MAFFS, agriculture sector, Domestic Development Expenditure in the Agriculture Sector). Internal Resources.
Source: Expenditure actuals, parliamentary copy (years 2004 to 2012)
142. Overall, execution rates in the sector have been lower than execution rates of the overall
State budget. One must take into account the general context into which these implementation
rates are discussed: overall state expenditure exceeded 100% during years 2009 to 2012 included.
According to the latest PEFA17 assessment, this deviation between actuals and budgeted reflects a
period in Sierra Leone initiated by optimistic growth estimates made in 2010. Much of the over-
expenditure was accounted for by domestically financed capital investment programme (in
particular road building), which was of multiyear nature. It was not until 2013 that expenditures
were reined in.
Devolved expenditure (through Local Councils)
143. The figures provided by the MOFED LGFD (Local Government Finance Department)
are showing extremely good execution rates for devolved budget.
17 Public Expenditure and Financial Accountability (PEFA) Assessment in Sierra Leone Central Government Systems, 2010-2012. Coffey international.
0%
20%
40%
60%
80%
100%
120%
140%
2004 2005 2006 2007 2008 2009 2010 2011 2012
Overallexpenditure(Agric.COFOG)
DomesticDevelopmentExp.(AgricCOFOG)
MAFFS(overall)
Overall StateBudget

69
Figure 24: Execution rate of budget transferred to the local councils (2007-2011). Agriculture (COFOG) and all sectors.
Source: MOFED. LGFD and author’s calculation. Note : (1) Agriculture COFOG combines Agriculture and Marine Resources and Fisheries
(2) For 2007, only Q1 and Q2; For 2008 to 2010 (Q1 to Q3) ; For 2011 (Q1 to Q4)
144. However, these figures must be taken with caution as they only refer to execution rate
over the Grants actually transferred to the local councils and not the budgeted Grants. In effect,
actual Grants as Share of the Budgeted Grants were only 40% in 2007 and 81% (27% and 70%
for Agriculture). This means that in fact, transfers to local councils have also generally been well
below targeted levels, reducing service delivery for all devolved functions. These deviations are
largely explained by overall resource availability but not only. The planned expenditure may also
not be in line with the capacity.
145. Again, it must be stressed here that the devolution process is a challenging one in every
aspect and requires a tremendous capacity building effort. In the agriculture sector, the devolution
process is still at an early stage of its effectiveness. In respect of devolved functions, staff
devolved form the MAFFS are still paid by the central government even though Councils may
pay for additional staff from their own source revenue (but in practice, these revenues are very
limited). This situation can potentially create tension18 between local officers of the line ministers
and the Local Councils which can undermine planning and budgeting for the devolved functions.
18 MAFFS officials, because they are still paid by the central government perceive the central level as their legitimate authority whereas in all logic they should be under the authority of the Local Council.
80%
85%
90%
95%
100%
105%
2007 2008 2009 2010 2011
All sectors
Agriculture (COFOG)
70
146. According to interviews done for this Report, very few officials within the sector have a
comprehensive and detailed understanding of the list of functions specifically devolved to the
Local Councils in Agriculture (17 in total, out of the 80 devolved in total). In practice, planning
and budgeting are not prepared with explicit references to this list of devolved function. Targets
sets do not appear to be linked either. An Australia-funded, FAO-executed project is currently
assisting MAFFS in strengthening Local Councils’ planning capacities. While this initiative is
timely and can be commended, the effort deployed seems very limited in comparison to the size
and complexity of the challenge.
Externally funded expenditure execution rates
147. There is currently insufficient knowledge of the effective disbursement rate of the
projects to conduct such an analysis. Each project PIU may have this information available, but
collecting and aggregating this information at sector level has proved difficult and in practice
impossible (high number of PIUs, non-responsiveness, absence of archival system, etc.). The
difficulty was raised by the consultant team during AgPER Technical Working Group meetings
but none of the participants could find a practical solution. This proves only that the development
partner funded projects “owners” (MAFFS, MFMR, etc.) do not have in effect enough ownership
on the management of the various projects. This is a situation that needs to be addressed and
remediated.
4.3 MANAGEMENT OF ODA IN THE AGRICULTURE SECTOR
a) Fragmentation of Aid, high number if PIUs
148. As highlighted in the second chapter of this Public Expenditure Review, externally
funded projects represent the largest share (around three quarters) of the resources available to
and spend in the Agriculture Sector. The quality of the processes used to manage ODA in the
sector is thus essential to the technical efficiency of the agricultural spending. The situation is
unfortunately quite far from being optimal.
149. A first structural obstacle to the quality of the management of ODA (including
consolidated M&E, oversight, overall planning with verification of the coherence of externally
funded project plans with IR funded plans) in the sector is the number of ODA funded projects.
150. This results in considerable coordination challenges and reduces aid effectiveness by: (i)
presenting additional challenges to harmonizing and aligning aid, which results in rising
transaction costs; (ii) creating wasteful duplication and overlap in the delivery of aid; (iii) and
causing competition for scarce skills at country level.
151. MOFED communicated data (ODA database) shows that the number of project in the
agriculture sector has constantly increased during the period 2003-2012 while at the same time,
the average amount disbursed by project was decreasing. It should be noted however that the
analysis should not be based only on the average disbursement per project but also on the
distribution of disbursements by the projects. Such an approach shows that – especially in the
recent years - a larger share of the disbursements was made by a few “large” projects (such as the
SCP) with a multitude of small disbursing projects. The issue then is whether the small projects
need to stand alone.
152. The MAFFS has the willingness to reduce the number of PIUs and has recently taken the
initiative to examine the feasibility of having only one single centrally managed PIU for all the

71
DP funded projects (“One PIU initiative”). Such a change would need careful planning and
cannot be achieved within a shorter timeframe. However, there are certainly economies of scale
achievable by limiting the number of PIUs and centralizing or putting in common some of the
functions that (sometimes costly) PIUs specialized staff are performing (such as : M&E,
procurement, mobilization of audits, etc..). Also, one can only recommend here that the subject of
reducing the number of PIUs and increasing the size of each ODA funded project be taken on
board very systematically by the Agriculture Sector donors working group.
Figure 25: Number of projects and average amount disbursed annually by project (in $US) over the period 2003-2012
Source: MoFED ODA database and author’s calculation
b) Mis-alignment between national and projects’ budget preparation
processes
153. Another critical dimension and actually weakness in the way ODA is managed in the
Sector refers to the way planning and budgeting are done for external resources and internal
resources. In effect the two processes are “mis-aligned”. Firstly, their calendars are not the same.
While the calendar for the preparation of the Government budget is clear, uniform and well
known, donors and projects have their own requirements and deadlines. The first practical
consequence is that it is impossible to have a meaningful dialogue on what can IR cover and what
should externally funded project cover, and finally to check that the internally and externally
funded budget-plans complement each other. The multiplication of “project steering committees”
does actually little to ensure this complementarity and coherence.
0
5
10
15
20
25
30
35
40
45
50
-
500,000
1,000,000
1,500,000
2,000,000
2,500,000
2003 2004 2005 2006 2007 2008 2009 2010 2011 2012
Averageamountdisbursed perproject
Projectcount
Linear(Averageamountdisbursed perproject)

72
154. In effect also, a large portion of aid is ‘off-budget’. According to the 2008 Survey19,
almost half of the total aid coming into the country was ‘off-budget’, i.e. not recorded in the
national budget, while roughly 80% of aid does not pass through treasury. This leaves much
uncertainty about the extent to which aid is conforming to GoSL priorities and leads to weak
national ownership of some programs. It also creates budgetary difficulties, by way of unforeseen
recurrent-cost implications.
155. The “misalignment” of donor project dates and processes is however not a reason why
donor funding should not be better incorporated in the national budget. Every donor project has a
project document signed-off by the Government with (in most cases also) counterpart funding
identified, and they are usually multi-year. There is no strong reason why the information should
not be captured in the Government budget. With a small ODA management Unit, MAFFS and
others could do a better job at this.
156. Another dimension of the current mis-alignment between national and projects’ budget
preparation processes concerns the processes and formats used for preparing and presenting plans
and budget which also can differ largely from one project/donor to another and in general are
simply not coherent with the way the government is planning and budgeting the use of its internal
resources (means based budgeting vs result based budgeting). While this is certainly a challenge
and an endeavor that transcends the agriculture sector, it would be advisable to progress toward a
better coherence both in terms of timing and formats in order for planning and budgeting to be
more coherent. Here again, the task could be taken up by the Donor Agriculture Sector working
group to explore the feasibility of progressing rapidly in such a direction.
4.4 RESOURCES ALLOCATION PROCESS, EFFICIENCY OF SPENDING
157. For lack of time, the resources allocation processes have not been the subject of much
exploration and discussion between the consultant team and the government counterparts during
the AgPE review. The subject is nevertheless of importance as the quality of the resource
allocation has self-evident implication on the quality of service delivery in the sector. The topic is
approached here by giving a synthesis of the findings of a recent review that has looked
specifically at this subject in Sierra Leone in the Agriculture Sector. A much more detailed
account is accessible in the review itself which has been made available to the public (Audit
Service Sierra Leone website).
158. The Government of Sierra Leone has in effect used Public Expenditure Tracking Surveys
to ascertain the flow of funds between central government and frontline service units as well as
assessing local people’s perceptions of government services. Public Expenditure Tracking
Surveys have generally been undertaken by the Economic Policy and Research Unit of the
Ministry of Finance in the early 2000 and more recently Performance Audits have been produced
by “Audit Service Sierra Leone” a service belonging to the Official Sierraleonan Audit
Institution.
159. A recent (201220) Performance Audit conducted in the Agriculture Sector examining the
procurement and delivery by the MAFFS of rice seeds to farmers concluded of :
o Serious irregularities in the procurement process
o The absence of established criteria for allocation to district
19 OECD (2008). 2008 Survey on Monitoring the Paris Declaration. Making Aid More Effective by 2010. Country Chapter – Sierra Leone. 20 Performance Audit Report on the Distribution of Agricultural Inputs. ASSL. January 2012.
73
o The lack of adequate control (quality of the seeds procured, targeting, cost / seed
recovery)
160. The same report examined the delivery of mechanization services through MAFFS
acquired tractors. The government of Sierra Leone has in effect bought a number of tractors that
are made available to farmers. The total number of MAFFS tractors operating in 2009 was 92
(including 10 new “Libyan” tractors). These tractors are retained and maintained by MAFFS
district offices/workshops. A further 263 tractors procured by the government were distributed
under a hire-purchase scheme in 2010. This last acquisition represents a substantial expenditure
(author’s estimate: 3 millions $US, no official figure could be found).
161. The ASSL report concluded that the tractors acquired were deteriorating and that the
number of acres ploughed per year was decreasing. Furthermore, criteria for the allocation of the
most recent batch of tractors (the 263 units acquired in 2010) to the districts were unclear and
tractors were in general underutilized.
162. While the conclusions of these reviews point clearly to the need to improve resources
allocation processes within the sector and the quality of oversight / control over spending, it is
actually difficult if not impossible to go much further into the analysis of the causes of such a
situation. For one, an analysis of the efficiency with which government services in agriculture are
provided is prevented by the paucity of data on costs and quality of services. This is perhaps to be
expected given low levels of capacity within government to effectively monitor and account for
expenditures. However, as regularly pointed by the PETS and Audit reports, efficiency (or value-
for-money) is an issue that MAFFS should seek to address if it wishes to strengthen its future
claim on public resources. A principal means of achieving this is systematically to record
information on the costs of service delivery and outcomes achieved. This information should
figure more systematically in MAFFS annual reports.
Box 9: MAFFS reporting Monitoring information being scarcely available in the Sector, the consultant team has tried to use the
option of assessing the quality and effectiveness of expenditure by scrutinizing the annual MAFFS
reports. MAFFS annual reports for the years 2009 to 2012 were collected and read for this purpose21.
The reports refer to a large number of activities, but it is not possible to pinpoint activities financed
primarily by allocations from the internal budget from many of those that were supported by donors and
realized in cooperation with MAFFS. The coverage and scope are often not indicated, and explanations of
the rationale or analyses of effects are not mentioned. Also, it does not reveal how these were financed,
nor does it indicate how many farmers had contact with extension or technical services staff. It is in a
sense surprising to see that so much skilled and costly resources (notably TAs) are allocated to project
management and supervision and possibly reporting (a too high level of resources according to the
Ministry itself) while at the same time, a comprehensive quality annual report is not available. Underlying
this issue, an activity monitoring system is clearly necessary, as this will also enable production of reports
that reflect the efforts undertaken and their outcomes in terms of publicly funded agricultural services
made available to farmers.
21 Note that MAFFS annual report for the years prior to 2009 could not be collected for lack of reliable archival system.

74
4.5 REVENUES AND THEIR MANAGEMENT
163. There are also problems with procedures for accounting for revenues. MAFFS receives
revenues from various sources (forestry concessions, hire of mechanical equipment, sale of
fertilizer, etc.), which are not transferred to the consolidated account. Some funds (e.g. forestry)
are kept in separate accounts that are not audited. An external audit has not yet been undertaken.
Here again, the main sources of information on the subject are the reviews executed by the “Audit
Service Sierra Leone” which have looked specifically at the collection and management of
revenues within the MFMR and MLCP. The paragraphs that follow present selected extracts of
these reports.
For the fishery sub-sector:
The following is an extract of “Audit Service Sierra Leone Performance Audit Report On
Generation And Collection Of Revenue In The Fisheries Sector September 2012”. “MFMR
receives their major funding through budgetary allocations from the Ministry of Finance and
Economic Development (MOFED). The revenue it generates through Licences, Royalties,
Transhipment fees, Fish Health Certificates, Discharge Fees, Fines, Sales of Confiscated Catch,
Clearance Fees, Export Fees and By-Catch charges is paid to NRA that pays it into the
government’s consolidated fund. A total of Le 11,332,983,340 was collected in 2010 and Le
12,798,458,432 collected in 2011.
During the course of the audit, we arrived at the following findings:
o The councils have not established and implemented adequate monitoring and
controls over fish revenue collection ,
o Fisheries observers on board the licensed vessels often find themselves in a weak
position in relation to the captain of the ship when trying to enforce the correct
fishing practices.
o Patrolling of Sierra Leone’s fishery waters has not been effective Monitoring of
fishing activities by the Ministry has not ensured good fishing standards.
MFMR was unable to provide the auditors with documents showing yearly revenue generated
and collected from fishing activities for 2007 and 2008. Such documents were only produced for
2009 and 2010. Requested lists of registered fishing companies and the type of fishing vessels
operated by such companies could be provided for 2011, but not for the period 2007-2010. In the
district councils visited (Moyamba, Pujehun and Western Area Rural), documents showing the
number of boats, licensed in the period 2007-2011, were not maintained even though the strategic
plans included a programme for data collection of fishing boats. In order to improve on this
situation we recommend that the following issues be addressed:
MFMR should approve and issue the new Fisheries Regulations as soon as possible and complete
the drafting of a bill for the amendment of the 1994 Fisheries Act. The Local Councils should
ensure that licensing fees are collected annually in accordance with pre-defined and sustainable
tariffs. To facilitate this, databases with details of canoes, fees, revenue collected, etc. should be
developed and monitoring by M&E officers improved. To promote the independence of the
fisheries observers, MFMR should ensure that their salaries are paid by them and not by the
fishing companies. MFMR should also consider how back up support to the fisheries observers
could be improved when captains do not want to obey the observers.”

75
For revenue generated from land allocation:
The following is an extract of “Audit Service Sierra Leone. Performance Audit Report On The
Allocation Of State Lands By The Ministry Of Lands, Country Planning And The Environment
December, 2013”. “The purpose of this Performance Audit was to assess the efficiency and
effectiveness of the Allocation of State Lands by the Ministry of Lands, Country Planning and the
Environment (MLCP&E). The Ministry is charged with the responsibility of allocating all state
lands. This report focuses on the processes and procedures in the allocation of state lands.
It was observed that for the construction of a dwelling house, a fixed price of one million Leones
(Le1,000,000) per annum had to be paid as lease rental for the first three years of ownership
regardless of the size/acreage or location of the land; and some Lessees were offered more than
the three town lots - the maximum allocation of land to an applicant. The fixed charge of
Le1,000,000 for leases irrespective of the size and location of the land had the potential to affect
the amount of revenue generated by the Ministry.
o The Ministry could not provide any evidence of an established committee as
recommended in the Marcus Jones Commission’s report and accepted in the
Government White Paper for the allocation of state lands. In addition, there was
no evidence that applicants were interviewed before they were allocated state
lands for the period 2010 to 2012.
o The Ministry could not produce any evidence of a structural plan on the
allocation of state lands to include infrastructural facilities like good road
network, markets, water supply, electricity, etc.
o The Ministry failed to provide evidence of a database or land register for state
lands in the Western Area and the reserved lands in the Regions.”
164. Revenue generation from the lease of larger tracks of land to qualified agribusiness
investors is a current practice promoted in Sierra Leone that could potentially yield positive
prospects both in terms of agricultural production (notably for export crops) and revenues (from
the land leases). However, in order to attract investors, a ‘special set of incentives’ has recently
been approved which may limit substantially the capacity of the GoSL to generate revenues from
the lease of lands. The major incentives includes exemption on:
o corporate income tax ‘up to 2020’ [i.e. for 10 years] for companies in the tree
crops sub-sector (such as oil palm and sugarcane). This compares to the standard
corporate income tax rate of 30 per cent.
o import duty on raw materials and agricultural inputs, compared with the standard
3 per cent.
165. A recent report22 produced by NGOs states that “an estimated USD 188.1 million or USD
18.8 million a year on average over a 10-year period in tax revenue will be foregone by the
government as a result of special tax deals with Addax Bioenergy, SAC and Goldtree Ltd”. While
the team of consultants has not been able to verify this information, this is certainly an area where
policy dialogue is needed in order to maximize the potential gains from this type of policy in a
context where the demand for leasable land for cash crops growing is sustained.
22 WHO IS BENEFITTING? Social and economic impact of three large-scale land investments in Sierra Leone: a cost-benefit analysis. 2013. Report commissioned by Action for Large-scale Land Acquisition Transparency (ALLAT).

76
5. CONCLUSIONS AND RECOMMENDATIONS: HOW COULD THE QUALITY OF SPENDING BE STRENGTHENED ?
5.1 FACTORS AFFECTING THE QUALITY OF SPENDING
166. First of all, attention should be drawn on the following elements which are currently
having a negative influence on the quality of spending in the agriculture sector :
o Reporting is weak: due to an incomplete M&E system, making it difficult to
track progress, identify failures and re-allocate efforts during planning exercises.
It is hardly possible to identify corrective measures when clarity is so difficult to
reach on the current level of performance of the public administrations active in
the sector. Furthermore, this absence of clarity bears the risk of creating an
atmosphere of distrust between (and within) the GoSL and the Development
Partners.
o High fragmentation of aid resulting in high transaction costs and inefficient use
of Government scarce resources. This is one of the key areas on which the GoSL
must accelerate the current efforts and where the DPs have a crucial role to play.
A complete reversal of the current trend (increasing fragmentation of aid in the
sector) is a mandatory condition for improvements to be achieved in the
efficiency of the use of the sector resources. The international debate and
initiatives on the subject (Paris Declaration, Accra Agenda for Action, etc.) give
an adequate framework for all parties to act.
o Permanence of a substantial off-budget component: related to the above, the
budgeting process needs to be strengthened in order for the share of Off-budget
resources to decrease rapidly. Here again, DPs have a role to play, and can
notably systematically synchronize the project planning/budgeting with the GoSL
system.
o Low numbers / qualification / motivation / stability of staff: the deficit in
capacities is still a major issue within the administrations active in the agriculture
sector. This challenge is being currently exacerbated by the devolution process
which places increasing responsibilities in the hand of the local councils.
o Maintenance and operation cost and mechanisms generally overlooked for all
types of capital expenditure (public service equipment, public infrastructure and
investments transferred to beneficiaries): issue of recurrent cost traceability in
budgets.
o Lack of Knowledge management / evaluation: when projects end, a substantial
part of the (mostly individual) experience gained in terms of agricultural
achievements (and under-achievements) is lost and not transformed into
institutional knowledge. The institutions of the sectors must strengthen their
capacity to become “learning organization”. This supposes better reporting (see
above) but also more systematic transparent and external evaluations of activities
implemented and teams dedicated to capitalizing on lessons learned and
transferring / applying knowledge to subsequent project and activities. A number
of activities of the MAFFS remain un-evaluated (e.g. mechanization).

77
5.2 PROPOSED ACTIONS FOR IMPROVING THE EFFICIENCY OF PUBLIC EXPENDITURE IN
AGRICULTURE
Actions Responsibility
Budget
programming and
level of spending
- Establish medium-term expenditure
frameworks as a budget planning tool.
- Increase the resources allocated to the
agriculture sector as the current share of the
State budget appears inadequate in terms of
the Maputo Declaration.
State House,
MoFED, Line
Ministries
- Reduce the number of DP funded projects
and increase size of each projects by more
systematically using pooled fund (basket
funds, etc) in order to reduce the
transactions costs of ODA management;
- Include in the budgets of the agricultural
sector ministries all agricultural
development projects, in particular those of
DPs that are currently not monitored by
MEF or the Ministry of Planning.
MoFED,
Ministries, DPs
(Ag. Sector
Working Group)
- Formulation of project to be made on the
basis of past experience (evaluations,
capitalization on success and failures).
Ministries and
other institutions
involved in the
Ag. Sector, DPs
- Establish a mechanism for budgeting for
operating expenditure on maintenance of
capital items.
- Divide coherently roles and means for
investment maintenance between central
level and Local Councils
MoFED,
Ministries and
other institutions
involved in the
Ag. Sector
- Improve cost accounting at the development
funded project level to identify the operating
costs incurred by the project management
- Identify project management functions
which cost could be reduced by pooling
resources across projects.
Ministries and
other institutions
involved in the
Ag. Sector, DPs
Budget
Implementation and
Procurement
- Present commitment and procurement plans
at the same time as the annual budget, and
make tender documents available before the
start of the budget year so that calls for
tender can be issued in January.
- Better monitoring of investments made at
the level of support services and of
beneficiaries, and better monitoring of the
regional distribution of expenditures;
MoFED,
Ministries and
other institutions
involved in the
Ag. Sector
Decentralization /
devolution - Develop and implement a comprehensive
capacity building plan at Local Council
level.
- Transfer staff (and corresponding budget)
Ministry of Local
Planning, MoFED,
Ministries and
other institutions
78
from central level payroll to Local Council
payroll
involved in the
Ag. Sector.
Monitoring and
Evaluation
- Implementation at all levels of an effective
M&E system coupled with an efficient
information archiving and dissemination
mechanism
- Draw up a system for monitoring
performance in the agricultural sector with
the use of quantifiable and verifiable
performance indicators, potentially based on
PNDSA indicators
- Institutionalize the AgPER process, with
light annual AgPE reviews and in-depth
reviews every 3-5 years.
- Strengthen annual assessments of
ministries’ progress, detailing monitoring of
actions and activities.
- Overhaul MAFFS (and other public
institutions reports involved in the
agriculture sector) annual reports
- Improve information feedback on actual
expenditure by all services and make this
information available through annual
reports.
- Ensure the introduction of an effective
system for monitoring program budgets in
aggregated fashion (not just PIU by PIU).
- Produce evaluation reports for all projects.
Establish an Evaluation Unit under PEMSD.
- Produce impact studies for major projects.
Ministries and
other institutions
involved in the
Ag. Sector
Functional
allocation
- Better functional distribution of
expenditures is needed.
- The livestock (including veterinary services)
subsector as well as R&D appear to be
largely under-funded and require immediate
attention.
- Agriculture extension received only 2.11%
of the total spent in the sector through the
projects, which appears as a low figure in
comparison to the central role that extension
can play in the dissemination of agricultural
technologies. Since private extension
services are quasi inexistent, a higher level
of spending into public advisory services is
necessary, especially in a context where
efforts are put into decentralization and
devolution
Ministries and
other institutions
involved in the
Ag. Sector
Policy Development - Elaborate a strategy for agricultural Ministries and

79
extension so as to include the role of all the
parties involved (MAFFS, private sector,
NGOs, local councils)
other institutions
involved in the
Ag. Sector
- Study how to end the duplications observed
between existing project and future PIUs.
Give support to pooling resources and
ensuring their ownership by the sectors
institutions. Enact MAFFS ODA
management decree / guidelines.
Ministries and
other institutions
involved in the
Ag. Sector
- Evaluate past expenditure in support to
mechanization and develop a strategic
framework for mechanization development
Ministries and
other institutions
involved in the
Ag. Sector
5.3 ADDRESSING AID FRAGMENTATION
167. This report points to the high level of fragmentation of aid within the sector as a key
finding of the review and highlights the necessity to address this challenge as a priority for
MAFFS. Various modalities to reduce aid fragmentation exist, ranging from consolidating only
selected functions of the project implementation units (such as M&E, procurement, resource
management) to the creation of a single project implementation unit for all donor-funded
assistance exist. The current option studied by MAFFS – called “one PIU initiative” - to create
one single (large) PIU able to manage all (or at least) most projects owned by the Ministry could
serve this purpose and the report recommends to pursue this objective with a step by step
approach.
168. Initially, a quick scoping study could look at the current roles of existing PIUS and
evaluate for which functions/roles, duplication/fragmentation of efforts appears the most obvious
and desirable to eliminate. Aggregating PIU functions at the level of a central Unit should then be
undertaken function by function, starting with PIU functions selected for the ease with which
centralizing the function is the most obvious (readiness, existing capacities, acceptability to the
development partner, etc..). Such phased approach is recommended as the best way not to
overburden MAFFS planning staff with this effort consuming process. It is also recommended not
to try to merge existing PIUs but to negotiate with DPs on a case by case the centralization of
certain PIU functions during the project formulation process of future projects.
5.4 WORKING TOWARDS A SECTOR-WIDE PROGRAM
169. The preparation and of the SCP and its subsequent implementation have positive step
towards making donor interventions and GoL spending consistent and coordinated under the
umbrella of the NSADP. The challenge now is to maintain the momentum and develop this
approach further into a SWAP-like arrangement with ideally pooled funding arrangements.
170. The recent Consultative Workshop on Agriculture (Consultative Dialogue on the Path to
Prosperity, Nov 2013, Bintumani Hotel) chaired by HE. Ernest Bai Koroma, President of the
Republic of Sierra Leone, has demonstrated that agriculture is increasingly seen in Sierra Leone
as a sector involving multiple government institutions and led launching of the preparation of the
AFAIP.

80
171. A Sector Wide Approach will require an approved sector strategy (NSADP could be
considered as such or at least a good basis), donor commitment to adhere to the agreed priorities
documented in the sector strategy, a costed implementation plan, a common system for
monitoring results, a forum for regular dialogue and appraisal of results (achievements and
failures), and strong national leadership. Several of these elements still need to be practically
defined in order to be implemented.
172. In addition, a future SWAP would require intensive consultation and discussion to
become a tool to guide resource allocation and activity planning, and to avoid creation of a “wish
list” of items. Financial requirements shall not be overambitious and the present AgPER as well
as a Sector-MTEF could be used as tools to evaluate and describe future desirable levels of
spending (evaluated currently at around 100 million USD per year23).
173.
174. The preparation of this future Sector Wide approach could also be the opportunity to
translate into concrete decision and actions numerous of the recommendations of this Ag-PER, in
particular with regard to Donor Coordination, M&E, strengthening Local Council capacities and
alignment of planning procedures.
Annex 1: Terms Of References Of The Agriculture Sector Public Expenditure Review
1.0 Introduction
1.1 The Sierra Leone Agricultural Sector Review will be conducted within the
framework of Agricultural Sector Review (ASR). The overall objective of the review is
to enhance the efficiency, effectiveness and equity of public expenditure in the sector in
line with agricultural programs in order to meet the national development objectives. The
review is intended to provide evidence-based recommendations that will address, inter
alia, budgetary planning, budget execution, and accountability in the agriculture sector,
the creation of a reliable data base, and more effective intra- and inter-sectoral
coordination and alignment towards the sector strategy. It is also aimed at stimulating
larger donor resource allocations, and enhanced harmonization and alignment of
resources behind the Sierra Leone’s agricultural development strategy.
1.2 The main methodology will be the basic agricultural public expenditure
diagnostic review (Basic AgPER) which is intended to compile basic expenditure data
and to assess the extent to which expenditures reflect and contribute towards the stated
national sectoral priorities. It also aims to draw lessons from the analysis that will be used
to enhance the efficiency and effectiveness and impact of public expenditure in the
agriculture sector.
2.0 Scope of the Review
2.1 As in any public expenditure reviews, the exercise is essentially retrospective,
aiming to assemble a report of all public expenditures in the agriculture sector with
reasonable accuracy, over the past 5-10 years. It would assess expenditure trends and
23 See Chapter 2 : “To demonstrate a level of support in line with the Maputo declaration, Sierra Leone would have to reach a level of agricultural support in the order of 92.7 million $US per year”

81
composition at central and lower levels of government. The latter would be particularly
important for Sierra Leone given the decentralization of the agricultural extension
services to the District Assemblies. It is also particularly important to understand the
recurrent budget in the sector since the structure, financing and governance of the
recurrent budget will determine the sustainability of investments that are made on the
capital (development) budget. The analysis would need to capture supplementary budgets
and expenditures, as well.
Definition of Agriculture Sector
2.2 The sectoral scope of the study will be guided by the classification of the
functions of government (COFOG) system, even though the classification may not be
actually in place in Sierra Leone’s classification of Government functions. This means
that while the study will focus on the Ministry of Agriculture, Forestry and Food
Security, it may also involve related ministries, especially Ministries responsible for
Natural Resources, Energy and Environment. The analysis should however exclude non-
agriculture related expenditures such as Rural Development, trunk roads, health and
education. The study will present expenditure data in two ways: for analytical purposes it
will use COFOG, but for the purpose of presenting results and engaging in dialogue on
recommendations, it will adhere to the local budget nomenclature and structure.
3. Implementation
3.1 The study will examine budget implementation both in terms of the way in which
budget expenditures are executed as well as sector outcomes. An understanding of the
budget planning and “flow of funds” aspect of budget implementation is important as a
source of recommendations to improve budget planning and execution. Budget outcomes
in the sector will be reviewed in terms of major sector performance indicators as part of
the analysis of consistency between budgets and sector priorities and the identification of
major funding gaps.
Institutional Context
3.2 The Ministry of Agriculture, Forestry and Food Security (MAFFS) will be the
centre of the review exercise, together with the Ministry of Finance and Economic
Planning (MFEP). However, as stated above, other entities that perform public sector
roles within the COFOG boundaries of “agriculture” will have to be included. An
understanding of the links between central government and lower levels of administration
will be necessary so as to provide insights into “flow of funds” and “use of funds” issues,
especially in cases where fiscal decentralisation has been introduced.
Methodology
3.3 The dual starting points for the Basic AgPER will be:
• To formulate, in close collaboration with counterparts in the Ministries of Agriculture
and of Finance, a sound descriptive overview of the public expenditure budget in

82
the agriculture sector and its links with the macro economy, the fiscal context and
Ministry of Finance processes. A key element of this will be to identify and agree
upon sources of sector performance and budget outcomes that will serve as the focus
for the study; and
To assemble a synthetic set of budgets for analytical purposes (from all the
concerned ministries, agencies and other entities) that cover public expenditure in the
sector for the previous 10 years.
Sectoral Context
3.4 The main elements of the sectoral context and the potential information sources
will include, but not be limited to:
• Main macro issues affecting the sector [Sierra Leone Agricultural Sector Policy and
Programs and other existing sector studies];
• Budget planning instruments that influence resource allocations and management of
expenditures in the sector;
• Role of agriculture in national development [Agenda for Change, Proposed New
Agenda for Prosperity, National Sustainable Agriculture Development Program,
Smallholder Commercialization Program);
• Sector performance [based on existing studies, for example, CAADP “stocktaking”];
• Institutional mapping in the sector including intra- and inter-sectoral coordination
mechanisms [Agricultural Sector Working Groups];
• Political economy including recent or imminent changes in government, the role of
parliament in resource allocation and oversight, the roles of CSOs and the private sector,
and any inherent policy biases;
• Role of public and private sectors in agriculture and their classification in the national
budget;
• Assessment of major expenditure trade-offs between sectors and between types of
expenditure within agriculture (e.g. subsidies).
Scale and Characteristics of the Sector Budget
3.5 The principal task of the study will be to put together a comprehensive set of
public expenditure budgets for the agriculture sector, preferably covering a period of 10
years. This will be the data set for the analysis of the budget, and identification of gaps
and inconsistencies. It will also shape the description of the budget, its particular features
and the changes that have occurred over time. When determining sectoral and total
government expenditures, a number of conventions should be followed in particular: (a)
excluding public enterprises and financial institutions except for any subsidy or capital
support payments made by government; (b) include any special funds; (c) only include in
the sector expenditure any multi-sector projects in which over 70% of expenditure falls
within agriculture; (d) for the sake of simplicity, assess expenditures on a “cash” rather
than “accrual” basis.

83
3.6 Expenditure level and trends: The elements of the sector budget will be
compiled to include all relevant ministries and other entities and include:
• Share and trend (over 10 years) of approved budgets (inclusive of any mid-year
revisions) and actual expenditures in agriculture with respect to total government
expenditure [budget documents];
• Share and trend (over 10 years) of approved budgets and actual expenditure in
agriculture with respect to agriculture GDP [budget documents, macro reports];
Share of expenditure by level of government, and when available, disaggregated
budgets at lower administrative levels; impact of changes in fiscal decentralisation
on sector budget [budget reports];
• Per capita expenditures and trends; rural-urban comparisons; comparisons with
other countries [budget documents, demographic data];
• Alignment of budgets with stated policies and priorities to include
underinvestment and mis-investment [broad judgment on underinvestment by
comparing the share of agriculture in the budget with its contribution to GDP;
mis-investment by comparing the share of agriculture in the budget with the
shares of other sectors and against indicative shares shown in the National
Development Strategy documents etc];
• A data set of off-budget expenditures by donors and NGOs should be
constructed, focusing on public good-type activities and excluding any private
sector-type support, identifying main types of expenditure and sub-sectors;
alignment with national priorities; steps to bring “on budget” [data from
interviews with DPs using a standard questionnaire on commitments and
disbursements; broad judgment on alignment];
• Private sector investment (including small farmers, traders, small- medium- and
large-scale agribusiness) and foreign direct investment (FDI) in the sector , so as
to determine leverage impact of public expenditure; judgment on extent to which
public expenditure “crowds out” private investment [existing studies, if they exist;
recorded FDI statistics; Ministry of Industry and Trade].
3.7 Expenditure composition: Broad examination of the structure of expenditures
covering:
• Capital (development) vs recurrent (revenue) budget balance; recurrent budget
items in development budget; trends (over 10 years) [budget documents];
• Composition of recurrent budget in particular wage vs non-wage, allocation to
SOEs; international comparisons [budget documents, studies];
• Comparison of expenditures on public as opposed to private goods and services;
trends (over 10 years); implicit trade-offs [definition of public and private goods
and services];
• Expenditure composition at lower administrative levels [budget reports,
studies];

84
• Alignment of policies and expenditures focusing on major expenditures or key
areas; identification of any obvious discrepancies [budget documents, national
policy and strategy documents].
3.8 Financing the budget: Identifying the main sources of financing the budget
including:
• Government Central and local government financing volume and share of total
[budget documents];
Revenue-generation sources within the sector; mechanisms for reporting and
utilization of revenue (ear-marking etc); stability of revenue collection;
Public sector borrowing generated by the sector;
Seasonal revenue generation variations and impact on expenditure patterns;
Public financing of private goods and services;
Fiscal decentralisation mechanisms in terms of revenue generation and central
government grants;
• Donors Loans and grants volume (both commitments and disbursements) and
share of total; and
Scale of off-budget financing [budget documents; may need data set generation].
3.9 Share of total expenditure financed by donors
Extent of harmonization of donors funding [donor data, donor coordination
mechanisms and code of conduct];
Trends in financing (over 10 years) [budget documents];
Extent to which expenditures form part of a programme-based approach (PBA) or
SWAp with donor funding;
Extent of public-private partnerships (PPP) identifying different types, financing
and cost recovery mechanisms, assessing their cost effectiveness and strategic
role.
3.10 Subsidies and cost recovery: Identifying the main subsidies and sources of cost
recovery, their incidence and impact including:
Levels and trends in major subsidies [budget documents];
Policies and mechanisms to manage and monitor subsidies;
Political and economic justification for subsidies [policy statements, studies];
Main areas where cost recovery is operated; level, adequacy and incidence;
Role of donors in subsidy operations.
Budget Performance
The synthetic budgets assembled and descriptive framework will be used to assess
various indicators of budget performance.

85
3.11 Flow of funds: A detailed assessment of many flow-of-funds issues will normally
necessitate undertaking a specialized Public Expenditure Tracking Survey (PETS).
However, in the case of the Sierra Leone agriculture public expenditure review, the flow
of funds will be assessed qualitatively in terms of the ways in which budget resources are
channeled to operating units within the sector and different administrative levels so as to
determine whether this constitutes a serious impediment to budget performance. The
qualitative assessment of flow of funds will include:
MFEP rules and procedures for the release of funds;
Timing of fund release through the year, related to seasonal patterns of
expenditure by different units; impact of delayed release and end-of-year effects;
Procedures for modifying budgets during the year including moving resources
from one budget line to another (virement) and its impact on overall expenditure;
Procedures for delegating budget responsibility (AIEs) to different operating units
within MAFFS;
Procedures for delegating budget responsibility to lower administrative levels and
impact of fiscal decentralisation;
Assessment of the quality of outputs and outcomes at decentralized levels vs
central level.
3.12 Public financial management: An assessment will be made of the basic public
financial management capacity in agriculture sector and its entities at various levels,
within the context of the overall status of PFM in the country. This will specifically
include:
Gap between planned budgets, approved budgets and actual budget outturn;
changes over time and reasons;
Value for money, indicators of unit costs of delivering specific services and scope
for cost-cutting measures;
Accountability of budget holders and sanctions.
3.13 Institutional arrangements: An assessment will be made of the institutional
mechanisms in place to ensure consistency between stated policies and strategies and
budgets, including:
Extent to which a results-based budget system has been implemented overall and
specifically within the agriculture sector;
MoF procedures within the budget cycle from planning, through budget
implementation, to budget management; description of the processes and
qualitative assessment of extent to which they constitute an impediment to
effective budget processes;
MoF budget preparation guidelines, effectiveness of prioritization criteria and
process of issuing budget ceilings;
Decentralized budget processes, allocation of conditional and unconditional block
grants;

86
Systems for evaluating absorptive capacity and effectiveness of outputs at sector
level;
Mechanisms for coordinating inter- and intra-agency programmes and budgets
within MAFFS;
Role of the legislature/parliament in approving budgets, reviewing performance;
forms of accountability.
3.14 Expenditure composition: The study will draw attention to areas where the
sector budget appears to be unbalanced including:
Balance between development and recurrent budgets;
Balance between wage and non-wage expenditures;
Distortions to salary and incentive structures resulting from incentive salary
payments to staff on development projects under project implementation units
(PIUs) and regular (recurrent budget) civil service pay scales;
Areas where private goods and services are being delivered with public funds,
proposing priorities for disengagement from certain services;
Identification of mismatches between national priorities and actual expenditures
at decentralized levels; reasons for the mismatches and proposals for rectifying
them.
3.15 Financing: Proposals for enhancing the financing of the sector budget will cover:
Ways of enhancing the local level financing of the sector budget;
Areas where revenue generation and cost recovery could be enhanced;
Ways of overcoming seasonal revenue generation constraints on expenditures so
as to provide greater stability and predictability in the flow of funds;
Assessment of reliance upon donor funding and specific areas where this is
excessive; assess degree of harmonization and alignment by donors and propose
ways to enhance volume, coherence and predictability of donor funding.
3.16 Budget performance: The study will identify areas of inefficiency in budget
implementation, including:
Ways of improving the budget cycle and flow of funds so as to enhance the
effectiveness of annual work plan and budget processes;
Identification of areas where public financial management is weak, such as
procurement, audit, monitoring and accountability; however, many of the issues
related to PFM are likely to be economy-wide rather than sector specific;
Institutional weaknesses in terms of intra- and inter-sectoral coordination,
decentralized budget operations and systems for oversight.
4. Sources of Data and Information
In view of time and resource constraints, official published budget-related documents will
form the primary source of data and little or no generation of original data from studies
will be possible. Wherever possible, existing special studies on the sector as well as

87
unpublished material should be used to add depth and documentation to the formal data
collected. Where such sources are used, they should be validated and fully referenced.
Focus group discussions in the key ministries (MAFFS, MFEP) will be an invaluable
source of information when formulating a sound descriptive overview of the public
expenditure budget in the agriculture sector.
4.1 Official sources of data will include:
Published budget estimates
Published reports on budget outturn
Electronic data from MAFFS and MFEP
Published reports and statistics from MAFFS and associated agencies such as the
Ministry of Industry and Trade.
4.2 Studies and “Grey” sources:
Donor reports and interviews on “off-budget” expenditures
Sub-sector project appraisal documents for more detailed information on focus
areas and expenditures
Special surveys or evaluation reports
CAADP Country Roundtable reviews and reports
Sector project evaluations (ICRs) or mid-term reviews
4.3 Sources for sector outputs and outcomes:
MAFFS studies and reports
Project appraisal documents, mid-term reviews, ICRs
Focus group discussions with project managers and teams
Donor evaluation reports
Beneficiary impact assessments
5. Process
The main stages in the study process will include:
5.1 Stakeholder briefing: All key stakeholders must be briefed on the purpose and
proposed outputs of the study and agree on the main milestones and the timeline.
Agreement should also be reached upon the definition of agriculture to be adopted and
the institutional scope of the study.
5.2 Inception workshop: A formal workshop for all key stakeholders should be
scheduled within two weeks of the commencement of the study to present and discuss an
Inception Report that includes:
the revised terms of reference for the study
queries and outstanding issues with respect to the study
agreed milestones and timeline for implementation
designation of counterpart staff

88
definition of the institutional scope for the study
The workshop should solicit the support of government officials in facilitating access to
published and electronic expenditure data including items outside the regular MAFFS
budget, and from DPs to provide details of their off-budget programmes.
5.3 Technical workshop: Within one month, a technical workshop should be
scheduled to:
Present the framework for the formulation of the synthetic set of sector
expenditures
Discuss the descriptive overview of public expenditure in the sector, agree
priority focus areas and identify key issues, and
Discuss and schedule the technical working papers that should be prepared
5.4 Draft report workshop: A formal workshop should be scheduled after five
months to discuss the key conclusions and recommendations of the study presented in a
draft report.
6. Timeline
6.1 The proposed timeline for the agricultural public expenditure review is 2-3
months. The study is expected to be completed within the period of the overall ASR,
which is 4-5 months. The entire study will be undertaken in three phases, starting with
the planning and inception phase, the detailed diagnostic studies phase and the final
drafting phase. In all the phases, the international and national consultants will work
closely and report their progress to the MAFFS Coordination team, including the DPs.
7. Consultant Qualifications 7.1 The agricultural public expenditure review will be conducted by a consultant team
comprising a national and non-national expert with at least a Masters Degree in
Economics/Agricultural Economics, with no less than 10 years undertaking consultancy
in agricultural sector analysis and expenditure reviews, preferably with demonstrable
experience working with Sub-Saharan African countries. Extensive analytical and writing
skills are a must. Both experts will work closely with at least one or a team of counterpart
from the budget unit of MAFFS/MFEP.
8.0 COORDINATION OF THE STUDY
The agricultural public expenditure review as well as the overall ASR will be
coordinated by the Ministry of Agriculture, Forestry and Food Security (MAFFS).
Correspondence should be addressed to the following:
Mr. Prince Kamara
SCP National Coordinator
Ministry of Agriculture, Forestry and Food Security
Youyi Building, Brookfields, Freetown
Tel: +232 76 657 660
Email: Prince Kamara [email protected]

89
Annex 2: Tors And Composition Of The Technical Working Group And Of The
Steering Committee

90
Annex 3: MAFFS organogram

91
Annex 4: Ministry of Land and Country Planning organogram

92
Annex 5: Data collection strategy
TYPE OF
EXPENDITURE
DATA / INFORMATION NEEDED
LIKELY SOURCE OF INFORMATION
DATA COLLECTION STEPS / STRATEGY
ON BUDGET
GoSL planned and executed expenditures at Central Level
All budgets as voted, allocated, revised and executed, from 2003 to 2012 (disaggregated, electronic versions)
Chief Accountant offices of all involved Ministries (All Ministries /institutions/Agencies having activities within the scope of the Agriculture Sector.) + MOFED / BUDGET BUREAU
One to one meetings between consultants and concerned officers. Regular reporting to working group on progresses and difficulties. If all information is not available in electronic format, we may hire “data “ persons.
Note 1 : SOE (information needs to be collected but only the net flow with public budgets will be accounted for)
Ministries Accountant Office, SOEs accountants,
One to one meetings with SOEs / MDAs accountants
Note 2 : information on resources mobilized/ generated directly by Ministries/ technical agencies need to be clarified (ex : delivery of services on a fee recovery basis, taxes, etc.)
MDAs, Accountant office
One to one meetings with SOEs / MDAs accountants
GoSL planned and executed expenditures at Local Level
All budgets as voted, allocated, revised and executed, from 2003 to 2012 for Agriculture services (disaggregated, electronic versions)
MOFED. Local Govt Finance Department. District councils Chief Administrators.
One to one meetings between consultants and concerned officers. Regular reporting to working group on progresses and difficulties. + on a sample of 2 to 3 rural districts :

93
qualitative assessment (field based work)
Government institutions extrabudgetary funds : such as Forestry or fisheries Fund, Road funds. They can be financed through own self generated revenues by an act of law or an executive branch decision.
All budgets as voted, allocated, revised and executed, from 2003 to 2012
Fund Administration + MDAs exercising a tutelary over these funds (Ex : SLRA, Ministry of Works)
One to one meetings between consultants and concerned officers. Cross-check information through meetings with donors in case some of these funds manage donor funding. Regular reporting to working group on progresses and difficulties.
Partially ON BUDGET
Donor funded projects. (Projects expenditures are reported but not executed through the IFMIS system) For multi-sectoral projects , data collected only if more than 70% of the budget is/was spent on agriculture.
All project documents, including financial agreement. + annual / final completion reports including expenditures data (electronic version, disaggregated) over the last 10 years. + project evaluation report when available
MOFED / Multilateral project division. MAFFS / MDAs, projects bureau. PIUs Donors
STEP 1 : establish a first list of all agriculture projects (based on MDAs records) STEP 2 : assess comprehensiveness with donors STEP 3 : collect data information (MDAs, PIUs, Donors)
OFF BUDGET
NGO projects : all agriculture projects
Project document, project completion/interi
MAFFS / MDAs NGO Desk (do other ministries have NGO desks ?)
Step 1 : consultant + technical staff will be mobilized

94
implemented during the last 10 years in SL.
m report, including reports on budget execution + project evaluation report when available.
+ NGOs to collect a list of projects implemented during past 3 years and consolidate information available at MAFFS NGO desk level Step 2 : quality and comprehensiveness of the information will be assessed Step 3 : Direct consultations with NGOs will allow collection of missing information
Donor funded project. Technical / UN agencies implemented projects (ex : regional research projects)
Project document, project completion report, including reports on budget execution + project evaluation report when available
Technical Agencies, donors, GoSL (for MOUs)
- collect information from resources persons / MOUs / internet on list of projects and institutions leading the execution of these projects - look for interim / completion reports on internet / in Sierra Leone - contact by email / phone to ask for additional information
Other types of information
Annual reports (2003-2012), Stats, Agriculture Sector Reviews, PERs, PEFAs, PETS, …
MDAs, Development partners, Statistics Sierra Leone,

95
Annex 6: Level of expenditure in comparison to Maputo Targets (in Billion Leones)
2003 2004 2005 2006 2007 2008 2009 2010 2011 2012 Total
Agricultural (COFOG)
expenditure
MAFFS 0 16,899 23,232 22,499 15,959 25,791 24,214 25,607 31,625 38,050 223,875
Other (COFOG) ministries and entities 0 1,804 2,096 2,063 707 2,501 12,519 4,951 14,002 21,829 62,472
Tranfers to District Councils
945 3,346 5,876 12,974 12,364 13,940 49,446
Donor funded expenditure 6,419 24,071 21,229 39,451 47,852 111,301 174,414 147,077 161,801 201,269 934,883
Total COFOG-agricultural expenditure 6,419 42,774 46,556 64,012 65,464 142,939 217,023 190,610 219,791 275,088 1,270,676
Total GoSL expenditur
e
Central Level spending 598,000 668,100 828,300 915,500 568,794 800,168 976,068 1,433,482 1,541,440 2,106,066 10,435,918
Transfers to Districts Councils
8,248 24,143 27,187 54,801 53,532 63,055 230,966
Donor Funding expenditure 32,269 352,935 690,834 535,087 874,580 708,885 1,408,390 1,880,950 1,390,659 1,871,453 9,746,042
Total GoSL expenditure 630,269 1,021,035 1,519,134 1,450,587 1,451,622 1,533,196 2,411,645 3,369,233 2,985,631 4,040,574 20,412,926
Share of agricultural in total 1.02% 4.19% 3.06% 4.41% 4.51% 9.32% 9.00% 5.66% 7.36% 6.81% 6.22%
Source: Authors’ calculations based on data provided by: MoFED and GoSL official budget publications.

96
Annex 7: functional classification used by MAFFS under the MAFSAN project
Agricultural development (Subsector)
Livestock
Food crop production
Industrial crops/export crops
Integrated agriculture projects
Farm development
Small livestock and poultry projects
Agricultural development, activity unspecified
Agriculture infrastructure
Agricultural education/training (Subsector)
District extension services
Agricultural extension
Radio, tv, electronic extension messages
Formal education/training, Agriculture
Agricultural inputs (Subsector)
Supply of fertilizers
Agricultural machinery/equipment
Supply of seeds
Agricultural inputs, activity unspecified
Agricultural land resources (Subsector)
Agricultural land resources, activity unspecified
Drainage, Agriculture
Agricultural policy and administrative management (Subsector)
Agricultural policy and administrative management, activity unspecified
Institution capacity building, Agriculture
Agricultural sector policy, planning and programmes
Aid to agricultural ministries
Agricultural research (Subsector)
All plant research activities
Agricultural research, activity unspecified
Agricultural services, purpose (Subsector)
Agricultural co-operatives
Agricultural financial services
Agricultural services
Plant and post-harvest protection and pest control
Livestock/veterinary services
Agricultural water resources (Subsector)
Irrigation
Food aid/Food security programmes (Subsector)
Food supply
Fishery development (Subsector)
Fisheries
Fishing policy and administrative management (Subsector)
Institution capacity building, Fishing
Forestry development (Subsector)
Afforestation and reforestation
Fuelwood/charcoal