Embed Size (px)
Citation preview

Efficient sidechannel testing for public key algorithms: RSA case study Josh Jaffe and Pankaj Rohatgi, Cryptography Research Inc Marc Witteman, Riscure Keywords: RSA, side‐channel testing, cluster analysis, t‐test
1. Abstract This paper proposes an approach to validate that implementations of public‐key cryptography have
moderate resistance to side‐channel analysis, using RSA‐CRT as an example. The design goal of the proposed approach is to develop tests that are technically sound and repeatable, while at the same time being efficient and cost‐effective for testing labs. The approach was validated on two devices, one without countermeasures and another with some DPA countermeasures. Effective test results were obtained for each of these devices with less than 24 hours of effort, including 18 hours of automated data collection and less than 6 hours of semi‐automated testing. In addition, we propose applying the techniques of clustering and cross‐correlation, and an additional day of testing for detecting an important class of vulnerabilities not covered by the tests above.
2. Introduction Public key cryptography is commonly used for key agreement, encryption/decryption, and digital
signatures. For these applications, the private key operation may be subject to side‐channel attacks that can reveal the key.
In [1], we proposed a general approach to side‐channel validation based on testing for statistically significant leakage of sensitive information in the side‐channel, using AES as an example. In this paper, we extend the approach to cover public key algorithms, specifically RSA‐CRT. The vendor requirements for documentation and providing a test device and fixture remain the same, as do the requirements for testers to validate the documentation and collect side‐channel samples using a pre‐specified set of test vectors. Two salient features of [1] compared to other testing approaches are:
1. Using a pre‐specified set of test‐vectors, carefully chosen by experts to expose and isolate potential leakages;
2. Applying a simple statistical test (Welch’s t‐test) to multiple, pre‐specified data sets in order to detect sensitive information leakage in the side‐channel, rather than performing a battery of side‐channel attacks to recover the key
For AES, the testing approach outlined in [1] could be performed using 3 hours of data collection and 3 hours of analysis. When applying the approach to a public key algorithm such as RSA‐CRT, one has to adjust for the much lower operation speed and larger trace lengths, both of which can significantly reduce the data collection rate. Also, given the larger variation in the possible implementation choices for RSA, the set of test vectors will be larger. Therefore, to collect sufficient traces and test‐vectors, we specify a longer data collect, e.g., our proposal for RSA requires 18 hours of automated data collection. Also, due to the larger amount of data, the total analysis time is targeted to be 6 hours.

In Section 3, we specify a set of test vectors and tests suitable for validating the side‐channel resistance of 1024‐bit RSA‐CRT private key operations. These test vectors range from those targeting very specific weaknesses that could occur for certain implementation choices, to very general tests that detect any influence of key or key and data‐dependent intermediates in the side‐channel and thus are able to pick a very broad set of leakages.
In Section 4, we describe our experimental results in applying our test vectors and tests on two representative smart‐card implementations of RSA. One smart‐card implementation did not have protections against side‐channel analysis. The second implementation used an SPA‐resistant modular exponentiation engine, with data blinding (but no exponent or modulus blinding) and has been used with another software library to achieve high levels of DPA resistance under CC (EAL 5+). In both cases, the total (automated) data collection was under 18 hours, and the analysis effort took under 6 hours. It would have been possible to fail the first device in a matter of a few hours. As expected, the first device failed a large number of tests. The second device also failed one of our specified tests due to the lack of modulus blinding. Surprisingly, we also uncovered another problem with the modular exponentiation engine ‐ processing the value of ‘0’, since it cannot be blinded. Testing with un‐blinded inputs showed that all other small ciphertexts (such as 1, 2 and 3) showed similarly distinctive SPA leakages—revealing the critical role that message blinding plays in the security of this implementation. If this had happened in a real test situation, we expect the operator to have rejected the device and the vendor fix the software library to incorporate message and modulus blinding and also intercept any requests to perform the private key operation with 0.
In designing the tests above, we noted that the exponent blinding countermeasure—or infrequent alignments by a tester—can often mask SPA or cross‐correlation [4] type vulnerabilities from univariate statistical tests. We chose not to use the carefully‐crafted test‐vector approach to address this specific class of RSA vulnerabilities because, while carefully chosen primes and/or specifying alignment rules could resolve this issue, we believe that the signal processing techniques of clustering and cross‐correlation, together with the t‐test, would be more general way to detect such vulnerabilities. These techniques and tests, that only add one additional day of testing, are described in Sections 5 and 6.
We believe that our proposal strikes the right balance between ease and efficiency of testing, and the effectiveness of the tests to uncover side‐channel vulnerabilities. While the 2‐day timeframe for our tests may seem less rigorous than other evaluation approaches, our experience has been that the results are quite comparable. This is because, even though the set of tests‐vectors may seem limited, many of the tests apply the extremely rigorous criterion of “indistinguishability from random”, that has been used with great success in the design and analysis of block ciphers, hash functions and other cryptographic primitives.
3. RSA: Sample Test Vectors and Tests for 1024bit RSACRT
A set of test vectors was generated for testing RSA implementations with the Chinese Remainder Theorem (RSA‐CRT) and 1024‐bit public modulus. Each test vector includes the parameters ciphertext C,

prime P, prime Q, exponent Dp, and exponent Dq: ( C, P, Q, Dp, Dq ). The values of Dp and Dq are derived parameters, corresponding to the primes P and Q and the public exponent e = 65537.
The test vectors were divided into five categories, as described in Table 1. Test vectors are provided in a list, and side‐channel signal collection from vectors from the various sets should be interleaved to avoid systematic biases due to time, temperature, etc. The testing approach is identical to that presented in [1]. Traces from Sets 2,..,5 are compared to traces in Set 1 using the Welch’s t‐test. Each t‐test is repeated twice with independent test vector subsets (subset A and subset B). A test fails if there is a point in time where the t‐value for both subset A and subset B exceeds +4.5 or ‐4.5. The table also summarizes our rationale for selecting these specific sets and categories.
We expect that a tester should be able to collect side‐channel traces corresponding to these test vectors in around 18 hours.
Set number
Test vector properties Rationale for this test. Note the tests are numbered as follows: Text X is the test that compares traces in set X to traces in set 1.
Set 1 Constant Key, Constant Ciphertext
(Baseline. Key and Ciphertext are fairly random.)
Set 2 Constant Key, Varying Ciphertexts
The goal of this test is to highlight any systematic relationship between power consumption and ciphertext data. Common SPA and DPA leaks may appear in RSA‐CRT during:
• Initial reduction • Montgomery conversion • Squares and Multiplications • Intermediate reductions • Recombination steps of CRT
Set 3 Varying Keys, Constant Ciphertext
The goal of this test is to highlight any systematic relationship between power consumption and secret key data. Common SPA and DPA leaks may appear in RSA‐CRT during:
• Modular exponentiation steps (loop structure / dp, dq ) • Calculation of parameters such as (21024 / p ), (1/p mod q)
etc • CRT stages such as the multiplication by P (non‐modular).
Set 4 Constant Key, Ciphertexts from a set of “special values”
The goal of this test is to expose the DEVICE to any special values that are known to trigger exceptional power consumption in certain implementations. The set of “special values” may be expanded, but currently includes values with one or more of the following properties:
• 0 • Small number (1, 2, 3) • Small negative (n‐1, n‐2, n‐3) • Numbers that generate special intermediates during Barrett
reduction

• Number whose Montgomery representation is special • Number whose square or other power has special
Montgomery representation (The specific special values used in the example are described in the table 2.)
Set 5 Constant Key, Ciphertext Corresponding to small message
This test produces decryption outputs that are 32‐bit numbers. In CRT implementations, the exponentiation result mod P equals the exponentiation result mod Q for these values, a situation that can lead to a multiplication by zero during the CRT step. This test may reveal SPA and timing leaks in the CRT step, as well as leaks in the SPA signal shape during the last multiplication and reduction op in each modexp. NOTE: the input values in set 5 are all full sized for e=65537, so implementations that resist decrypting values ‘0’ and ‘1’ or other small ciphertexts cannot so easily resist decrypting values that correspond to small messages. Table 1: RSA Test Vectors and rationale
Set 4 includes vectors chosen to generate exceptional intermediates for a variety of RSA‐CRT algorithms and implementation choices. Table 2 describes the various categories (or “special values”) of test vectors in Set 4 that were used in Section 4 for evaluating two real devices. Note that Set 4 can be expanded to include special values for other implementations. We expect the test operator to be skilled enough to collect only the categories that apply to the specific implementation being tested.
category number
Ciphertext value (or property)
00 0 01 1 02 2 03 3 04 n‐1. (C is congruent to ‐1 modulo N, modulo P, and modulo Q) 05 n‐2. (C is congruent to ‐2 modulo N, modulo P, and modulo Q) 06 n‐3. (C is congruent to ‐3 modulo N, modulo P, and modulo Q) 07 · 2 . (In Barrett reduction of C, an intermediate is zero.)
08 2 1 . (In Barrett reduction of C, an intermediate has high hamming weight.)
09 2 . (In Barrett reduction of C, an intermediate is small and low hamming weight).
10 2 mod . (Number whose Montgomery representation is 1 mod P) 11 2 mod . Number whose square has the Montgomery representation 1. 12 2 mod . Number whose Montgomery representation is 1 modulo N.

13 Number whose Montgomery representation is 2 mod P 14 Number whose Montgomery representation is 3 mod P 15 Number whose Montgomery representation is 2511 – 1 mod P 16 Number whose square’s Montgomery representation is 2511 ‐ 1 mod P 17 Number whose cube’s Montgomery representation is small modulo P 18 Number whose Montgomery representation is 2 mod Q 19 Number whose Montgomery representation is 3 mod Q 20 Number whose Montgomery representation is 2511 – 1 mod Q 21 Number whose square’s Montgomery representation is 2511 – 1 mod Q 22 Number whose cube’s Montgomery representation is small mod Q 23 Number whose Montgomery representation is 2 mod N 24 Number whose Montgomery representation is 3 mod N 25 Number whose Montgomery representation modulo N is near 21023 – 1. 26 Number whose square’s Montgomery representation modulo N is near 21023 – 1. 27 Number whose cube’s Montgomery representation modulo N is small
Table 2: Description of categories for Set 4
The key concept here is that the sets of test vectors have been selected with of goal of triggering various possible implementation leaks.
In some cases, the test vectors have been chosen to cover broad categories of leakage. The test vectors of Set 2 may reveal systematic power variations due to the fact that the ciphertext values are changing. Set 3 may reveal variations due to the different key values being processed. A high‐amplitude spike in the T‐test reveals a significant statistical relationship between the power consumption (the state of the device) and the values being processed ‐‐ which is to say, the t‐test has revealed a leak. In contrast to single‐bit DPA testing and to CPA testing, the tests here do not depend on a particular leakage model. Therefore they may not reveal as much about the nature of the leaks present or of the device states that cause them. The T‐test approach is consequently less useful for building an attack against the device; the benefit of this trade‐off is that it can resolve leaks without having to know or guess the nature of the leak in advance.
In other cases, test vectors are chosen in an attempt to trigger specific, potentially high‐amplitude leaks. The special values in Set 4 were chosen based on previous experience performing SPA analysis. Exceptional processing for any special value in set 4 may be revealed by a significant change in the power consumption for that set. The values chosen for set 5 will reveal many types of SPA and DPA‐exploitable variations in the handling of the CRT step. A failure for either one of these tests does suggest a line of attack.
4. Experimental Results
We applied our approach to two different smart‐card implementations of RSA. Working from API documents for each card, it took between 20 minutes and 1 hour to define the appropriate automated scripts for data collection on the DPA Workstation. (Testing and script debugging took another hour or so.) This met our goal of creating a process that is extremely easy to execute and evaluate. We aimed

to have the data collection complete in an overnight run, and to have the analysis of the results complete by the end of the day following the data collection.
The effort was significantly less than we have applied to any similar device in past evaluations. We found that —as the following sections will show – this simple test process was able to demonstrate significant side channel leakages and highlight several vulnerabilities in each target device.
DEVICE 1
DEVICE 1 was a smart‐card which had an implementation of RSA that was not protected against side‐channel attacks. A 1024‐bit RSA‐CRT operation takes just over 300 ms on this card. Data was collected from this card overnight, and measurement traces were recorded for more than 16600 test vectors. The traces were data was aligned at 3 locations, corresponding to start of operation, the beginning of the CRT step and the end of the CRT step. Measurements were collected using a Tektronics DPO7104 sampling at 500Ms/s with 20MHz bandwidth limiting and using a 50MB buffer.
For DEVICE 1, the sets we used for the tests above contained the following numbers of traces:
Data Set 1 2 3 4 5 Number of Traces 3322 3312 3401 3357 3384
The following table summarizes the test results for DEVICE 1. It is clear that the device failed multiple tests by significant margins. In an actual test setup, the data collection and testing could have begun concurrently and a lab would have been able to fail the device in just a couple of hours of data collection.
Test Category Maximum t‐statistic result Location / Notes Test 2 28 Strong leak during initial reductions;
SPA leak at “mp – mq” step. (27.6) Test 3 55 During modexp due to SQ/MU difference;
strong leak during initial reductions (27.8); strong leak during calculation of P inv Q (28.4+)
Test 4 42 Various mults during modexp; SPA leak at “mp – mq” step. (32+)
Test 5 294 In CRT step, let T = ( mp – mq ) mod Q, U = T * pinvq mod Q, and V = U * P. Massive leak occurs in set 5 during multiplications by parameters T and U. (Note that T and U are zero.)
Table 3: Summary of test results for DEVICE 1
Additionally, some of the T‐test result vectors show sustained signals that exceeded high thresholds over long sequences of samples. In one case the result exceeded the threshold for significant stretch of

time. This suggests that if further signal processing had been applied (such as compressing the traces by a factor of one thousand), the T‐test result may have exceeded a large number or have been evident from an analysis of many fewer traces.
While the objective results from Table 3 would be sufficient for a lab to fail the device, we examine these test results in greater detail from the perspective of a test‐vector designer.
Observations for DEVICE 1 Figure 1 shows a T‐test result for DEVICE 1 Test 3. The top trace shows average power consumption over Set 1 – the data set with constant key, constant ciphertext. The region between green cursors includes C reduced mod P, C reduced mod Q, and 1024 divided by P. (Evidently the device uses very similar routines for these reduction and division operations; each one takes about 1/3 of the time in the region between the cursors.) The region to the right of both green cursors shows the start of the modular exponentiation. The T test result trace for Test 3 subset A is shown on the bottom. Many spikes exceeding +/‐ 20 are evident during reductions and modexp—and some spikes also appear to occur during the parameter loads, prior to the reductions.
Figure 1: DEVICE 1 fails t‐test during modular reduction and exponentiation in test 3. Alignment at the beginning of the RSA‐CRT operation (initial reductions and start of modexp loop).
Figure 2 shows a detail of the result for T‐test 3, comparing the result of the test in subset A to the test result over subset B. The traces are very similar, and there are many locations where the results simultaneously exceed ±20.
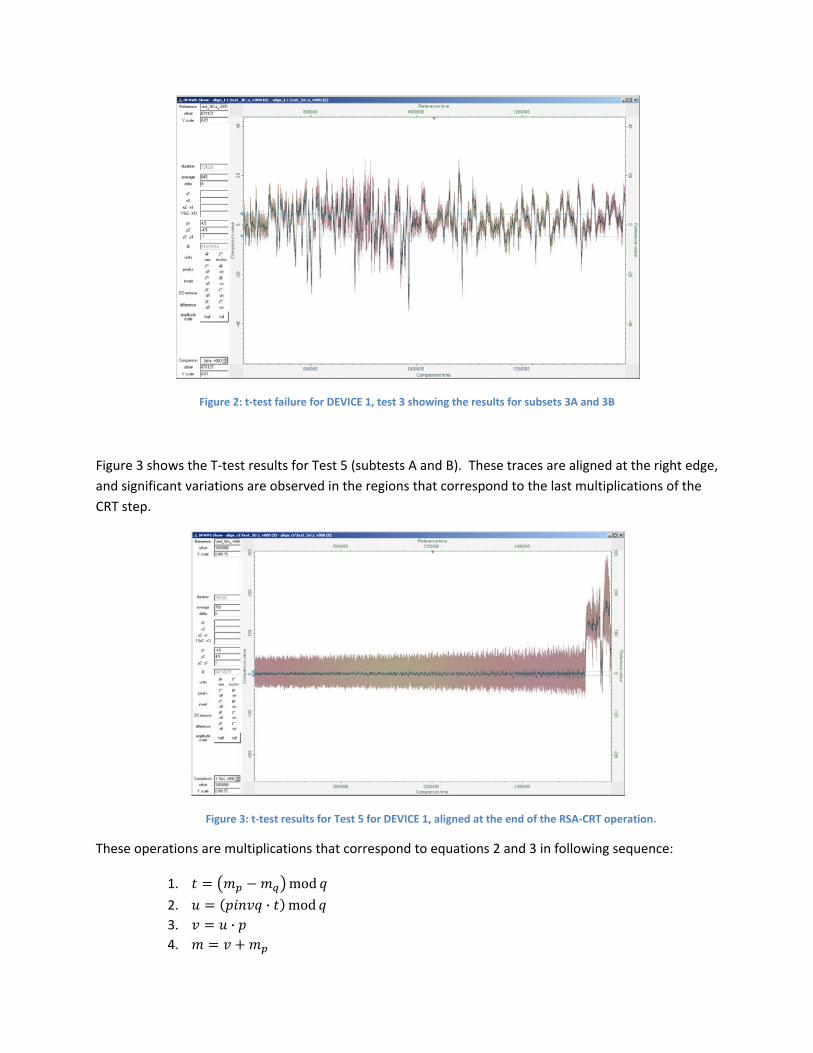
Figure 2: t‐test failure for DEVICE 1, test 3 showing the results for subsets 3A and 3B
Figure 3 shows the T‐test results for Test 5 (subtests A and B). These traces are aligned at the right edge, and significant variations are observed in the regions that correspond to the last multiplications of the CRT step.
Figure 3: t‐test results for Test 5 for DEVICE 1, aligned at the end of the RSA‐CRT operation.
These operations are multiplications that correspond to equations 2 and 3 in following sequence:
1. mod
2. · mod 3. · 4.

When M is small, the value t is zero, and equations 2 and 3 both result in multiplications by zero. In the T‐test 5 for DEVICE 1, the results are almost off the charts. In some cases the result exceeds 250. There are sequences longer than 10000 samples where the test result exceeds 80 in the two independent subtests.
Figure 4 shows results from Test 5, aligned at the start of the CRT step. The top trace shows the power consumption (averaged over set 1—const key / const ciphertext ) and the bottom trace shows the t‐statistic. The green cursor is aligned with the end of the last multiplication in the exponentiation modulo Q. This is also the point where mp – mq is computed, and then where the device computes the inverse of P modulo Q. The somewhat square‐shaped spikes that appear first to the right of the green cursor show a significant SPA leak in the “mp – mq” calculation. Subsequent spikes to the right are due to additional SPA leaks (and timing variations) during the calculation of P inverse mod Q. The amplitude of these spikes decreases to the right as the traces drift out of synchronization. Spikes to the left of the green cursor appear smaller, but are still significant. These are due to DPA leaks during the various squares and multiplication operations.
Figure 4: DEVICE 1, results from TEST 5, aligned at the beginning of the CRT.
DEVICE 2
DEVICE 2 was a smart‐card that implemented a core modular exponentiation operation that, in conjunction with a specific vendor software library, had been evaluated to EAL 5+. We used this card in a mode where this core modular exponentiation was combined with external data blinding countermeasures [2], but the exponent and modulus were not blinded. Data was collected from this

card overnight, and more than 12000 traces were recorded. The traces were aligned at 2 locations, corresponding to start of the CRT step (the end of the second exponentiation), and to the pause between exponentiation halves. The alignment and analysis stages of the testing were performed in less than 6 hours.
For DEVICE 2, the sets we used for the tests above contained the following numbers of traces:
Data Set 1 2 3 4 5 Number of Traces 2613 2638 2551 2458 2576
Table 4 summarizes the test results for DEVICE 2.
Test Category Maximum t‐statistic result Location / Notes Test 2 2.6 Pass Test 3 36 Fail
Key‐dependant timing during CRT step. Key‐dependant spikes between CRT halves (possibly from modular reduction) (27+) Length of modexp is key dependant. [may not be a risk, but this causes an observed 11.6+ significance spike at start of computation in tail‐aligned data.]
Test 4 6.8 Fail Spikes observed during mults; probably due to message 00 which can't be masked. This device has a large timing leak for the value 0. The leak is also present for any small input (unmasked). Leak shows up primarily in timing; this translates into power amplitude (spikes) when a square‐wave shape gets shifted.
Test 5 2.6 Pass (in masked data set) Table 4: Summary of test results for DEVICE 2
Observations for DEVICE 2 Figure 5 shows the results of Test 2 at the end of the computation. The final multiplications of the exponentiation modulo Q are visible at the left of the top trace. Spikes corresponding to various multiplications in the CRT step are visible to the right. The bottom trace shows the T test result for subset A. Only a couple of spikes reach +4.5, and these are not present in the subset B test result.

Figure 5: DEVICE Test 2 passes. The top trace shows the average power consumption over Set 1. The bottom shows test 2 result for one subset.
Figure 6 shows the DEVICE2 results for test 3 subtests A and B over this same region. The device fails, with many spikes observed to exceed ±30. This is not surprising since the CRT step involves the use of the secret primes and without modulus/prime blinding information about the values of the primes could leak. This is an instance where the leakage is clear to the knowledgeable tester and the Derived Test Requirements (DTR) document could specify whether this leakage is acceptable for a particular security level or prescribe a set of further tests specifically to assess the level of leakage (e.g., test that target specific bits of the secret primes) in order to decide pass/fail.
Figure 6: DEVICE 2 fails Test 3 during CRT
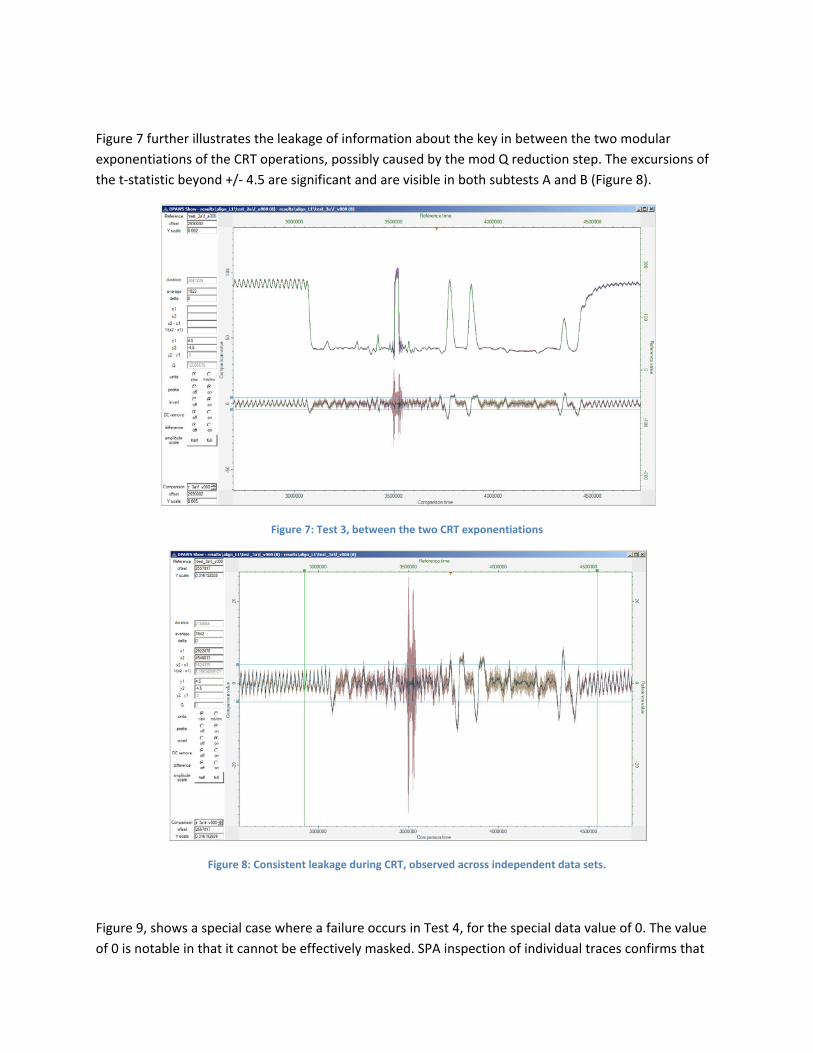
Figure 7 further illustrates the leakage of information about the key in between the two modular exponentiations of the CRT operations, possibly caused by the mod Q reduction step. The excursions of the t‐statistic beyond +/‐ 4.5 are significant and are visible in both subtests A and B (Figure 8).
Figure 7: Test 3, between the two CRT exponentiations
Figure 8: Consistent leakage during CRT, observed across independent data sets.
Figure 9, shows a special case where a failure occurs in Test 4, for the special data value of 0. The value of 0 is notable in that it cannot be effectively masked. SPA inspection of individual traces confirms that

modexp is significantly faster (mult timing significantly shorter) for C = 0. This test failure highlights a corner case problem with the core modular exponentiation engine and therefore needs to be corrected at the software library level. Separate experimentation also revealed that such corner cases also occur for other small values of the base, but are unlikely to triggered when data masking is used.
Figure 9: DEVICE 2 fails Test 4 on special data value of 0
5. Signal alignment and testing for SPA leakages
Performing the tests described earlier to detect leakages presents two challenges – signal misalignment and detecting SPA leaks in masked implementations.
Signal Misalignment Unlike secret key algorithms, the private key operations tend to be much longer and just having a good trigger for start and end of operation as required by [1] can still result in significant misalignment during the operation’s internals. These timing variations can be due to clock drift, but may also be due to intrinsic timing variation in the operations being performed. In some devices, randomizing operation timings may even be deliberately introduced as a DPA countermeasure [2].
One way to deal with misalignment that requires no additional operator skill comes at the expense of additional data collection ‐ perform testing with a much larger data set that can overcome this effect of misalignment. However, a better approach is to require test operators to have the skill to perform standard least‐squares based alignment and not increase the data collect time. The DTR could specify how the traces need to be re‐aligned using standard least squares based alignment techniques. For example, the DTR may specify that alignment be performed every 100 modular square/multiply operations. The t‐tests can then be performed on the aligned sections of the traces. By adjusting the

confidencthe differe
When chois being pmodular oThe reverfrequent adata depedeal with
SPA leakThe tests protectedworth takexpertise countermtesting prexponentfrom multpower tra
having lowfollowed followed
ce threshold, ent alignmen
oosing the nuerformed at foperations worse is true if thalignment, buendent timingmisalignmen
ks in maskeddescribed thud implementaking a momenis important
measures that rocess. Specifiation using ttiplies. Figureace from such
wer amplitudby another sqby a multiply
Figure 10Figure 11
Figure
Figure 11
it may also bnts.
umber of alignfrequent inteould be easiehe alignment ut also requirg leaks also gent in a compre
d implemenus far, can quations in a semnt to considerwhen testingmight be easically, for RSAthe left‐to‐rige 10 shows psh a device, wit
e than the mquare, the firsby then this
0: Square multip1
e 10: Modular ex
1: Square/multip
e possible to
nment pointservals, slight der to isolate, his performedre a t‐test (or et identified.ehensive way
tations uickly identifymi‐automatedr the risk of tag in the presesy for a humaA, consider thht binary algoseudo‐code foth squares an
ultiply. The est square musquare‐multi
ply sequence
xponentiation a
ply sequence
perform the
, one must codata dependehowever, datad less frequenf‐test) to be In Section 6 w
y.
y significant led way, withouaking operatonce of noise an to observe he case of a deorithm, and wor this modulnd multiplies
exponent bits st correspondply sequence
algorithm
t‐tests across
onsider the foent amplitudea dependent ntly. One possperformed onwe will descr
eakages in unut significant or expertise oand countermadapt arounevice that pewhere squarear exponentihave differen
decoded by d to a 0 expone corresponds
s the entire tr
ollowing tradee differences dtiming leaks sibility is to spn the alignmeibe another a
protected anoperator exp
out of the evameasures. Pad might easilyrforms modus can easily bation loop. Fnt signal ampl
noting that ifnent bit and is to a expone
races across a
eoff: If alignmduring the can get missepecify more ent offsets, soapproach that
nd several pertise. Yet it luation. Humartially‐effectiy pass a scripular be differentiatFigure 11 sholitudes, the sq
f a square is if a square is nt bit of 1,
all
ment
ed.
o that t can
is man ive pted
ted ows a quare

working left‐to‐right. With this type of SPA leak, the entire exponent can be decoded from a single trace‐‐and this completely compromises the RSA key.
However if the exponent masking countermeasure [2] is used with this implementation, i.e., if the secret
exponent dp is replaced by dp + k* φ(n) for a random (32/64 ‐bit) k for each invocation, the t‐tests from
Section 3 will not be able to detect this basic SPA leakage that is sufficient to recover dp + k* φ(n) from a single trace that is sufficient to break the RSA implementation.
There are three approaches to address the issue of isolating SPA/HODPA leaks when parameters are being randomized:
1. Debug output ("software scan"): This approach would require a masked implementation to make the relevant masks available for the test operator to record. The advantage of this approach is that the analyst can gain access to the actual exponent value and other intermediates used in the computation. This enables standard "known intermediate" tests for leakage to be performed. On the other hand, this "debug" information required for the evaluation version poses a serious security risk if left in the final product, and introduces complexity into the development process
2. t‐tests with very carefully selected vectors: In some cases the t‐test approach of Section 3 can be adapted to test for SPA leaks in the presence of countermeasures. Test vectors can be identified that partially neutralize the masking countermeasure and allow the T‐test to resolve any underlying SPA leaks. In the example above, if typically small values k are used, the primes
can be chosen such that k* φ(n) would have a large number of consecutive 0 bits for any k, rendering the masking ineffective in that region. The advantage of this approach is that all of the analysis difficulty is pushed back onto the process of choosing test vectors, however this approach may not be feasible for arbitrary masking approaches.
3. tests that directly target specific SPA leaks: The most fundamental approach to DPA testing in the presence of countermeasures remains to implement specific SPA tests that target the leak. The clustering and cross‐correlation techniques described in Section 6, can directly target these leaks. In addition these techniques can also capture higher order leaks that may be present in the design.
6. Clustering and crosscorrelation based techniques for side channel evaluation of RSA implementations
Section 5 identified the need for simple and efficient techniques that can directly identify and target the core operations of RSA and other public key algorithms, to help with alignment, detecting SPA leaks in the presence of masking and performing tests for higher order vulnerabilities. In this section, we outline some basic clustering and cross‐correlation tools that can greatly simplify the process of isolating these core operations and then propose simple, illustrative tests that use these tools to detect leakages that can be missed by tests in Section 3. We expect these tests can be executed in a single day, with

minimal involvement of a test operator, if proper test tools are available. First we describe the tools and methods, and then we introduce the tests.
Tools and methods
Segmentation Asymmetric cryptography repeatedly uses elementary operations. For RSA these are modular square and multiply operations. Since the key may be derived from the order of operations it is important for the evaluation to distinguish these operations. As traces can be noisy it may be difficult to recognize these operations visually. A good method to identify a repeating operation is called auto‐correlation.
Figure 12: Power trace of an RSA implementation
Figure 2 shows a noisy RSA power trace for which the repetition period of operation is not clear. By computing an auto‐correlation trace the period becomes evident. In Figure 13 it is shown that for this example the period is about 140 samples.
Figure 13: Auto‐correlation of RSA power trace
Once the periodicity of operations is known the analyst needs to find out where operations start. First an operation pattern must be reconstructed. This can be done by averaging multiple operations. Typically, modular operations can be recognized by their increased power consumption. The big number computations cause many simultaneous bit switches, requiring more energy. When a number of averaged patterns are available, as in Figure 14, it can be easy to identify the start and end of an operation by identifying the dips in between them.

Figure 14: Averaged modular operations
There may be a variable distance between operations. This can be caused by an SPA leak, but also by an instable clock or deliberately inserted delays. SPA leaks can be tested by statistical analysis of the variable distance between operations as mentioned in Section 5. With noisy signals the start of operations can still be found by correlating a reference pattern to a trace. The start of each operation can is then indicated by correlation peaks, as show in Figure 15.
Figure 15: Pattern correlation to reveal operation offsets
When the start and length of each modular operation is known, their corresponding trace segments can be cut out and used for further analysis.
Cross correlation and cluster analysis With cross correlation a set of vectors, representing similar signals, can be compared for resemblance. Figure 16 shows the result of a cross correlation of vectors representing different modular operations.
Figure 16: cross correlation of modular operations
In an RSA implementation using binary exponentiation the multiply operations may reveal themselves since they all share one argument. This relation shows in the graph, represented as a matrix where every

operation is compared to every operation. On the diagonal, a perfect correlation is observed where operations are correlated to themselves, resulting in the bright green dots. On the first row, we can observe in this example a good correlation in columns 1, 3, 5, 7, 10, 13, 15, 20, 23. Assuming the correlation reveals the multiply operations this allows immediate readout of the operation sequence: MSMSMSMSSMSSMSMSSSSMSSMS (M=multiply, S=square), which translates to key value: 111101011000101.
When the correlation is weaker, the multiply operations may still be detected by cluster analysis. With this method, a group is built containing all the multiply operations, while the square operations are left out. The group is coherent because every member of the group has on average a slightly better resemblance to other group members than to non‐group members.
Figure 12: Clustering points in two groups
Due to the size of the group this may work even when correlation between some individual pairs is not good. Figure 18 shows that some points in the green group are nearer (have a better match) to some blue points, but still have, on average, a shorter distance to other points in the green group than to points in the blue group.
There are multiple ways to compute cross correlation and clusters, and several variants may be tried to distinguish square from multiply operations. This even works for windowed RSA implementations that use a fixed sequence of square operations followed by a single multiply operation. Although the operation order does not reveal the key – the sequence is always the same – the multiply operation itself can be attacked as different, and potentially distinguishable, multipliers are used.
Cross correlation matrices and clusters can be made from single or multiple traces. The method needs a set of vectors for which resemblance is analyzed. With single traces, each vector is made of a single segment, extracted for a modular operation in the trace. With multiple traces the segments are first compressed into a single point, and the vectors are then constructed from compressed segments of the same operation over multiple traces.
Tests With the methods discussed above it is possible to make a few tests that can detect various weaknesses in the exponentiation phase of RSA. The tests require little operator involvement, and can all be executed in a single day.

The tests are applicable for a variety of RSA implementation variants, including:
• binary or windowed exponentiation, • straight or CRT • normal or Montgomery
Multiple countermeasures against side channel analysis are likely to be used to protect RSA implementations. An implementation may still prove to be vulnerable when too little, or too weak, countermeasures are applied. Examples of countermeasures that may be defeated are:
• noise addition • message blinding • multiply‐always • exponent blinding/splitting
Test 1: Single trace dual cluster test. This test catches SPA problems (both in signal amplitude as in operation duration, including leaky inter‐operation gaps) in case of limited noise (good S/N). Implementation may use exponent blinding, but should do binary exponentiation.
Steps:
1. Take one trace of a complete RSA execution. Preferably the input should be set to ‐1, which will result in a maximum difference between square and multiply operations.
2. Use segmentation to extract the modular operations. 3. Use cross correlation and cluster analysis to divide the set of modular operations in two groups
(this will fail when square/multiply operations are too similar). 4. Use small brute force, e.g. toggle max 20 marginal cases, to find a matching key for known
input/output (note that the exponent is not necessarily equal to the private key, but could also be equivalent due to exponent blinding/splitting).
5. Use T‐test to judge significance.
Test 2: Multi trace dual cluster test. This test catches SPA and DPA problems with more noise. Implementation does binary exponentiation and no exponent blinding/splitting.
Steps:
1. Collect up to 100k traces (constant short, e.g. 512 bit, key and variable known data). Amount should be tuned to what can be acquired in a few hours.
2. Use segmentation to extract the modular operations. 3. Use cross correlation and cluster analysis on compressed modular operation segments over all
traces to detect differences between square and multiply operations and build two clusters. 4. Verify that the sequence of square and multiply operations (as found in the two clusters) can be
mapped with limited errors on a known key. 5. Use T‐test to judge significance.

Test 3: Multi trace multi cluster test This test catches cross correlation problems with more noise. Implementation may do message blinding, windowed exponentiation or multiply always, but no exponent blinding/splitting.
Steps:
1. Collect up to 100k traces (constant short, e.g. 512 bit, key and variable known data). Amount should be tuned to what can be acquired in a few hours.
2. Use segmentation to extract the modular operations. 3. Use cross correlation and cluster analysis to build an arbitrary number of clusters from
compressed modular operation segments. Detect window size or multiply always variant by mapping the known key on the clusters.
4. Use T‐test to judge significance.
7. References 1. Goodwill, G., Jun, B., Jaffe, J., Rohatgi, P.: A testing methodology for side‐channel resistance
validation, NIAT 2011. 2. Kocher, P., Jaffe, J., Jun, B.: Differential Power Analysis. In Weiner, M., ed: Advances in
Cryptology – CRYPTO ’99. Volume 1666 of LNCS., Springer, 1999, pages 388‐397. 3. Novak, R.: SPA‐Based Adaptive Chosen‐Ciphertext Attack on RSA Implementation. In Naccache,
D., ed: Public Key Crytography 2002. Volume 2274 of LNCS., Springer, 2002, pages 252‐262. 4. Marc F. Witteman, Jasper G.J. van Woudenberg, and Federico Menarini: Defeating RSA Multiply‐
Always and Message Blinding Countermeasures. In Aggelos Kiayias, ed: Topics in Cryptology – CT‐RSA 2011, Volume 6558 of LNCS., Springer, 2010, pages 77‐88.
![Image Encryption Using AES with Modified … image security, encryption is used. Various algorithms for encryption have been proposed such as AES, RSA, IDEA [1, 2]. These algorithms](https://img.dokumen.tips/doc/110x75/5aa221b97f8b9a07758ca37b/image-encryption-using-aes-with-modified-image-security-encryption-is-used.jpg)


![Quantum algorithms for factoring and Post-Quantum RSA · Post-Quantum RSA is a variation of RSA, proposed by Bernstein et al. [4], that is supposed to better withstand attacks by](https://img.dokumen.tips/doc/110x75/60197742d05d430b2a753b42/quantum-algorithms-for-factoring-and-post-quantum-rsa-post-quantum-rsa-is-a-variation.jpg)