Embed Size (px)
Citation preview
SIAPS/PMI - AMDM Scale-Up Sites Baseline Assessment
Hailu Tegegnework and Fikadu Deme August 2014
SIAPS/PMI - AMDM Scale-Up Sites Baseline Assessment
ii
This technical report is made possible by the generous support of the American people
through the US Agency for International Development (USAID), under the terms of
cooperative agreement number AID-OAA-A-11-00021. The contents are the responsibility of
Management Sciences for Health and do not necessarily reflect the views of USAID or the
United States Government.
About SIAPS
The goal of the Systems for Improved Access to Pharmaceuticals and Services (SIAPS)
Program is to assure the availability of quality pharmaceutical products and effective
pharmaceutical services to achieve desired health outcomes. Toward this end, the SIAPS
result areas include improving governance, building capacity for pharmaceutical management
and services, addressing information needed for decision-making in the pharmaceutical
sector, strengthening financing strategies and mechanisms to improve access to medicines,
and increasing quality pharmaceutical services.
Recommended Citation
This report may be reproduced if credit is given to SIAPS. Please use the following citation:
Hailu Tegegnework and Fikadu Deme. 2014. Antimalaria Drugs Management, Baseline
Assessment Report, USAID/SIAPS/PMI–Ethiopia, August, 2014. Submitted to the US Agency
for International Development by the Strengthening Pharmaceutical Systems Program.
Arlington, VA: Management Sciences for Health.
Key Words
Ethiopia, AMDM/PMI, baseline assessment, summary findings
Systems for Improved Access to Pharmaceuticals and Services
Center for Pharmaceutical Management
Management Sciences for Health
4301 North Fairfax Drive, Suite 400
Arlington, VA 22203 USA
Telephone: 703.524.6575
Fax: 703.524.7898
E-mail: [email protected]
Website: www.siapsprogram.org
iii
CONTENTS
Acronyms .................................................................................................................................. iv
Introduction ................................................................................................................................ 1
Malaria in Ethiopia ................................................................................................................ 1
Methodology .............................................................................................................................. 2 Scope and Objective .............................................................................................................. 2 Sample Sites ........................................................................................................................... 2 Assessment Teams and Training ........................................................................................... 3
Assessment Tools and Informants ......................................................................................... 3
Limitations ............................................................................................................................. 3
Survey Findings and Analysis ................................................................................................... 5 General Assessment and Targets ........................................................................................... 5 Malaria Diagnosis in Hospitals and HCs ............................................................................... 7 Availability of the National Malaria Diagnosis and Treatment Strategy and National
Malaria Diagnosis and Treatment Guidelines ....................................................................... 8
Availability and Use of Standard Prescription Forms ........................................................... 9 Prevalence of Malaria Parasite Species ............................................................................... 11
Knowledge of Providers ...................................................................................................... 14 Product Availability ............................................................................................................. 15
Stock-Out Days for AMDs .................................................................................................. 16 Expiry of Malaria Medicines in Assessed HFs .................................................................... 16
Stock-Out Days for Antiretroviral Drugs at HFs ................................................................. 17 Laboratory Commodities Availability ................................................................................. 19
Storage and Store Accessories ............................................................................................. 19 Pharmaceutical Management Information System (PMIS) ................................................. 25
Conclusion and Recommendations .......................................................................................... 29
Availability and Expiry Management .................................................................................. 29 Storage, Inventory Control, and Pharmaceutical Management Information System .......... 29
Human Capacity and Knowledge ........................................................................................ 30 Other Issues .......................................................................................................................... 30
iv
ACRONYMS
ACT Artemisinin-based combination therapy
AL Artemether-lumefantrine
AMD Antimalarial drug
AMDM Antimalaria drugs management
ARV Antiretroviral
CDC US Centers for Disease Control and Prevention
DHO District health office
E.C. Ethiopian calendar
FMOH Federal Ministry of Health
HC Health center
HF Health facility
IPD Inpatient department
IPTp Intermittent preventive treatment of malaria in pregnancy
IRS Indoor residual spraying
ITN Insecticide-treated net
LMIS Logistics management information system
mg milligram
MOH Ministry of Health
MOP Malaria operational plan
MSH Management Sciences for Health
NMDTG National Malaria Diagnosis and Treatment Guidelines
NMDTS National Malaria Diagnosis and Treatment Strategy
OI Opportunistic infection
OPD Outpatient department
PF Plasmodium falciparum
PM Plasmodium malariae
PMI President’s Malaria Initiative
PMIS Pharmaceutical management information system
PO Plasmodium ovale
PSMS Pharmaceutical supply management system
PV Plasmodium vivax
RDT Rapid diagnostic test
RHB Regional health bureau
RHZE Rifampicin + isoniazid + pyrazinamide + ethambutol
RTA
SIAPS
Regional technical advisor
Systems for Improved Access to Pharmaceuticals and Services
SNNPR Southern Nations, Nationalities and Peoples’ Regional State
SP Sulfadoxine-pyrimethamine
SPS Strengthening Pharmaceutical Systems
ZHD Zonal health department
1
INTRODUCTION
The President’s Malaria Initiative (PMI) is an interagency initiative led by the US Agency for
International Development (USAID) with the US Centers for Disease Control and Prevention
(CDC). PMI aims to reduce malaria-related mortality by 50% in 15 countries in sub-Saharan
Africa by 2010. It plans to meet this goal by achieving 85% coverage of the most vulnerable
groups—children under 5, pregnant women, and people living with HIV and AIDS—using
proven preventive and therapeutic interventions, including artemisinin-based combination
therapies (ACTs), insecticide-treated nets (ITNs), intermittent preventive treatment of malaria
in pregnancy (IPTp), and indoor residual spraying (IRS).
Malaria in Ethiopia
Malaria is one of the leading communicable diseases in Ethiopia. Almost 75% of Ethiopia’s
land mass is malarious, whereby 68% of the population is at risk of contracting malaria.
Furthermore, 60% of malaria cases are caused by Plasmodium falciparum (PF) and 40% by
Plasmodium vivax (PV). In most parts of Ethiopia, the transmission of malaria is
largely unstable in character and seasonal because of the altitude and climatic factors.
In October 2006, Ethiopia was selected as a focus country for PMI. The PMI resources
allocated to Ethiopia target the Oromia Regional State, the country’s largest administrative
region and the one bearing the brunt of the country’s malaria burden. Overall systems support
that is provided will benefit central management at the federal Ministry of Health (FMOH)
and in the other regions.
In 2007, the Ethiopia Malaria Operational Plan (MOP), which outlines activities to be
supported by PMI, identified Strengthening Pharmaceutical Systems (SPS)/Management
Sciences for Health (MSH) as its partner for providing technical assistance and support to
PMI regarding antimalaria drugs management (AMDM). In 2012, Systems for Improved
Access to Pharmaceuticals and Services (SIAPS), a successor of SPS implemented by MSH,
continued to implement the AMDM activities to ensure the availability of high-quality
pharmaceutical products and effective pharmaceutical services to achieve desired health
outcomes. To that end, the SIAPS areas of focus include improving governance, building
capacity for pharmaceutical management and services, addressing information needed for
decision-making in the pharmaceutical sector, strengthening financing strategies and
mechanisms to improve access to medicines, and increasing high-quality pharmaceutical
services.
2
METHODOLOGY
Scope and Objective
This is a focused, rapid, participatory, and comprehensive baseline assessment, intended to
gather operational information for the purpose of identifying immediate gaps and undertaking
appropriate interventions.
Sample Sites
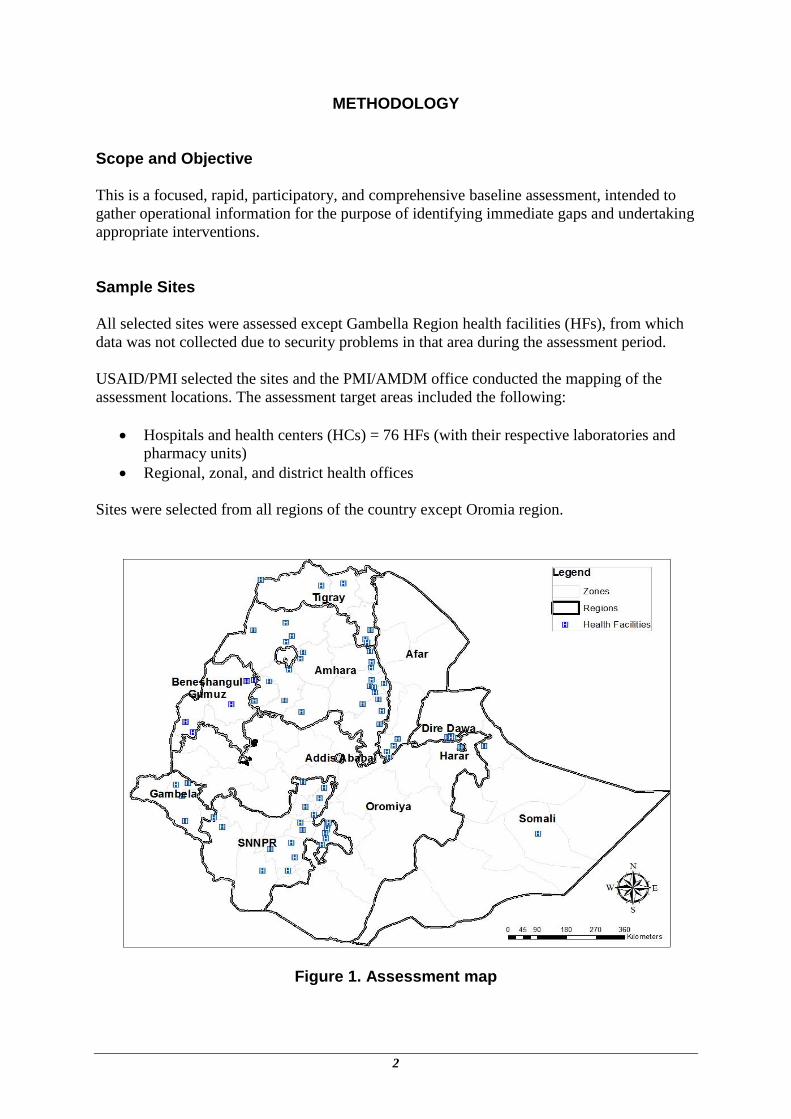
All selected sites were assessed except Gambella Region health facilities (HFs), from which
data was not collected due to security problems in that area during the assessment period.
USAID/PMI selected the sites and the PMI/AMDM office conducted the mapping of the
assessment locations. The assessment target areas included the following:
Hospitals and health centers (HCs) = 76 HFs (with their respective laboratories and
pharmacy units)
Regional, zonal, and district health offices
Sites were selected from all regions of the country except Oromia region.
Figure 1. Assessment map
Methodology
3
Assessment Teams and Training
SIAPS regional technical advisors (RTAs) conducted the assessment, and the respondents of
the assessment were staff members from the Regional Health Bureau (RHB), District Health
Office (DHO) and health facility personnel. A training and orientation program was
organized for the data collection team on the AMDM assessment. The training focused on the
national and international incidence of malaria, the purpose of the assessment, the assessment
questionnaires, and how to conduct the assessment.
Assessment Tools and Informants
• Three structured questionnaires were used to collect the baseline assessment.
• The assessment tools included both qualitative and quantitative questions.
• The respondents were pharmacists, laboratory personnel, prescribers from HFs, and
personnel representing the supply sector from RHBs, Zonal Health Departments (ZHDs),
and DHOs.
Limitations
• The baseline assessment did not contain a pre-test of the questionnaires, but they were
discussed with the RTAs, who were familiar with the questionnaires.
• The sample sites were not statistically selected but chosen based on prevalence and
representation of intervention targets.
• The assessment is not designed to be a scientific study but a guide for intervention
planning.
• Five HFs (one hospital and four HCs) in Gambella Region were not assessed due to the
security problems at the time of the assessment.
• Quantitative data such as the number of malaria cases tested and cases treated were not
complete due to the weak recording systems at the HFs assessed.
SIAPS/PMI - AMDM Scale-Up Sites Baseline Assessment
4
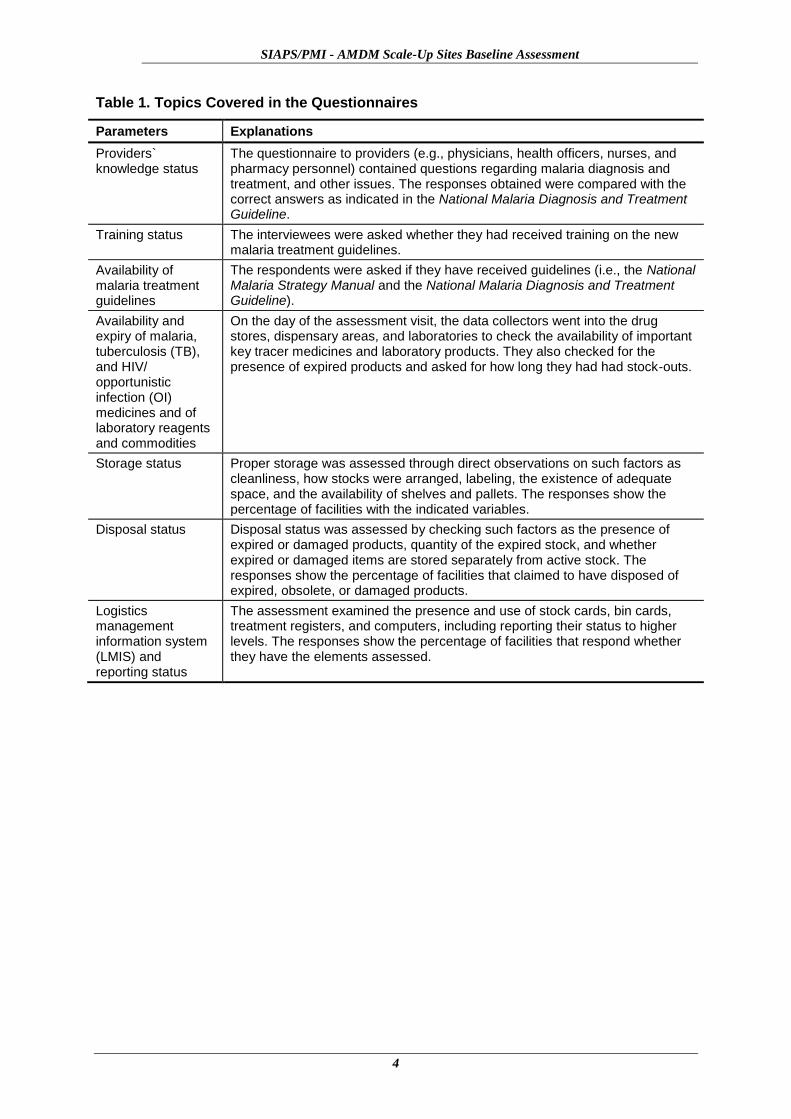
Table 1. Topics Covered in the Questionnaires
Parameters Explanations
Providers` knowledge status
The questionnaire to providers (e.g., physicians, health officers, nurses, and pharmacy personnel) contained questions regarding malaria diagnosis and treatment, and other issues. The responses obtained were compared with the correct answers as indicated in the National Malaria Diagnosis and Treatment Guideline.
Training status The interviewees were asked whether they had received training on the new malaria treatment guidelines.
Availability of malaria treatment guidelines
The respondents were asked if they have received guidelines (i.e., the National Malaria Strategy Manual and the National Malaria Diagnosis and Treatment Guideline).
Availability and expiry of malaria, tuberculosis (TB), and HIV/ opportunistic infection (OI) medicines and of laboratory reagents and commodities
On the day of the assessment visit, the data collectors went into the drug stores, dispensary areas, and laboratories to check the availability of important key tracer medicines and laboratory products. They also checked for the presence of expired products and asked for how long they had had stock-outs.
Storage status Proper storage was assessed through direct observations on such factors as cleanliness, how stocks were arranged, labeling, the existence of adequate space, and the availability of shelves and pallets. The responses show the percentage of facilities with the indicated variables.
Disposal status Disposal status was assessed by checking such factors as the presence of expired or damaged products, quantity of the expired stock, and whether expired or damaged items are stored separately from active stock. The responses show the percentage of facilities that claimed to have disposed of expired, obsolete, or damaged products.
Logistics management information system (LMIS) and reporting status
The assessment examined the presence and use of stock cards, bin cards, treatment registers, and computers, including reporting their status to higher levels. The responses show the percentage of facilities that respond whether they have the elements assessed.
5
SURVEY FINDINGS AND ANALYSIS
General Assessment and Targets
The general questions about health services were designed to obtain information on the types
of facilities, the services they provide, staffing, testing results, morbidity, and treatment
through interviews and document reviews at the facility level.
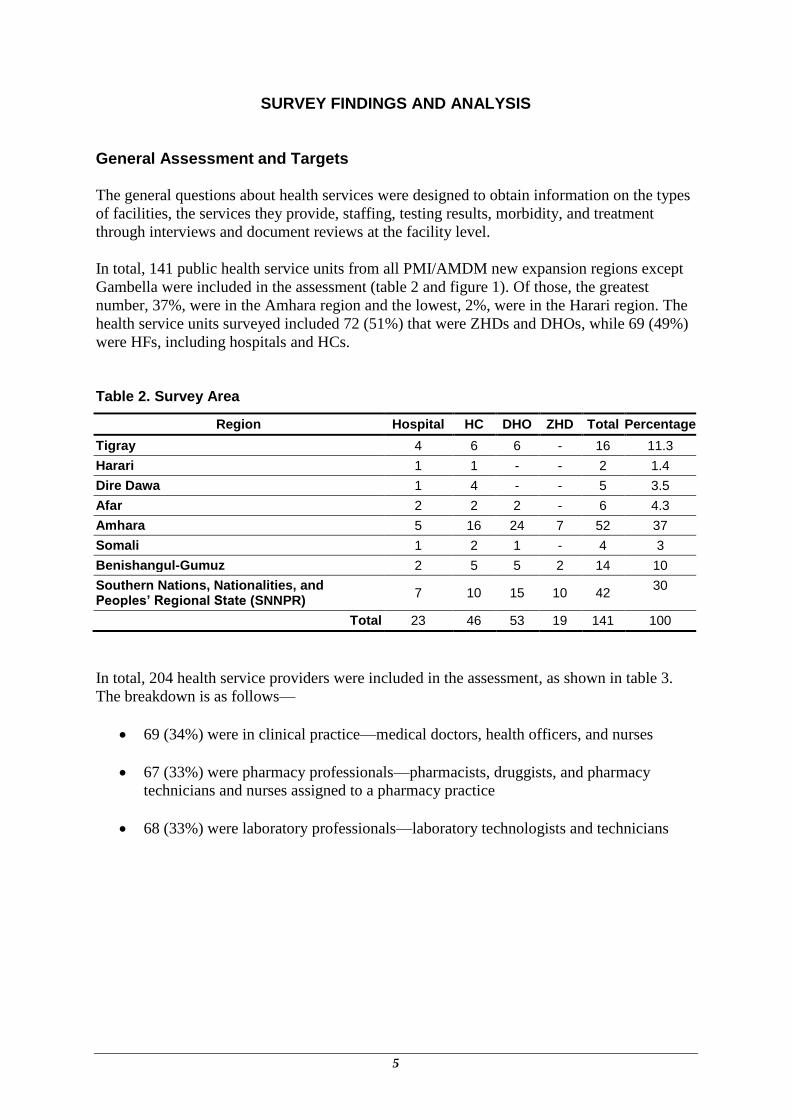
In total, 141 public health service units from all PMI/AMDM new expansion regions except
Gambella were included in the assessment (table 2 and figure 1). Of those, the greatest
number, 37%, were in the Amhara region and the lowest, 2%, were in the Harari region. The
health service units surveyed included 72 (51%) that were ZHDs and DHOs, while 69 (49%)
were HFs, including hospitals and HCs.
Table 2. Survey Area
Region Hospital HC DHO ZHD Total Percentage
Tigray 4 6 6 - 16 11.3
Harari 1 1 - - 2 1.4
Dire Dawa 1 4 - - 5 3.5
Afar 2 2 2 - 6 4.3
Amhara 5 16 24 7 52 37
Somali 1 2 1 - 4 3
Benishangul-Gumuz 2 5 5 2 14 10
Southern Nations, Nationalities, and Peoples’ Regional State (SNNPR)
7 10 15 10 42 30
Total 23 46 53 19 141 100
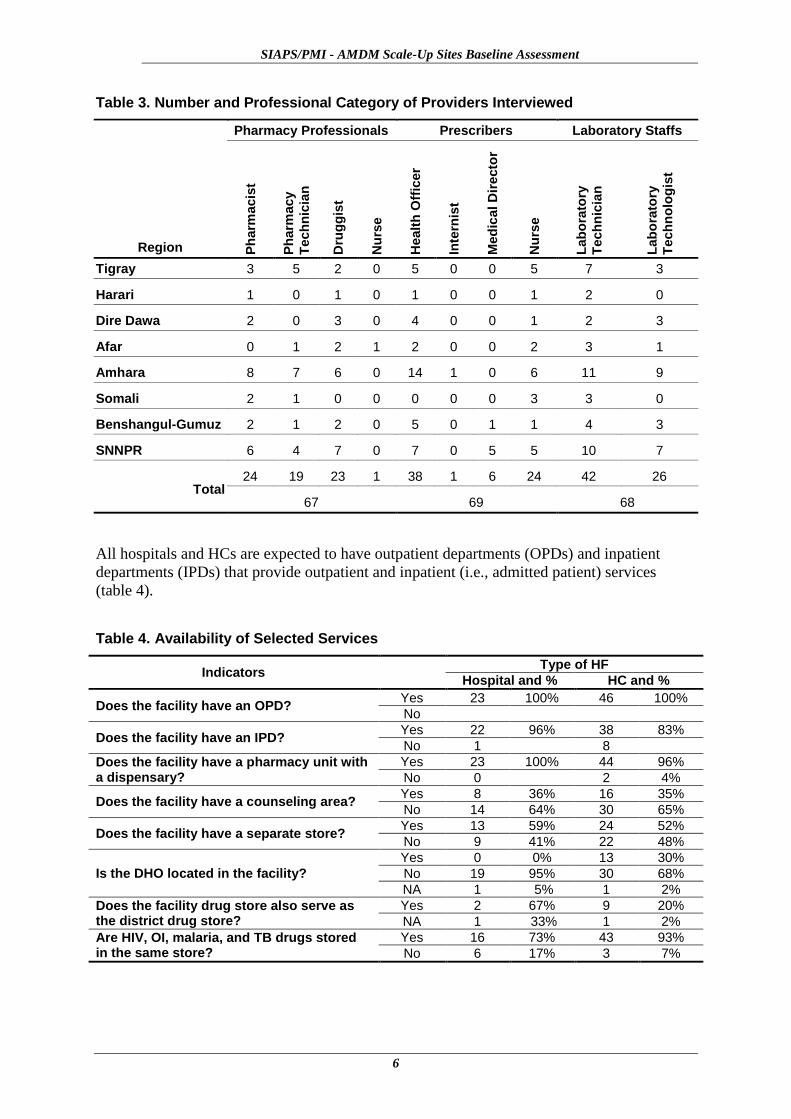
In total, 204 health service providers were included in the assessment, as shown in table 3.
The breakdown is as follows—
69 (34%) were in clinical practice—medical doctors, health officers, and nurses
67 (33%) were pharmacy professionals—pharmacists, druggists, and pharmacy
technicians and nurses assigned to a pharmacy practice
68 (33%) were laboratory professionals—laboratory technologists and technicians
SIAPS/PMI - AMDM Scale-Up Sites Baseline Assessment
6
Table 3. Number and Professional Category of Providers Interviewed
Region
Pharmacy Professionals Prescribers Laboratory Staffs
Ph
arm
acis
t
Ph
arm
acy
Tech
nic
ian
Dru
gg
ist
Nu
rse
Healt
h O
ffic
er
Inte
rnis
t
Med
ical D
irecto
r
Nu
rse
Lab
ora
tory
Tech
nic
ian
Lab
ora
tory
Tech
no
log
ist
Tigray 3 5 2 0 5 0 0 5 7 3
Harari 1 0 1 0 1 0 0 1 2 0
Dire Dawa 2 0 3 0 4 0 0 1 2 3
Afar 0 1 2 1 2 0 0 2 3 1
Amhara 8 7 6 0 14 1 0 6 11 9
Somali 2 1 0 0 0 0 0 3 3 0
Benshangul-Gumuz 2 1 2 0 5 0 1 1 4 3
SNNPR 6 4 7 0 7 0 5 5 10 7
Total 24 19 23 1 38 1 6 24 42 26
67 69 68
All hospitals and HCs are expected to have outpatient departments (OPDs) and inpatient
departments (IPDs) that provide outpatient and inpatient (i.e., admitted patient) services
(table 4).
Table 4. Availability of Selected Services
Indicators Type of HF
Hospital and % HC and %
Does the facility have an OPD? Yes 23 100% 46 100%
No
Does the facility have an IPD? Yes 22 96% 38 83%
No 1 8
Does the facility have a pharmacy unit with a dispensary?
Yes 23 100% 44 96%
No 0 2 4%
Does the facility have a counseling area? Yes 8 36% 16 35%
No 14 64% 30 65%
Does the facility have a separate store? Yes 13 59% 24 52%
No 9 41% 22 48%
Is the DHO located in the facility?
Yes 0 0% 13 30%
No 19 95% 30 68%
NA 1 5% 1 2%
Does the facility drug store also serve as the district drug store?
Yes 2 67% 9 20%
NA 1 33% 1 2%
Are HIV, OI, malaria, and TB drugs stored in the same store?
Yes 16 73% 43 93%
No 6 17% 3 7%

Survey Findings and Analysis
7
Health service facilities comprised of 23 hospitals and 46 HCs were asked about the type of
patient and pharmacy services they provide. Important observations made include the
following:
All of the hospitals and HCs are functional in that they all have an OPD unit while
almost all (96%) of the hospitals and most of the HCs (83%) operate an inpatient unit.
All of the hospitals and 96% of the HCs have a pharmacy unit with a dispensary while
only 36% of the hospitals and 35% of the HCs have a medicine counselling area for
patients.
The availability of storage space for medicines is limited both at the HCs (52%) and
at the hospitals (59%).
About 30% of the DHOs are located in the same compound as the HCs and 20% of
the HCs share their store with DHOs. On the other hand, about three-quarters of the
hospitals (73%) and 93% of the HCs have HIV, OI, malaria and TB drugs stored in
the same store.
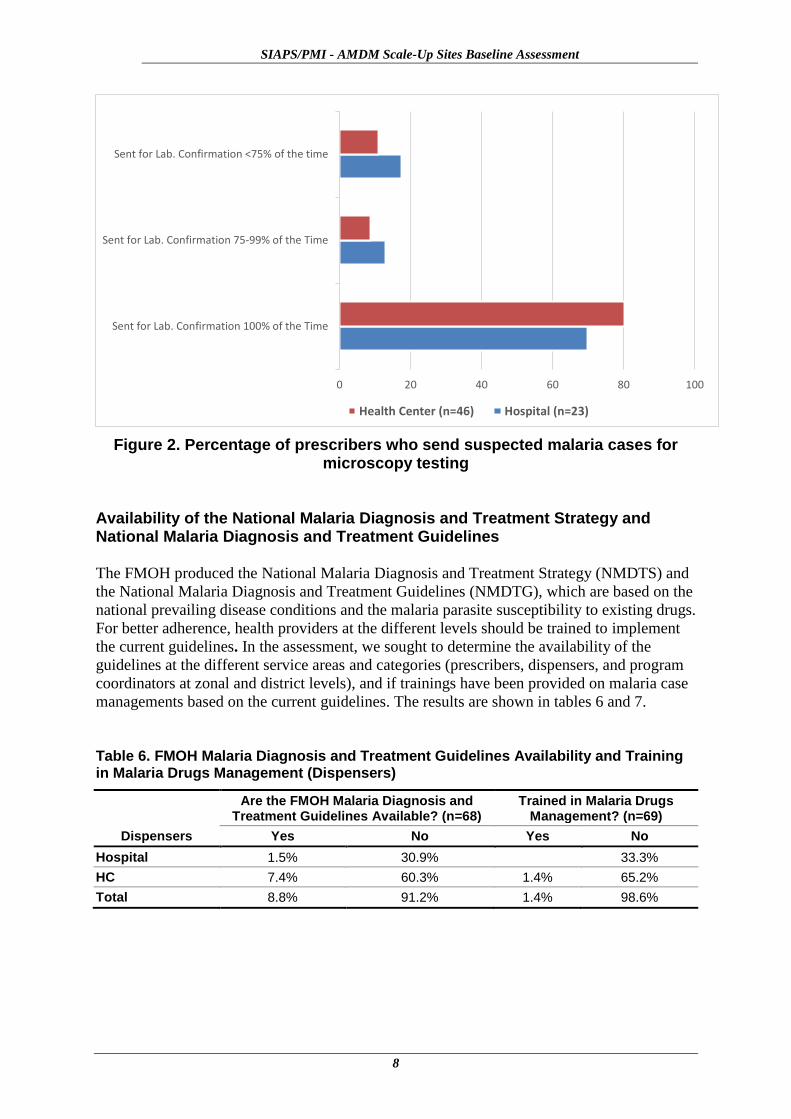
Malaria Diagnosis in Hospitals and HCs
The current (June 2004) National Malaria Diagnosis and Treatment Guidelines recommend
that malaria treatments in all clinically suspected cases should be based on a laboratory
diagnosis for the parasite species using a microscopic method at hospitals and HCs and rapid
diagnostic test (RDT) diagnosis at the health-post level.
Thus, the assessment included questions about the percentage of suspected malaria cases the
clinicians sent to the laboratory for microscopic confirmation. The findings included the
following:
About 70% of prescribers at hospitals and more than 80% of prescribers at HCs always send
clinically suspected malaria cases for testing. Only 17% of prescribers in hospitals and 11%
in HCs stated that they asked for laboratory diagnosis for fewer than 75% of their patients.
Although this appears to be a strong indication of adherence to the guidelines, the findings
also show there are prescribers who need to show improvement with regard to sending all
suspected cases for laboratory confirmation.
Table 5. Percentage of Prescribers Who Send Suspected Malaria Cases for Microscopy Testing
Sent for Laboratory Confirmation
100% of the Time 75–99% of the Time <75% of the Time Total
Hospital Count 16 3 4 23
% 69.6% 13.0% 17.4% 100.0%
HC Count 37 4 5 46
% 80.4% 8.7% 10.9% 100.0%
Total Count 53 7 9 69
% 76.8% 10.1% 13.0% 100.0%
SIAPS/PMI - AMDM Scale-Up Sites Baseline Assessment
8
Figure 2. Percentage of prescribers who send suspected malaria cases for microscopy testing
Availability of the National Malaria Diagnosis and Treatment Strategy and National Malaria Diagnosis and Treatment Guidelines
The FMOH produced the National Malaria Diagnosis and Treatment Strategy (NMDTS) and
the National Malaria Diagnosis and Treatment Guidelines (NMDTG), which are based on the
national prevailing disease conditions and the malaria parasite susceptibility to existing drugs.
For better adherence, health providers at the different levels should be trained to implement
the current guidelines. In the assessment, we sought to determine the availability of the
guidelines at the different service areas and categories (prescribers, dispensers, and program
coordinators at zonal and district levels), and if trainings have been provided on malaria case
managements based on the current guidelines. The results are shown in tables 6 and 7.
Table 6. FMOH Malaria Diagnosis and Treatment Guidelines Availability and Training in Malaria Drugs Management (Dispensers)
Dispensers
Are the FMOH Malaria Diagnosis and Treatment Guidelines Available? (n=68)
Trained in Malaria Drugs Management? (n=69)
Yes No Yes No
Hospital 1.5% 30.9% 33.3%
HC 7.4% 60.3% 1.4% 65.2%
Total 8.8% 91.2% 1.4% 98.6%
Sent for Lab. Confirmation 100% of the Time
Sent for Lab. Confirmation 75-99% of the Time
Sent for Lab. Confirmation <75% of the time
0 20 40 60 80 100
Health Center (n=46) Hospital (n=23)
Survey Findings and Analysis
9
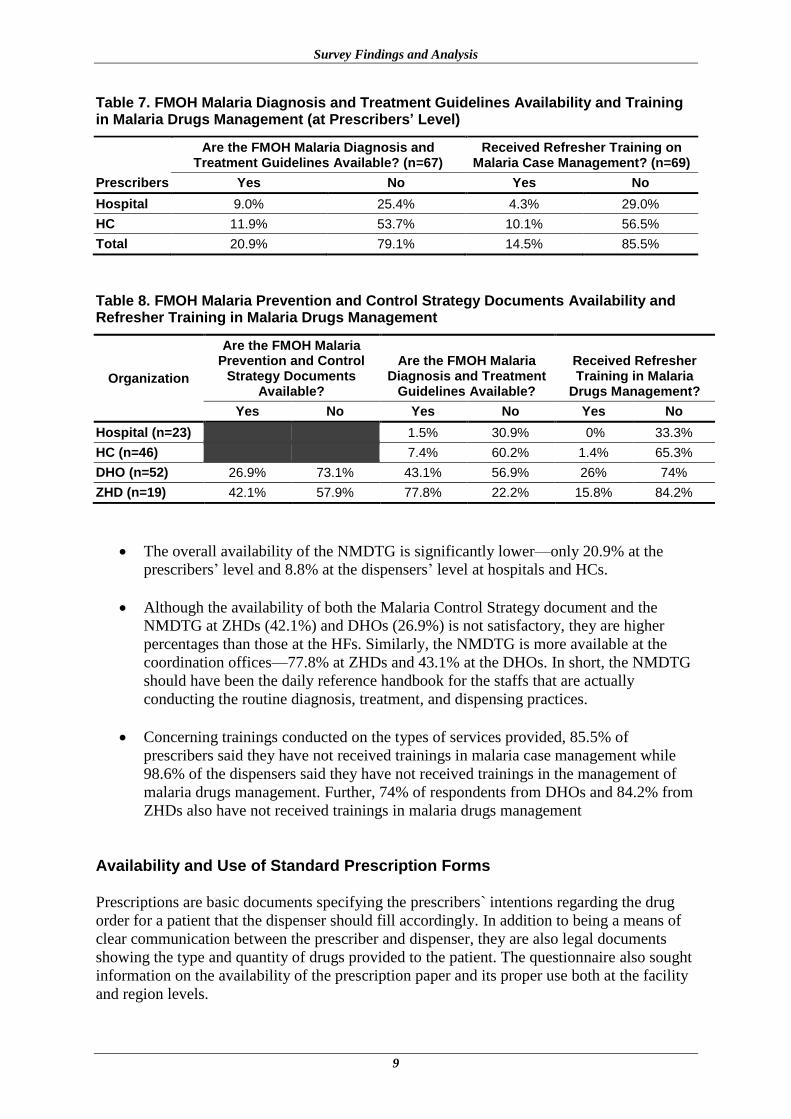
Table 7. FMOH Malaria Diagnosis and Treatment Guidelines Availability and Training in Malaria Drugs Management (at Prescribers’ Level)
Prescribers
Are the FMOH Malaria Diagnosis and Treatment Guidelines Available? (n=67)
Received Refresher Training on Malaria Case Management? (n=69)
Yes No Yes No
Hospital 9.0% 25.4% 4.3% 29.0%
HC 11.9% 53.7% 10.1% 56.5%
Total 20.9% 79.1% 14.5% 85.5%
Table 8. FMOH Malaria Prevention and Control Strategy Documents Availability and Refresher Training in Malaria Drugs Management
Organization
Are the FMOH Malaria Prevention and Control
Strategy Documents Available?
Are the FMOH Malaria Diagnosis and Treatment
Guidelines Available?
Received Refresher Training in Malaria
Drugs Management?
Yes No Yes No Yes No
Hospital (n=23)
1.5% 30.9% 0% 33.3%
HC (n=46)
7.4% 60.2% 1.4% 65.3%
DHO (n=52) 26.9% 73.1% 43.1% 56.9% 26% 74%
ZHD (n=19) 42.1% 57.9% 77.8% 22.2% 15.8% 84.2%
The overall availability of the NMDTG is significantly lower—only 20.9% at the
prescribers’ level and 8.8% at the dispensers’ level at hospitals and HCs.
Although the availability of both the Malaria Control Strategy document and the
NMDTG at ZHDs (42.1%) and DHOs (26.9%) is not satisfactory, they are higher
percentages than those at the HFs. Similarly, the NMDTG is more available at the
coordination offices—77.8% at ZHDs and 43.1% at the DHOs. In short, the NMDTG
should have been the daily reference handbook for the staffs that are actually
conducting the routine diagnosis, treatment, and dispensing practices.
Concerning trainings conducted on the types of services provided, 85.5% of
prescribers said they have not received trainings in malaria case management while
98.6% of the dispensers said they have not received trainings in the management of
malaria drugs management. Further, 74% of respondents from DHOs and 84.2% from
ZHDs also have not received trainings in malaria drugs management
Availability and Use of Standard Prescription Forms
Prescriptions are basic documents specifying the prescribers` intentions regarding the drug
order for a patient that the dispenser should fill accordingly. In addition to being a means of
clear communication between the prescriber and dispenser, they are also legal documents
showing the type and quantity of drugs provided to the patient. The questionnaire also sought
information on the availability of the prescription paper and its proper use both at the facility
and region levels.
SIAPS/PMI - AMDM Scale-Up Sites Baseline Assessment
10
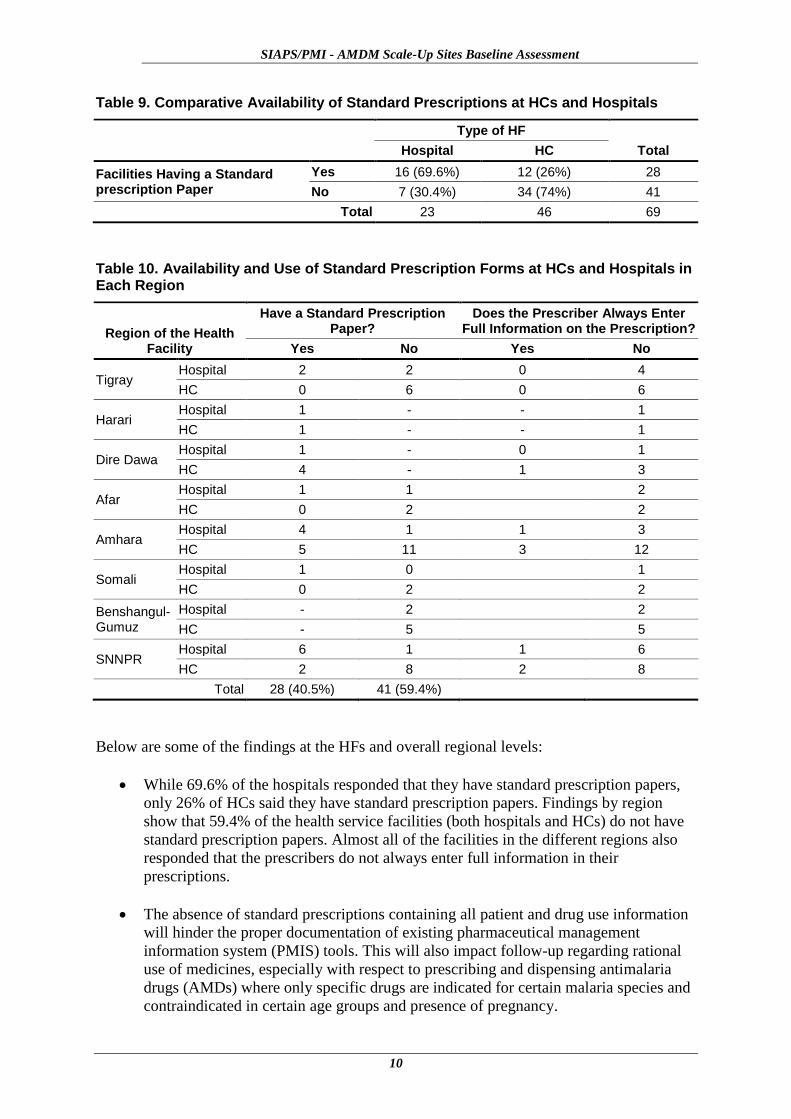
Table 9. Comparative Availability of Standard Prescriptions at HCs and Hospitals
Type of HF
Total Hospital HC
Facilities Having a Standard prescription Paper
Yes 16 (69.6%) 12 (26%) 28
No 7 (30.4%) 34 (74%) 41
Total 23 46 69
Table 10. Availability and Use of Standard Prescription Forms at HCs and Hospitals in Each Region
Region of the Health Facility
Have a Standard Prescription Paper?
Does the Prescriber Always Enter Full Information on the Prescription?
Yes No Yes No
Tigray Hospital 2 2 0 4
HC 0 6 0 6
Harari Hospital 1 - - 1
HC 1 - - 1
Dire Dawa Hospital 1 - 0 1
HC 4 - 1 3
Afar Hospital 1 1 2
HC 0 2 2
Amhara Hospital 4 1 1 3
HC 5 11 3 12
Somali Hospital 1 0 1
HC 0 2 2
Benshangul-Gumuz
Hospital - 2 2
HC - 5 5
SNNPR Hospital 6 1 1 6
HC 2 8 2 8
Total 28 (40.5%) 41 (59.4%)
Below are some of the findings at the HFs and overall regional levels:
While 69.6% of the hospitals responded that they have standard prescription papers,
only 26% of HCs said they have standard prescription papers. Findings by region
show that 59.4% of the health service facilities (both hospitals and HCs) do not have
standard prescription papers. Almost all of the facilities in the different regions also
responded that the prescribers do not always enter full information in their
prescriptions.
The absence of standard prescriptions containing all patient and drug use information
will hinder the proper documentation of existing pharmaceutical management
information system (PMIS) tools. This will also impact follow-up regarding rational
use of medicines, especially with respect to prescribing and dispensing antimalaria
drugs (AMDs) where only specific drugs are indicated for certain malaria species and
contraindicated in certain age groups and presence of pregnancy.
Survey Findings and Analysis
11
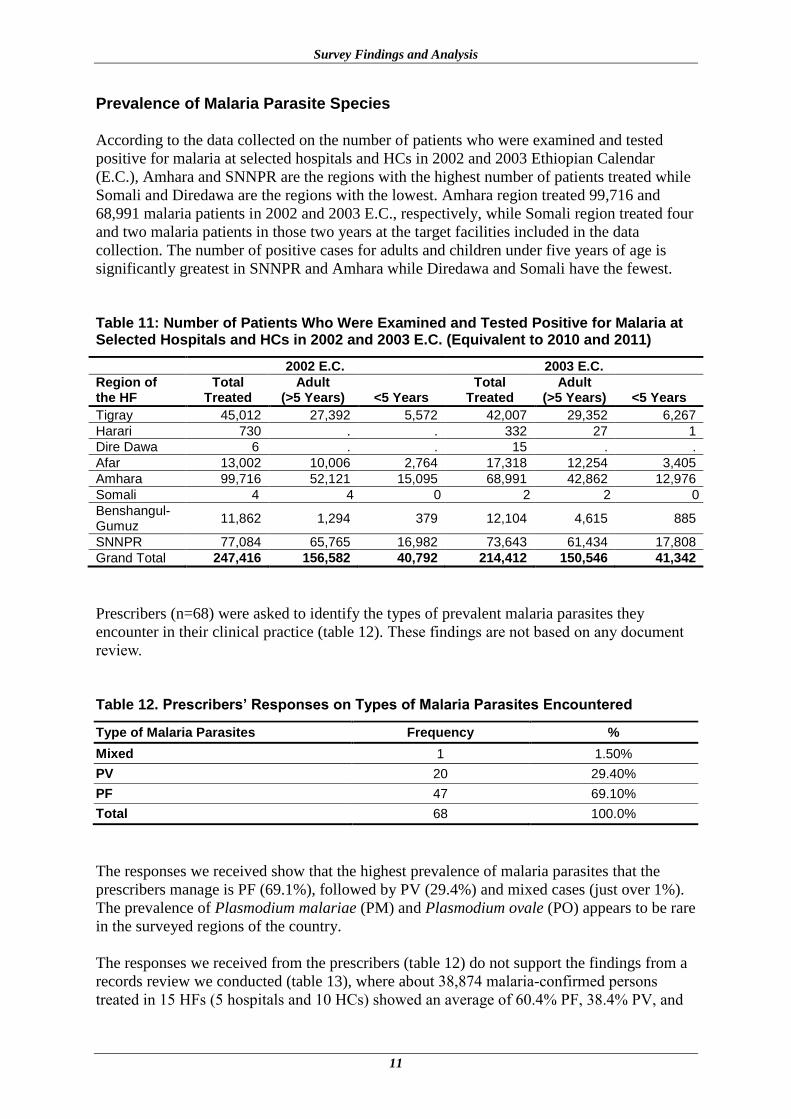
Prevalence of Malaria Parasite Species
According to the data collected on the number of patients who were examined and tested
positive for malaria at selected hospitals and HCs in 2002 and 2003 Ethiopian Calendar
(E.C.), Amhara and SNNPR are the regions with the highest number of patients treated while
Somali and Diredawa are the regions with the lowest. Amhara region treated 99,716 and
68,991 malaria patients in 2002 and 2003 E.C., respectively, while Somali region treated four
and two malaria patients in those two years at the target facilities included in the data
collection. The number of positive cases for adults and children under five years of age is
significantly greatest in SNNPR and Amhara while Diredawa and Somali have the fewest.
Table 11: Number of Patients Who Were Examined and Tested Positive for Malaria at Selected Hospitals and HCs in 2002 and 2003 E.C. (Equivalent to 2010 and 2011)
2002 E.C. 2003 E.C.
Region of the HF
Total Treated
Adult (>5 Years) <5 Years
Total Treated
Adult (>5 Years) <5 Years
Tigray 45,012 27,392 5,572 42,007 29,352 6,267
Harari 730 . . 332 27 1
Dire Dawa 6 . . 15 . .
Afar 13,002 10,006 2,764 17,318 12,254 3,405
Amhara 99,716 52,121 15,095 68,991 42,862 12,976
Somali 4 4 0 2 2 0
Benshangul-Gumuz
11,862 1,294 379 12,104 4,615 885
SNNPR 77,084 65,765 16,982 73,643 61,434 17,808
Grand Total 247,416 156,582 40,792 214,412 150,546 41,342
Prescribers (n=68) were asked to identify the types of prevalent malaria parasites they
encounter in their clinical practice (table 12). These findings are not based on any document
review.
Table 12. Prescribers’ Responses on Types of Malaria Parasites Encountered
Type of Malaria Parasites Frequency %
Mixed 1 1.50%
PV 20 29.40%
PF 47 69.10%
Total 68 100.0%
The responses we received show that the highest prevalence of malaria parasites that the
prescribers manage is PF (69.1%), followed by PV (29.4%) and mixed cases (just over 1%).
The prevalence of Plasmodium malariae (PM) and Plasmodium ovale (PO) appears to be rare
in the surveyed regions of the country.
The responses we received from the prescribers (table 12) do not support the findings from a
records review we conducted (table 13), where about 38,874 malaria-confirmed persons
treated in 15 HFs (5 hospitals and 10 HCs) showed an average of 60.4% PF, 38.4% PV, and
SIAPS/PMI - AMDM Scale-Up Sites Baseline Assessment
12
1.3% mixed in 2002. In 2003 E.C., on the other hand, 24,954 malaria-confirmed persons
were treated and 49.5%, 49.8%, and 0.7% were PF, PV, and mixed, respectively. The data in
2002 is approximately consistent with the national PF/PV ratio, which is reported to be 60%
for PF and 40% for PV. However, in 2003 an almost equal number of PF and PV cases were
treated at these HFs, indicating an instability of the proportion, which may have an impact on
the type of medicines supplied to treat patients.
As shown in tables 13 and 14 below, the total number of cases treated (94,229 in 2002 and
64,255 in 2003 E.C.) is greater than the total number of confirmed cases (38,874 in 2002 and
24,954 in 2003 E.C.). This may be attributable to either poor record keeping or treatment of
patients without laboratory confirmation (59% in 2002 and 61% in 2003 E.C.). The large
gaps in the findings indicate a need to improve data quality and look at the capacity of
laboratories to make species differentiation accurately and consistently, as well as ensure that
all patients are diagnosed before they receive treatment for malaria.
Table 13. Malaria Prevalence Findings from Records Review at Targeted HFs in 2002 E.C.
Name of HF Total Treated PF Total PV Total Mixed Total
Adare Hospital 5,760 2,260 2,917 74
Addis Zemen Health Center 18,219 5,965 1,455 141
Aleta Wondo Town Health Center 674 366 581 11
Assosa Hospital 1,673 197 852 2
Bati Health Center 326 121 41 1
Dangila Health Center 1,235 336 874 5
Dil Chora Hospital 6 5 1 0
Harbu Health Center 5,460 2,206 3,254 0
Jijiga Health Center 4 4 0 0
Koladiba Health Center 25,940 4,078 1,167 89
Kombolcha Health Center 600 475 95 30
National Hospital 2,402 345 10 7
Wolkite Health Center 2,775 1,731 1,023 21
Woreta Health Center 26,647 5,362 2,252 108
Yergalem Hospital 2,508 20 392 0
Grand Total 94,229 23,471 14,914 489
Table 14. Malaria Prevalence Findings From Records Review at Targeted HFs in 2003 E.C.
Name of HF Total Treated PF Total PV Total Mixed Total
Adare Hospital 2,364 666 1,575 43
Aleta Wondo Town Health Center
1,092 237 1,222 4
Assosa Health Center 1,315 152 724 0
Bati Health Center 1,748 464 198 4
Dangila Health Center 1,275 210 1,064 1
Dil Chora Hospital 6 2 4 0
Dilla Town Health Center 7,797 1,776 1,401 5
Haike Health Center 1,950 48 86 0
Harbu Health Center 1,485 154 1,331 0
Jijiga Health Center 2 1 1 0
Koladiba Health Center 11,686 1,155 1,230 24
Legehare Health Center 9 4 5 0
Survey Findings and Analysis
13
Name of HF Total Treated PF Total PV Total Mixed Total
Melkawerer Health Center 11,982 3,435 1,514 2
Metema Hospital 14,890 2,186 464 13
National Hospital 1,396 403 7 5
Wolkite Health Center 2,775 1,424 1,292 59
Yergalem Hospital 2,483 38 312 9
Grand Total 64,255 12,355 12,430 169
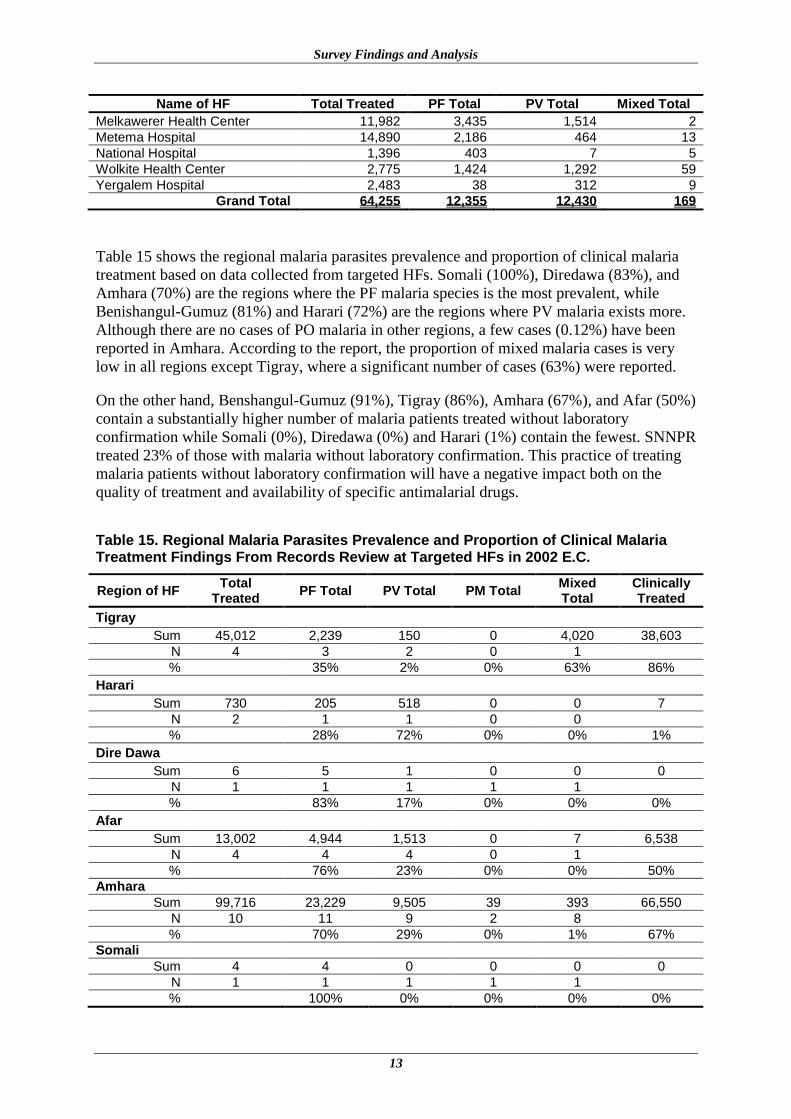
Table 15 shows the regional malaria parasites prevalence and proportion of clinical malaria
treatment based on data collected from targeted HFs. Somali (100%), Diredawa (83%), and
Amhara (70%) are the regions where the PF malaria species is the most prevalent, while
Benishangul-Gumuz (81%) and Harari (72%) are the regions where PV malaria exists more.
Although there are no cases of PO malaria in other regions, a few cases (0.12%) have been
reported in Amhara. According to the report, the proportion of mixed malaria cases is very
low in all regions except Tigray, where a significant number of cases (63%) were reported.
On the other hand, Benshangul-Gumuz (91%), Tigray (86%), Amhara (67%), and Afar (50%)
contain a substantially higher number of malaria patients treated without laboratory
confirmation while Somali (0%), Diredawa (0%) and Harari (1%) contain the fewest. SNNPR
treated 23% of those with malaria without laboratory confirmation. This practice of treating
malaria patients without laboratory confirmation will have a negative impact both on the
quality of treatment and availability of specific antimalarial drugs.
Table 15. Regional Malaria Parasites Prevalence and Proportion of Clinical Malaria Treatment Findings From Records Review at Targeted HFs in 2002 E.C.
Region of HF Total
Treated PF Total PV Total PM Total
Mixed Total
Clinically Treated
Tigray
Sum 45,012 2,239 150 0 4,020 38,603
N 4 3 2 0 1
% 35% 2% 0% 63% 86%
Harari
Sum 730 205 518 0 0 7
N 2 1 1 0 0
% 28% 72% 0% 0% 1%
Dire Dawa
Sum 6 5 1 0 0 0
N 1 1 1 1 1
% 83% 17% 0% 0% 0%
Afar
Sum 13,002 4,944 1,513 0 7 6,538
N 4 4 4 0 1
% 76% 23% 0% 0% 50%
Amhara
Sum 99,716 23,229 9,505 39 393 66,550
N 10 11 9 2 8
% 70% 29% 0% 1% 67%
Somali
Sum 4 4 0 0 0 0
N 1 1 1 1 1
% 100% 0% 0% 0% 0%
SIAPS/PMI - AMDM Scale-Up Sites Baseline Assessment
14
Region of HF Total
Treated PF Total PV Total PM Total
Mixed Total
Clinically Treated
Benshangul-Gumuz
Sum 11,862 197 852 0 2 10,811
N 2 1 1 0 1
% 19% 81% 0% 0% 91%
SNNPR
Sum 77,084 25,419 33,675 0 106 17,884
N 13 11 11 3 4
% 43% 57% 0% 0% 23%
Grand Total
Sum 247,416 56,242 46,214 39 4,528 140,393
N 37 33 30 7 17
% 53% 43% 0% 4% 57%
Knowledge of Providers
The assessment was also designed to determine the level of knowledge of the key technical
personnel (i.e., prescribers, pharmacy staff, and laboratory staff) at HFs regarding malaria
treatment and prevention.
The responses to the questions posed will aid in planning further training and development of
learning aids to improve rational prescribing, rational dispensing, and proper counseling—all
of which play a key role in achieving treatment goals and promoting better response to
treatment. Responses considered correct are based on the Malaria Diagnosis and Treatment
Guideline for Health Workers in Ethiopia (2nd edition, July 2004).
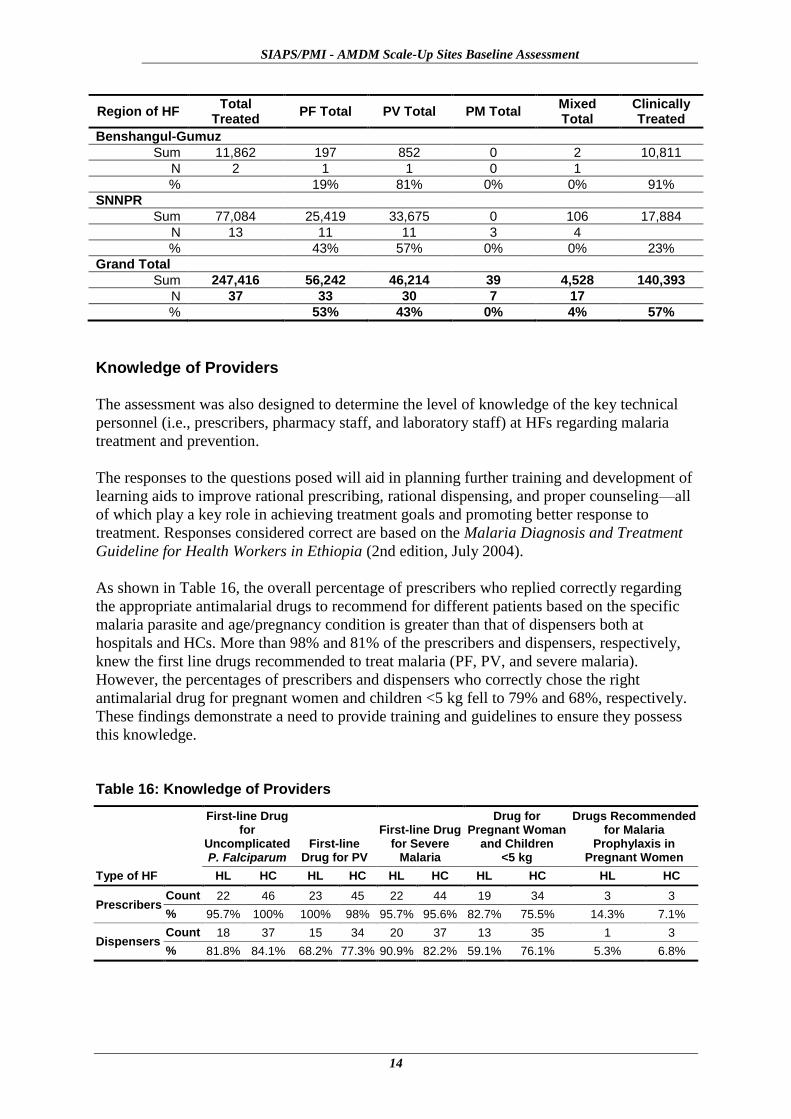
As shown in Table 16, the overall percentage of prescribers who replied correctly regarding
the appropriate antimalarial drugs to recommend for different patients based on the specific
malaria parasite and age/pregnancy condition is greater than that of dispensers both at
hospitals and HCs. More than 98% and 81% of the prescribers and dispensers, respectively,
knew the first line drugs recommended to treat malaria (PF, PV, and severe malaria).
However, the percentages of prescribers and dispensers who correctly chose the right
antimalarial drug for pregnant women and children <5 kg fell to 79% and 68%, respectively.
These findings demonstrate a need to provide training and guidelines to ensure they possess
this knowledge.
Table 16: Knowledge of Providers
Type of HF
First-line Drug for
Uncomplicated P. Falciparum
First-line Drug for PV
First-line Drug for Severe
Malaria
Drug for Pregnant Woman
and Children <5 kg
Drugs Recommended for Malaria
Prophylaxis in Pregnant Women
HL HC HL HC HL HC HL HC HL HC
Prescribers Count 22 46 23 45 22 44 19 34 3 3
% 95.7% 100% 100% 98% 95.7% 95.6% 82.7% 75.5% 14.3% 7.1%
Dispensers Count 18 37 15 34 20 37 13 35 1 3
% 81.8% 84.1% 68.2% 77.3% 90.9% 82.2% 59.1% 76.1% 5.3% 6.8%

Survey Findings and Analysis
15
Staffing Status
We obtained information on the staff categories and the extent of their qualifications in the
pharmacy and laboratory units to determine staffing patterns and their adequacy to conduct
and support the proper diagnosis, pharmaceutical supply and dispensing, and counseling
services at their facilities.
Table 17: Pharmacy Staff at Hospital and HC
Type of HF Region of the HF Pharmacist Druggist
Pharmacy technician
Pharmacy clerk
Hospital
Tigray (n=3) 13 4 11 0
Harari (n=1) 4 12 . 2
Dire Dawa (n=1) 9 4 . 2
Afar (n=1) 1 3 . .
Amhara (n=5) 26 38 5 6
Somali (n=1) 2 7 . .
Benshangul-Gumuz (n=2) 4 10 2 2
SNNPR (n=7) 24 53 8 12
Sum 83 131 26 24
HC
Tigray (n=6) 0 9 13 0
Harari (n=1) 0 2 0 0
Dire Dawa (n=4) 1 9 . 0
Afar (n=2) 1 5 . 1
Amhara (n=16) 10 37 8 10
Somali (n=2) 1 3 . .
Benshangul-Gumuz (n=5) . 7 5 .
SNNPR (n=10) 4 25 7 0
Sum 17 97 33 11
Grand Total 100 228 59 35
In general, the assessment team found there were 83 pharmacists, and 157 druggists and
pharmacy technicians in the 21 assessed hospitals (Table 17). On the other hand, we found
100 pharmacists, 287 druggists and pharmacy technicians, and 35 data clerks in the assessed
46 HCs.
Product Availability
A total of 31 key tracer medicines and other products (of which approximately 29% are
laboratory products) used in malaria, TB, and HIV/OI management were selected for
assessing availability and expiry.
The assessment revealed that the overall availability of AMDs is 83% at hospitals and 74% at
HCs. The availability of an AMD (chloroquine) for treating PV malaria is better than that for
PF malaria (artemether-lumefantrine, or AL) both at hospitals and HCs. The availability of
chloroquine is 78% and 72%, at hospitals and HCs, respectively, while the availability of AL
is 91% and 83%, respectively.
Quinine tablets, which are recommended for treatment of uncomplicated PF malaria in
pregnant women during the first trimester and in children under 5kg, are not available at 13%
SIAPS/PMI - AMDM Scale-Up Sites Baseline Assessment
16
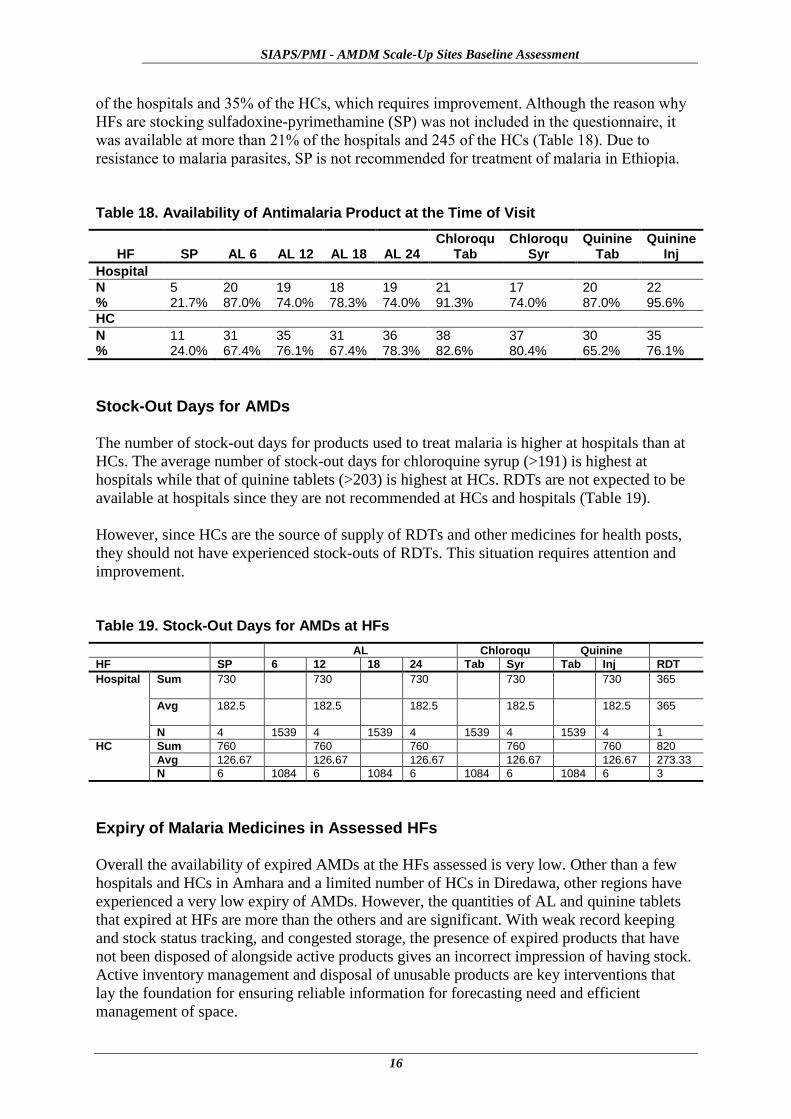
of the hospitals and 35% of the HCs, which requires improvement. Although the reason why
HFs are stocking sulfadoxine-pyrimethamine (SP) was not included in the questionnaire, it
was available at more than 21% of the hospitals and 245 of the HCs (Table 18). Due to
resistance to malaria parasites, SP is not recommended for treatment of malaria in Ethiopia.
Table 18. Availability of Antimalaria Product at the Time of Visit
HF SP AL 6 AL 12 AL 18 AL 24 Chloroqu
Tab Chloroqu
Syr Quinine
Tab Quinine
Inj
Hospital
N %
5 21.7%
20 87.0%
19 74.0%
18 78.3%
19 74.0%
21 91.3%
17 74.0%
20 87.0%
22 95.6%
HC
N %
11 24.0%
31 67.4%
35 76.1%
31 67.4%
36 78.3%
38 82.6%
37 80.4%
30 65.2%
35 76.1%
Stock-Out Days for AMDs
The number of stock-out days for products used to treat malaria is higher at hospitals than at
HCs. The average number of stock-out days for chloroquine syrup (>191) is highest at
hospitals while that of quinine tablets (>203) is highest at HCs. RDTs are not expected to be
available at hospitals since they are not recommended at HCs and hospitals (Table 19).
However, since HCs are the source of supply of RDTs and other medicines for health posts,
they should not have experienced stock-outs of RDTs. This situation requires attention and
improvement.
Table 19. Stock-Out Days for AMDs at HFs
AL Chloroqu Quinine
HF SP 6 12 18 24 Tab Syr Tab Inj RDT
Hospital Sum 730 730 730 730 730 365
Avg 182.5 182.5 182.5 182.5 182.5 365
N 4 1539 4 1539 4 1539 4 1539 4 1
HC Sum 760 760 760 760 760 820
Avg 126.67 126.67 126.67 126.67 126.67 273.33
N 6 1084 6 1084 6 1084 6 1084 6 3
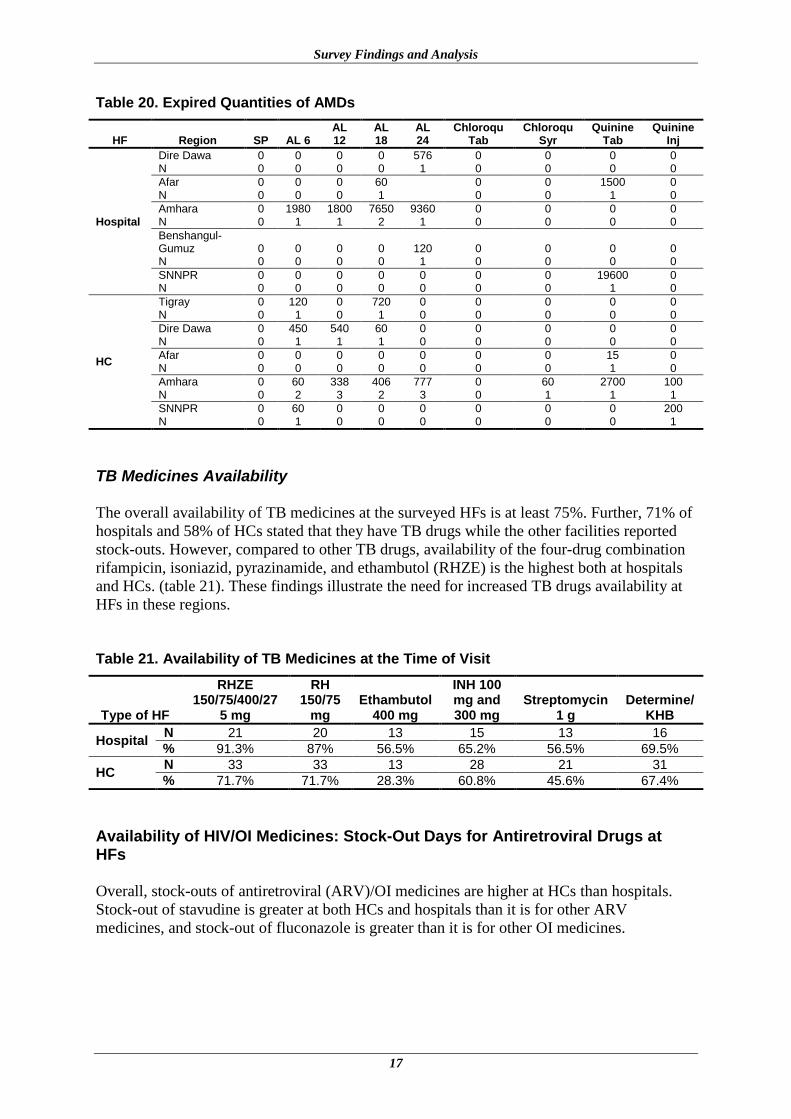
Expiry of Malaria Medicines in Assessed HFs
Overall the availability of expired AMDs at the HFs assessed is very low. Other than a few
hospitals and HCs in Amhara and a limited number of HCs in Diredawa, other regions have
experienced a very low expiry of AMDs. However, the quantities of AL and quinine tablets
that expired at HFs are more than the others and are significant. With weak record keeping
and stock status tracking, and congested storage, the presence of expired products that have
not been disposed of alongside active products gives an incorrect impression of having stock.
Active inventory management and disposal of unusable products are key interventions that
lay the foundation for ensuring reliable information for forecasting need and efficient
management of space.
Survey Findings and Analysis
17
Table 20. Expired Quantities of AMDs
HF Region SP AL 6 AL 12
AL 18
AL 24
Chloroqu Tab
Chloroqu Syr
Quinine Tab
Quinine Inj
Hospital
Dire Dawa N
0 0
0 0
0 0
0 0
576 1
0 0
0 0
0 0
0 0
Afar N
0 0
0 0
0 0
60 1
0 0
0 0
1500 1
0 0
Amhara N
0 0
1980 1
1800 1
7650 2
9360 1
0 0
0 0
0 0
0 0
Benshangul-Gumuz N
0 0
0 0
0 0
0 0
120 1
0 0
0 0
0 0
0 0
SNNPR N
0 0
0 0
0 0
0 0
0 0
0 0
0 0
19600 1
0 0
HC
Tigray N
0 0
120 1
0 0
720 1
0 0
0 0
0 0
0 0
0 0
Dire Dawa N
0 0
450 1
540 1
60 1
0 0
0 0
0 0
0 0
0 0
Afar N
0 0
0 0
0 0
0 0
0 0
0 0
0 0
15 1
0 0
Amhara N
0 0
60 2
338 3
406 2
777 3
0 0
60 1
2700 1
100 1
SNNPR N
0 0
60 1
0 0
0 0
0 0
0 0
0 0
0 0
200 1
TB Medicines Availability
The overall availability of TB medicines at the surveyed HFs is at least 75%. Further, 71% of
hospitals and 58% of HCs stated that they have TB drugs while the other facilities reported
stock-outs. However, compared to other TB drugs, availability of the four-drug combination
rifampicin, isoniazid, pyrazinamide, and ethambutol (RHZE) is the highest both at hospitals
and HCs. (table 21). These findings illustrate the need for increased TB drugs availability at
HFs in these regions.
Table 21. Availability of TB Medicines at the Time of Visit
Type of HF
RHZE 150/75/400/27
5 mg
RH 150/75
mg Ethambutol
400 mg
INH 100 mg and 300 mg
Streptomycin 1 g
Determine/ KHB
Hospital N 21 20 13 15 13 16
% 91.3% 87% 56.5% 65.2% 56.5% 69.5%
HC N 33 33 13 28 21 31
% 71.7% 71.7% 28.3% 60.8% 45.6% 67.4%
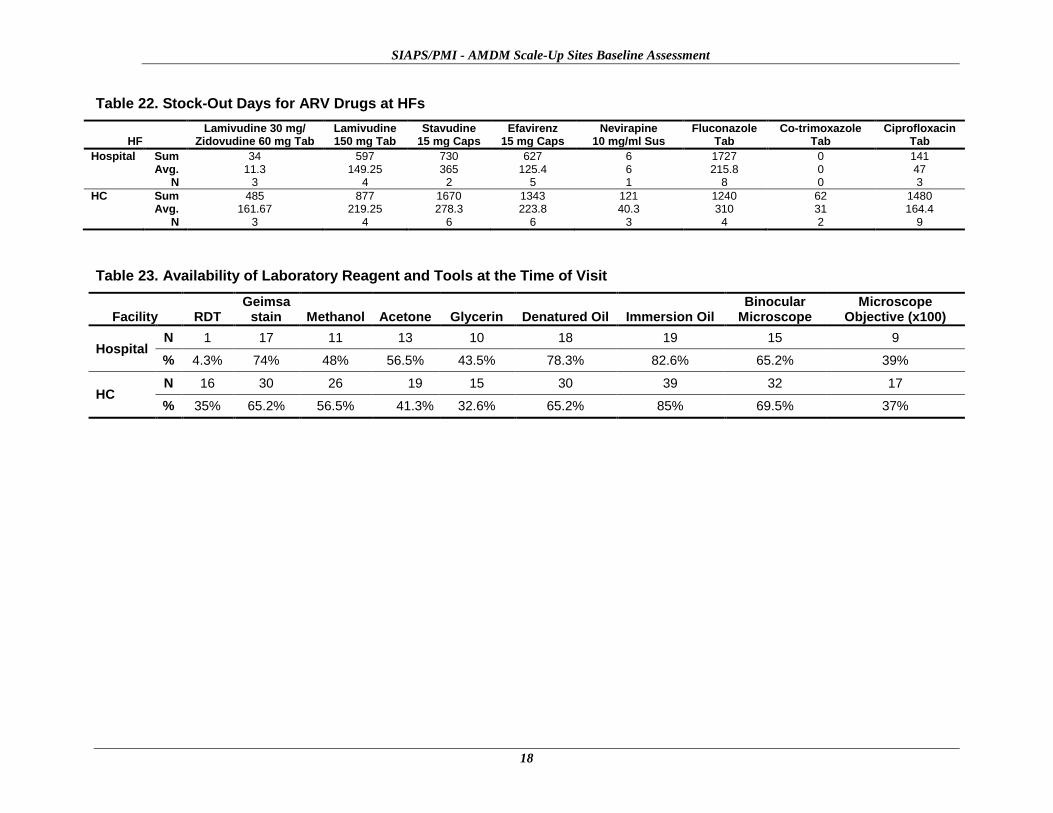
Availability of HIV/OI Medicines: Stock-Out Days for Antiretroviral Drugs at HFs
Overall, stock-outs of antiretroviral (ARV)/OI medicines are higher at HCs than hospitals.
Stock-out of stavudine is greater at both HCs and hospitals than it is for other ARV
medicines, and stock-out of fluconazole is greater than it is for other OI medicines.
SIAPS/PMI - AMDM Scale-Up Sites Baseline Assessment
18
Table 22. Stock-Out Days for ARV Drugs at HFs
HF Lamivudine 30 mg/
Zidovudine 60 mg Tab Lamivudine 150 mg Tab
Stavudine 15 mg Caps
Efavirenz 15 mg Caps
Nevirapine 10 mg/ml Sus
Fluconazole Tab
Co-trimoxazole Tab
Ciprofloxacin Tab
Hospital Sum Avg.
N
34 11.3
3
597 149.25
4
730 365
2
627 125.4
5
6 6 1
1727 215.8
8
0 0 0
141 47 3
HC Sum Avg.
N
485 161.67
3
877 219.25
4
1670 278.3
6
1343 223.8
6
121 40.3
3
1240 310
4
62 31 2
1480 164.4
9
Table 23. Availability of Laboratory Reagent and Tools at the Time of Visit
Facility RDT Geimsa
stain Methanol Acetone Glycerin Denatured Oil Immersion Oil Binocular
Microscope Microscope
Objective (x100)
Hospital N 1 17 11 13 10 18 19 15 9
% 4.3% 74% 48% 56.5% 43.5% 78.3% 82.6% 65.2% 39%
HC N 16 30 26 19 15 30 39 32 17
% 35% 65.2% 56.5% 41.3% 32.6% 65.2% 85% 69.5% 37%
Survey Findings and Analysis
19
Laboratory Commodities Availability
To assess the availability of laboratory-related products, the team used nine tracer products
including microscopes. The findings indicate that availability of key laboratory-related
products and supplies for microscopic malaria diagnosis is low both at hospitals and HCs. For
example, Geimsa stain was available at 74% of the hospitals and only 65% of the HCs,
demonstrating an inadequate supply of this reagent to diagnose malaria patients. Similarly,
not all hospitals (65%) and HCs (69%) have binocular microscopes. Only 39% of the
hospitals have microscope objectives suitable for differentiating species (x100 objective), and
just over 82% have immersion oil (Table 23).
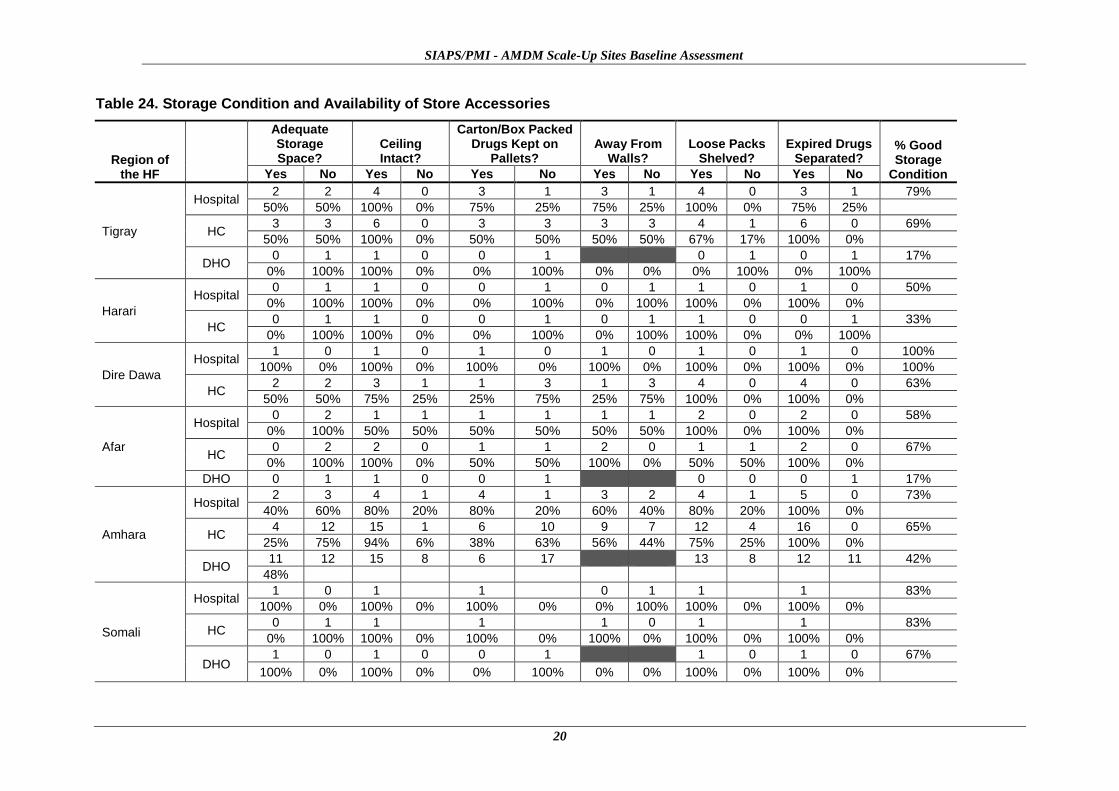
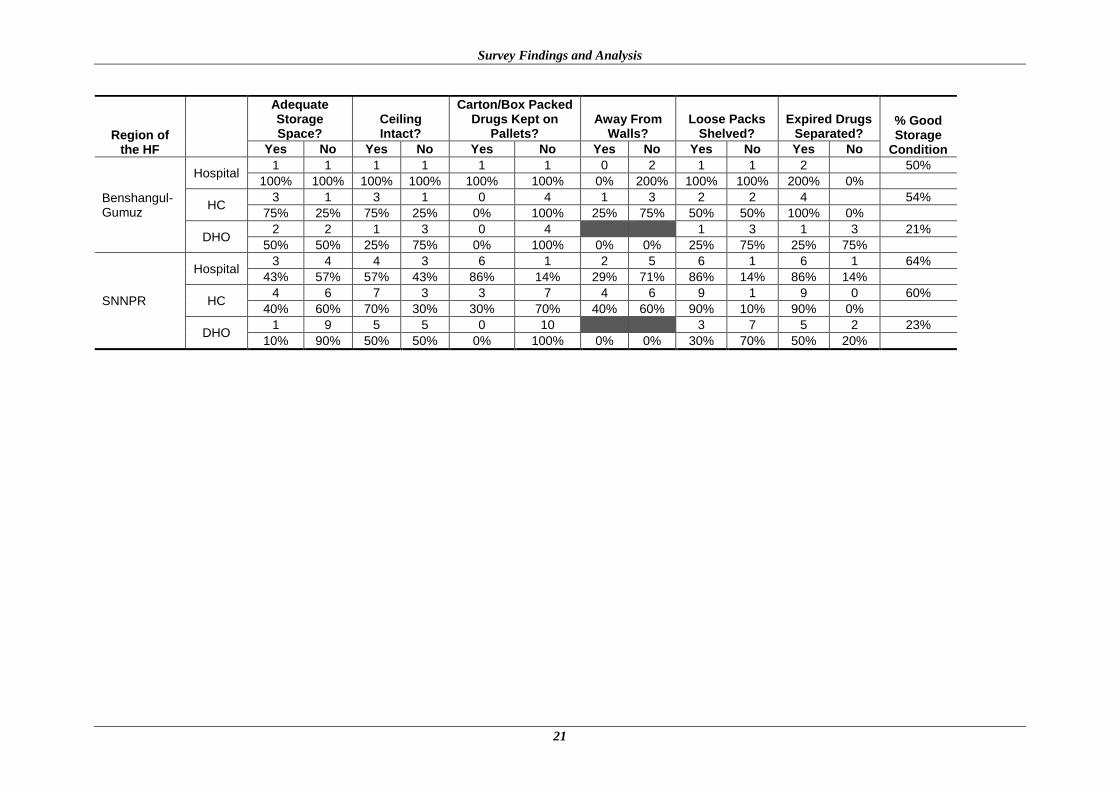
Storage and Store Accessories
Key indicators considered in assessing storage and handling of medicines include availability
of shelves, pallets, refrigerators, organized storage, segregation and disposal of expired or
obsolete products, and incidence of theft or loss. Medicines must be handled properly and
stored under the right conditions, expired medicines must be disposed of properly, and
security must be maintained. Medicines that are not properly handled will be adversely
affected, and their effectiveness and safety will be compromised to a degree that they either
will not help the patient or may bring harm to the patient. Because medicines are extremely
sensitive products that can easily be affected and lose their medical properties, findings of
improper store management practices and lack of concern or required attention by
management in the assessment is quite troubling.
The assessment in general showed that the storage conditions at all levels are inadequate and
do not meet professional standards. Many expired products congest the space, which could
otherwise be used for storing useable products. About 38% of assessed HCs and 30% of the
hospitals do not have good storage conditions. Only 54% of the hospitals and 30% of the HCs
have adequate storage spaces for medicines, indicating that storage space improvement is
needed. The overall segregation of expired drugs from active ones is very low in all regions
but better at hospitals than at the HCs.
SIAPS/PMI - AMDM Scale-Up Sites Baseline Assessment
20
Table 24. Storage Condition and Availability of Store Accessories
Region of the HF
Adequate Storage Space?
Ceiling Intact?
Carton/Box Packed Drugs Kept on
Pallets? Away From
Walls? Loose Packs
Shelved? Expired Drugs
Separated? % Good Storage
Condition Yes No Yes No Yes No Yes No Yes No Yes No
Tigray
Hospital 2 2 4 0 3 1 3 1 4 0 3 1 79%
50% 50% 100% 0% 75% 25% 75% 25% 100% 0% 75% 25%
HC 3 3 6 0 3 3 3 3 4 1 6 0 69%
50% 50% 100% 0% 50% 50% 50% 50% 67% 17% 100% 0%
DHO 0 1 1 0 0 1 0 1 0 1 17%
0% 100% 100% 0% 0% 100% 0% 0% 0% 100% 0% 100%
Harari
Hospital 0 1 1 0 0 1 0 1 1 0 1 0 50%
0% 100% 100% 0% 0% 100% 0% 100% 100% 0% 100% 0%
HC 0 1 1 0 0 1 0 1 1 0 0 1 33%
0% 100% 100% 0% 0% 100% 0% 100% 100% 0% 0% 100%
Dire Dawa
Hospital 1 0 1 0 1 0 1 0 1 0 1 0 100%
100% 0% 100% 0% 100% 0% 100% 0% 100% 0% 100% 0% 100%
HC 2 2 3 1 1 3 1 3 4 0 4 0 63%
50% 50% 75% 25% 25% 75% 25% 75% 100% 0% 100% 0%
Afar
Hospital 0 2 1 1 1 1 1 1 2 0 2 0 58%
0% 100% 50% 50% 50% 50% 50% 50% 100% 0% 100% 0%
HC 0 2 2 0 1 1 2 0 1 1 2 0 67%
0% 100% 100% 0% 50% 50% 100% 0% 50% 50% 100% 0%
DHO 0 1 1 0 0 1 0 0 0 1 17%
Amhara
Hospital 2 3 4 1 4 1 3 2 4 1 5 0 73%
40% 60% 80% 20% 80% 20% 60% 40% 80% 20% 100% 0%
HC 4 12 15 1 6 10 9 7 12 4 16 0 65%
25% 75% 94% 6% 38% 63% 56% 44% 75% 25% 100% 0%
DHO 11 12 15 8 6 17 13 8 12 11 42%
48%
Somali
Hospital 1 0 1 1 0 1 1 1 83%
100% 0% 100% 0% 100% 0% 0% 100% 100% 0% 100% 0%
HC 0 1 1 1 1 0 1 1 83%
0% 100% 100% 0% 100% 0% 100% 0% 100% 0% 100% 0%
DHO 1 0 1 0 0 1 1 0 1 0 67%
100% 0% 100% 0% 0% 100% 0% 0% 100% 0% 100% 0%
Survey Findings and Analysis
21
Region of the HF
Adequate Storage Space?
Ceiling Intact?
Carton/Box Packed Drugs Kept on
Pallets? Away From
Walls? Loose Packs
Shelved? Expired Drugs
Separated? % Good Storage
Condition Yes No Yes No Yes No Yes No Yes No Yes No
Benshangul-Gumuz
Hospital 1 1 1 1 1 1 0 2 1 1 2 50%
100% 100% 100% 100% 100% 100% 0% 200% 100% 100% 200% 0%
HC 3 1 3 1 0 4 1 3 2 2 4 54%
75% 25% 75% 25% 0% 100% 25% 75% 50% 50% 100% 0%
DHO 2 2 1 3 0 4 1 3 1 3 21%
50% 50% 25% 75% 0% 100% 0% 0% 25% 75% 25% 75%
SNNPR
Hospital 3 4 4 3 6 1 2 5 6 1 6 1 64%
43% 57% 57% 43% 86% 14% 29% 71% 86% 14% 86% 14%
HC 4 6 7 3 3 7 4 6 9 1 9 0 60%
40% 60% 70% 30% 30% 70% 40% 60% 90% 10% 90% 0%
DHO 1 9 5 5 0 10 3 7 5 2 23%
10% 90% 50% 50% 0% 100% 0% 0% 30% 70% 50% 20%
SIAPS/PMI - AMDM Scale-Up Sites Baseline Assessment
22
Table 25: Region of the Health Facility * Expired Drugs Separated? Cross-tabulation
Expired drugs separated?
Total Yes No Unknown
Tigray 0 1 0 1
.0% 100.0% .0% 100.0%
Afar 0 1 0 1
.0% 100.0% .0% 100.0%
Amhara 12 11 0 23
52.2% 47.8% .0% 100.0%
Somali 1 0 0 1
100.0% .0% .0% 100.0%
Benshangul-Gumuz 1 3 0 4
25.0% 75.0% .0% 100.0%
SNNPR 5 2 3 10
50.0% 20.0% 30.0% 100.0%
Total 19 18 3 40
47.5% 45.0% 7.5% 100.0%
Table 26: HFs that Conducted Disposal of Obsolete/Unusable Malarial Drugs
Region of the HF
Obsolete/Unusable Malarial Drugs Disposed?
Yes No
Tigray
Hospital 2 2
50%
HC 6 0
100%
Harari
Hospital 1
100%
HC 1
100%
Dire Dawa
Hospital 0 1
0%
HC 2 2
50%
Afar
Hospital 2
100%
HC 2
100%
Amhara
Hospital 4 1
80%
HC 14 2
88%
Somali
Hospital 1 0
100%
HC 0 1
0%
Benshangul-Gumuz
Hospital 1 1
50%
HC 4 0
100%
SNNPR
Hospital 6 1
86%
HC 7 2
78%
Survey Findings and Analysis
23
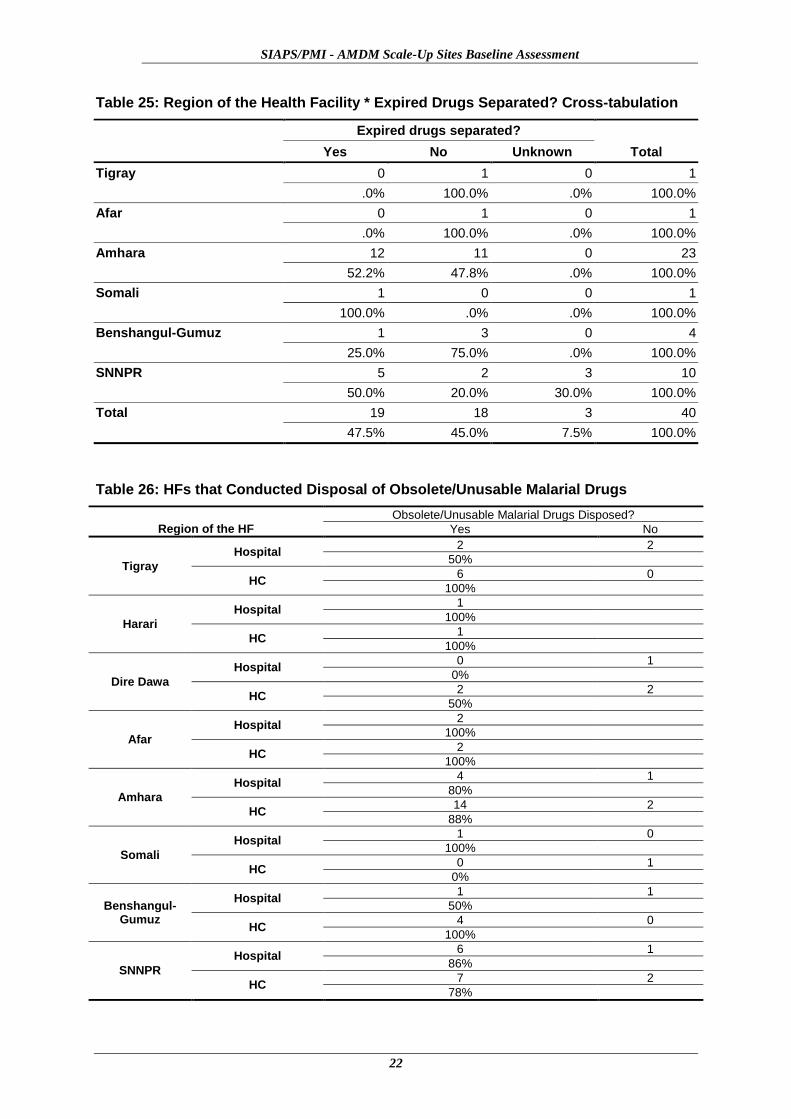
Table 26 shows the degree of disposal of obsolete/unusable malarial or drugs at the targeted
HFs in the regions surveyed. The disposal of obsolete/unusable malarial or drugs occurred in
most of the facilities—88% of HCs and 81% of hospitals. However, the accumulation of
unusable stocks of malaria commodities at the remaining facilities will present a challenge
regarding storage space and a risk of being mistakenly dispensed to patients. This calls for
immediate resolution.
Table 27. Type of HF * RDT Stored at the Right Temperature? * Region of the HF Cross-Tabulation
Region of the HF
RDT Stored at the Right Temperature?
Yes No Not Applicable
Tigray Hospital 4
HC 6
Harari Hospital 1
HC 1
Dire Dawa Hospital 1
HC 4
Afar Hospital 0 0 2
HC 1 1 0
Amhara Hospital 2 1 2
HC 13 3 0
Somali Hospital 1
HC 1
Benshangul-Gumuz Hospital 0 1 1
HC 3 0 1
SNNPR Hospital 1 2 4
HC 3 4 3
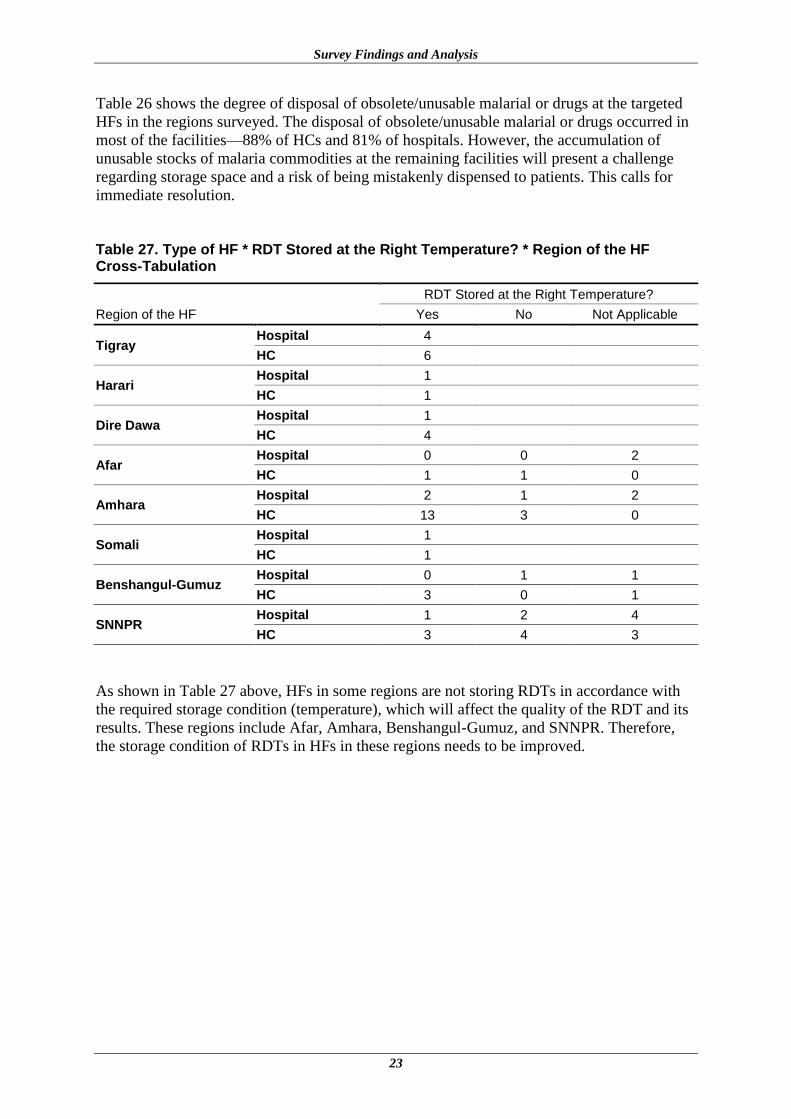
As shown in Table 27 above, HFs in some regions are not storing RDTs in accordance with
the required storage condition (temperature), which will affect the quality of the RDT and its
results. These regions include Afar, Amhara, Benshangul-Gumuz, and SNNPR. Therefore,
the storage condition of RDTs in HFs in these regions needs to be improved.
SIAPS/PMI - AMDM Scale-Up Sites Baseline Assessment
24
Table 28. Availability of Storage Equipment
Region of the Health Facility
Are Shelves Available?
Is Wooden Pallet
Available?
Is Filling Cabinet
Available? Is Computer Available?
Is Refrigerator Available?
Secure Door / Window
Available?
Overall % of Availability of Storage Equipment Yes No Yes No Yes No Yes No Yes No Yes No
Tigray Hospital 4 3 1 1 3 4 4 3 1
83% HC 6 6 0 2 4 6 6 5 1
% 100% 90% 30% 100% 100% 80%
Harari Hospital 1 1 0 1 1 0 1 0 1
42% HC 1 0 1 1 0 1 0 1 1
% 100% 50% 0% 50% 50% 0%
Dire Dawa Hospital 1 0 1 0 1 1 0 1 1 0
60% HC 3 1 1 3 4 2 2 4 3 1
% 80% 40% 0% 60% 100% 80%
Afar Hospital 0 2 2 1 1 0 2 1 1 1 1
34% HC 0 2 2 0 2 2 0 1 1 2 0
% 0% 0% 25% 50% 50% 80%
Amhara Hospital 5 0 5 0 3 2 5 0 5 0 5
71% HC 14 2 7 9 3 12 11 5 10 6 16
% 90% 57% 30% 76% 71% 100%
Somali Hospital 1 1 1 0 1 0 1 0 1
67% HC 2 1 0 2 0 2 0 2 2
% 100% 100% 33% 33% 33% 100%
Benshangul-Gumuz
Hospital 2 2 0 2 0 2 0 2 0 2 0
43% HC 5 0 5 0 5 0 5 1 4 0 5
% 100% 29% 29% 29% 43% 29%
SNNPR Hospital 7 7 0 4 3 7 0 7 0 7 0
73% HC 10 5 5 3 7 5 5 7 3 7 3
% 100% 63% 41% 71% 82% 82%

Survey Findings and Analysis
25
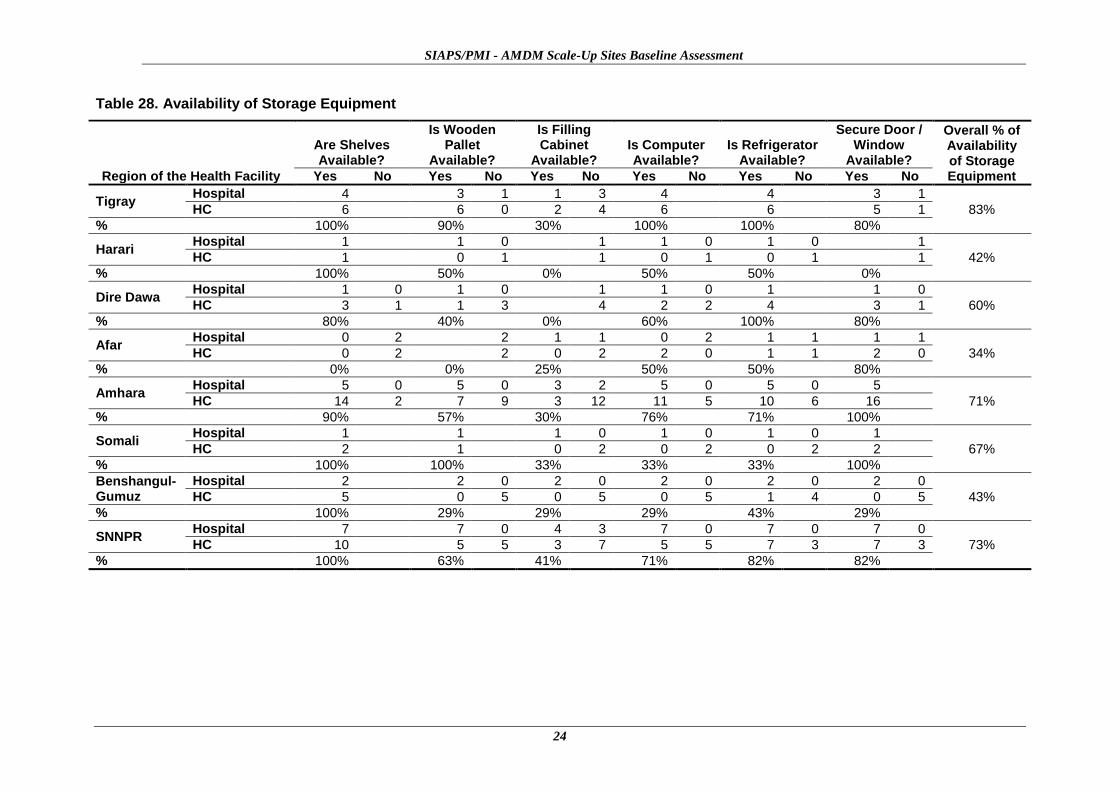
Proper store organization involving the appropriate storage equipment influences medicine
quality, proper inventory management, and ease of moving around in the store. As shown in
Table 28, 68% of the facilities have all the required storage equipment. Tigray facilities have
the best (83%) storage equipment and Afar has the fewest HFs (34%) with the required
storage equipment. Other regions need to improve the availability of storage equipment
required for high-quality storage of medicines.
Pharmaceutical Management Information System (PMIS)
Availability of proper stock recording and inventory control tools and accurate and
appropriate pharmaceutical management information are important prerequisites for a proper
pharmaceutical supply management system (PSMS). All transactions should be properly
recorded, processed, and reported to the next higher coordinating body for good planning in
the supply management process. Stock cards, dispensing registers, and stock status
monitoring forms are some of the essential tools required for maintaining proper stock
control, tracking expired medicines, monitoring rational medicine use, ensuring adherence,
and providing medicine consumption trends.
The default inventory control (issuing and receiving) document present at all levels is the
model — an official government form that is used by all public sector institutions as a
transaction document for commodities ranging from medicines to furniture to food items to
stationery. However, the model template does not provide for the technical information
required to manage pharmaceuticals. Use of the model has literally replaced the effective use
of standard pharmaceutical forms such as stock cards as inventory control tools. To make the
information system work, the appropriate technical forms must be available, correctly and
promptly filled out, and aggregated for reporting.
The assessment showed that inventory management tools are inadequate at all levels. For
example, 62% of the hospitals and only 24% of the HCs have treatment/dispensing registers.
However, all of the hospitals (100%) and 96% of the HCs have bin cards.
According to Table 29 below, an average of 71% of the HCs and 55% of the hospitals have
updated their bin cards in all regions. This gap in malpractice requires intervention to
improve current practice.

SIAPS/PMI - AMDM Scale-Up Sites Baseline Assessment
26
Table 29: Availability of PMIS Tools
Region of the HF
Are Treatment/Dispensing Registers Available?
Is Ordering/ Requisition Form
Available? Is Stock Card
Available? Is Bin Card Available?
Is Expiry/ Loss/Damage Report
Form Available?
Yes No Yes No Yes No Yes No Yes No
Tigray
Hospital 3 1 4 0 3 1 4 0 2 2
75% 100% 75% 100% 50%
HC 4 2 5 1 4 2 5 1 2 4
67% 83% 67% 83% 33%
Harari
Hospital 1 0 1 1 1 1
100% 100% 0% 100% 100%
HC 0 1 1 1 1 1
0% 100% 0% 100% 100%
Dire Dawa
Hospital 1 1 0 1 1 1
0% 100% 0% 100% 0%
HC 4 3 1 4 4 4
0% 75% 0% 100% 0%
Afar
Hospital 2 2 2 2 2
0% 0% 0% 100% 0%
HC 2 2 2 2 2
0% 0% 0% 100% 0%
Amhara
Hospital 3 2 5 5 0 5 0 2 3
60% 100% 100% 100% 40%
HC 1 15 16 4 11 15 1 3 13
6% 100% 27% 94% 19%
Somali Hospital
1 0 1 0 1 0 1 1
100% 100% 100% 100% 0%
HC 0 2 0 2 0 1 1 1
Survey Findings and Analysis
27
Region of the HF
Are Treatment/Dispensing Registers Available?
Is Ordering/ Requisition Form
Available? Is Stock Card
Available? Is Bin Card Available?
Is Expiry/ Loss/Damage Report
Form Available?
Yes No Yes No Yes No Yes No Yes No
0% 0% 0% 100% 0%
Beneshangul-
Gumuz
Hospital 2 0 2 0 2 0 2 1 1
100% 100% 100% 100% 50%
HC 2 3 3 2 2 2 4 0 5
40% 60% 50% 100% 0%
SNNPR
Hospital 4 3 6 1 4 3 7 0 4 3
57% 86% 57% 100% 57%
HC 8 2 2 8 9 1 3 7
80% 0 20% 90% 30%
SIAPS/PMI - AMDM Scale-Up Sites Baseline Assessment
28
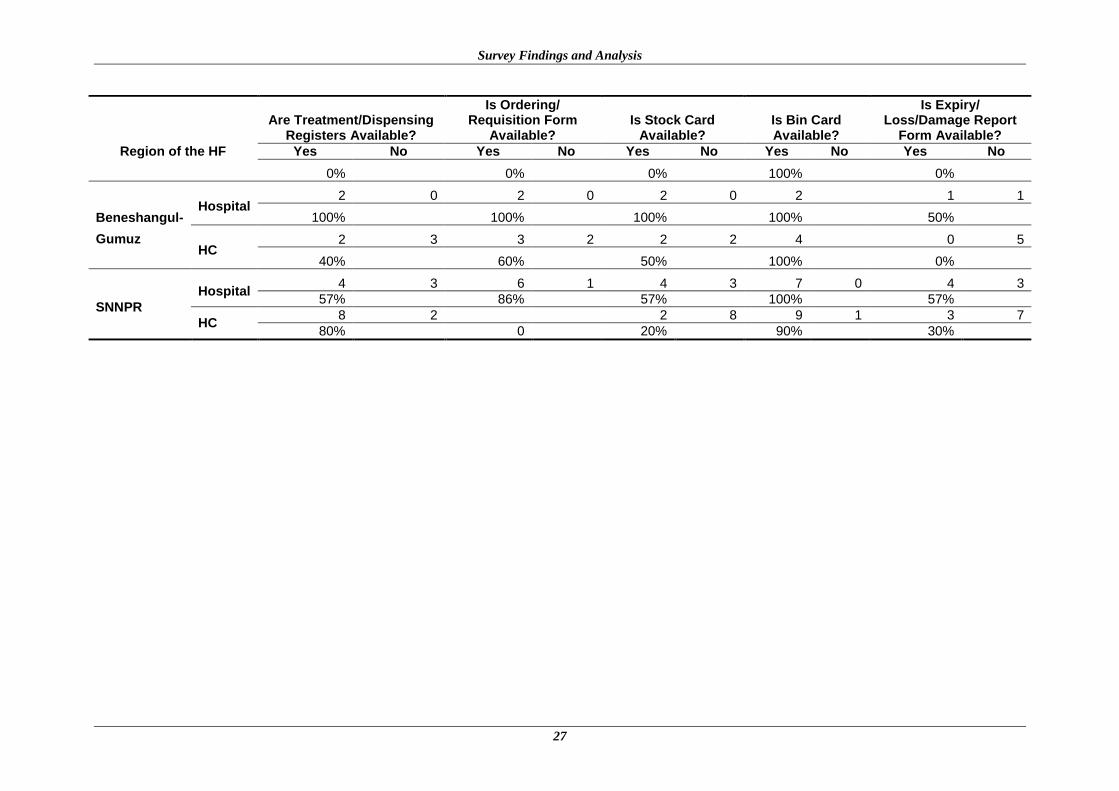
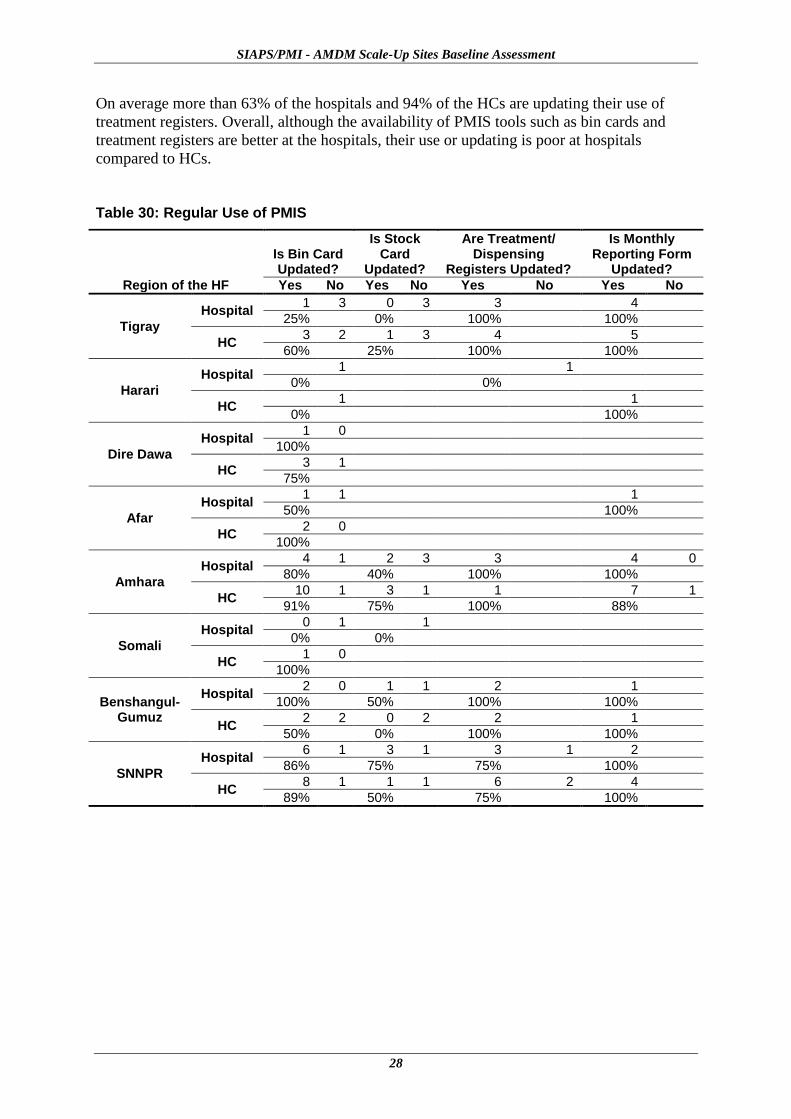
On average more than 63% of the hospitals and 94% of the HCs are updating their use of
treatment registers. Overall, although the availability of PMIS tools such as bin cards and
treatment registers are better at the hospitals, their use or updating is poor at hospitals
compared to HCs.
Table 30: Regular Use of PMIS
Region of the HF
Is Bin Card Updated?
Is Stock Card
Updated?
Are Treatment/ Dispensing
Registers Updated?
Is Monthly Reporting Form
Updated?
Yes No Yes No Yes No Yes No
Tigray
Hospital 1 3 0 3 3 4
25% 0% 100% 100%
HC 3 2 1 3 4 5
60% 25% 100% 100%
Harari
Hospital 1 1
0% 0%
HC 1 1
0% 100%
Dire Dawa
Hospital 1 0
100%
HC 3 1
75%
Afar
Hospital 1 1 1
50% 100%
HC 2 0
100%
Amhara
Hospital 4 1 2 3 3 4 0
80% 40% 100% 100%
HC 10 1 3 1 1 7 1
91% 75% 100% 88%
Somali
Hospital 0 1 1
0% 0%
HC 1 0
100%
Benshangul-Gumuz
Hospital 2 0 1 1 2 1
100% 50% 100% 100%
HC 2 2 0 2 2 1
50% 0% 100% 100%
SNNPR
Hospital 6 1 3 1 3 1 2
86% 75% 75% 100%
HC 8 1 1 1 6 2 4
89% 50% 75% 100%

29
CONCLUSION AND RECOMMENDATIONS
Availability and Expiry Management
The assessment revealed that overall availability of AMDs is 83% at hospitals and 74% at
HCs. However, some facilities reported stock-outs and shortages of the AMDs, including
quinine tablets, for treatment of uncomplicated PF malaria in pregnant women during the first
trimester and children under 5 kg. The shortages and stock-outs of medicines could arise as a
result of several factors in the supply chain system. These include the use of a push system of
distribution or improper quantification practices, which fail to address the HFs’ need for the
medicines. A push system not only affects the availability of medicines but discourages the
development of an active system of record-keeping, medication use monitoring,
consumption-based ordering, and other more precise stock management procedures.
The overall availability of expired AMDs at the HFs assessed was found to be very low
except at a few hospitals and HCs. However, the quantities of AL and quinine tablets that
expired at HFs are greater than the others, which is significant. Proper quantification and
active inventory management at all levels of the supply chain system will help increase
availability of medicines and reduce risk of expiry at the HFs. Therefore, it is advisable to
establish and strengthen a system of good record keeping on the transactions made regarding
medicines, including those dispensed to patients, to obtain reliable consumption data for
resupply and quantification. In line with strengthening the supply chain system at all levels,
regular stock rotation and the establishment of a uniform system for redistribution of excess
and near expiry products will support efforts to reduce expiry and can contribute to
improving availability at HFs. Finally, timely and safe disposal of unusable products will
help to reduce risks to patients and free limited space occupied by these unusable products.
Storage, Inventory Control, and Pharmaceutical Management Information System
The assessment also determined that most of the HFs have shortages of basic storage
equipment, such as pallets and shelves, as well as a limited amount of adequate storage space.
This will negatively impact medicine quality, proper inventory management, and ease of
moving around in the store. To solve these challenges, making available adequate pallets and
shelves in addition to proper reorganization of the products within the available space will
improve the storage conditions at the facilities and program level (Woreda and Zonal Health
Office) medicine stores. Separation of non-drug items (such as office furniture, bicycles, and
cement) from medicines and storing them in separate rooms will also free up space for
medicine storage and contribute to maintaining the quality of medicines and avoiding
damages.
Proper inventory management tools at all levels will improve the accuracy and availability of
appropriate pharmaceutical management information systems. The majority of the facilities
assessed did not have a suitable tool such as dispensing registers for monitoring rational
prescribing and dispensing practices at facilities. In addition, although the availability of
stock transaction cards was encouraging, most of the HFs did not regularly update them.
Without proper inventory and a patient and medication management system, ensuring
uninterrupted supply; controlling pilferage and loss; monitoring expiry, medicine use, adverse
SIAPS/PMI - AMDM Scale-Up Sites Baseline Assessment
30
drug events, and resistance; reporting on uptake and scale-up; and obtaining reliable data for
forecasting and budgeting will be extremely difficult.
Strategies and interventions should be in place to ensure that stock movements at all storage
levels are recorded in bin cards or stock cards and regularly updated. In addition, patient
treatment and dispensing registers should be institutionalized at the HFs to monitor the
rational use of medicines and obtain reliable consumption data for re-supply or quantification
exercises. The introduction of periodic monitoring checklists is also helpful in monitoring
regular progress in planned activities.
Human Capacity and Knowledge
The assessment was also designed to reveal the level of knowledge of the key technical
personnel (i.e., prescribers, pharmacy staff, and laboratory staff) at HFs regarding malaria
treatment and prevention.
Although the overall percentage of prescribers with proper knowledge of the appropriate
antimalarial drugs recommended for treatment of malaria patients was greater than that of
dispensers, both groups of providers require training and encouragement to adhere to malaria
treatment guidelines to ensure full knowledge. Without proper knowledge on the selection of
the right drug for specific malaria parasite and patient groups, rational prescribing and
dispensing practices cannot be ensured—which will eventually affect the quality and
compliance of malaria treatment of patients. Therefore, in addition to assigning an
appropriate level of pharmacy staffs and prescribers across the board, it is advisable to
provide pre- and in-service training to all sectors that manage malaria cases and products.
Other Issues
The current (June 2004) National Malaria Diagnosis and Treatment Guidelines
recommend that malaria treatment of all clinically suspected cases be based on laboratory
diagnosis of the parasite species using microscopic methods at hospitals and HCs and
RDT diagnosis at health posts. Nonetheless, since the percentage of prescribers whose
patients receive prompt laboratory diagnosis is not appreciable, this practice needs to be
improved both at hospitals and HCs in all regions.
We observed the co-location of district health stores with HC stores in many places.
Although this arrangement can be beneficial due to its use of the same personnel for
management, it is likely to create congestion of space, constraining staff and
compromising equity. The two services must be separated and each must have its own
building and staffing for efficiency, equity, and accountability.
HFs should work hard to establish and strengthen drug and therapeutic committees as a
mechanism for ensuring transparent and planned procurement, promoting rational
medicine use, supporting accountability, and contributing to the sustainability and
institutionalization of initiatives and policies.


![T he ournal of the nti -S eismic ystems nternational ...msp.org/siaps/2011/2-1/siaps-v2-n1-p03-s.pdf · A case in point is an isolation project in South Korea[EESK 2007]where a group](https://img.dokumen.tips/doc/110x75/5f7824aee0d06207b3661cf2/t-he-ournal-of-the-nti-s-eismic-ystems-nternational-msporgsiaps20112-1siaps-v2-n1-p03-spdf.jpg)