Embed Size (px)
Citation preview
75F0002MIE - 99009
Should the Low Income Cutoffsbe updated?A Discussion Paper
Prepared by:Cathy CottonMaryanne WebberYves Saint-Pierre
December 1999
Data in many forms
Statistics Canada disseminates data in a variety of forms. In addition to publications, both standard and specialtabulations are offered. Data are available on the Internet, compact disc, diskette, computer printouts, microfiche andmicrofilm, and magnetic tape. Maps and other geographic reference materials are available for some types of data.Direct online access to aggregated information is possible through CANSIM, Statistics Canada’s machine-readabledatabase and retrieval system.
How to obtain more information
Inquiries about this product and related statistics or services should be directed to: Client Services Income StatisticsDivision Canada, Ottawa, Ontario, K1A 0T6 ((613) 951-7355; (888) 297-7355; [email protected]) or to the StatisticsCanada Regional Reference Centre in:
Halifax (902) 426-5331 Regina (306) 780-5405Montréal (514) 283-5725 Edmonton (403) 495-3027Ottawa (613) 951-8116 Calgary (403) 292-6717Toronto (416) 973-6586 Vancouver (604) 666-3691Winnipeg (204) 983-4020
You can also visit our World Wide Web site: http://www.statcan.ca
Toll-free access is provided for all users who reside outside the local dialing area of any of the Regional ReferenceCentres.
National enquiries line 1 800 263-1136National telecommunications device for the hearing impaired 1 800 363-7629Order-only line (Canada and United States) 1 800 267-6677
Ordering/Subscription information
All prices exclude sales tax
Catalogue no. 75F0002MIE-99009, is available on internet for CDN $0.00 per issue. Users can obtain single issuesat http://www.statcan.ca/cgi-bin/downpub/freepub.cgi.
Standards of service to the public
Statistics Canada is committed to serving its clients in a prompt, reliable and courteous manner and in the officiallanguage of their choice. To this end, the agency has developed standards of service which its employees observe inserving its clients. To obtain a copy of these service standards, please contact your nearest Statistics Canada RegionalReference Centre.
Statistics CanadaIncome Statistics Division
Should the Low Income Cutoffsbe Updated?A Discussion Paper
Note of appreciation
Canada owes the success of its statistical system to a long-standing partnership between StatisticsCanada, the citizens of Canada, its businesses, governments and other institutions. Accurate and timelystatistical information could not be produced without their continued co-operation and goodwill.
Published by authority of the Minister responsible for Statistics Canada
© Minister of Industry, 1999
All rights reserved. No part of this publication may be reproduced, stored in a retrieval system ortransmitted in any form or by any means, electronic, mechanical, photocopying, recording or otherwisewithout prior written permission from Licence Services, Marketing Division, Statistics Canada, Ottawa,Ontario, Canada K1A 0T6.
December 1999
Catalogue no. 75F0002MPE - 99009ISSN 0000-0000
Catalogue no. 75F0002MIE - 99009ISSN 0000-0000
Frequency: Irr.
Ottawa
La version française de cette publication est disponible sur demande

Table of Contents
I. BACKGROUND.....................................................................................................................7
II. LOW INCOME CUTOFFS: METHODOLOGY...........................................................................7
HOW LOW INCOME CUTOFFS ARE CALCULATED....................................................................................7REBASING LOW INCOME CUTOFFS...................................................................................................10FROM LICOS TO LOW INCOME RATES..............................................................................................16WHY ARE AFTER-TAX LOW INCOME RATES LOWER THAN BEFORE-TAX RATES? .........................................18
III. MAJOR EVENTS IN THE HISTORY OF LOW INCOME MEASUREMENT................................23
FOUR REVISIONS IN PAST 30 YEARS ...............................................................................................23MAJOR PUBLIC CONSULTATION IN 1989 ...........................................................................................24ADVENT OF THE MARKET BASKET MEASURE OF POVERTY ..................................................................25SURVEY OF HOUSEHOLD SPENDING ...............................................................................................25
IV. OPTIONS FOR THE FUTURE..............................................................................................26
OPTION 1: STATUS QUO ..............................................................................................................26OPTION 2: SHIFT TO 1997 BASE....................................................................................................27OPTION 3: STATUS QUO + CURRENT SPENDING PATTERNS ...................................................................31RECOMMENDED APPROACH FOR 1998 AND ONWARD ..........................................................................32
V. TRANSITION FROM SCF TO SLID AND OTHER CHANGES .................................................32
VI. WHAT SHOULD BE HIGHLIGHTED ON “RELEASE DAY”.....................................................34
VII. FUTURE RESEARCH ......................................................................................................34
VIII. HOW TO CONTACT US ..................................................................................................35
APPENDIX .................................................................................................................................36
BIBLIOGRAPHY .........................................................................................................................38

Statistics Canada 75F0002M - 990097
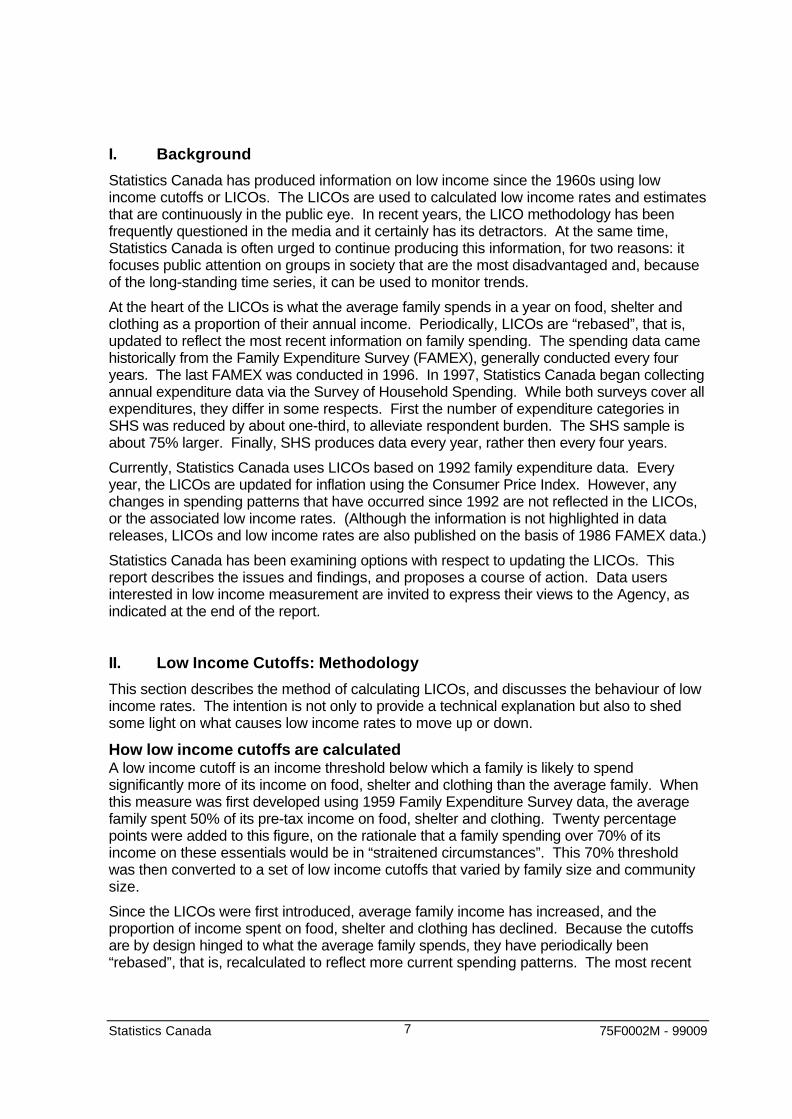
I. Background
Statistics Canada has produced information on low income since the 1960s using lowincome cutoffs or LICOs. The LICOs are used to calculated low income rates and estimatesthat are continuously in the public eye. In recent years, the LICO methodology has beenfrequently questioned in the media and it certainly has its detractors. At the same time,Statistics Canada is often urged to continue producing this information, for two reasons: itfocuses public attention on groups in society that are the most disadvantaged and, becauseof the long-standing time series, it can be used to monitor trends.
At the heart of the LICOs is what the average family spends in a year on food, shelter andclothing as a proportion of their annual income. Periodically, LICOs are “rebased”, that is,updated to reflect the most recent information on family spending. The spending data camehistorically from the Family Expenditure Survey (FAMEX), generally conducted every fouryears. The last FAMEX was conducted in 1996. In 1997, Statistics Canada began collectingannual expenditure data via the Survey of Household Spending. While both surveys cover allexpenditures, they differ in some respects. First the number of expenditure categories inSHS was reduced by about one-third, to alleviate respondent burden. The SHS sample isabout 75% larger. Finally, SHS produces data every year, rather then every four years.
Currently, Statistics Canada uses LICOs based on 1992 family expenditure data. Everyyear, the LICOs are updated for inflation using the Consumer Price Index. However, anychanges in spending patterns that have occurred since 1992 are not reflected in the LICOs,or the associated low income rates. (Although the information is not highlighted in datareleases, LICOs and low income rates are also published on the basis of 1986 FAMEX data.)
Statistics Canada has been examining options with respect to updating the LICOs. Thisreport describes the issues and findings, and proposes a course of action. Data usersinterested in low income measurement are invited to express their views to the Agency, asindicated at the end of the report.
II. Low Income Cutoffs: Methodology
This section describes the method of calculating LICOs, and discusses the behaviour of lowincome rates. The intention is not only to provide a technical explanation but also to shedsome light on what causes low income rates to move up or down.
How low income cutoffs are calculatedA low income cutoff is an income threshold below which a family is likely to spendsignificantly more of its income on food, shelter and clothing than the average family. Whenthis measure was first developed using 1959 Family Expenditure Survey data, the averagefamily spent 50% of its pre-tax income on food, shelter and clothing. Twenty percentagepoints were added to this figure, on the rationale that a family spending over 70% of itsincome on these essentials would be in “straitened circumstances”. This 70% thresholdwas then converted to a set of low income cutoffs that varied by family size and communitysize.
Since the LICOs were first introduced, average family income has increased, and theproportion of income spent on food, shelter and clothing has declined. Because the cutoffsare by design hinged to what the average family spends, they have periodically been“rebased”, that is, recalculated to reflect more current spending patterns. The most recent
Statistics Canada 75F0002M - 990098
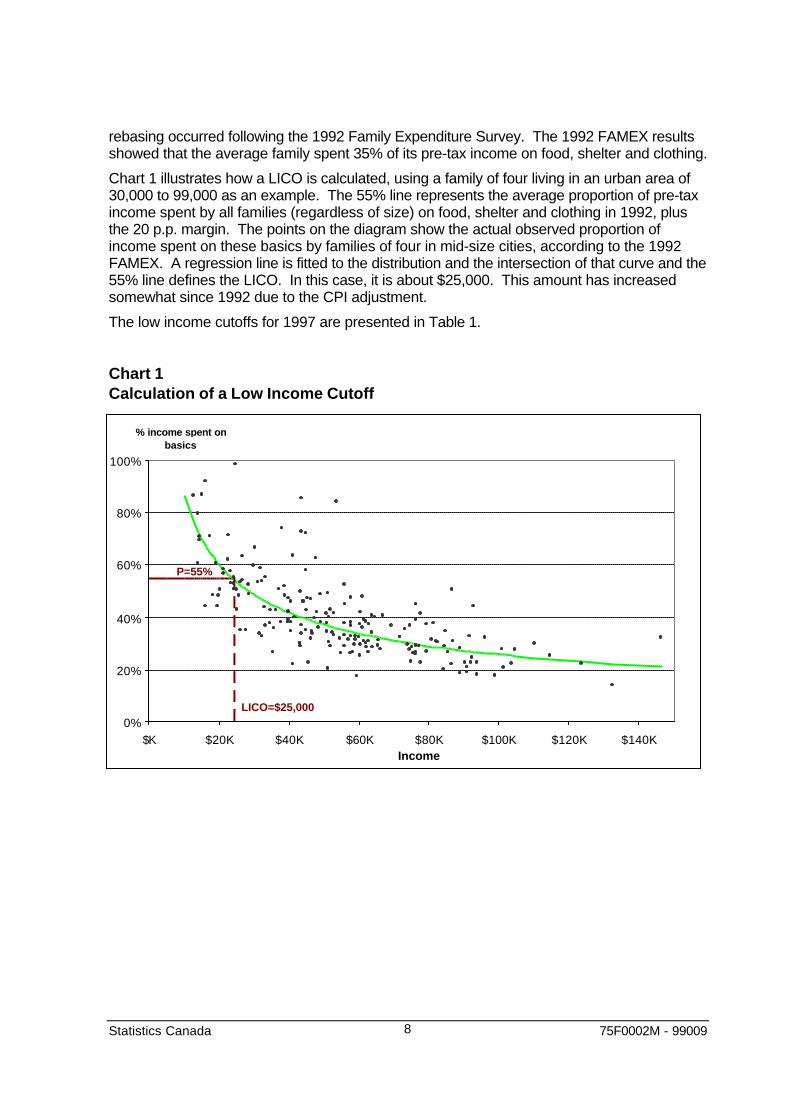
rebasing occurred following the 1992 Family Expenditure Survey. The 1992 FAMEX resultsshowed that the average family spent 35% of its pre-tax income on food, shelter and clothing.
Chart 1 illustrates how a LICO is calculated, using a family of four living in an urban area of30,000 to 99,000 as an example. The 55% line represents the average proportion of pre-taxincome spent by all families (regardless of size) on food, shelter and clothing in 1992, plusthe 20 p.p. margin. The points on the diagram show the actual observed proportion ofincome spent on these basics by families of four in mid-size cities, according to the 1992FAMEX. A regression line is fitted to the distribution and the intersection of that curve and the55% line defines the LICO. In this case, it is about $25,000. This amount has increasedsomewhat since 1992 due to the CPI adjustment.
The low income cutoffs for 1997 are presented in Table 1.
Chart 1Calculation of a Low Income Cutoff
0%
20%
40%
60%
80%
100%
$K $20K $40K $60K $80K $100K $120K $140KIncome
% income spent on basics
P=55%
LICO=$25,000
Statistics Canada 75F0002M - 990099
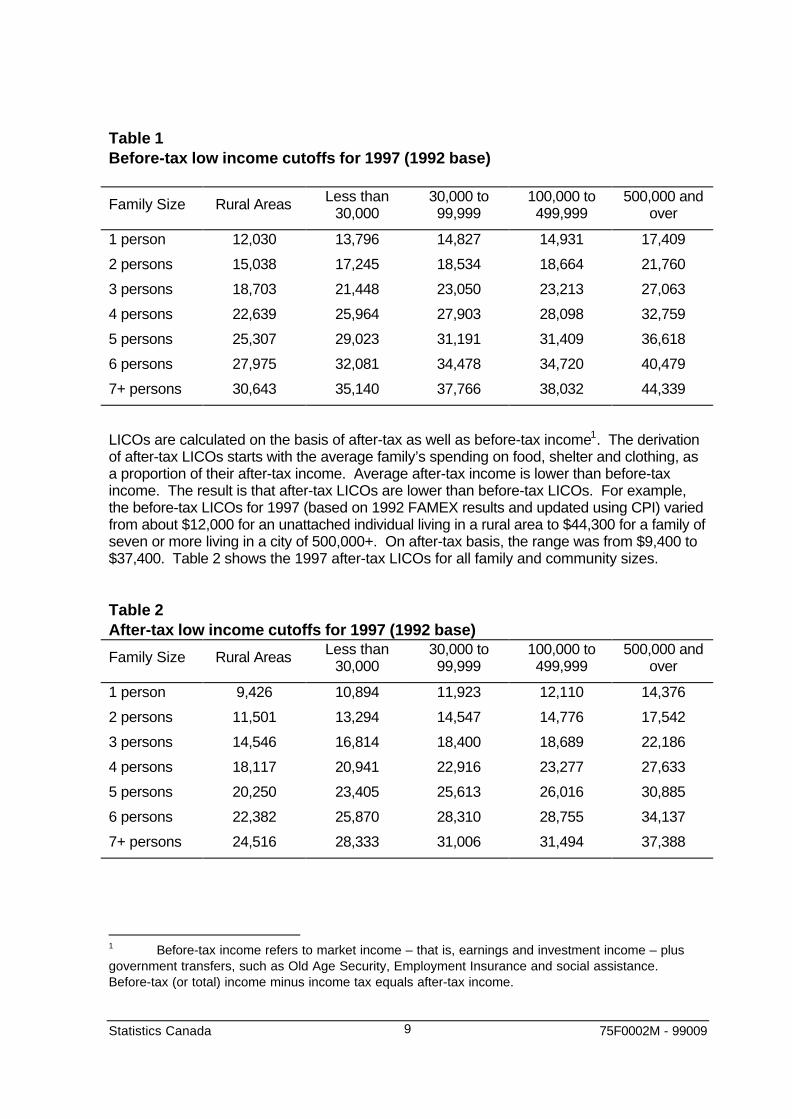
Table 1Before-tax low income cutoffs for 1997 (1992 base)
Family Size Rural Areas Less than30,000
30,000 to99,999
100,000 to499,999
500,000 andover
1 person 12,030 13,796 14,827 14,931 17,409
2 persons 15,038 17,245 18,534 18,664 21,760
3 persons 18,703 21,448 23,050 23,213 27,063
4 persons 22,639 25,964 27,903 28,098 32,759
5 persons 25,307 29,023 31,191 31,409 36,618
6 persons 27,975 32,081 34,478 34,720 40,479
7+ persons 30,643 35,140 37,766 38,032 44,339
LICOs are calculated on the basis of after-tax as well as before-tax income1. The derivationof after-tax LICOs starts with the average family’s spending on food, shelter and clothing, asa proportion of their after-tax income. Average after-tax income is lower than before-taxincome. The result is that after-tax LICOs are lower than before-tax LICOs. For example,the before-tax LICOs for 1997 (based on 1992 FAMEX results and updated using CPI) variedfrom about $12,000 for an unattached individual living in a rural area to $44,300 for a family ofseven or more living in a city of 500,000+. On after-tax basis, the range was from $9,400 to$37,400. Table 2 shows the 1997 after-tax LICOs for all family and community sizes.
Table 2After-tax low income cutoffs for 1997 (1992 base)
Family Size Rural Areas Less than30,000
30,000 to99,999
100,000 to499,999
500,000 andover
1 person 9,426 10,894 11,923 12,110 14,376
2 persons 11,501 13,294 14,547 14,776 17,542
3 persons 14,546 16,814 18,400 18,689 22,186
4 persons 18,117 20,941 22,916 23,277 27,633
5 persons 20,250 23,405 25,613 26,016 30,885
6 persons 22,382 25,870 28,310 28,755 34,137
7+ persons 24,516 28,333 31,006 31,494 37,388
1 Before-tax income refers to market income – that is, earnings and investment income – plusgovernment transfers, such as Old Age Security, Employment Insurance and social assistance.Before-tax (or total) income minus income tax equals after-tax income.
Statistics Canada 75F0002M - 9900910
After-tax low income rates have been available since the early 1990s and have beenextended back to 1980. After-tax information has not received as much attention as before-tax information because it has been released at a later date. As discussed later in thisreport, after-tax information will in future be available at the same time as the before-taxresults. This makes it possible to shift the focus to after-tax low income rates, which aremore meaningful because after-tax income is a closer approximation of disposable income.
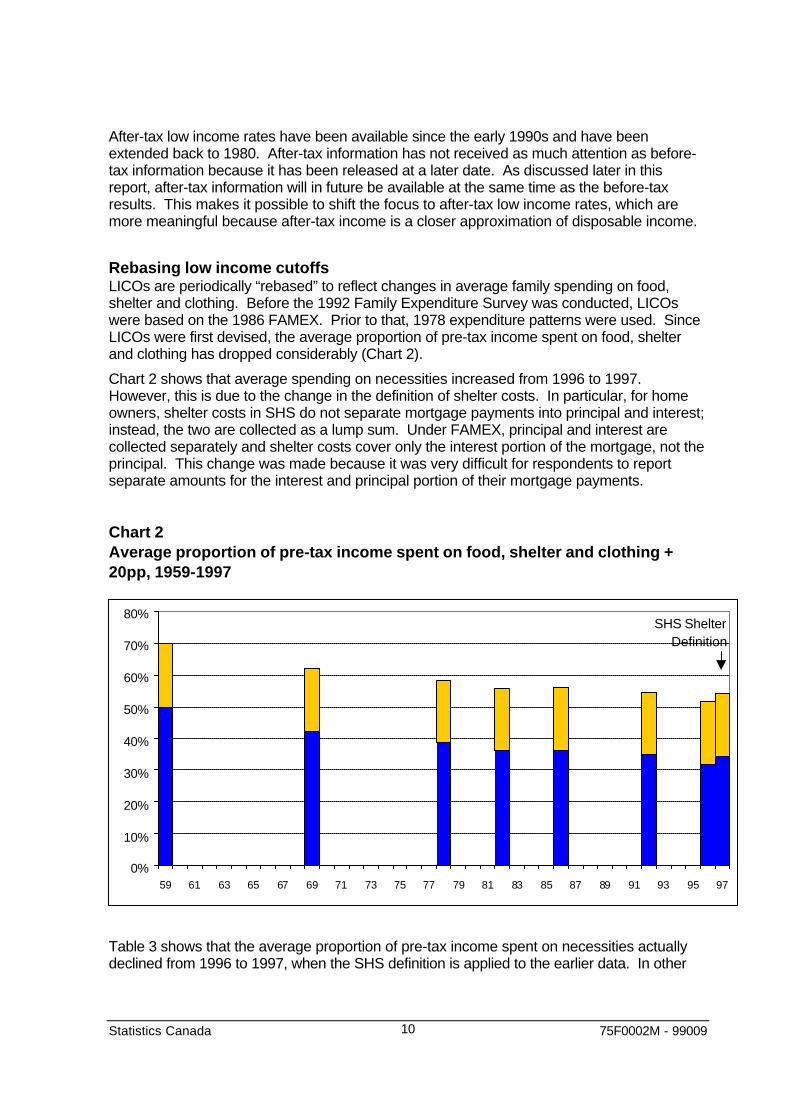
Rebasing low income cutoffsLICOs are periodically “rebased” to reflect changes in average family spending on food,shelter and clothing. Before the 1992 Family Expenditure Survey was conducted, LICOswere based on the 1986 FAMEX. Prior to that, 1978 expenditure patterns were used. SinceLICOs were first devised, the average proportion of pre-tax income spent on food, shelterand clothing has dropped considerably (Chart 2).
Chart 2 shows that average spending on necessities increased from 1996 to 1997.However, this is due to the change in the definition of shelter costs. In particular, for homeowners, shelter costs in SHS do not separate mortgage payments into principal and interest;instead, the two are collected as a lump sum. Under FAMEX, principal and interest arecollected separately and shelter costs cover only the interest portion of the mortgage, not theprincipal. This change was made because it was very difficult for respondents to reportseparate amounts for the interest and principal portion of their mortgage payments.
Chart 2Average proportion of pre-tax income spent on food, shelter and clothing +20pp, 1959-1997
Table 3 shows that the average proportion of pre-tax income spent on necessities actuallydeclined from 1996 to 1997, when the SHS definition is applied to the earlier data. In other
0%
10%
20%
30%
40%
50%
60%
70%
80%
59 61 63 65 67 69 71 73 75 77 79 81 83 85 87 89 91 93 95 97
SHS Shelter Definition
Statistics Canada 75F0002M - 9900911
words, the 1997 increase shown in Chart 2 is due solely to this change in the definition ofshelter costs.
Table 3Average before-tax spending on food, shelter and clothing, FAMEX definitionand SHS definition
FAMEX definition SHS definition
1982 36.0% 38.1%
1986 36.2% 36.5%
1992 34.7% 35.1%
1996 31.9% 34.4%
1997 not available 34.3%
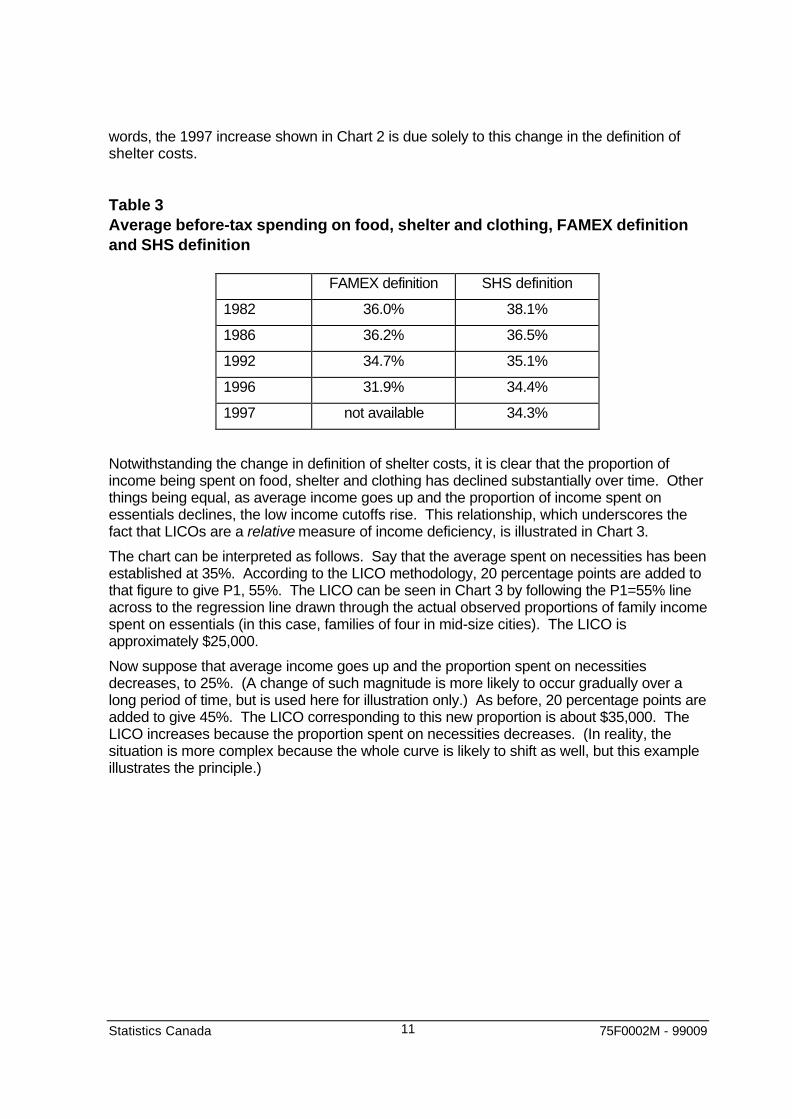
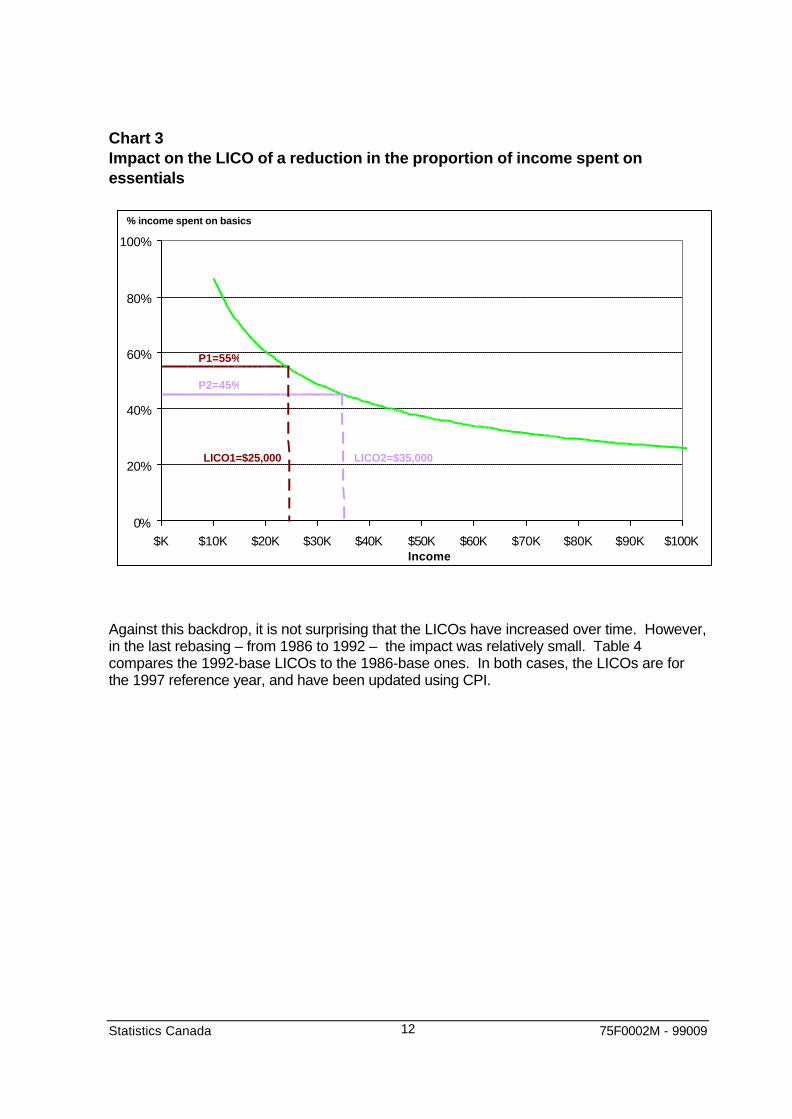
Notwithstanding the change in definition of shelter costs, it is clear that the proportion ofincome being spent on food, shelter and clothing has declined substantially over time. Otherthings being equal, as average income goes up and the proportion of income spent onessentials declines, the low income cutoffs rise. This relationship, which underscores thefact that LICOs are a relative measure of income deficiency, is illustrated in Chart 3.
The chart can be interpreted as follows. Say that the average spent on necessities has beenestablished at 35%. According to the LICO methodology, 20 percentage points are added tothat figure to give P1, 55%. The LICO can be seen in Chart 3 by following the P1=55% lineacross to the regression line drawn through the actual observed proportions of family incomespent on essentials (in this case, families of four in mid-size cities). The LICO isapproximately $25,000.
Now suppose that average income goes up and the proportion spent on necessitiesdecreases, to 25%. (A change of such magnitude is more likely to occur gradually over along period of time, but is used here for illustration only.) As before, 20 percentage points areadded to give 45%. The LICO corresponding to this new proportion is about $35,000. TheLICO increases because the proportion spent on necessities decreases. (In reality, thesituation is more complex because the whole curve is likely to shift as well, but this exampleillustrates the principle.)
Statistics Canada 75F0002M - 9900912
Chart 3Impact on the LICO of a reduction in the proportion of income spent onessentials
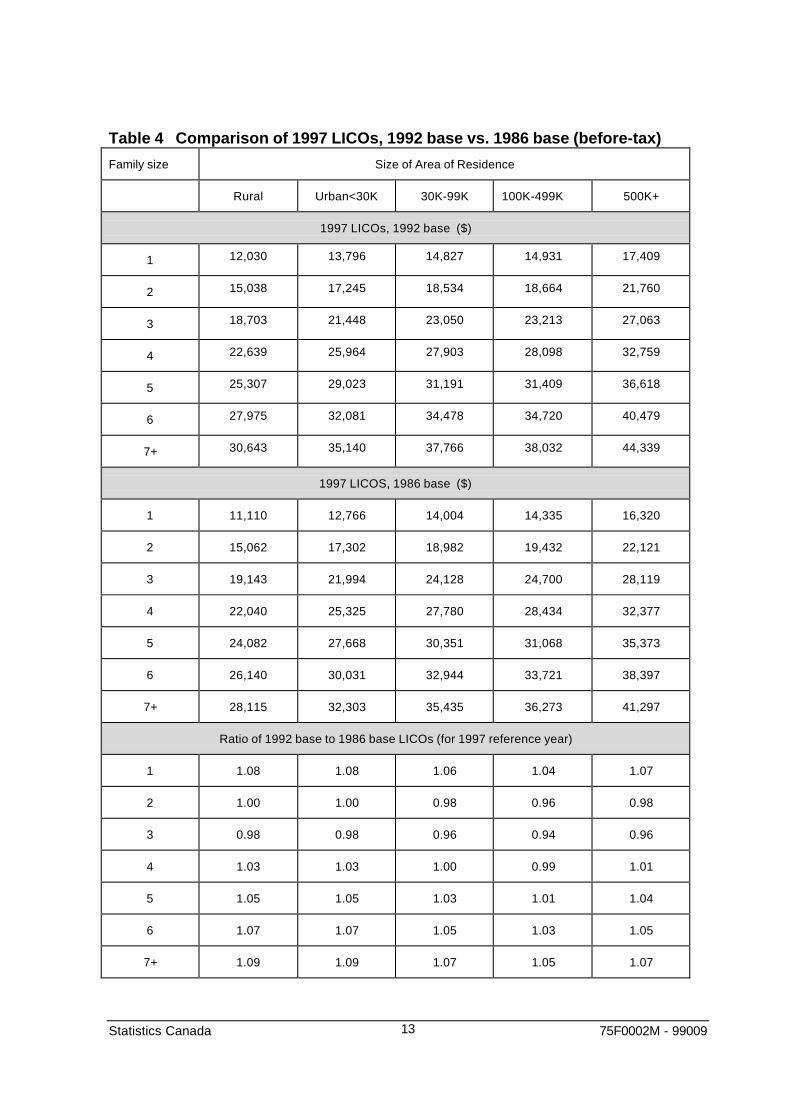
Against this backdrop, it is not surprising that the LICOs have increased over time. However,in the last rebasing – from 1986 to 1992 – the impact was relatively small. Table 4compares the 1992-base LICOs to the 1986-base ones. In both cases, the LICOs are forthe 1997 reference year, and have been updated using CPI.
0%
20%
40%
60%
80%
100%
$K $10K $20K $30K $40K $50K $60K $70K $80K $90K $100KIncome
P1=55%
P2=45%
LICO2=$35,000LICO1=$25,000
% income spent on basics
Statistics Canada 75F0002M - 9900913
Table 4 Comparison of 1997 LICOs, 1992 base vs. 1986 base (before-tax)
Family size Size of Area of Residence
Rural Urban<30K 30K-99K 100K-499K 500K+
1997 LICOs, 1992 base ($)
1 12,030 13,796 14,827 14,931 17,409
2 15,038 17,245 18,534 18,664 21,760
3 18,703 21,448 23,050 23,213 27,063
4 22,639 25,964 27,903 28,098 32,759
5 25,307 29,023 31,191 31,409 36,618
6 27,975 32,081 34,478 34,720 40,479
7+ 30,643 35,140 37,766 38,032 44,339
1997 LICOS, 1986 base ($)
1 11,110 12,766 14,004 14,335 16,320
2 15,062 17,302 18,982 19,432 22,121
3 19,143 21,994 24,128 24,700 28,119
4 22,040 25,325 27,780 28,434 32,377
5 24,082 27,668 30,351 31,068 35,373
6 26,140 30,031 32,944 33,721 38,397
7+ 28,115 32,303 35,435 36,273 41,297
Ratio of 1992 base to 1986 base LICOs (for 1997 reference year)
1 1.08 1.08 1.06 1.04 1.07
2 1.00 1.00 0.98 0.96 0.98
3 0.98 0.98 0.96 0.94 0.96
4 1.03 1.03 1.00 0.99 1.01
5 1.05 1.05 1.03 1.01 1.04
6 1.07 1.07 1.05 1.03 1.05
7+ 1.09 1.09 1.07 1.05 1.07
Statistics Canada 75F0002M - 9900914
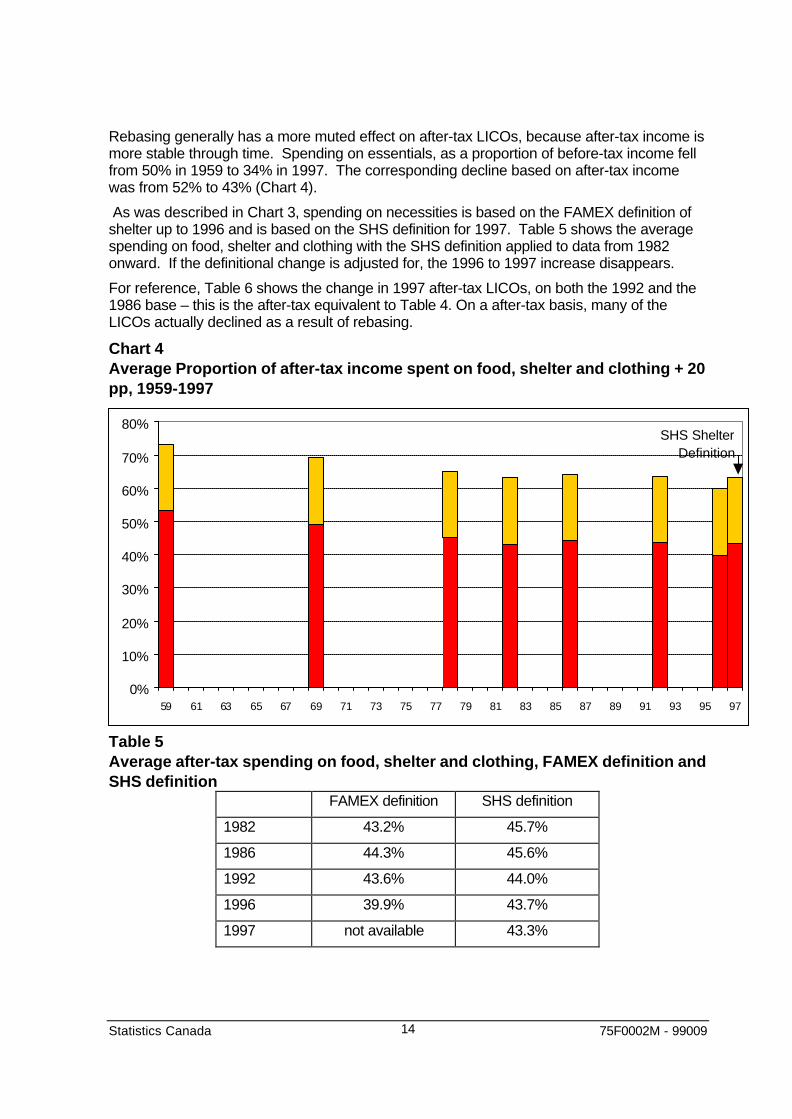
Rebasing generally has a more muted effect on after-tax LICOs, because after-tax income ismore stable through time. Spending on essentials, as a proportion of before-tax income fellfrom 50% in 1959 to 34% in 1997. The corresponding decline based on after-tax incomewas from 52% to 43% (Chart 4).
As was described in Chart 3, spending on necessities is based on the FAMEX definition ofshelter up to 1996 and is based on the SHS definition for 1997. Table 5 shows the averagespending on food, shelter and clothing with the SHS definition applied to data from 1982onward. If the definitional change is adjusted for, the 1996 to 1997 increase disappears.
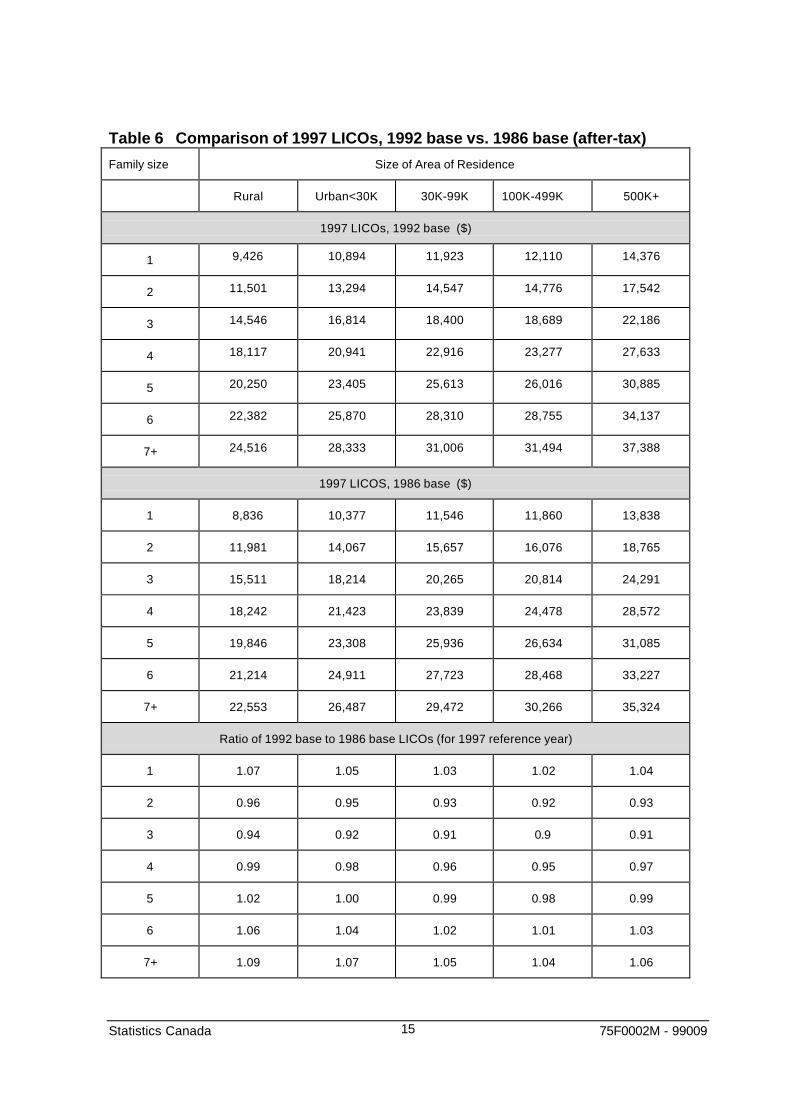
For reference, Table 6 shows the change in 1997 after-tax LICOs, on both the 1992 and the1986 base – this is the after-tax equivalent to Table 4. On a after-tax basis, many of theLICOs actually declined as a result of rebasing.
Chart 4Average Proportion of after-tax income spent on food, shelter and clothing + 20pp, 1959-1997
Table 5Average after-tax spending on food, shelter and clothing, FAMEX definition andSHS definition
FAMEX definition SHS definition
1982 43.2% 45.7%
1986 44.3% 45.6%
1992 43.6% 44.0%
1996 39.9% 43.7%
1997 not available 43.3%
0%
10%
20%
30%
40%
50%
60%
70%
80%
59 61 63 65 67 69 71 73 75 77 79 81 83 85 87 89 91 93 95 97
SHS Shelter Definition
Statistics Canada 75F0002M - 9900915
Table 6 Comparison of 1997 LICOs, 1992 base vs. 1986 base (after-tax)
Family size Size of Area of Residence
Rural Urban<30K 30K-99K 100K-499K 500K+
1997 LICOs, 1992 base ($)
1 9,426 10,894 11,923 12,110 14,376
2 11,501 13,294 14,547 14,776 17,542
3 14,546 16,814 18,400 18,689 22,186
4 18,117 20,941 22,916 23,277 27,633
5 20,250 23,405 25,613 26,016 30,885
6 22,382 25,870 28,310 28,755 34,137
7+ 24,516 28,333 31,006 31,494 37,388
1997 LICOS, 1986 base ($)
1 8,836 10,377 11,546 11,860 13,838
2 11,981 14,067 15,657 16,076 18,765
3 15,511 18,214 20,265 20,814 24,291
4 18,242 21,423 23,839 24,478 28,572
5 19,846 23,308 25,936 26,634 31,085
6 21,214 24,911 27,723 28,468 33,227
7+ 22,553 26,487 29,472 30,266 35,324
Ratio of 1992 base to 1986 base LICOs (for 1997 reference year)
1 1.07 1.05 1.03 1.02 1.04
2 0.96 0.95 0.93 0.92 0.93
3 0.94 0.92 0.91 0.9 0.91
4 0.99 0.98 0.96 0.95 0.97
5 1.02 1.00 0.99 0.98 0.99
6 1.06 1.04 1.02 1.01 1.03
7+ 1.09 1.07 1.05 1.04 1.06
Statistics Canada 75F0002M - 9900916
From LICOs to low income ratesLow income rates can be calculated for persons (that is, the proportion of persons below theLICO) or for families. In either case, the income amount referred to is the income of thefamily. “Persons in low income” should, strictly speaking, be interpreted as “persons whoare part of low income families”. Similarly, “children in low income” really means “children inlow income families”. The family concept used is the economic family, that is, all personsliving in the save dwelling and related by blood, marriage, common-law relationship oradoption.
To calculate low income rates, each family’s income is compared to the appropriate cell inthe matrix of 35 LICOs. For persons, the low income rate is the sum, over all 35 cells, ofpersons in each family size and community size whose family income is below the LICO,divided by the sum, over all 35 cells, of all persons in each family size and community size.
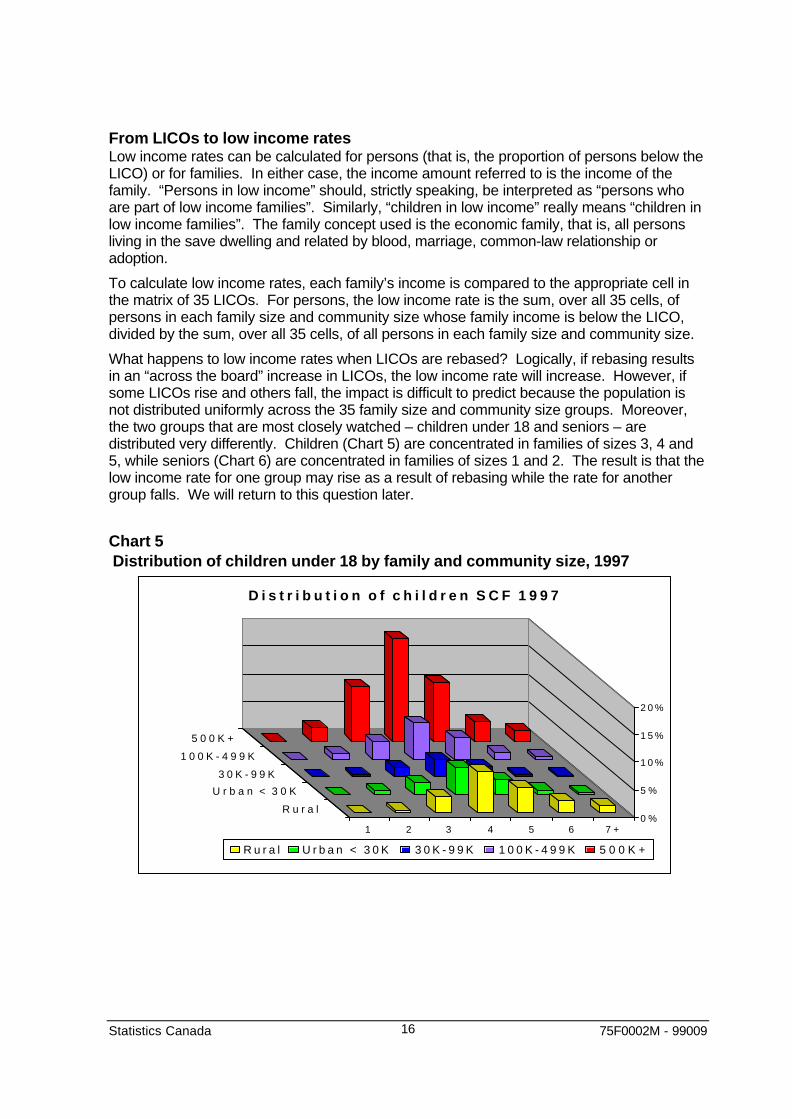
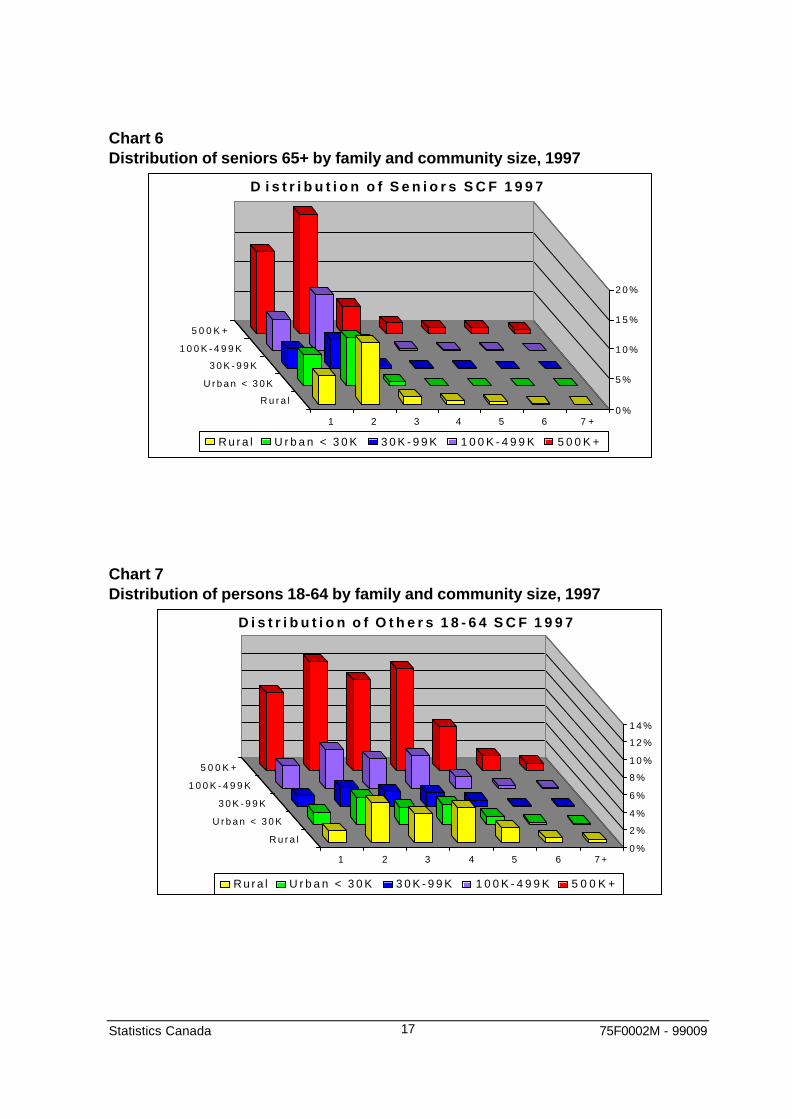
What happens to low income rates when LICOs are rebased? Logically, if rebasing resultsin an “across the board” increase in LICOs, the low income rate will increase. However, ifsome LICOs rise and others fall, the impact is difficult to predict because the population isnot distributed uniformly across the 35 family size and community size groups. Moreover,the two groups that are most closely watched – children under 18 and seniors – aredistributed very differently. Children (Chart 5) are concentrated in families of sizes 3, 4 and5, while seniors (Chart 6) are concentrated in families of sizes 1 and 2. The result is that thelow income rate for one group may rise as a result of rebasing while the rate for anothergroup falls. We will return to this question later.
Chart 5 Distribution of children under 18 by family and community size, 1997
0 %
5 %
1 0 %
1 5 %
2 0 %
1 2 3 4 5 6 7 +
R u r a l
U r b a n < 3 0 K
3 0 K - 9 9 K
1 0 0 K - 4 9 9 K
5 0 0 K +
D i s t r i b u t i o n o f c h i l d r e n S C F 1 9 9 7
R u r a l U r b a n < 3 0 K 3 0 K - 9 9 K 1 0 0 K - 4 9 9 K 5 0 0 K +
Statistics Canada 75F0002M - 9900917
Chart 6Distribution of seniors 65+ by family and community size, 1997
Chart 7Distribution of persons 18-64 by family and community size, 1997
0 %
5 %
1 0 %
1 5 %
2 0 %
1 2 3 4 5 6 7 +
R u r a l
U r b a n < 3 0 K
3 0 K - 9 9 K
1 0 0 K - 4 9 9 K
5 0 0 K +
D i s t r i b u t i o n o f S e n i o r s S C F 1 9 9 7
R u r a l U r b a n < 3 0 K 3 0 K - 9 9 K 1 0 0 K - 4 9 9 K 5 0 0 K +
0 %
2 %
4 %
6 %
8 %
1 0 %
1 2 %
1 4 %
1 2 3 4 5 6 7 +
R u r a l
U r b a n < 3 0 K
3 0 K - 9 9 K
1 0 0 K - 4 9 9 K
5 0 0 K +
D i s t r i b u t i o n o f O t h e r s 1 8 - 6 4 S C F 1 9 9 7
R u r a l U r b a n < 3 0 K 3 0 K - 9 9 K 1 0 0 K - 4 9 9 K 5 0 0 K +
Statistics Canada 75F0002M - 9900918
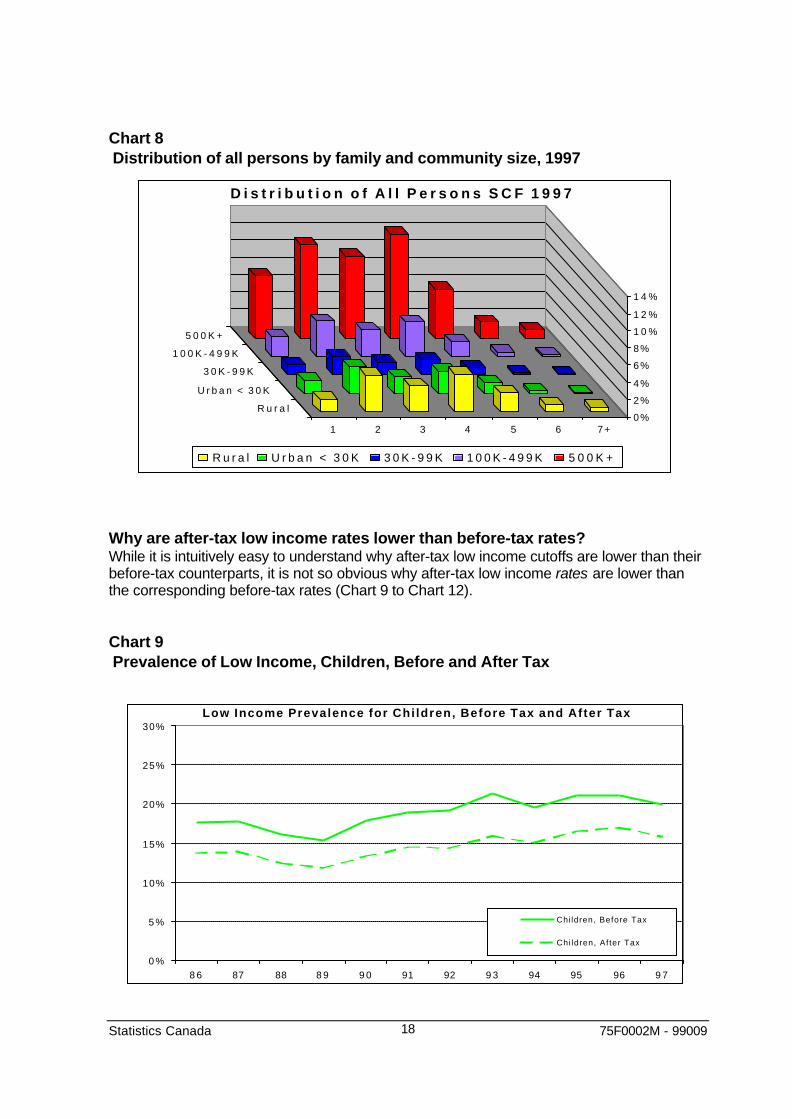
Chart 8 Distribution of all persons by family and community size, 1997
Why are after-tax low income rates lower than before-tax rates?While it is intuitively easy to understand why after-tax low income cutoffs are lower than theirbefore-tax counterparts, it is not so obvious why after-tax low income rates are lower thanthe corresponding before-tax rates (Chart 9 to Chart 12).
Chart 9 Prevalence of Low Income, Children, Before and After Tax
0 %
5 %
10%
15%
20%
25%
30%
8 6 87 88 8 9 9 0 91 92 9 3 94 95 96 9 7
Children, Before Tax
Chi ldren, After Tax
Low Income Prevalence for Chi ldren, Before Tax and After Tax
0%
2%
4%
6%
8%
1 0 %
1 2 %
1 4 %
1 2 3 4 5 6 7+
R u r a l
U r b a n < 3 0 K
3 0 K - 9 9 K
1 0 0 K - 4 9 9 K
5 0 0 K +
D i s t r i b u t i o n o f A l l P e r s o n s S C F 1 9 9 7
R u r a l U r b a n < 3 0 K 3 0 K - 9 9 K 1 0 0 K - 4 9 9 K 5 0 0 K +
Statistics Canada 75F0002M - 9900919
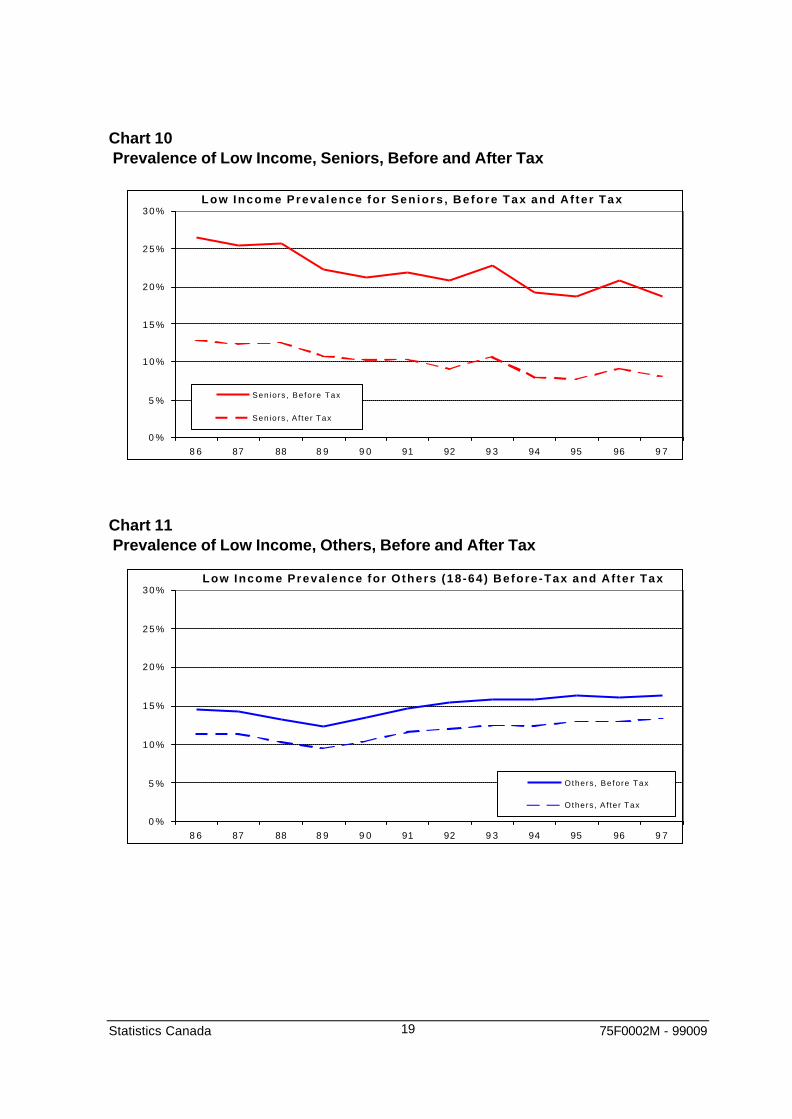
Chart 10 Prevalence of Low Income, Seniors, Before and After Tax
Chart 11 Prevalence of Low Income, Others, Before and After Tax
0 %
5 %
1 0 %
1 5 %
2 0 %
2 5 %
3 0 %
8 6 87 88 8 9 9 0 91 92 9 3 94 95 96 9 7
Others , Be fo re Tax
Others , A f te r Tax
Low Income Preva lence for Others (18-64) Before-Tax and Af ter Tax
0 %
5 %
1 0 %
1 5 %
2 0 %
2 5 %
3 0 %
8 6 87 88 8 9 9 0 91 92 9 3 94 95 96 9 7
Sen io rs , Be fo re Tax
Sen io rs , A f te r Tax
Low Income Preva lence fo r Sen iors , Be fore Tax and Af te r Tax

Statistics Canada 75F0002M - 9900920
Chart 12 Prevalence of Low Income, All Persons, Before and After Tax
The best intuitive explanation is that the low income rates, as a relative measure, are hingedto the average proportion of income spent on food, shelter and clothing, across all families.The impact of the tax system is to reduce inequality in the distribution of income. As theaverage income declines, some families just below the line on a before-tax basis will beabove it on an after-tax basis. The effect is depicted in the series of charts below.
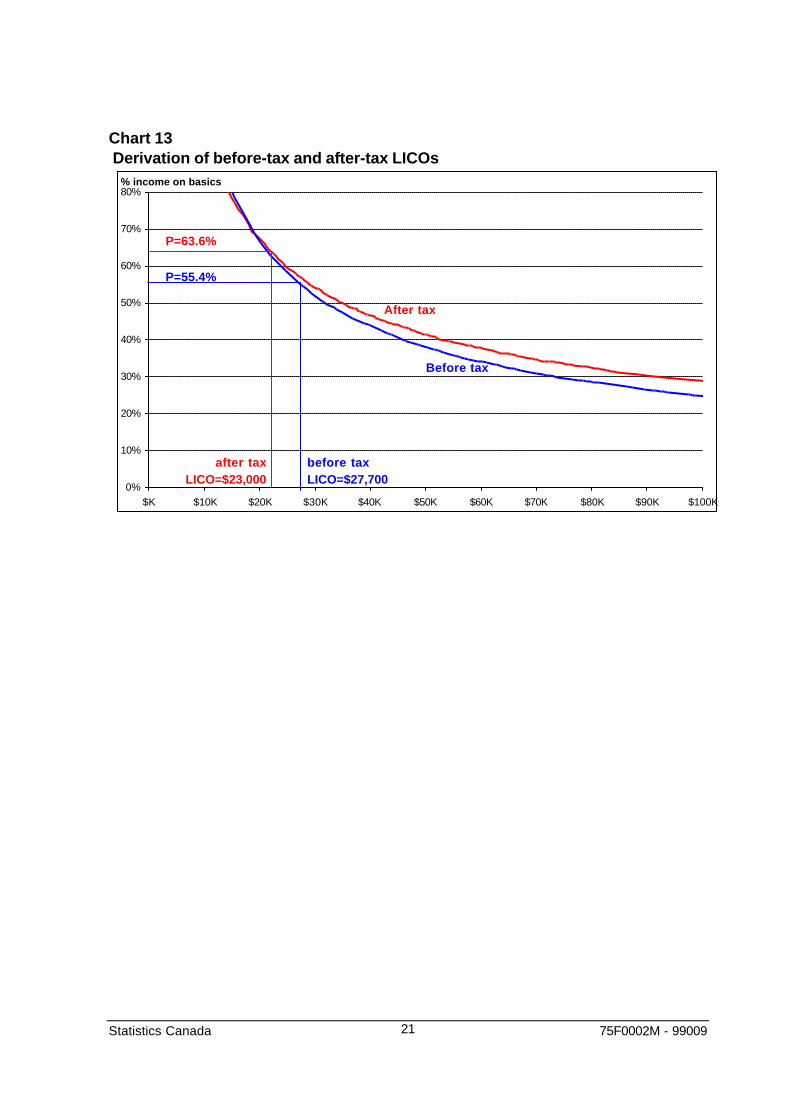
First, the average proportion of after-tax income spent on necessities is higher than thecorresponding before-tax proportion, so the LICO is lower – in this case, $23,000 versus$27,700 (Chart 13). This means that a family of four living in a mid-size city needs a before-tax income of $27,700 and an after-tax income of $23,000 to not be considered in lowincome.
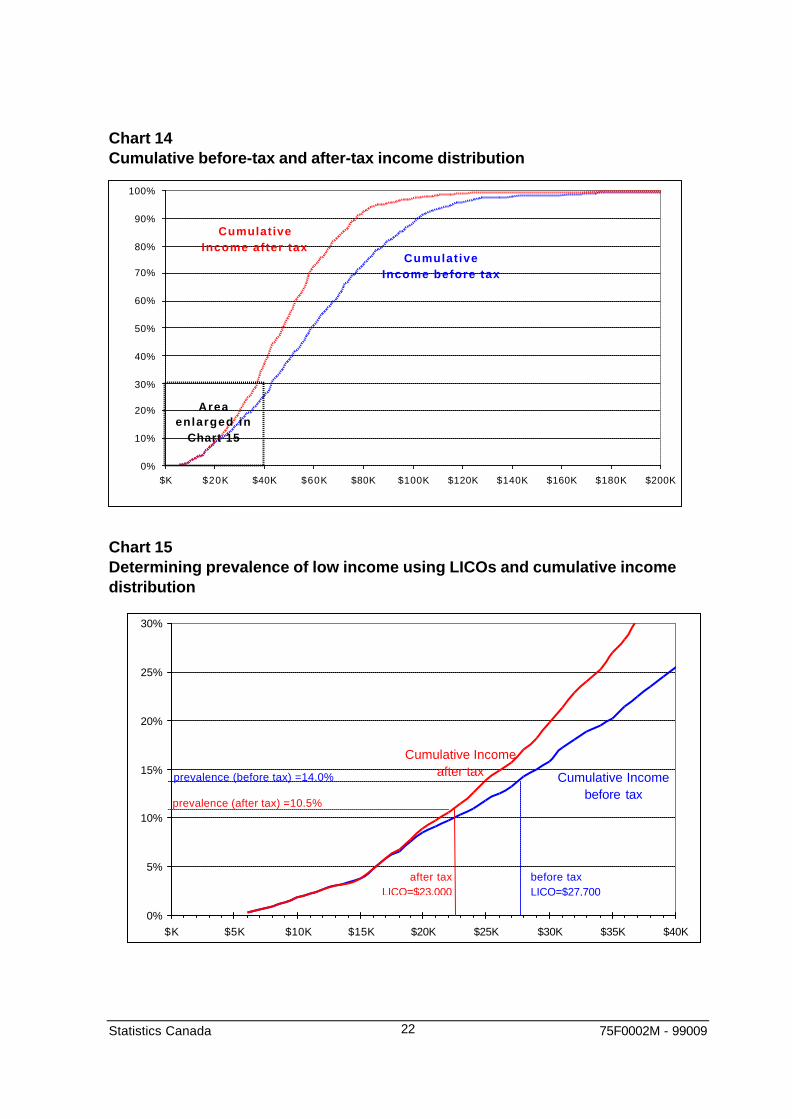
To understand the effect on low income rates, one needs to consider the difference in theshape of the before-tax and after-tax income distributions. Chart 14 shows the fullcumulative distribution. The after-tax distribution levels out earlier because income taxes areprogressive. Chart 15 is a close-up of the lower part of Chart 14. To determine theprevalence of low income graphically, begin with the cutoff – for example, the after-tax cutoffof $23,000 – and follow that income value to the cumulative income line. The proportion ofpersons whose income is below the cutoff can be read off the vertical axis – about 10%.Just by looking at the chart, one can see how the difference in shape between the before-taxand after-tax income distribution curves affects the low income rates.
0 %
5 %
1 0 %
1 5 %
2 0 %
2 5 %
3 0 %
8 6 87 88 8 9 9 0 91 92 9 3 94 95 96 9 7
Al l Pe rsons , Be fo re Tax
A l l Pe rsons , A f te r Tax
Low Income Preva lence for A l l Persons , Before Tax and Af te r Tax
Statistics Canada 75F0002M - 9900921
Chart 13 Derivation of before-tax and after-tax LICOs
0%
10%
20%
30%
40%
50%
60%
70%
80%
$K $10K $20K $30K $40K $50K $60K $70K $80K $90K $100K
% income on basics
P=63.6%
P=55.4%
after tax LICO=$23,000
before tax LICO=$27,700
After tax
Before tax
Statistics Canada 75F0002M - 9900922
Chart 14Cumulative before-tax and after-tax income distribution
Chart 15Determining prevalence of low income using LICOs and cumulative incomedistribution
0%
5%
10%
15%
20%
25%
30%
$K $5K $10K $15K $20K $25K $30K $35K $40K
before tax LICO=$27,700
after tax LICO=$23,000
prevalence (after tax) =10.5%
prevalence (before tax) =14.0% Cumulative Income before tax
Cumulative Income after tax
0%
10%
20%
30%
40%
50%
60%
70%
80%
90%
100%
$K $20K $40K $60K $80K $100K $120K $140K $160K $180K $200K
Cumulative Income after tax
Cumulative Income before tax
Area enlarged in
Chart 15
Statistics Canada 75F0002M - 9900923
III. Major Events in the History of Low Income Measurement
This part of the report sets out, in rough chronological form, the major events in the history ofthe low income rates. First, the four rebasing events are described. Then, the results of amajor public consultation launched in 1989 are discussed. The last two sections outlinerecent developments that are likely to affect the LICOs in the future, in one way or another.
Four revisions in past 30 yearsThe low income cutoffs were first published in 1967. They appeared in Incomes ofCanadians, written by Jenny Podoluk as part of the 1961 Census monograph series. TheseLICOs were based on the 1959 FAMEX data. Initially, only pre-tax low income rates wereavailable since the SCF did not at that time collect information on post-tax income. Thecutoffs were adjusted annually for the cost of living, using CPI.
In 1971, a Special Senate Committee on Poverty in Canada, chaired by Senator Croll, tookissue with the practice of updating using CPI, because it did not reflect changes in spendingpatterns. With the passage of time, the link to what the average family was spending onfood, shelter and clothing would be increasingly eroded.
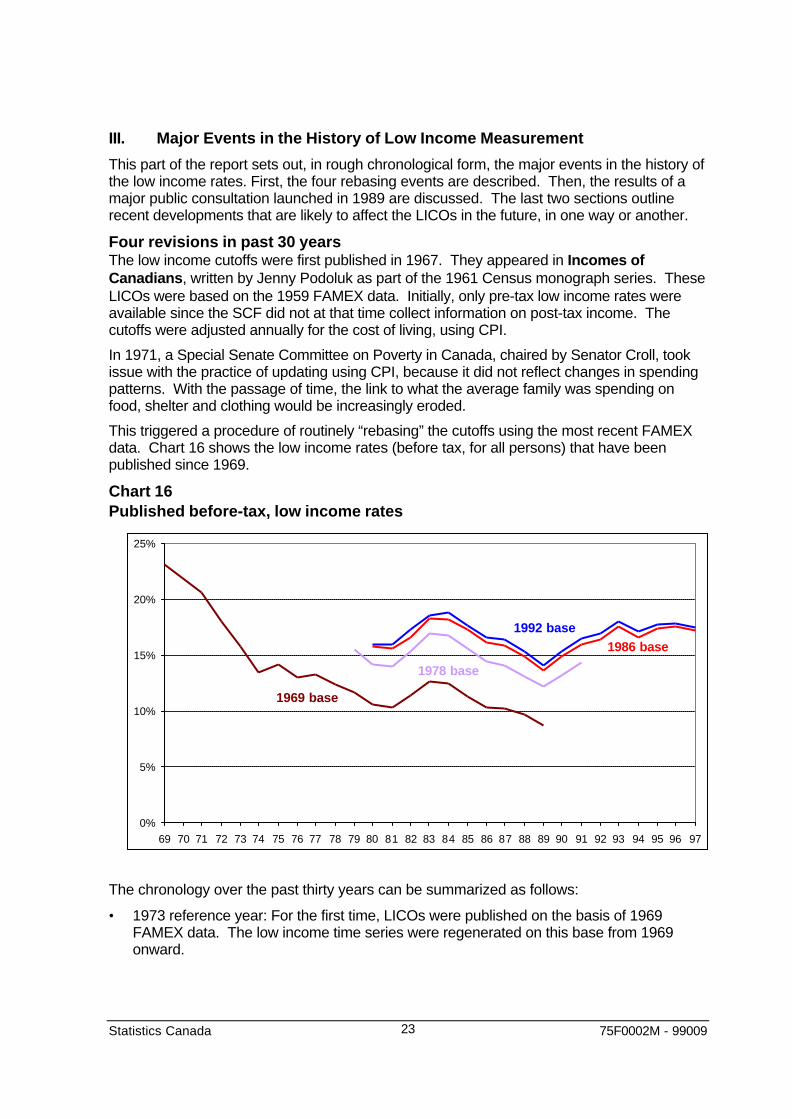
This triggered a procedure of routinely “rebasing” the cutoffs using the most recent FAMEXdata. Chart 16 shows the low income rates (before tax, for all persons) that have beenpublished since 1969.
Chart 16Published before-tax, low income rates
The chronology over the past thirty years can be summarized as follows:
• 1973 reference year: For the first time, LICOs were published on the basis of 1969FAMEX data. The low income time series were regenerated on this base from 1969onward.
0%
5%
10%
15%
20%
25%
69 70 71 72 73 74 75 76 77 78 79 80 81 82 83 84 85 86 87 88 89 90 91 92 93 94 95 96 97
1986 base1992 base
1978 base
1969 base

Statistics Canada 75F0002M - 9900924
• 1980 reference year: Statistics Canada began producing low income rates based on1978 FAMEX data. From this point onward, low income rates were also calculated onthe basis of after-tax income. The series were backdated to 1978. The Agency alsocontinued to publish 1969-base rates, up to 1989 reference year.
• 1987 reference year: Low income rates based on 1986 spending data were introduced.For two years – from 1987 to 1989 – rates were actually published for three base years.The low income cutoffs based on 1986 spending patterns were projected backward to1980 resulting in a series of low income rates going back to 1980, a first in the history ofthe LICOs.
• 1989: Statistics Canada began an extensive review and user consultation processregarding the publication of low income information. This process, discussed below,continued until 1991.
• 1992 reference year: Low income rates were once again rebased, using 1992 FAMEXresults. Rates on this base year were projected backward to 1980. Ever since then,rates have been published each year based on both 1992 and 1986 spending patterns.
To avoid confusion, the SCF publications have always highlighted one particular base year intheir high-profile releases. Currently, the 1992 base year is highlighted; low income rates onthe 1986 base are published but not typically used in Statistics Canada analyses.
Major public consultation in 1989The user consultation that took place around the beginning of the decade was launched withthe release of a discussion paper by Michael Wolfson and John Evans entitled StatisticsCanada’s Low Income Cutoffs: Methodological Concerns and Possibilities. Thepaper, which was widely distributed, examined some of the shortcomings of the LICOs anddiscussed alternative approaches. In particular, it looked at the possible replacement oraddition of a more conventional relative measure, based on 50% of median family income,where the income distribution has been adjusted for family size and composition. (Thismeasure ultimately became known in Canada as the Low Income Measure or LIM).
The most important recommendations emerging from the consultation were that StatisticsCanada should continue to produce low income information; that a single measure should behighlighted; but that none of the measures discussed was unambiguously superior to theothers. In addition, the Agency was asked to provide more information on the “depth” of lowincome2 and on the characteristics of low income persons, and to give more prominence tolow income rates based on after-tax income.
Statistics Canada accordingly continued to produce, and highlight, LICO-based low incomeinformation. Over time, the publication program was expanded to cover low income basedon LIMs, on after-tax income and the depth of low income. However, these supplementaryestimates have not been highlighted and their release has generally lagged the low incomerates based on before-tax LICOs. Perhaps for these reasons, they have never gained muchprominence. To a certain extent, Statistics Canada’s capacity to shift the focus has beenconstrained by the production environment. As discussed later, this is about to change.
Since the public review in 1989, the before-tax low income rate has risen from 14% to nearly18% in 1997. Over the same period, low income among seniors dropped but the rate forchildren under 18 has grown from 15% to almost 20%. This increase, and the commitmentof governments to address child poverty, has led to intense public scrutiny of the LICOs andtheir appropriateness for evaluating the effectiveness of poverty-reduction policies and
2 This is a measure reflecting the amount of money needed, on average, to pull families out of lowincome.

Statistics Canada 75F0002M - 9900925
programs. Some have called for a public debate on how poverty should be measured.Others have expressed anxiety over the fact that the focus on measurement detracts fromthe underlying phenomenon of income inadequacy.
Statistics Canada continues to correct media commentary that portrays low incomeestimates as a measure of poverty. The Agency’s position is summarized in a note writtenby the Chief Statistician earlier in 1999, reproduced here in an appendix.
Advent of the Market Basket Measure of PovertyHuman Resources Development Canada has been collaborating with the provincial andterritorial ministries of social service to develop a “Market Basket Measure of Poverty” orMBM. The objective is to produce a measure that is:
• credible with respect to the severity of poverty• related to changes in the cost of consumption• easy to understand (though not necessarily easy to calculate)• sensitive to geographical differences
The approach is to cost out a “basket” of necessary goods and services including food,shelter, clothing and transportation and a “mutiplier” to cover other essentials. The datawould come from various sources – the best available for the purpose. The results would beused to define levels of disposable income needed to cover the cost of the basket. Theincome levels would be calculated for each province and for different sizes of communitywithin each province. The measure of disposable income envisaged is more restrictive thatafter-tax income. It excludes such expenses as support payments, work-related child carecosts and employee contributions to pension plans and Employment Insurance.
Since an article on the MBM appeared in the HRDC’s Applied Research Branch Bulletin inthe autumn of 1998, the MBM has received a great deal of public attention. Based on theproposed methodology, the MBM would generate an average poverty rate below the before-tax low income rate, although not that different from the after-tax rate or the LIM-based rate.
One of many themes in the ensuing debate is that, even if the MBM should be producedregularly, it would be beneficial for Statistics Canada to continue producing LICO-based lowincome information as a point of comparison and for longer-term trends.
Survey of Household SpendingThe move from FAMEX to SHS affects the LICOs in two ways:
• The existence of an annual survey means that we could in principle update the LICOsannually using SHS. If this approach were adopted, it would obviate the need for updatingusing CPI.
• The streamlined SHS does not split the mortgage payment into principal and interest.This decision was taken because separate reporting of principal and interest is verydifficult for respondents – this was one of the hardest parts of the survey.
Although the analysis is still preliminary, it looks like the reduction in content has not had amajor impact on the expenditure data for broad commodity categories, apart from themortgage measurement issue noted above.
Statistics Canada 75F0002M - 9900926
IV. Options for the Future
We have examined three basic options, and variations on them.
The first option is status quo. We would continue to produce low income information basedon 1992 and 1986 spending patterns, updating the LICOs annually with CPI. With this optionwe would defer a decision on rebasing to some unspecified date in the future.
The second option is to shift to a 1997 base. In other words, LICOs would be calculatedusing 1997 Survey of Household Spending, perhaps back to 1990. For historical continuity,we would continue to produce low income rates using the 1992 base, but we would drop the1986 base. This approach to rebasing is consistent with past rebasing activities.
The third option is to take advantage of the fact that we now have an annual expendituresurvey and update cutoffs annually using current expenditure data.
The three options and their implications are discussed in detail in the following sections.
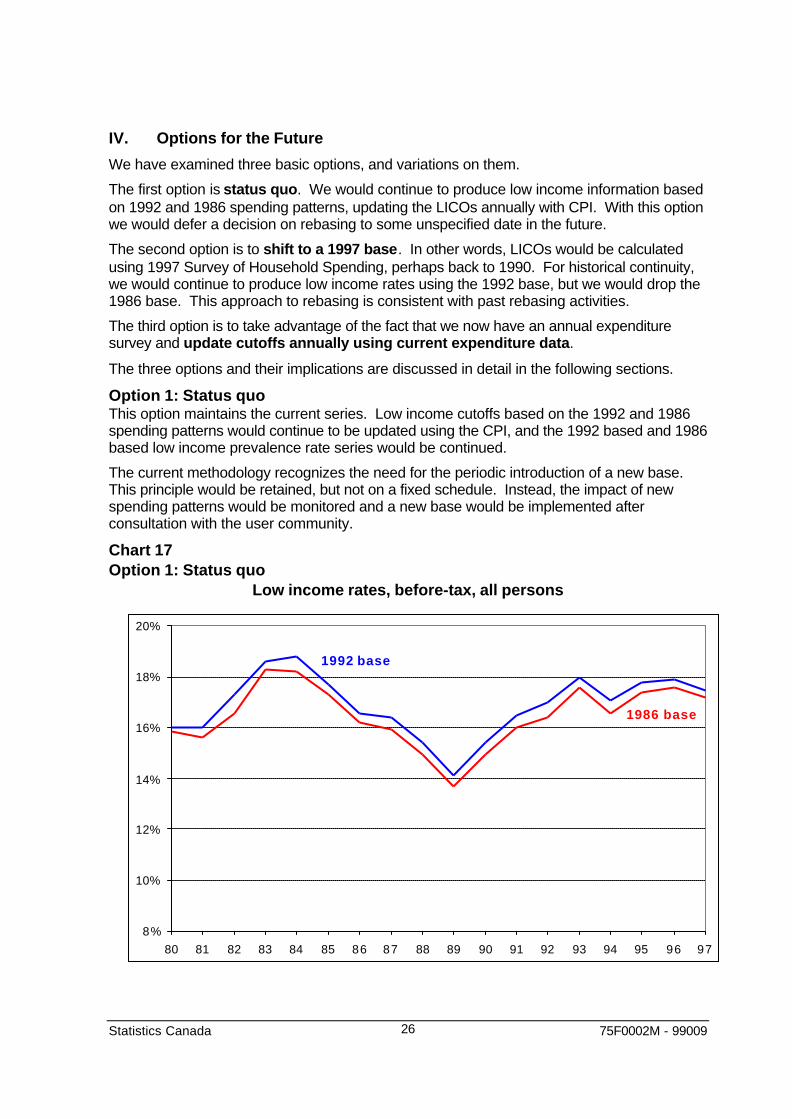
Option 1: Status quoThis option maintains the current series. Low income cutoffs based on the 1992 and 1986spending patterns would continue to be updated using the CPI, and the 1992 based and 1986based low income prevalence rate series would be continued.
The current methodology recognizes the need for the periodic introduction of a new base.This principle would be retained, but not on a fixed schedule. Instead, the impact of newspending patterns would be monitored and a new base would be implemented afterconsultation with the user community.
Chart 17Option 1: Status quo
Low income rates, before-tax, all persons
8%
10%
12%
14%
16%
18%
20%
80 81 82 83 84 85 86 87 88 89 90 91 92 93 94 95 96 97
1986 base
1992 base
Statistics Canada 75F0002M - 9900927
The advantage of this option is that the current analytical environment remains unchanged.The possible introduction of the Market Basket Measure for the 1999 reference year makesthe stability of the current LICO methodology particularly attractive.
The disadvantage of this option is the aging of the bases, especially the 1986 base. A 1997low income rate that is based on 1986 can be interpreted as the percentage of families thatspent significantly more on essentials in 1997 than the average family spent on essentials in1986. There is no established rule on how frequently the cutoffs should be rebased, thoughthe suitability of a base depends more on the changes in average spending on food, shelterand clothing than on the actual age of the base.
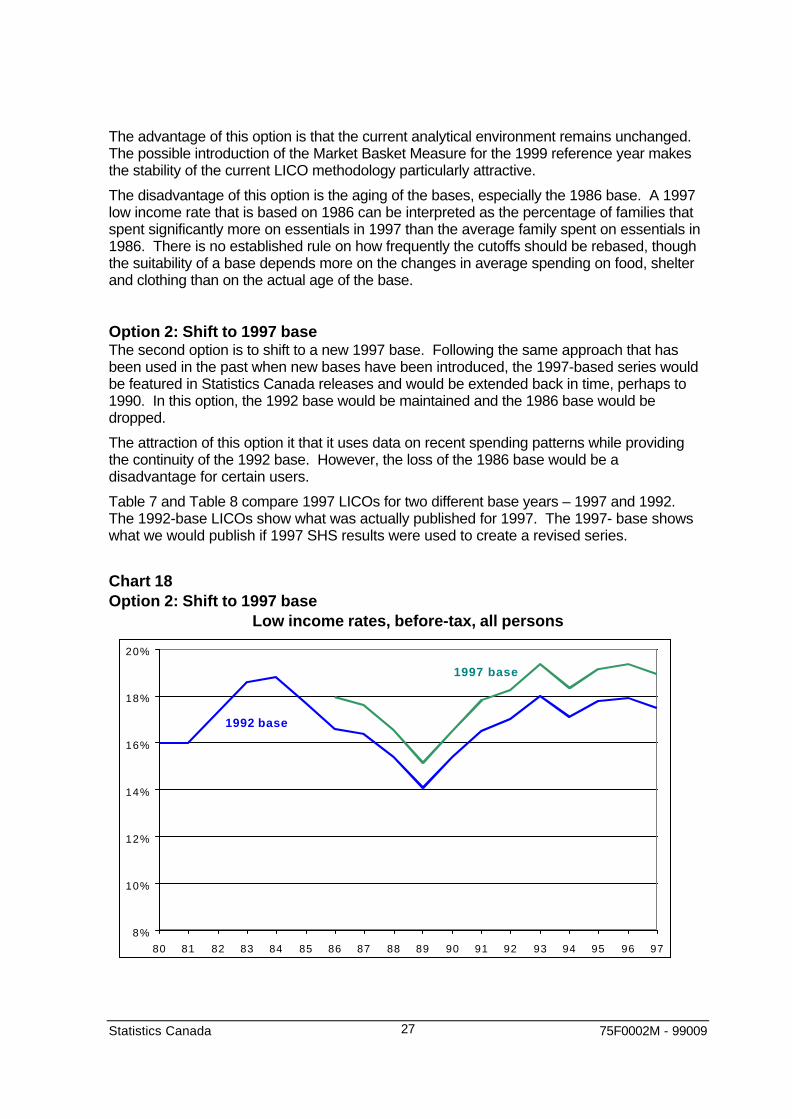
Option 2: Shift to 1997 baseThe second option is to shift to a new 1997 base. Following the same approach that hasbeen used in the past when new bases have been introduced, the 1997-based series wouldbe featured in Statistics Canada releases and would be extended back in time, perhaps to1990. In this option, the 1992 base would be maintained and the 1986 base would bedropped.
The attraction of this option it that it uses data on recent spending patterns while providingthe continuity of the 1992 base. However, the loss of the 1986 base would be adisadvantage for certain users.
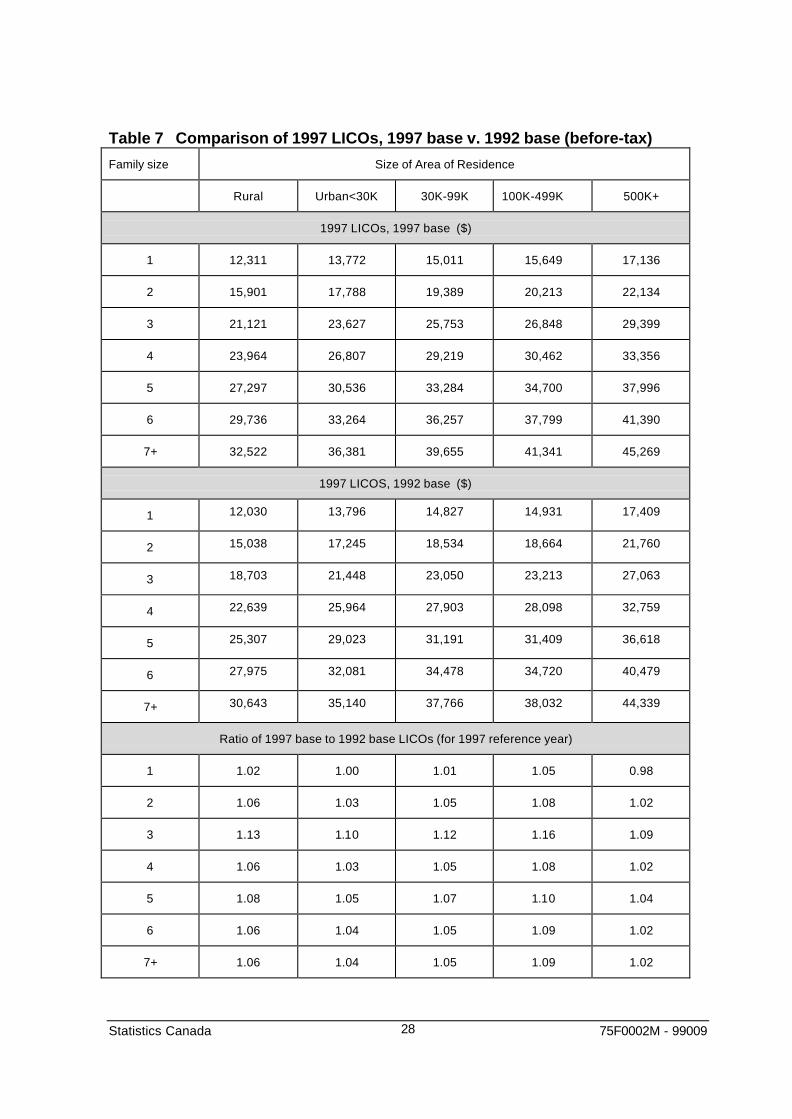
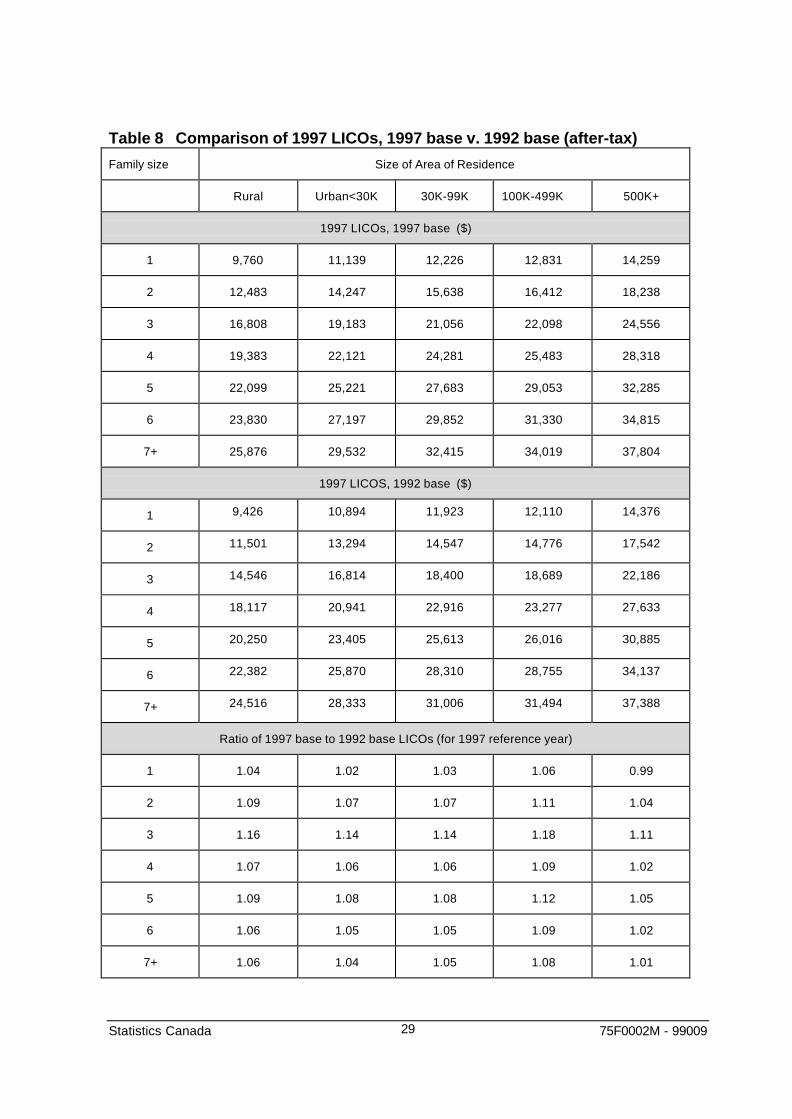
Table 7 and Table 8 compare 1997 LICOs for two different base years – 1997 and 1992.The 1992-base LICOs show what was actually published for 1997. The 1997- base showswhat we would publish if 1997 SHS results were used to create a revised series.
Chart 18Option 2: Shift to 1997 base
Low income rates, before-tax, all persons
8%
10%
12%
14%
16%
18%
20%
80 81 82 83 84 85 86 87 88 89 90 91 92 93 94 95 96 97
1992 base
1997 base
Statistics Canada 75F0002M - 9900928
Table 7 Comparison of 1997 LICOs, 1997 base v. 1992 base (before-tax)
Family size Size of Area of Residence
Rural Urban<30K 30K-99K 100K-499K 500K+
1997 LICOs, 1997 base ($)
1 12,311 13,772 15,011 15,649 17,136
2 15,901 17,788 19,389 20,213 22,134
3 21,121 23,627 25,753 26,848 29,399
4 23,964 26,807 29,219 30,462 33,356
5 27,297 30,536 33,284 34,700 37,996
6 29,736 33,264 36,257 37,799 41,390
7+ 32,522 36,381 39,655 41,341 45,269
1997 LICOS, 1992 base ($)
1 12,030 13,796 14,827 14,931 17,409
2 15,038 17,245 18,534 18,664 21,760
3 18,703 21,448 23,050 23,213 27,063
4 22,639 25,964 27,903 28,098 32,759
5 25,307 29,023 31,191 31,409 36,618
6 27,975 32,081 34,478 34,720 40,479
7+ 30,643 35,140 37,766 38,032 44,339
Ratio of 1997 base to 1992 base LICOs (for 1997 reference year)
1 1.02 1.00 1.01 1.05 0.98
2 1.06 1.03 1.05 1.08 1.02
3 1.13 1.10 1.12 1.16 1.09
4 1.06 1.03 1.05 1.08 1.02
5 1.08 1.05 1.07 1.10 1.04
6 1.06 1.04 1.05 1.09 1.02
7+ 1.06 1.04 1.05 1.09 1.02
Statistics Canada 75F0002M - 9900929
Table 8 Comparison of 1997 LICOs, 1997 base v. 1992 base (after-tax)
Family size Size of Area of Residence
Rural Urban<30K 30K-99K 100K-499K 500K+
1997 LICOs, 1997 base ($)
1 9,760 11,139 12,226 12,831 14,259
2 12,483 14,247 15,638 16,412 18,238
3 16,808 19,183 21,056 22,098 24,556
4 19,383 22,121 24,281 25,483 28,318
5 22,099 25,221 27,683 29,053 32,285
6 23,830 27,197 29,852 31,330 34,815
7+ 25,876 29,532 32,415 34,019 37,804
1997 LICOS, 1992 base ($)
1 9,426 10,894 11,923 12,110 14,376
2 11,501 13,294 14,547 14,776 17,542
3 14,546 16,814 18,400 18,689 22,186
4 18,117 20,941 22,916 23,277 27,633
5 20,250 23,405 25,613 26,016 30,885
6 22,382 25,870 28,310 28,755 34,137
7+ 24,516 28,333 31,006 31,494 37,388
Ratio of 1997 base to 1992 base LICOs (for 1997 reference year)
1 1.04 1.02 1.03 1.06 0.99
2 1.09 1.07 1.07 1.11 1.04
3 1.16 1.14 1.14 1.18 1.11
4 1.07 1.06 1.06 1.09 1.02
5 1.09 1.08 1.08 1.12 1.05
6 1.06 1.05 1.05 1.09 1.02
7+ 1.06 1.04 1.05 1.08 1.01
Statistics Canada 75F0002M - 9900930
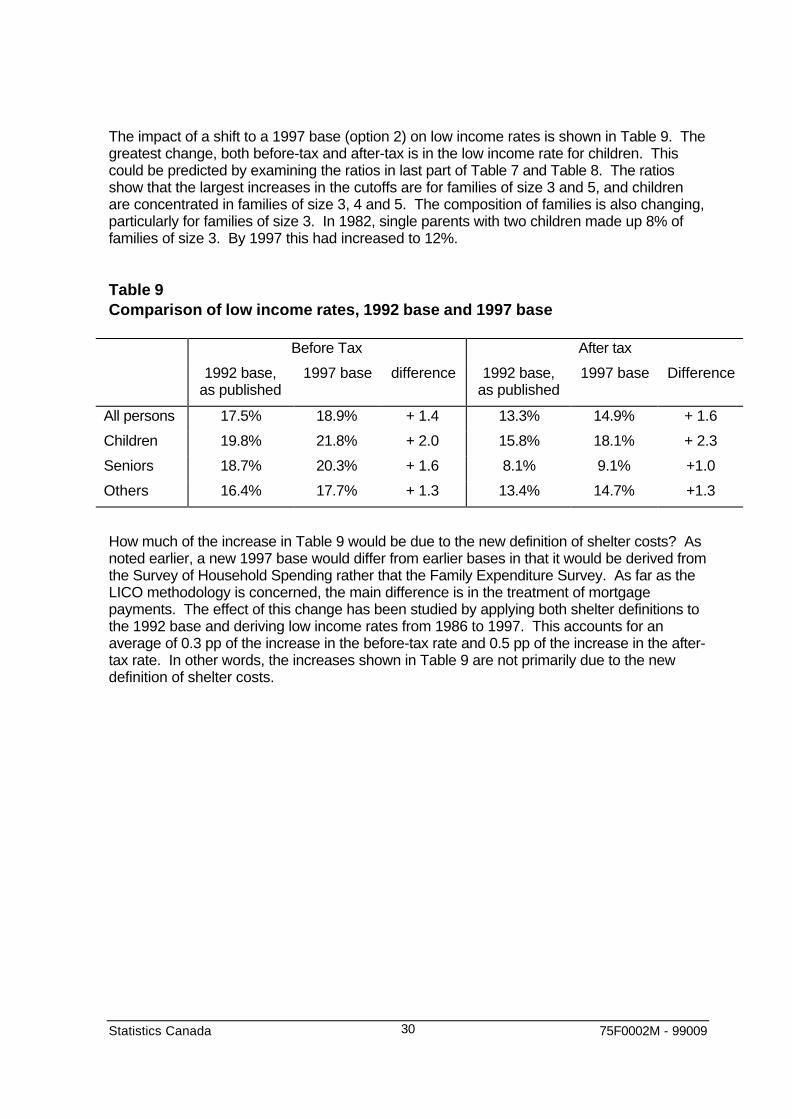
The impact of a shift to a 1997 base (option 2) on low income rates is shown in Table 9. Thegreatest change, both before-tax and after-tax is in the low income rate for children. Thiscould be predicted by examining the ratios in last part of Table 7 and Table 8. The ratiosshow that the largest increases in the cutoffs are for families of size 3 and 5, and childrenare concentrated in families of size 3, 4 and 5. The composition of families is also changing,particularly for families of size 3. In 1982, single parents with two children made up 8% offamilies of size 3. By 1997 this had increased to 12%.
Table 9Comparison of low income rates, 1992 base and 1997 base
Before Tax After tax
1992 base,as published
1997 base difference 1992 base,as published
1997 base Difference
All persons 17.5% 18.9% + 1.4 13.3% 14.9% + 1.6
Children 19.8% 21.8% + 2.0 15.8% 18.1% + 2.3
Seniors 18.7% 20.3% + 1.6 8.1% 9.1% +1.0
Others 16.4% 17.7% + 1.3 13.4% 14.7% +1.3
How much of the increase in Table 9 would be due to the new definition of shelter costs? Asnoted earlier, a new 1997 base would differ from earlier bases in that it would be derived fromthe Survey of Household Spending rather that the Family Expenditure Survey. As far as theLICO methodology is concerned, the main difference is in the treatment of mortgagepayments. The effect of this change has been studied by applying both shelter definitions tothe 1992 base and deriving low income rates from 1986 to 1997. This accounts for anaverage of 0.3 pp of the increase in the before-tax rate and 0.5 pp of the increase in the after-tax rate. In other words, the increases shown in Table 9 are not primarily due to the newdefinition of shelter costs.
Statistics Canada 75F0002M - 9900931
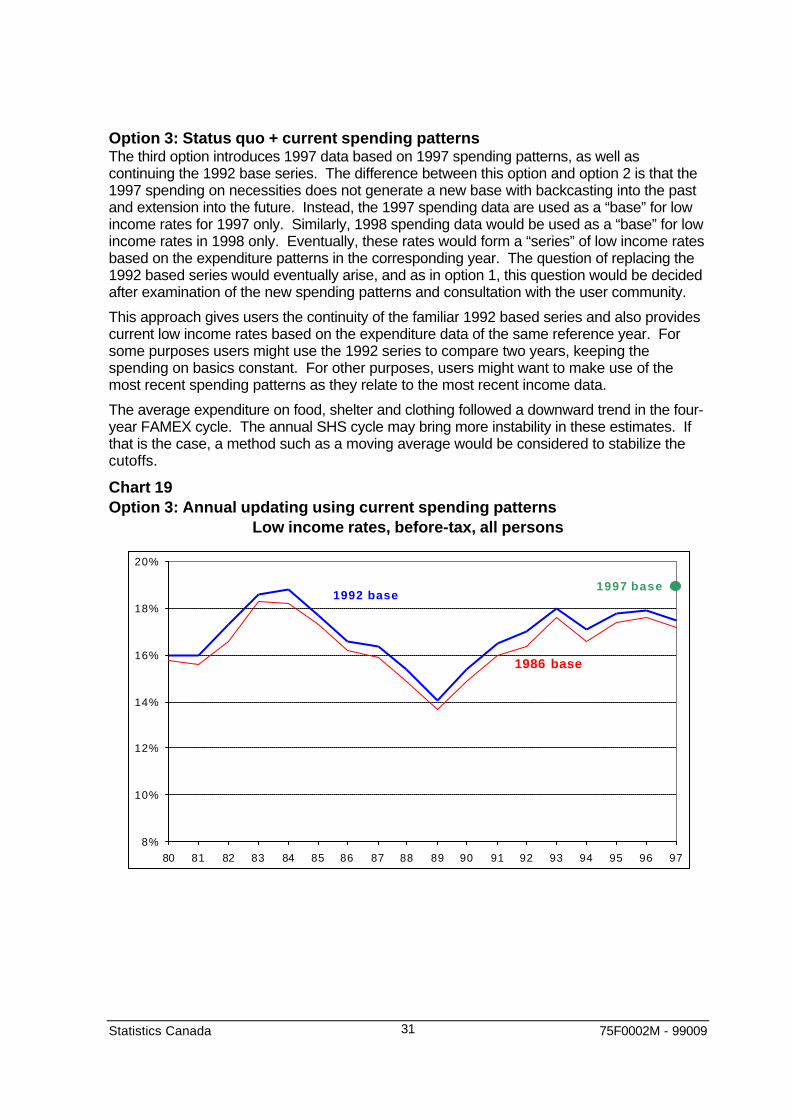
Option 3: Status quo + current spending patternsThe third option introduces 1997 data based on 1997 spending patterns, as well ascontinuing the 1992 base series. The difference between this option and option 2 is that the1997 spending on necessities does not generate a new base with backcasting into the pastand extension into the future. Instead, the 1997 spending data are used as a “base” for lowincome rates for 1997 only. Similarly, 1998 spending data would be used as a “base” for lowincome rates in 1998 only. Eventually, these rates would form a “series” of low income ratesbased on the expenditure patterns in the corresponding year. The question of replacing the1992 based series would eventually arise, and as in option 1, this question would be decidedafter examination of the new spending patterns and consultation with the user community.
This approach gives users the continuity of the familiar 1992 based series and also providescurrent low income rates based on the expenditure data of the same reference year. Forsome purposes users might use the 1992 series to compare two years, keeping thespending on basics constant. For other purposes, users might want to make use of themost recent spending patterns as they relate to the most recent income data.
The average expenditure on food, shelter and clothing followed a downward trend in the four-year FAMEX cycle. The annual SHS cycle may bring more instability in these estimates. Ifthat is the case, a method such as a moving average would be considered to stabilize thecutoffs.
Chart 19Option 3: Annual updating using current spending patterns
Low income rates, before-tax, all persons
8%
10%
12%
14%
16%
18%
20%
80 81 82 83 84 85 86 87 88 89 90 91 92 93 94 95 96 97
1992 base
1986 base
1997 base
Statistics Canada 75F0002M - 9900932
Recommended approach for 1998 and onwardStatistics Canada proposes that option 3 be adopted. This would provide the historicalcontinuity of the 1992 base and would also give a second series based on up-to-dateexpenditure data. Low income rates based on 1986 and low income measures (LIMs) wouldnot be highlighted on release day, but would be available on CD-ROM.
V. Transition from SCF to SLID and Other Changes
Since 1995, Statistics Canada has been working towards the integration of the Survey ofConsumer Finances with the Survey of Labour and Income Dynamics. Both include detailedinformation on the incomes of Canadian families. SCF produced purely cross-sectional datawhile SLID was designed to provide both cross-sectional and longitudinal data. On the otherhand, SLID is a newer survey – it only reached its full target sample in 1996 – and neededsome time to stabilize. From 1995 to 1998, results from the two surveys were comparedand sources of difference either eliminated or documented. This process culminated in 1999with a report comparing results for all the major time series (including low income rates) overa five-year period, entitled A Comparison of the Results of the Survey of Labour andIncome Dynamics and the Survey of Consumer Finances, 1993-1997. The surveystrack each other very well, and, accordingly, the decision was taken to not conduct SCF inApril 1999. The results for the 1998 reference year will come instead from SLID.
There are several facets of the transition from SCF to SLID that have a bearing on lowincome information.
First, when the 1998 data are released, the time series back to 1996 will be based on SLID,while results prior to that will come from SCF. Thus the 1997-1998 changes in low incomewill be based solely on SLID data.
Second, SLID makes use of tax data with the permission of respondents, and conducts anincome interview only when the respondent has not filed a return or would prefer to providethe information by interview. About 80% of SLID income data come from tax records. Thishelps to reduce response burden and sample attrition, and improves the precision of incomereporting. However, the tax data only become available in the autumn of the year followingthe reference year. The target date for the release of SLID data is 15 months after the end ofthe reference year, or about 5 months after the receipt of tax data. On release day, the fulldata set will be available including:
• before-tax and after-tax income• cross-sectional and longitudinal data• the full range of associated labour-market and family information.
Third, data will be disseminated via five main products and services, released over a three-or four-month period:• an overview publication and set of electronic tables, available on release day• a CD-ROM with a very extensive set of tables going back to 1980, interfaced with Beyond
20/20• a cross-sectional, public use microdata file, modeled on the SCF file• a “remote access” service for longitudinal data users and for those wishing to exploit the
full potential of the cross-sectional data, available on release day• a custom retrieval service, also available on release day
Statistics Canada 75F0002M - 9900933
Fourth, there are several adjustments to the sample weights that will be implemented, for the1999 reference year. Both SLID and SCF have benchmarked their sample results toindependent estimates of the population by age, sex and province. These estimates comefrom the Census and are updated using administrative and survey data on demographicchange. Currently, the population estimates used for benchmarking are based on the 1991Census. Many surveys, including the Labour Force Survey, will begin using 1996 Census-based estimated in January 2000. This entails revisions of the historical series to avoid anabrupt change. In the case of income survey data, revisions must be made to both SLID andSCF. This work will not be completed in time for implementation with the 1998 results, butwill be implemented for 1999.
Another planned adjustment to the sample weights will help to stabilize the number offamilies and unattached individuals from year to year and from one survey to another.Currently, surveys like SLID, SCF and SHS, which produce estimates at the family orhousehold level, do not yield similar counts of families or households. Statistics Canada hasrecently developed estimates of the number of households and “families” of one person, twopersons and three or more persons. Household surveys can now benchmark their sampleresults to these estimates. Again, when this is implemented, the historical series requirerevision.
The final development, still in the planning stages, is to adjust the sample weights so that theincome distribution produced by the survey corresponds better to tax data. SLID and SCFover-estimate the number of middle income families, and underestimate both “tails” of theincome distribution. One of the effects is that the estimates of aggregate income exceed theestimates produced via tax data or in the National Accounts.
These adjustments to the sample weights will all be introduced in the same year to reducethe impact on data users.
The fifth and final point relating to the move to SLID is that Statistics Canada will be able toproduce information on low income dynamics as part of its regular program of data releases.The focus until now has been on ensuring that the switch is as seamless as possible, butSLID has a great deal to offer on income stability, low income persistence, and on the labourmarket and family events associated with movements into and out of low income.
Statistics Canada 75F0002M - 9900934
VI. What Should Be Highlighted on “Release Day”
The long-standing SCF practice of highlighting one base rate will continue under SLID. Thisseems a very good idea, given the potential for confusion. However, with SCF, releasesoccurred over a period of many months and were basically organized by income concept –income before tax, earnings, income after tax, and so on. Beginning in 1998, the plan is toprovide before- and after-tax results in the initial data release, and to analyze the twotogether. Also, as noted earlier, the focus will shift from before-tax to after-tax low incomerates because we now have the capacity to do this.
More specifically, although the content has not yet been finalized, the initial release will likelycontain summary results on:
• trends in market income (earnings plus investment income), government transfers andtotal income
• trends in income taxes and after-tax income• trends in low income, based on after-tax income• trends in the severity and persistence of low income• trends in income inequality based on market income and after-tax income• results for Canada, the provinces and major cities.
The Daily will highlight after-tax low income rates (calculated using 1992-base LICOs), butthe tables available on release day will also include before-tax low income rates. Othermeasures of low income, including 1986-base estimates, Low Income Measures and thenew measure based on “current spending patterns” will not be available on release day butwill follow later on the CD-ROM. (See Part V for details on the planned products andservices.)
VII. Future Research
Low Income Cutoffs are produced for seven family sizes (1 to 7+) and for five communitysizes (rural to cities of more than 500,000). Since 1969, average family size has decreasedand urbanization has increased, causing the distribution of Canadians to become moreconcentrated in a few of the 35 combinations. As shown in Chart 8, 46% of Canadians live infive of these groups, i.e. in families one to five persons in cities of more than 500,000.
Underlying the LICO methodology is the assumption that families of the same size in thesame size of area of residence can achieve a similar standard of living with the sameincome. But what happens when the costs vary considerably across a category? Inparticular, the cost of shelter in Montreal is quite different from the cost of shelter in Torontoand Vancouver, yet the same cutoffs are applied to residents of these three cities, along withresidents of Ottawa-Hull, Edmonton, Calgary, Hamilton, Winnipeg and Quebec City.
A possible area of future research would be to restructure the 35 cell matrix of LICOs byadding city-specific LICOs for Toronto, Montreal and Vancouver. To balance this increase,some of the existing sizes of area of residence could be combined, and the number of familysizes could be reduced. Statistics Canada intends to investigate this issue, although otherplanned tasks make it unlikely that the research could be carried out until late in the2000/2001 fiscal year.

Statistics Canada 75F0002M - 9900935
VIII. How To Contact Us
Some of the documents referred to in this report can be obtained on the Statistics Canadawebsite. Those who wish to comment on the plans outlined in the report are invited tocontact the following persons by March 1, 2000.
Cathy CottonManagerSurvey of Labour and Income DynamicsIncome Statistics DivisionStatistics CanadaJean Talon Building, 5-D2Ottawa K1A 0T6
Tel: 613-951-2300Fax: 613-951-0085E-Mail: [email protected]
Maryanne WebberDirectorIncome Statistics DivisionStatistics CanadaJean Talon Building, 5-B4
Tel: 613-951-2899Fax: 613-951-0085E-Mail: [email protected]
Statistics Canada 75F0002M - 9900936
Appendix
On Poverty and Low IncomeIvan P. Fellegi
Chief Statistician of Canada
Recently the news media have provided increasing coverage of Statistics Canada's lowincome cutoffs and their relationship to the measurement of poverty. At the heart of thedebate is the use of the low income cutoffs as poverty lines, even though Statistics Canadahas clearly stated, since their publication began over 25 years ago, that they are not. Thehigh profile recently given to this issue has presented Statistics Canada with a welcomeopportunity to restate its position on these issues.
Many individuals and organizations both in Canada and abroad understandably want to knowhow many people and families live in "poverty", and how these levels change. Reflecting thisneed, different groups have at different times developed various measures which purportedto divide the population into those who were poor and those who were not.
In spite of these efforts, there is still no internationally-accepted definition of poverty - unlikemeasures such as employment, unemployment, gross domestic product, consumer prices,international trade and so on. This is not surprising, perhaps, given the absence of aninternational consensus on what poverty is and how it should be measured. Suchconsensus preceded the development of all other international standards.
The lack of an internationally-accepted definition has also reflected indecision as to whetheran international standard definition should allow comparisons of well-being across countriescompared to some international norm, or whether poverty lines should be establishedaccording to the norms within each country.
The proposed poverty lines have included, among others, relative measures (you are poor ifyour means are small compared to others in your population) and absolute measures (youare poor if you lack the means to buy a specified basket of goods and services designatedas essential). Both approaches involve judgmental and, hence, ultimately arbitrary choices.
In the case of the relative approach, the fundamental decision is what fraction of the overallaverage or median income constitutes poverty. Is it one-half, one-third, or some otherproportion? In the case of the absolute approach, the number of individual judgementsrequired to arrive at a poverty line is far larger. Before anyone can calculate the minimumincome needed to purchase the "necessities" of life, they must decide what constitutes a"necessity" in food, clothing, shelter and a multitude of other purchases, from transportationto reading material.
The underlying difficulty is due to the fact that poverty is intrinsically a question of socialconsensus, at a given point in time and in the context of a given country. Someoneacceptably well off in terms of the standards in a developing country might well beconsidered desperately poor in Canada. And even within the same country, the outlookchanges over time. A standard of living considered as acceptable in the previous centurymight well be viewed with abhorrence today.
It is through the political process that democratic societies achieve social consensus indomains that are intrinsically judgmental. The exercise of such value judgements is certainlynot the proper role of Canada's national statistical agency which prides itself on its objectivity,and whose credibility depends on the exercise of that objectivity.

Statistics Canada 75F0002M - 9900937
In Canada, the Federal/Provincial/Territorial Working Group on Social DevelopmentResearch and Information was established to create a method of defining and measuringpoverty. This group, created by Human Resources Development Canada and socialservices ministers in the various jurisdictions, has proposed a preliminary market basketmeasure of poverty - a basket of market-priced goods and services. The poverty line wouldbe based on the income needed to purchase the items in the basket.
Once governments establish a definition, Statistics Canada will endeavour to estimate thenumber of people who are poor according to that definition. Certainly that is a task in linewith its mandate and its objective approach. In the meantime, Statistics Canada does notand cannot measure the level of "poverty" in Canada.
For many years, Statistics Canada has published a set of measures called the low incomecutoffs. We regularly and consistently emphasize that these are quite different frommeasures of poverty. They reflect a well-defined methodology which identifies those who aresubstantially worse off than the average. Of course, being significantly worse off than theaverage does not necessarily mean that one is poor.
Nevertheless, in the absence of an accepted definition of poverty, these statistics have beenused by many analysts to study the characteristics of the relatively worst off families inCanada. These measures have enabled us to report important trends, such as the changingcomposition of this group over time. For example, 20 to 30 years ago the elderly were by farthe largest group within the "low income" category, while more recently lone-parent familiesheaded by women have grown in significance.
Many people both inside and outside government have found these and other insights to beuseful. As a result, when Statistics Canada carried out a wide-ranging public consultation adecade ago, we were almost unanimously urged to continue to publish our low incomeanalyses. Furthermore, in the absence of a generally accepted alternative methodology, themajority of those consulted urged us to continue to use our present definitions.
In the absence of politically-sanctioned social consensus on who should be regarded as"poor", some people and groups have been using the Statistics Canada low income lines asa de facto definition of poverty. As long as that represents their own considered opinion ofhow poverty should be defined in Canada, we have no quarrel with them: all of us are free tohave our own views. But they certainly do not represent Statistics Canada's views abouthow poverty should be defined.

Statistics Canada 75F0002M - 9900938
Bibliography
Cotton, C., Giles, P. and Hewer, P. (1999), “A Comparison of the Results of the Survey ofLabour and Income Dynamics (SLID) and the Survey of Consumer Finances (SCF) 1993-1997”, Statistics Canada, Income Research Paper Series, 7F002M-99007.
Podoluk, J.R. (1967), Income of Canadians, 1961 Census Monograph, Dominion Bureau ofStatistics, Ottawa
Wolfson, MC and Evans, J.M. (1989), “Statistics Canada Low Income Cut-OffsMethodological Concern and Possibilities”, Statistics Canada, discussion paper”