Embed Size (px)
Citation preview
-0--0-
Confidential
Shin Kong Financial Holding
2007 Taiwan Global Investors ConferenceFinancial PanelLondon/New York, September 2007

-1--1-
This presentation and the presentation materials distributed herewith may include forward-looking statements. All statements, other than statements of historical facts, that address activities, events or developments that Shin Kong Financial Holding Company (“Shin Kong FHC”) expect or anticipate will or may occur in the future (including but not limited to projections, targets, estimates and business plans) are forward-looking statements. Shin Kong FHC’s actual results or developments may differ materially from those indicated by these forward-looking statements as a result of various factors and uncertainties, including but not limited to price fluctuations, actual demand, exchange rate fluctuations, market shares, competition, changes in legal, financial and regulatory frameworks, international economic and financial market conditions, political risks, cost estimates and other risks and factors beyond our control. In addition, Shin Kong FHC makes the forward-looking statements referred to herein as of today and undertakes no obligation to update these statements.
Disclaimer

-2--2-
I. Consolidation
II. Opportunities in Taiwan
III. Opportunities in China
IV. Shin Kong Financial Holding
Contents
-2-
-3--3-
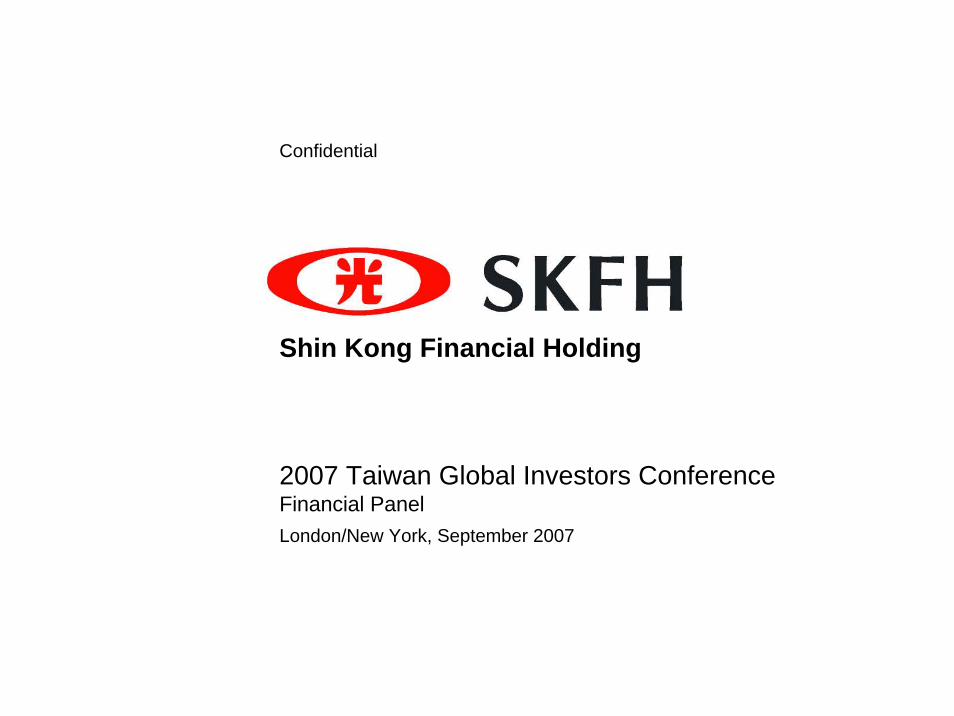
Taiwan is over-banked and over-branched
Top 5 bank market share, 2005 Percent
Taiwan’s banking market is highly fragmented . . .
Number of branches per 10,000 capita, 2006
Current Mid term: similar to Seoul
End state: similar to Hong Kong
Potential number of branches needed in Taipei city (1)
Number of branches per square kilometer, 2006
. . . and highly over-branched
27
34
37
56
56
59
67
72
77
83
90
Spain
Korea
Taiwan
Italy
Germany
Sweden
Holland
France
UK
Japan
Switzerland
3.95Seoul
3.58Taipei
1.28Kuala Lumpur
1.27Chicago
1.18
0.22Sydney
Hong Kong
0.82New York
0.50Tokyo
3.70Taipei
2.71Chicago
2.39Seoul
1.92Kuala Lumpur
1.76Hong Kong
1.28Sydney
0.88Tokyo
0.80New York
463
628
972
-52%-35%
Note:(1) Estimated based on population proportionSource: McKinsey & Company
-4--4-
-10
-5
0
5
10
15
20
25
1990 1991 1992 1993 1994 1995 1996 1997 1998 1999 2000 2001 2002 2003 2004 2005 2006
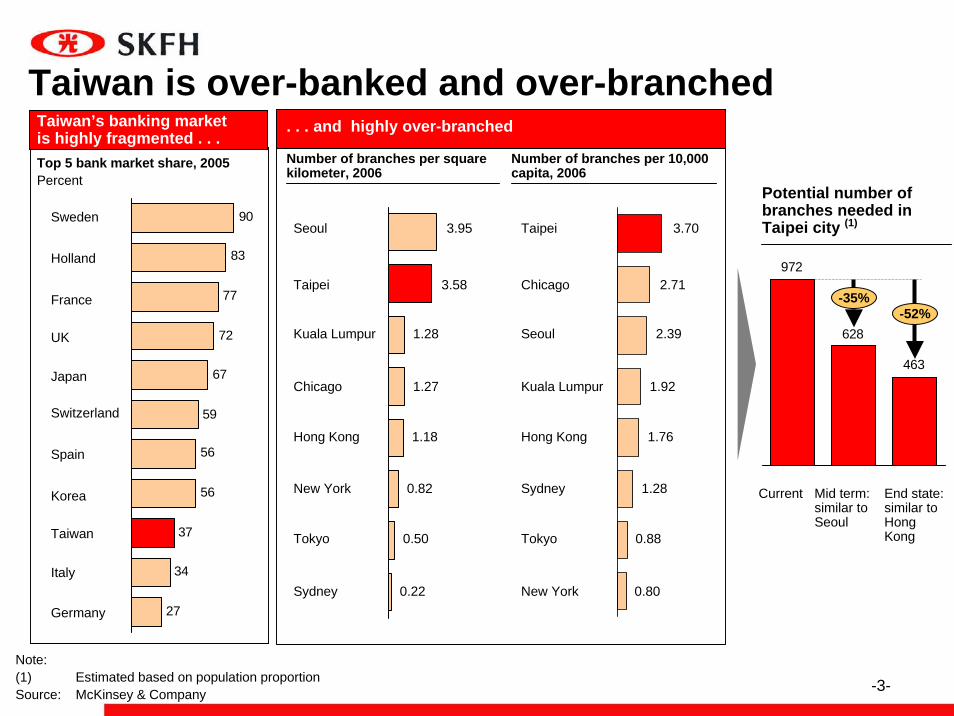
PercentOverall banking return is unsteady
Cost of equity (1)
ROE (2)
Value destruction
Note:(1) Assumes 5% risk premium and 10-year government bond yield as risk free rate(2) Domestic bank onlySource: Central Bank, Bloomberg

-5--5-
P/B - 2007EROE - 2007E
Banking returns and valuations are low
1.5x
1.6x
2.0x
2.3x
2.6x
2.7x
2.8x
3.1x
3.1x
3.6xAustralia
China
Indonesia
Malaysia
Hong Kong
India
Thailand
Singapore
Taiwan
Korea9.5%
10.6%
13.4%
14.9%
17.5%
19.6%
21.4%
22.2%
25.4%
27.7%Australia
Korea
Hong Kong
Malaysia
Indonesia
India
China
Singapore
Taiwan
Thailand
Source: Citigroup Investment Research estimates
ROE and P/B of Taiwan financial institutions v.s. regional peers
-6--6-
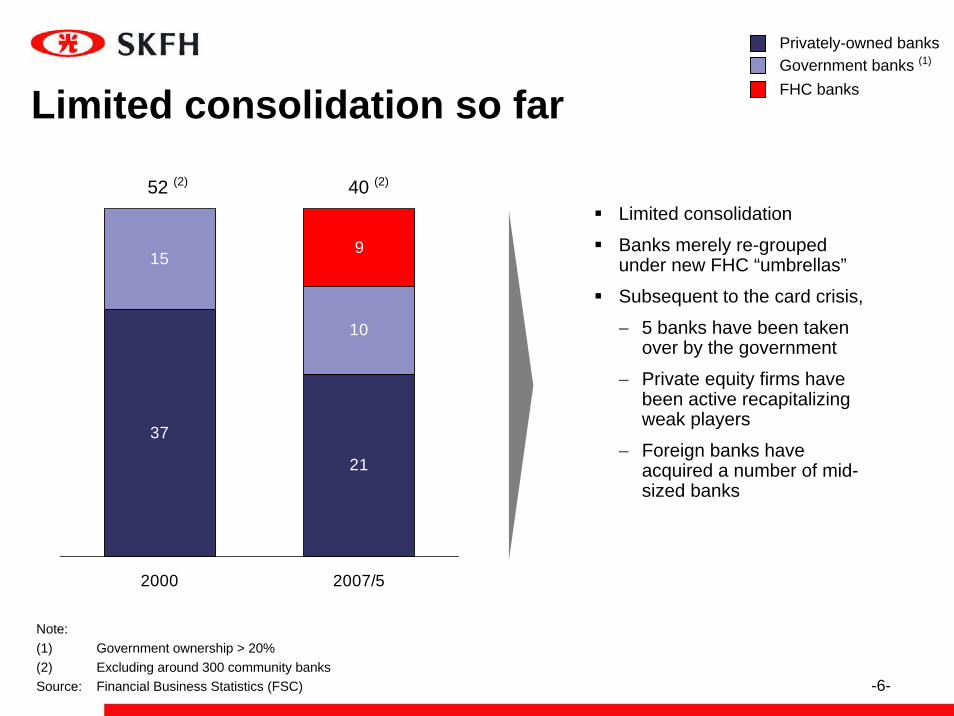
Limited consolidation so far
Privately-owned banksGovernment banks (1)
FHC banks
52 (2)
Limited consolidation
Banks merely re-grouped under new FHC “umbrellas”
Subsequent to the card crisis,
− 5 banks have been taken over by the government
− Private equity firms have been active recapitalizing weak players
− Foreign banks have acquired a number of mid-sized banks
37
21
15
10
9
2000 2007/5
40 (2)
Note:(1) Government ownership > 20%(2) Excluding around 300 community banksSource: Financial Business Statistics (FSC)
-7--7-
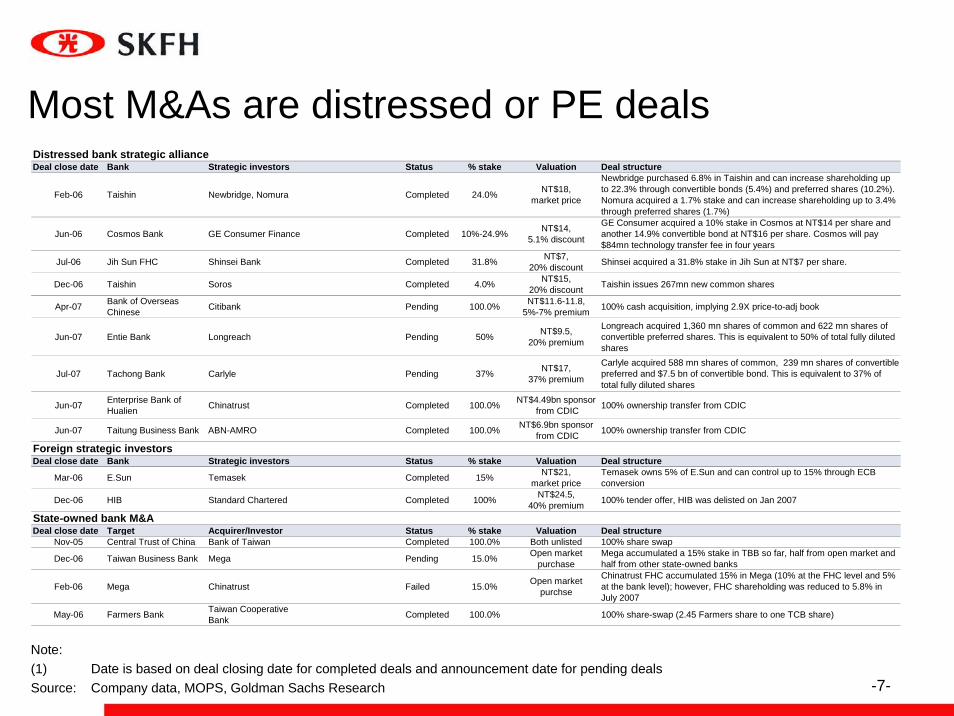
Note:(1) Date is based on deal closing date for completed deals and announcement date for pending dealsSource: Company data, MOPS, Goldman Sachs Research
Distressed bank strategic allianceDeal close date Bank Strategic investors Status % stake Valuation Deal structure
Feb-06 Taishin Newbridge, Nomura Completed 24.0% NT$18,market price
Newbridge purchased 6.8% in Taishin and can increase shareholding upto 22.3% through convertible bonds (5.4%) and preferred shares (10.2%).Nomura acquired a 1.7% stake and can increase shareholding up to 3.4%through preferred shares (1.7%)
Jun-06 Cosmos Bank GE Consumer Finance Completed 10%-24.9% NT$14,5.1% discount
GE Consumer acquired a 10% stake in Cosmos at NT$14 per share andanother 14.9% convertible bond at NT$16 per share. Cosmos will pay$84mn technology transfer fee in four years
Jul-06 Jih Sun FHC Shinsei Bank Completed 31.8% NT$7,20% discount Shinsei acquired a 31.8% stake in Jih Sun at NT$7 per share.
Dec-06 Taishin Soros Completed 4.0% NT$15,20% discount Taishin issues 267mn new common shares
Apr-07 Bank of OverseasChinese Citibank Pending 100.0% NT$11.6-11.8,
5%-7% premium 100% cash acquisition, implying 2.9X price-to-adj book
Jun-07 Entie Bank Longreach Pending 50% NT$9.5,20% premium
Longreach acquired 1,360 mn shares of common and 622 mn shares ofconvertible preferred shares. This is equivalent to 50% of total fully dilutedshares
Jul-07 Tachong Bank Carlyle Pending 37% NT$17,37% premium
Carlyle acquired 588 mn shares of common, 239 mn shares of convertiblepreferred and $7.5 bn of convertible bond. This is equivalent to 37% oftotal fully diluted shares
Jun-07 Enterprise Bank ofHualien Chinatrust Completed 100.0% NT$4.49bn sponsor
from CDIC 100% ownership transfer from CDIC
Jun-07 Taitung Business Bank ABN-AMRO Completed 100.0% NT$6.9bn sponsor from CDIC 100% ownership transfer from CDIC
Foreign strategic investorsDeal close date Bank Strategic investors Status % stake Valuation Deal structure
Mar-06 E.Sun Temasek Completed 15% NT$21,market price
Temasek owns 5% of E.Sun and can control up to 15% through ECBconversion
Dec-06 HIB Standard Chartered Completed 100% NT$24.5,40% premium 100% tender offer, HIB was delisted on Jan 2007
State-owned bank M&ADeal close date Target Acquirer/Investor Status % stake Valuation Deal structure
Nov-05 Central Trust of China Bank of Taiwan Completed 100.0% Both unlisted 100% share swap
Dec-06 Taiwan Business Bank Mega Pending 15.0% Open marketpurchase
Mega accumulated a 15% stake in TBB so far, half from open market andhalf from other state-owned banks
Feb-06 Mega Chinatrust Failed 15.0% Open marketpurchse
Chinatrust FHC accumulated 15% in Mega (10% at the FHC level and 5%at the bank level); however, FHC shareholding was reduced to 5.8% inJuly 2007
May-06 Farmers Bank Taiwan CooperativeBank Completed 100.0% 100% share-swap (2.45 Farmers share to one TCB share)
Most M&As are distressed or PE deals

-8--8-
Value creating transactions for Taiwan NOT EXHAUSTIVE
Transaction types
Mid-sized bank consolidation
Revenue deals:Involves merger of a well performing bank and another large or mid-sized bank to unleash its revenue potential
Mid-sizedBank 1
Mid-sizedBank 2
Mid-sizedBank 3
Mid-sizedBank 4
2
Large bank consolidation
Cost deals:Involves merger of two or more large banks
Large Bank 1
Large Bank 2
Large Bank 3
Large Bank 4
Wel
l per
form
ing
unde
r per
form
ing
3
2+3
3
22
Small bank clean ups
Cleanup deals:Involves roll-up and clean up of unsustainable banks
Small Bank 1
Small Bank 2
Small Bank 3
Small Bank 4
1
1 1
-9--9-
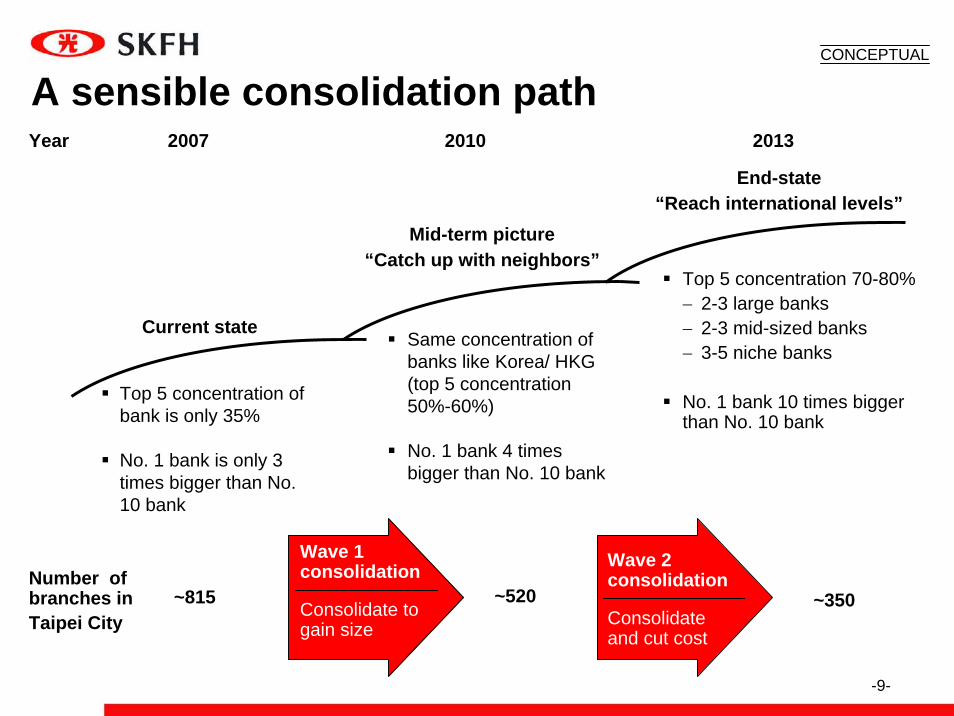
A sensible consolidation path
Mid-term picture “Catch up with neighbors”
End-state “Reach international levels”
Current state
Number of branches inTaipei City
Same concentration of banks like Korea/ HKG (top 5 concentration 50%-60%)
No. 1 bank 4 times bigger than No. 10 bank
Top 5 concentration 70-80% − 2-3 large banks− 2-3 mid-sized banks− 3-5 niche banks
No. 1 bank 10 times bigger than No. 10 bank
Wave 1 consolidation
Consolidate to gain size
Wave 2 consolidation
Consolidate and cut cost
~815 ~520 ~350
Year 2007 2010 2013
CONCEPTUAL
Top 5 concentration of bank is only 35%
No. 1 bank is only 3 times bigger than No. 10 bank
-10--10-
I. Consolidation
II. Opportunities in Taiwan
III. Opportunities in China
IV. Shin Kong Financial Holding
Contents
-10-
-11--11-
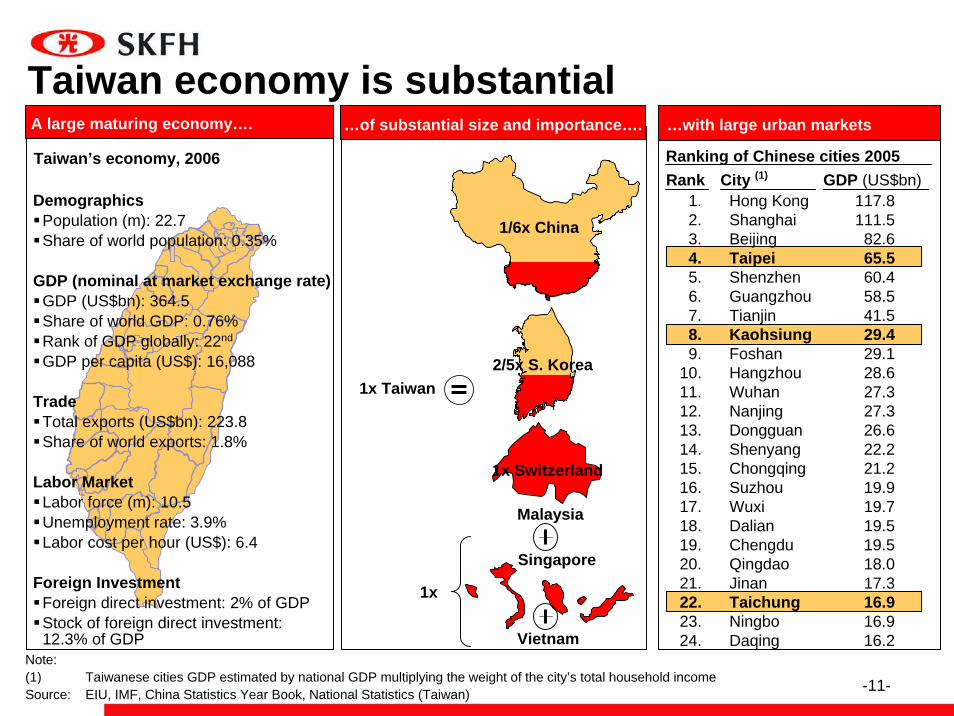
Taiwan economy is substantial
Taiwan’s economy, 2006
1x
Ranking of Chinese cities 2005
Hong KongShanghaiBeijingTaipeiShenzhenGuangzhouTianjinKaohsiungFoshanHangzhouWuhanNanjingDongguanShenyangChongqingSuzhouWuxiDalianChengduQingdaoJinanTaichungNingboDaqing
City (1)
117.8111.582.665.560.458.541.529.429.128.627.327.326.622.221.219.919.719.519.518.017.316.916.916.2
GDP (US$bn)Rank1.2.3.4.5.6.7.8.9.
10.11.12.13.14.15.16.17.18.19.20.21.22.23.24.
A large maturing economy…. …of substantial size and importance…. …with large urban markets
1x Taiwan
1/6x China
2/5x S. Korea
Tainan
Chiayi
DemographicsPopulation (m): 22.7Share of world population: 0.35%
GDP (nominal at market exchange rate)GDP (US$bn): 364.5Share of world GDP: 0.76%Rank of GDP globally: 22nd
GDP per capita (US$): 16,088
TradeTotal exports (US$bn): 223.8Share of world exports: 1.8%
Labor MarketLabor force (m): 10.5Unemployment rate: 3.9%Labor cost per hour (US$): 6.4
Foreign InvestmentForeign direct investment: 2% of GDPStock of foreign direct investment: 12.3% of GDP
Note:(1) Taiwanese cities GDP estimated by national GDP multiplying the weight of the city’s total household incomeSource: EIU, IMF, China Statistics Year Book, National Statistics (Taiwan)
Malaysia
Singapore
Vietnam
1x Switzerland
-12--12-
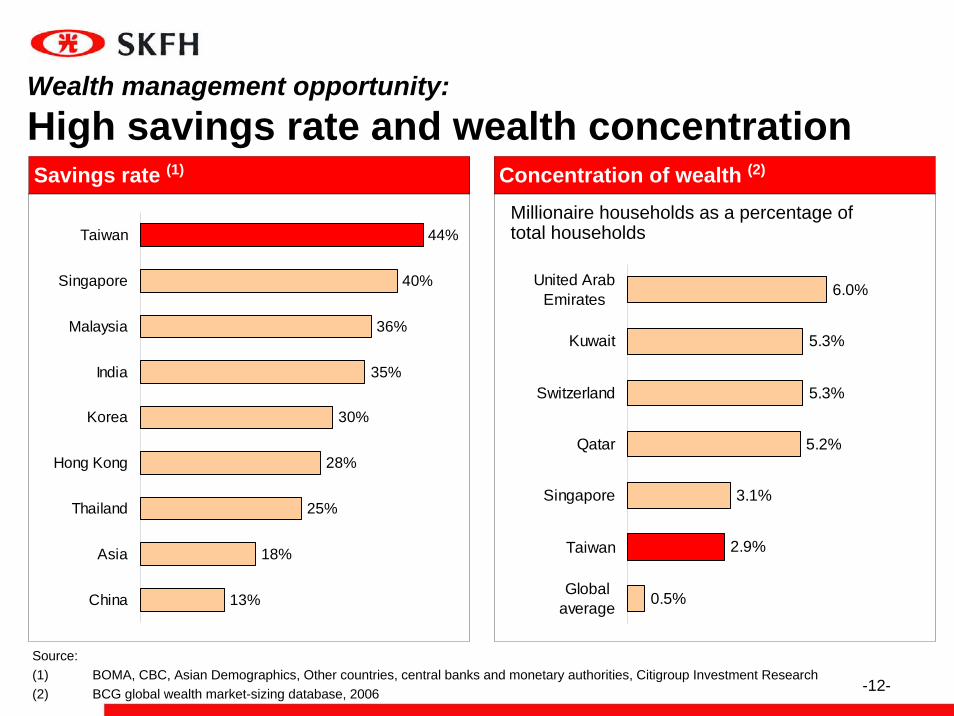
Wealth management opportunity:High savings rate and wealth concentration
36%
40%
35%
30%
28%
25%
18%
13%
44%
China
Asia
Thailand
Hong Kong
Korea
India
Malaysia
Singapore
Taiwan
Savings rate (1) Concentration of wealth (2)
Source:(1) BOMA, CBC, Asian Demographics, Other countries, central banks and monetary authorities, Citigroup Investment Research(2) BCG global wealth market-sizing database, 2006
Millionaire households as a percentage of total households
0.5%
2.9%
3.1%
5.2%
5.3%
5.3%
6.0%United ArabEmirates
Kuwait
Switzerland
Qatar
Singapore
Taiwan
Globalaverage

-13--13-
0
5,000
10,000
15,000
20,000
25,000
30,000
35,000
40,000
45,000
1997 1998 1999 2000 2001 2002 2003 2004 2005
NT$ bn
20,92522,601
25,232 24,06 24,93126,840
55%
9%3%23%
3%7%
56%
10%3%22%
3%6%
55%
10%3%
22%
4%6%
54%
12%3%21%
5%5%
55% 55%
1%14%
7%5%
16%
1%
8%
20%
0%
36,674
7%
24%
1%
18%
51%
0%
32,128
8%
25%
1%
17%
48%
0%
6%
22%
1%
19%
52%
0%41,225
NT$ bn
18%
Cash & deposits
Insurance &Pension
Fixed incomesecurities
Equities
Mutual funds Miscellaneous
Source: CBC, Citigroup Investment Research
Taiwanese household assets (NT$bn, Percent)
Wealth management opportunity:Asset migration away from deposits
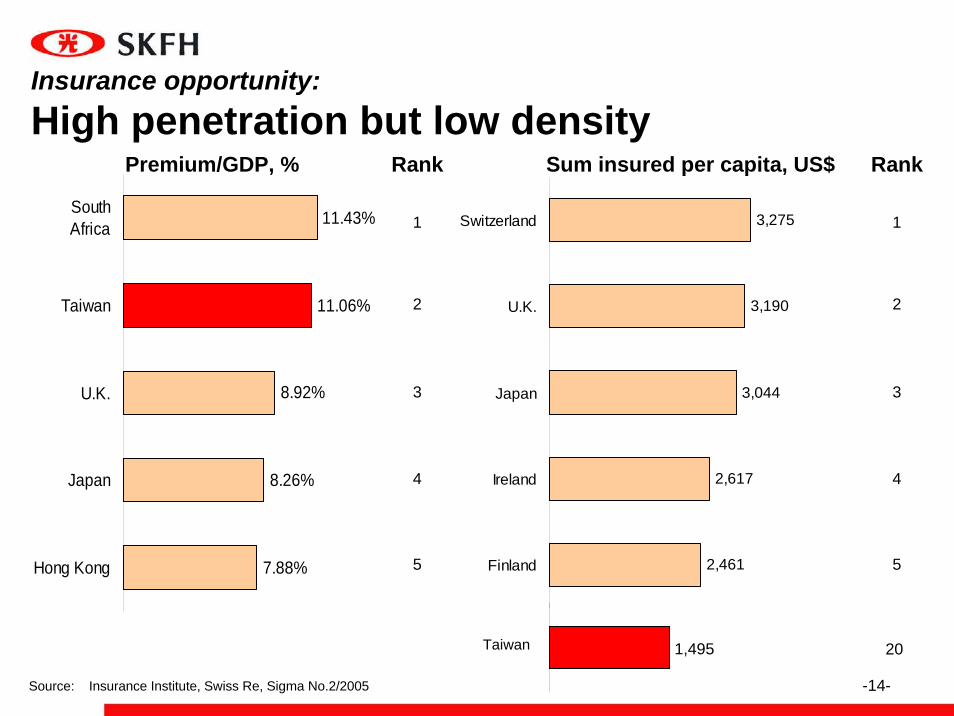
-14--14-
11.43%
11.06%
8.92%
8.26%
7.88%
SouthAfrica
Taiwan
U.K.
Japan
Hong Kong
Source: Insurance Institute, Swiss Re, Sigma No.2/2005
Sum insured per capita, US$
1,495
Rank
1
5
2
3
4
Rank
1
5
2
3
4
20
Premium/GDP, %
2,461
2,617
3,044
3,190
3,275Switzerland
U.K.
Japan
Ireland
Finland
Taiwan
Insurance opportunity:High penetration but low density
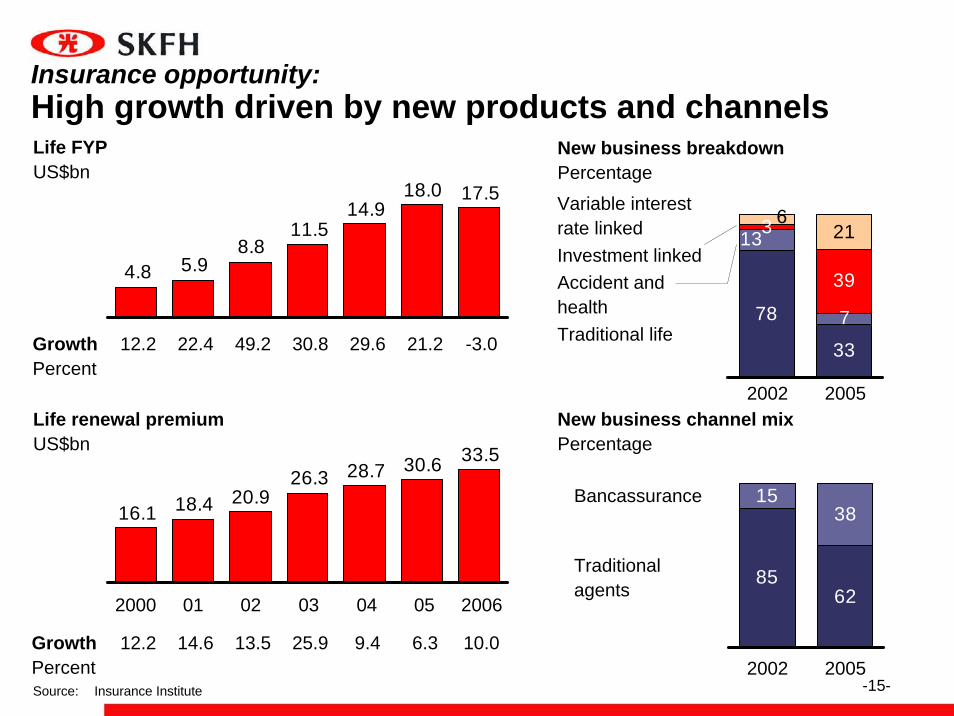
-15--15-Source: Insurance Institute
Life FYPUS$bn
18.014.9
11.58.8
5.94.8
17.5
GrowthPercent
Life renewal premiumUS$bn 33.530.628.726.3
20.918.416.1
042000 01 02 03 05 2006
GrowthPercent
12.2 22.4 49.2 30.8 29.6 21.2
12.2 14.6 13.5 25.9 9.4 6.3
New business breakdownPercentage
New business channel mixPercentage
7
3
33
78
13
39
621
2002 2005
Variable interest rate linkedInvestment linkedAccident and healthTraditional life
1538
6285
2002 2005
Bancassurance
Traditional agents
-3.0
10.0
Insurance opportunity:High growth driven by new products and channels
-16--16-
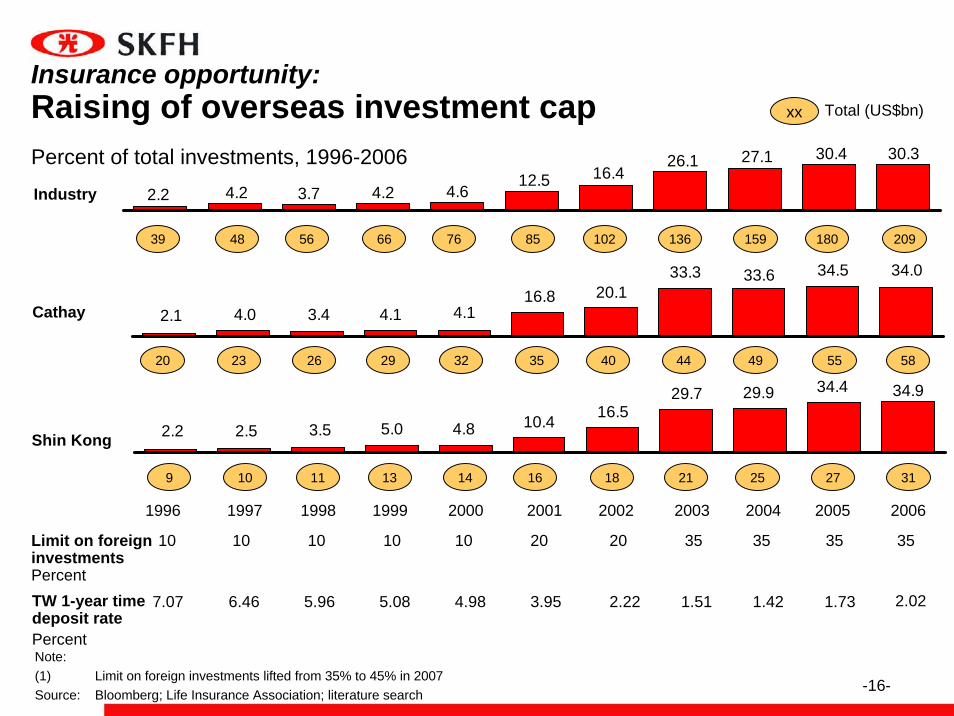
Industry
Percent of total investments, 1996-2006
Cathay
Shin Kong
Limit on foreign investmentsPercent
xx Total (US$bn)
TW 1-year time deposit ratePercent
30.330.427.126.116.412.5
4.64.23.74.22.2
34.034.5
2.1 4.0 3.4 4.1 4.116.8 20.1
33.3 33.6
20 23 26 29 32 35 40 44 49 55
34.934.4
2.2 2.5 3.5 5.0 4.8 10.4 16.529.7 29.9
9 10 11 13 14 16 18 21 25
10 10 10 10 10 20 20 35 35
7.07 6.46 5.96 5.08 4.98 3.95 2.22 1.51 1.42
20041998 20031997 200220011999 20001996
27
35
1.73
2005
20948 56 66 76 85 102 136 15939 180
58
31
2006
35
2.02
Note:(1) Limit on foreign investments lifted from 35% to 45% in 2007Source: Bloomberg; Life Insurance Association; literature search
Insurance opportunity:Raising of overseas investment cap
-17--17-
I. Consolidation
II. Opportunities in Taiwan
III. Opportunities in China
IV. Shin Kong Financial Holding
CONTENTS
-17-

-18--18-
Total life premium
China life insurance market is growing rapidly and ranked number 8 in the world
Total life premium 2006
US$bn
22.7
42.4
4.7 7.5
27.4
2002
49.9
2006
Individual
Group
+16%
50
72
90
95
178
312
363
534US
Japan
UK
France
Germany
Italy
S. Korea
China
Source: China Insurance Year Book, Swiss Re report
-19--19-
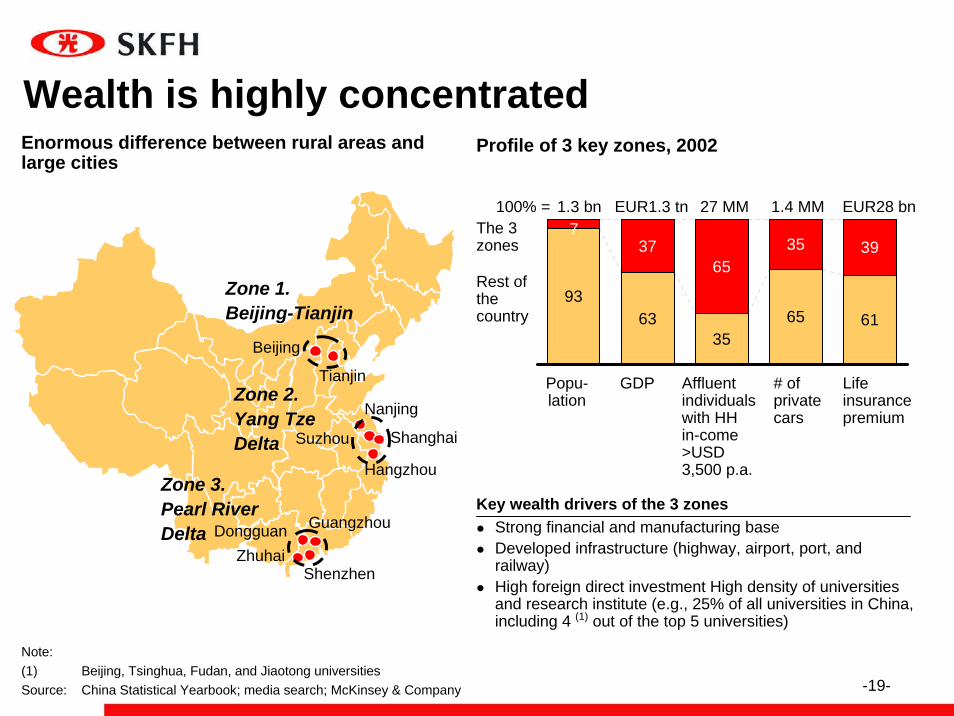
9363
3565 61
3765
35 397
Key wealth drivers of the 3 zonesStrong financial and manufacturing baseDeveloped infrastructure (highway, airport, port, and railway)High foreign direct investment High density of universities and research institute (e.g., 25% of all universities in China, including 4 (1) out of the top 5 universities)
Profile of 3 key zones, 2002
The 3 zones
Rest of the country
Popu-lation
GDP Affluent individuals with HH in-come >USD 3,500 p.a.
# of private cars
100% = 1.3 bn
Beijing
Tianjin
Nanjing
Suzhou
Hangzhou
Shanghai
Guangzhou
ShenzhenZhuhai
Dongguan
Zone 1.Beijing-Tianjin
Zone 3.Pearl RiverDelta
Zone 2.Yang TzeDelta
EUR1.3 tn 27 MM 1.4 MM
Life insurance premium
EUR28 bn
Wealth is highly concentratedEnormous difference between rural areas and large cities
Note:(1) Beijing, Tsinghua, Fudan, and Jiaotong universitiesSource: China Statistical Yearbook; media search; McKinsey & Company
-20--20-
I. Consolidation
II. Opportunities in Taiwan
III. Opportunities in China
IV. Shin Kong Financial Holding
Contents
-20-
-21--21-
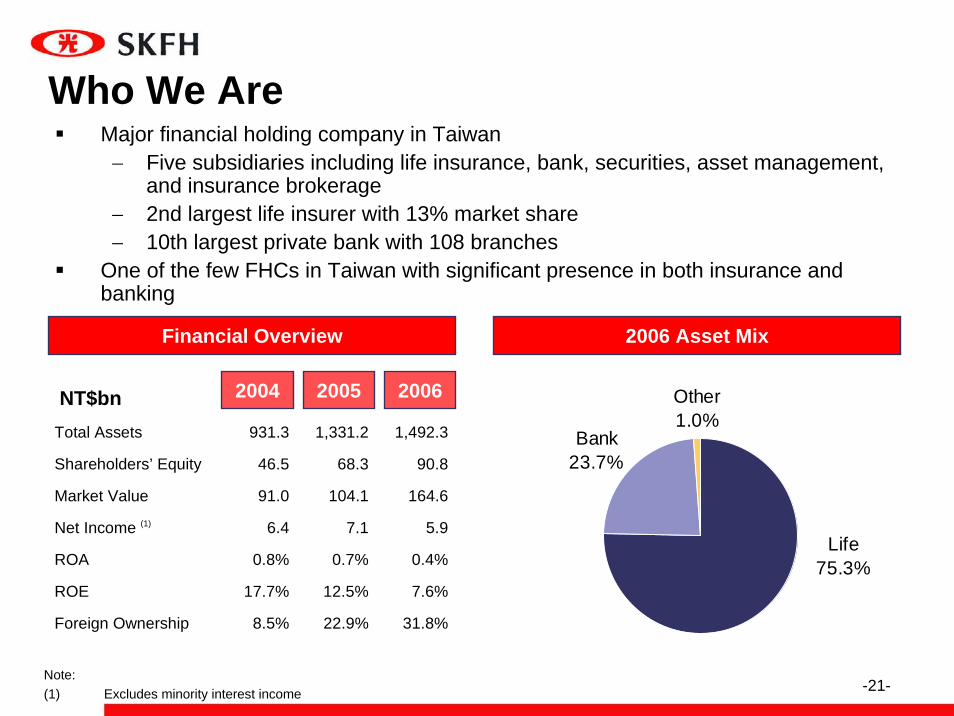
Who We AreMajor financial holding company in Taiwan− Five subsidiaries including life insurance, bank, securities, asset management,
and insurance brokerage− 2nd largest life insurer with 13% market share− 10th largest private bank with 108 branches
One of the few FHCs in Taiwan with significant presence in both insurance and banking
2006 Asset Mix
Other1.0%
Bank23.7%
Life75.3%
Financial Overview
NT$bn 2006 20052004
Total Assets 931.3 1,331.2 1,492.3
Shareholders’ Equity 46.5 68.3 90.8
Market Value 91.0 104.1 164.6
Net Income (1) 6.4 7.1 5.9
ROA 0.8% 0.7% 0.4%
ROE 17.7% 12.5% 7.6%
Foreign Ownership 8.5% 22.9% 31.8%
Note:(1) Excludes minority interest income

-22--22-
Corporate Structure
Date of Incorporation 7/1963 1/1997 12/2001 9/1992 1/2003
0.58Assets (NT$bn) 1,117.2 351.5 13.8 0.11
< 0.1%
(78)
3
2.4%
% of Group Assets 75.3% 23.7% 0.9% < 0.1%
Earnings (NT$mn) 11,771 (7,276) 596 44
Branches/Offices 360 108 7 1
Market Share 12.6% 1.3% 0.3% -
Shin Kong Life
Shin Kong Bank (1)
Shin Kong Investment
Trust
Shin Kong Insurance Brokers
Note:(1) Completed integration of Macoto Bank on December 31, 2005(2) Shin Kong Investment Trust (SKIT) incorporated into the FHC on July 18, 2006, and merged with New Light Asset
Management (SKFH’s existing asset management platform) on October 9, 2006
Shin Kong Securities
Shin Kong Financial Holding
Unique Integrated Financial Services Platform
-23--23-
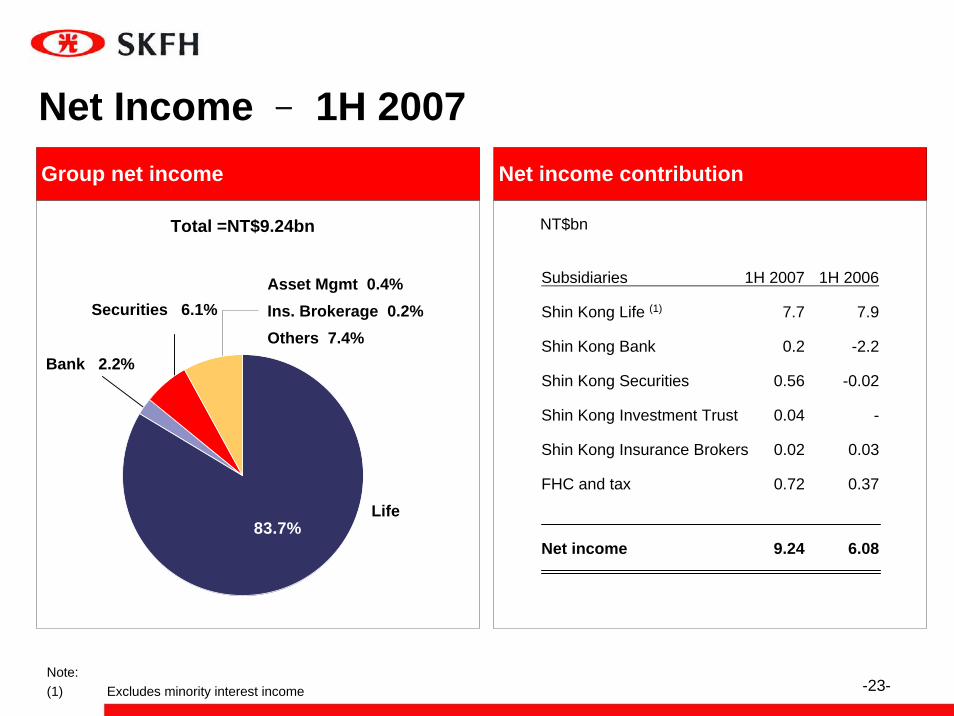
Net Income – 1H 2007Net income contribution
Subsidiaries 1H 2007 1H 2006
Shin Kong Life (1) 7.7 7.9
Shin Kong Bank 0.2 -2.2
Shin Kong Securities 0.56 -0.02
Shin Kong Investment Trust 0.04 -
Shin Kong Insurance Brokers 0.02 0.03
FHC and tax 0.72 0.37
Net income 9.24 6.08
NT$bn
Group net income
Life
Total =NT$9.24bn
Asset Mgmt 0.4%Ins. Brokerage 0.2%Others 7.4%
Note:(1) Excludes minority interest income
83.7%
Bank 2.2%
Securities 6.1%
-24--24-
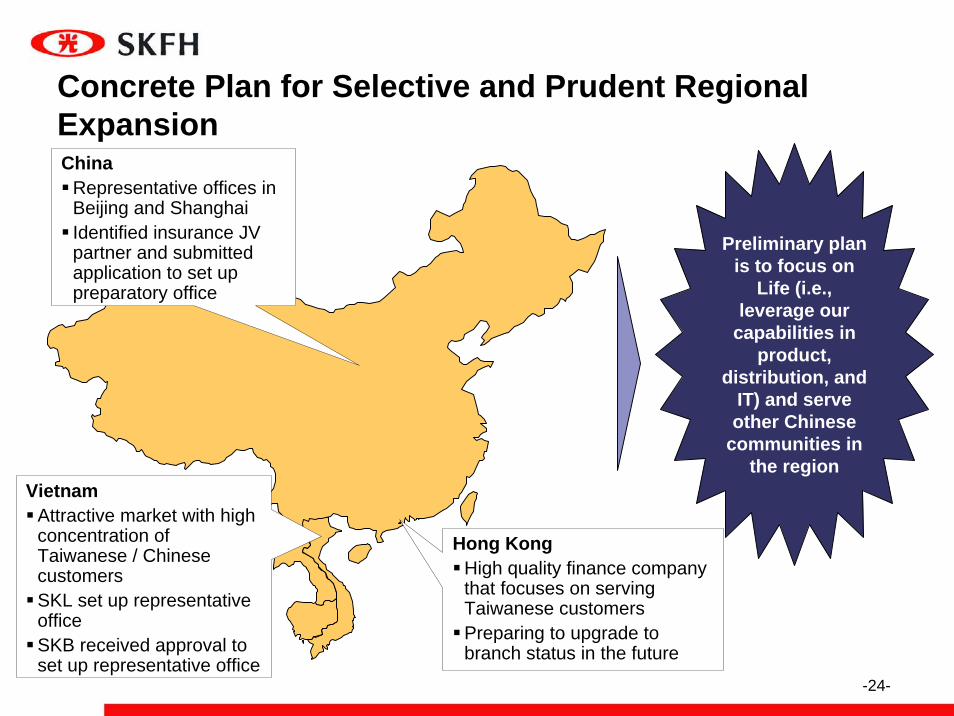
Concrete Plan for Selective and Prudent Regional Expansion
Hong KongHigh quality finance company that focuses on serving Taiwanese customersPreparing to upgrade to branch status in the future
ChinaRepresentative offices in Beijing and ShanghaiIdentified insurance JV partner and submitted application to set up preparatory office
VietnamAttractive market with high concentration of Taiwanese / Chinese customersSKL set up representative office SKB received approval to set up representative office
Preliminary plan is to focus on
Life (i.e., leverage our
capabilities in product,
distribution, and IT) and serve other Chinese
communities in the region