Embed Size (px)
Citation preview

Shear Behaviour
of Concrete Beams Reinforced with
Glass Fibre Reinforced Plastic
by
Fariborz Farahmand
A Thesis
presented to the University of Manitoba
in partial fulfilment of the
requirements for the degree of
Master of Science
Structural Engineering Division Department of Civil & Geological Engineering
University of Manitoba Winnipeg, Manitoba
May, 1996

ABSTRACT
Glass Fibre Reinforced Plastic (GFRP) rods have been widely employed in the aeronautical
and chemical industries over the past twenty years. However, their use in structural engineering
applications is rather recent. GFRP rods have an advantage over conventional materials in being
corrosion resistant, which reduces the deterioration of structures. Other advantages of GFRP rods
are high strength-to-weight ratio, magnetic neutrality and relatively favourable fatigue behaviour. The
applications of GFRP rods in civil engineering are explored in the field of short and medium span
bridges, tunnel lining, bridge enclosures and marine structures.
Despite the fact that the behaviour of GFRP rods has been well studied for application in the
field of aerospace and for prestressed concrete in flexure, a complete understanding of the shear
behaviour of GFRP reinforced concrete beams has not been achieved.
This thesis presents an experimental program undertaken at the Structural Engineering and
Construction R&D Facility of the University of Manitoba to test a total of nine beams reinforced with
GFRP and three control beams reinforced with steel. Shear reinforcement was not used in any of
these beams. All of these beams were tested under a three-point load over a simple span. In this
study the effect of the longitudinal reinforcement and shear-span-to-depth ratio on the shear strength
of GFRP beams were investigated. Based on this investigation design recommendations and guide
lines are proposed.

ACKNOWLEDGMENTS
The author would like to express his sincere thanks to Professor John. I. Glanville and
Professor Sami H. Rizkalla for their excellent guidance and advice during the investigation. Their
outstanding support and encouragement went beyond the academic roles.
Many special thanks are extended to Dr. Kenneth. R. Hughes. His constant help,
encouragement and enthusiasm was nothing less than inspirational.
The author wishes to thank Dr. Kedar randon for serving on his committee.
Technical assistance given by Messrs. Eduard Lemke, Moray McVey and Scott Sparrow
during the experimental work is greatly appreciated.
The financial assistance provided by Natural Sciences and Engineering Research Council of
Canada is greatly acknowledged.
Finally, the author wishes to express his deeply-felt gratitude to his family who made all this
possible.
11

TABLE OF CONTENTS
ABSTR.ACT ..................................................................................................................................... .i
ACKNOWLEDGl\.1ENTS ................................................................................................................ .ii
TABLE OF CONTENTS ................................................................................................................. iii
LIST OF TABlES ......................................................................................................................... viii
LIST OF FIGURES .......................................................................................................................... ix
NOTATION .................................................................................................................................... xv
CHAPTER 1: INTRODUCTION
1.1 GE"NERAL ...................................................................................................................... 1
1.2 OBJECTIVE .................................................................................................................... 2
1.3 SCOPE ............................................................................................................................ 2
CHAPTER 2: LITERATURE REVIEW
A- ADY ANCED COIv.£POSITES FOR CONCRETE STRUCTURES ................................... 3
2.1 BACKGROUND ............................................................................................................. 3
2.2 DEFINITION OF FRP ..................................................................................................... 4
2.3 APPLICATIONS OF FRP ............................................................................................... 5
1- Short Span Bridges ................................................................................................ 6
2- Long Span Bridges ....................................................................... '" ....................... 7
111

" ... ".
\ 3- Repair of Structures ............................................................................................... 7
4- Repair of Bridges ................................................................................................... 8
s- Bridge Enclosures .................................................................................................. 8
6- Tunnel Lining ......................................................................................................... 9
7- Marine Structures ................................................................................................... 9
B- SHEAR BEHAVIOUR OF REINFORCED CONCRETE :MEIvIBERS ........................... 1 0
2.4 IN'TRODUCTION ......................................................................................................... 10
2.S BEAMS WITHOUT STIRR.UPS ................................................................................... 1 0
2.6 INTERNAL FORCES IN A BEAM WIlHOUT STIRRUPS ......................................... 11
2.7 SHEAR 'IR.AN'SFER .................................................................................................... 12
(a) Shear Transfer by Concrete Shear Stress ............................................................. 12
(b) Interface Shear Transfer ...................................................................................... 12
(c) Dowel Shear ....................................................................................................... 13
(d) Arch Action ........................................................................................................ 13
2.8 MODES OF INCLINED CRACKING AND SHEAR FAILURE ................................... 14
2.9 EFFECT OF SHEAR-SP AN-TO-DEPTH RATIO ......................................................... IS
(a) Normal and Long Beams of Rectangular Cross Section: ald>2.S ......................... 1S
(b) Short Beams: 1 < aid < 2.S ....................... ; ......................................................... 16
(c) Deep Beams: 0 < aid < 1 ..................................................................................... 16
2.10 EXISTING MODELS ........................................ ; ......................................................... 18
2.11 SHEAR STRENGTH OF BEAMS USING CFRM ...................................................... 19
IV

CHAPTER 3: EXPERIMENTAL PROGRAM ................................................................................ 27
3.1 GE"NERAL .................................................................................................................... 27
3.2 MATERIALS ................................................................................................................ 27
3.2.1 Fibre Properties ............................................................................................... 28
3.2.2 Glass ............................................................................................................... 28
3.2.3 GFRP Reinforcements ..................................................................................... 29
3.2.3.1 Bond Properties ofGFRP Reinforcements ......................................... 30
3.2.4 Steel Reinforcements ....................................................................................... 32
3.2.5 Concrete .......................................................................................................... 32
3.3 Instrumentation .............................................................................................................. 33
3.3.1 Crack Width Measurements ............................................................................. 3 3
3.3.2 Deflection Measurements ................................................................................. 3 3
3.3.3 Data Acquisition System .................................................................................. 34
3.3.4 Pilot Studies .................................................................................................... 34
3.3.5 Fabrication of the Specimens ........................................................................... 35
3.3.6 Test Set-up ...................................................................................................... 36
3.3.7 Testing Procedure ............................................................................................ 37
CHAPTER 4: TEST RESlJLTS ...................................................................................................... 49
4.1 GENERAL .................................................................................................................... 49
4.2 BEHAVIOUR. OF TEST BEAMS ................................................................................. 49
4.2.1 Beam #1 .......................................................................................................... 50
v

4.2.2 BeaJll #2 .......................................................................................................... 51
4.2.3 BeaJll #3 .......................................................................................................... 51
4.2.4 BeaJll #4 .......................................................................................................... 52
4.2.5 BeaJll #5 .......................................................................................................... 53
4.2.6 BeaJll #6 .......................................................................................................... 54
4.2.7 BeaJll #7 .......................................................................................................... 55
4.2.8 BeaJll #8 .......................................................................................................... 56
4.2.9 BeaJll #9 .......................................................................................................... 56
4.2.10 CBEAM1 ...................................................................................................... 57
4.2.11 CBEAM2 ...................................................................................................... 58
4.2.12 CBEAM3 ...................................................................................................... 59
CHAPTER 5: ANALYSIS AND DISCUSSION OF TEST RESULTS ........................................... 88
5.1 WfRODUCTION ......................................................................................................... 88
5.2 GENERAL .................................................................................................................... 88
5.3 EFFECT OF SHEAR-SPAN-TO-DEPTHRATIO ......................................................... 89
5.4 EFFECT OF REINFORCEMENT RATIO ..................................................................... 90
5.5 COMPARISON OF GFRP BEAMS AND CONTROL BEAMS .................................... 91
5.6 COMPARISON OF TEST RESULTS AND EXISTING EQUATIONS ........................ 91
5.6.1 Control Beatns ................................................................................................. 93
5.6.2 GFRP Beatns ................................................................................................... 94
VI

CHAPTER 6: SlJI\.1MARY AND CONCLUSIONS ...................................................................... 118
6.1 SlJI\.1MAR Y ........................................... ..................................................................... . 118
6.2 CONCLUSIONS .............. .......................................................................................... . 118
6.3 RECOMMENDATIONS FOR FUTURE WORK ........................................................ 118
REFERENCES .......................................................................................................................... ... 121
APPENDIX A: CALCULATION OF CRACK WIDTHS ............................................................ .. 126
VII

LIST OF TABLES
Table
3-1 Tensile properties ofISOROD-GFRP reinforcements ........................................................... 38
3-2 Concrete mix desigtl ............................................................................................................. 38
5-1 Description of test beams and test results ............................................................................. 96
5-2 Comparison of test results and predicted values .................................................................... 97
5-3 Comparison of test results and multiplying Vc from ACI 11.3.1.1 by different ratios of
(E~sr=J ..................................................................................................................................... 98
5-4 Comparison of test results and multiplying Vc from ACI 11.3.2.1 by different ratios of
~ (E~~ ..................................................................................................................................... 98
5-5 Comparison of test results and multiplying Vc from Zsutty's equation by different ratios of
(EGFRlEsr=J ..................................................................................................................................... 99
5-6 Comparison of test results and multiplying Vc from CSA simplified method by different ratios
of(E~~ ................................................................................................................................. 99
5-7 Comparison of test results and mUltiplying Vc from JSCE by different ratios of
(EGFRlEsr=J ................................................................................................................................... 1 00
5-8 Comparison of test results and modifying Vc from ACI 11.3.2.1, Zsutty and JSCE by
multiplying p by (EGFRlEsr=> ......................................................................................................... 1 00
Vlll

LIST OF FIGURES
Figure
2-1 Retrofitting of chimney ........................................................................................................ 20
2-2 Structural floor of bridge enclosure ...................................................................................... 21
2-3 Tunnel lining by FRP grids ................................................................................................... 21
2-4 Internal forces in a cracked beam without stirrups ................................................................ 22
2-5 Typical shear failures in short beams ..................................................................................... 22
2-6 Types of inclined cracks ....................................................................................................... 23
2-7 Failures of slender beams ..................................................................................................... 23
2-8 Modes of failure of deep beams ............................................................................................ 24
2-9 ReseIVe shear capacity of deep beams .................................................................................. 24
2-10 Inclination of shear cracks in deep beams ............................................................................. 25
2-11 Relative beam strength MJMtI versus aid and p ................................................................... 25
2-12 Model for flexure-shear interaction ....................................................................................... 26
2-13 Model for flexure-shear interaction ....................................................................................... 26
3-1 Tensile stress-strain diagrams for various reinforcing fibres .................................................. 39
3-2 Material characteristics of ISOROD-GFRP reinforcements ................................................... 40
3-3 Arrangement ofdemec points ............................................................................................... 40
3-4 L VDT configuration for midspan deflection measurements ................................................... 41
3-5 General view of test set-up ................................................................................................... 41
IX

~ 3-6 Details of Pilot Beam #1 ...................................................................................................... 42
3-7 Details of Pilot Beam #2 ...................................................................................................... 42
3-8 Details of Pilot Beam #3 ...................................................................................................... 43
3-9 Steel angles and steel reinforcements in the middle of the beams .......................................... .43
3-10 Crack patterns of Pilot Beam # 1 ................. : ......................................................................... 44
3-11 Crack patterns of Pilot Beam #2 ........................................................................................... 44
3-12 Crack patterns of Pilot Beam #3 ........................................................................................... 45
3-13 Sketches of crack patterns of Pilot Beam #1 (a/d=3), Pilot Beam #2 (a/d=2) and pilot
Beam #3 (a/d=3) .............................................................................................................................. 46
3-14 Steel spirals at the end of the beams ..................................................................................... 4 7
3-15 Steel reinforcements in the middle of beams ......................................................................... 47
3-16 Schematic of test set-up ....................................................................................................... 48
4-1 Details of Beam # 1 ............................................................................................................... 60
4-2 Details of Beam #2 ............................................................................................................... 60
4-3 Details of Beam #3 ............................................................................................................... 61
4-4 Details of Beam #4 ............................................................................................................... 61
4-5 Details of Beam #5 ............................................................................................................... 62
4-6 Details of Beam #6 ............................................................................................................... 62
4-7 Details of Beam #7 ............................................................................................................... 63
4-8 Details of Beam #8 ...................................................... · ......................................................... 63
4-9 Details of Beam #9 ............................................................................................................... 64
4-10 Details of CBEAMI .................................................... : .......... : ............................................. 64
r' x
4-11 Details ofCBEAM2 ............................................................................................................. 65
4-12 Details ofCBEAM3 ............................................................................................................. 65
4-13 Crack patterns of Beam # 1 ................................................................................................... 66
4-14 Crack patterns of Beam #2 ................................................................................................... 66
4-15 Crack patterns of Beam #3 ................................................................................................... 67
4-16 Crack patterns of Beam #4 ................................................................................................... 67
4-17 Crack patterns of Beam #5 ................................................................................................... 68
4-18 Crack patterns of Beam #6 ................................................................................................... 68
4-19 Crack patterns of Beam #7 ................................................................................................... 69
4-20 Crack patterns of Beam #8 ................................................................................................... 69
4-21 Crack patterns of Beam #9 ................................................................................................... 70
r' 4-22 Crack patterns ofCBEAM1 ................................................................................................. 70
4-23 Crack patterns of CBEAM2 ................................................................................................. 71
4-24 Crack patterns of CBEAMJ ............................................................ : .................................... 71
4-25 Load-deflection diagram of Beam # 1 .................................................................................... 72
4-26 Load-deflection diagram of Beam #2 ...................................... ~ ............................................. 72
4-27 Load-deflection diagram of Beam #3 .................................................................................... 73
4-28 Load-deflection diagram of Beam #4 .................................................................................... 73
4-29 Load-deflection diagram of Beam #5 .................................................................................... 74
4-30 Load-deflection diagram of Beam #6 .................................................................................... 74
4-31 Load-deflection diagram of Beam #7 .................................................................................... 75
4-32 Load-deflection diagram of Beam #8 ................................................................................... 75
Xl

4-33 Load-deflection diagram of Beam #9 .................................................................................... 76
4-34 Load-deflection diagram ofCBEAM1 .................................................................................. 76
4-35 Load-deflection diagram of CBEAM2 .................................................................................. 77
4-36 Load-deflection diagram ofCBEAM3 .................................................................................. 77
4-37 Sketches of crack patterns of Beams #1, #2 and #3 (a/d=4) ................................................. 78
4-38 Sketches of crack patterns of Beams #4, #5 and #6 (a/d=3) ................................................. 79
4-39 Sketches of crack patterns of Beams #7, #8 and #9 (a/d=2) ................................................. 80
4-40 Sketches of crack patterns ofCBEAMl (a/d=4), CBEAM2 (a/d=3) and CBEAM3 (a/d=2) .. 81
4-41 Load-crack width diagram of Beam #1 ................................................................................. 82
4-42 Load-crack width diagram of Beam #2 ................................................................................. 82
4-43 Load-crack width diagram of Beam #3 ................................................................................. 83
r' 4-44 Load-crack width diagram of Beam #4 ................................................................................. 83
4-45 Load-crack width diagram of Beam #5 ................................................................................. 84
4-46 Load-crack width diagram of Beam #6 ................................................................................. 84
4-47 Load-crack width diagram of Beam #7 ................................................................................. 85
4-48 Load-crack width diagram of Beam #8 ................................................................................. 85
4-49 Load-crack width diagram of Beam #9 ................................................................................. 86
4-50 Load-crack width diagram ofCBEAM2 ............................................................................... 86
4-51 Load-crack width diagram ofCBEAM3 ............................................................................... 87
5-1 Comparing the load-deflection diagram of Beams # 1, #4 and #7 ........................................ -; 101
5-2 Comparing the load-deflection diagram of Beams #2, #5 and #8 ......................................... 101
5-3 Comparing the load-deflection diagram of Beams #3, #6 and #9 ......................................... 102
XII

5-4 Comparing the load-deflection diagram of CBEAM1, CBEAM2 and CBEAM3 ................. 1 02
5-5 Shear strength verses aid for the test beams ........................................................................ 1 03
5-6 Shear strength verses p for the test beams .......................................................................... 103
5-7 Load-deflection diagram of Beam #3 and CBEAMI (ald=4) ............. ................................. 104
5-8 Load-deflection diagram of Beam #6 and CBEAM2 (ald=3) .............................................. I04
5-9 Load-deflection diagram of Beam #9 and CBEAM3 (ald=2) .............................................. 105
5-10 Comparison of the shear strength of GFRP beams and ACI 11.3.1.1 .................................. 105
5-11 Comparison of the shear strength of GFRP beams and ACI 11.3 .2.1 .................................. 106
5-12 Comparison of the shear strength ofGFRP beams and Zsutty's equation ............................. I06
5-13 Comparison of the shear strength of GFRP beams and CSA ............................................... I 07
5-14 Comparison of the shear strength of GFRP beams and JSCE .............................................. I 07
r' 5-15 Comparison of the shear strength of control beams and different equations ......................... 1 08
5-16 Comparison of test results and multiplying Vc from ACI lI.3~ 1.1 by (EG~s,ccJ ............... I 08
5-17 Comparison of test results and multiplying Vc from ACI 11.3.2.1 by (EG~stcc.) ............... I09
5-18 Comparison of test results and multiplying Vc from Zsutty's equation by (EG~stcc.) ......... I09
5-19 Comparison of test results and mUltiplying Vc from CSA by (EG~stccJ ............................ IIO
5-20 Comparison of test results and multiplying Vc from JSCE by (EG~stccJ .. ···· ..................... IIO
5-21 Comparison of test results and multiplying Vc from ACI 11.3.1.1 by (EG~S,cc.)1/2 ............ 111
5-22 Comparison of test results and multiplying Vc from ACI 11.3.2.1 by (EG~stcc.)112 ............ II1
5-23 Comparison of test results and multiplying Vc from Zsutty's equation by (E~slccJll2 ....... 112
5-24 Comparison of test results and multiplying Vc from CSA by (EG~slccl)112 ......................... II2
5-25 Comparison of test results and multiplying Vc from JSCE by (EG~stcc.)112 ........................ 113
XlIl

5-26 Comparison of test results and multiplying Vc from ACI 11.3.1.1 by (EG~slceJll3 ............ 113
5-27 Comparison of test results and multiplying Vc from ACI 11.3.2.1 by (Eo~slccJl/3 ............ 114
5-28 Comparison of test results and mUltiplying Vc from Zsutty's equation by {E~stccJl/3 ....... 114
5-29 Comparison of test results and multiplying Vc from CSA by {EGaulEstceJ1I3 ......................... 115
5-30 Comparison of test results and multiplying Vc from JSCE by {EoaulEstccJll3 ........................ 115
5-31 Comparison of test results and modifying Vc from ACI 11.3.2.1 by multiplying p by
(EoaulE~ ................................................................................................................................... 116
5-32 Comparison of test results and modifying Vc from Zsutty's equation by mUltiplying p by
{Eom!EstccJ ................................................................................................................................... 116
5-33 Comparison of test results and modifying Vc from JSCE by multiplying p by
<Eom!E~ ................................................................................................................................... 117
r' A-I Relationship between crack width and the demec readings .................................................. 128
XIV

NOTATION
a = shear span
AF = cross sectional area ofFRP reinforcements
A = cross-sectional area of reinforcements
bw = width of beams
C} = compression force
C /1 = compression force
d = depth to centre of reinforcements, measured from the extreme compression fibre of
concrete
EGFRP = elastic modulus of GFRP
E = elastic modulus of steel steal
fie = compressive strength of concrete
Mu = factored ultimate moment
T} = tension force
TI } = tension force
Val" = horizontal component of the shear transferred across the crack
Yay = vertical component of the shear transferred across the crack
Vc = concrete contribution of the shear capacity of member
Vc: = shear in the compression zone
~ Vd = dowel action of the reinforcement
xv

r Vu
PI
P2
Pd
Pp
Pn
p
°ru
= factored ultimate shear load
= material factor for the diameter effect of FRP bars
= material factor for the general behaviour of a specific FRP bar type in concrete
= shear factor for din JSCE Design Code
= shear factor for p in JSCE Deign Code
= shear factor for axial applied loads in JSCE Design Code
= reinforcement ratio ( A / bJi )
= ultimate tensile strength ofFRP
XVI

CHAPTER 1
INTRODUCTION
1.1 General
The shear behaviour of steel reinforced concrete beams has been investigated for a century
but shear behaviour of concrete beams reinforced with Glass Fibre Reinforced Plastics, GFRP, has
not been adequately studied. GFRP is a suitable reinforcement for concrete structures, due to its high
strength-to-weight ratio, non-magnetic and corrosion resistance characteristics ( Challal and
Benmokrane 1993).
This study focused on the shear behaviour of concrete beams reinforced by GFRP bars,
produced by Pultrall Inc., Thetford Mines, Quebec, Canada.
1.2 Objectives
The main objective of this research test program was to investigate the shear behaviour of
concrete beams reinforced with GFRP bars in terms of shear capacity, deflection, and mode of failure.
To evaluate VQ the contribution of concrete to the shear capacity of the beam, in none of these beams
was shear reinforcement used.
1

1.3 Scope
A total of nine beams reinforced for flexure with GFRP, and three control beams reinforced
with steel were fabricated and tested to failure in this experimental program. All the test beams had
a 200 mm x 300 mm cross section. Shear reinforcement was not used in any of these beams.
A brief explanation of advanced composite materials and their applications in structural
engineering is given in Chapter 2. A summary of studies on the shear behaviour of reinforced
concrete members is also included in Chapter 2.
Chapter 3 gives a detailed description of the properties of materials used in this program,
instrumentation, pilot studies, fabrication of the specimens, test set-up and testing pt:'ocedure.
A summary of the experimental results is given in Chapter 4. This includes the observed
~ behaviour and measured data for all the tested beams.
Discussion of the experimental results is given in Chapter 5, including the effect of the
different parameters on the shear behaviour of test beams, comparison of test results, and the
analytical models.
The final Chapter, Chapter 6, includes the summary and conclusions based on the
experimental program.
2

CHAPTER 2
LITERATURE REVIEW
A- ADVANCED COMPOSITES FOR CONCRETE STRUCTURES
2.1 Background
Science and technology have been developing at high speed over the last decade, especially
in the field of composite materials. The development of new materials and their applications in
aerospace and defence has been growing fast. On the" other hand, the rate of development with
respect to the needs of the construction industry, namely mass produced, high quality,. relatively low
cost composite products with sophisticate~ structural requirements, has been very slow. However,
fibre reinforced plastics, FRP, have been employed in a selected number of structures, such as
bridges, buildings, off-shore structures and retaining walls in the last few years in Japan, Germany,
the USA and Canada.
The growth of population and the demand for services has meant that the infrastructures have
been overwhelmed with a level of usage never anticipated during construction. Corrosion of steel
work, sometimes exacerbated by poor design and construction, has led to rapid deterioration of key
elements of structures. The repair and replacement of these structures is an expensive nightmare.
3

More durable structures which can be maintained indefinitely without disrupting usage are needed.
High quality structural composites are being seen as material likely to assist in meeting these
objectives. However, standard specifications and codes of practices do not yet exist in civil and
structural engineering applications of composites and therefore the vital questions of reliability and
performance are difficult to address.
2.2 Definition of FRP
Fibre reinforced plastics (FRP) are obtained by inserting fibres of high strength in a polymer
matrix. The reinforcement of the matrix is provided by the fibres which are characterized by very
high strength-to-weight ratios and very small diameters. The matrix is essentially the binder material
r' of the composite. Similar to the behaviour of many tissues in the body, which are made up of stiff
fibres embedded in a lower stiffness matrix, the essence of FRP technology is the ability to have
strong fibres in the right location, in the right orientation with the right volume fraction. Different
materials can be used as a matrix for various types of fibres and therefore the scope in terms of
properties is almost unbounded. In practice, only a limited number of materials are used and selection
is determined by factors such as ease of fabrication, compatibility with fibres, desired end properties
and cost. Therefore, the most commonly used fibre materials are glass, carbon and aramid
(abbreviation for polyparaphenylene-terephtalamide). The matrix materials are classified in general
into two groups of thermosetting resins, namely polyesters and epoxides, and thermoplastic resins
such as nylon, polycarbonate and polypropylene.
A flat arrangement of unidirectional fibres or woven fibre fabrics in a thin layer of matrix
4

material produces a lamina. The laminae are strongly dependent on the orientation of the embedded
fibres. In general, fibre reinforced laminae display anisotropic behaviour. A series of laminae stacked
together, with a prescribed sequence of orientation for the individual laminae, forms a laminate.
Laminates can be tailored to provide the directional dependence of strength and stifthess required to
match the loading conditions to which the structural element will be subjected. A wide variety of
structural shapes and pultruted custom shapes are now commercially available. In addition, fibre
reinforced prestressing tendons and cables, rebars, gratings and reinforcing grids are widely produced
in different shapes using carbon, aramid, glass or, any combination.
2.3 Applications of FRP
There has been a rapid growth in the use of fibre reinforced materials in engineering
applications in the last few years. However, the full potential ofFRP has yet to be realized in civil
and structural engineering applications. FRP may be used in the form of laminates, structural sections
using a pultrusion process, in addition to the unidirectional applications such as prestressing tendons.
It should be kept in mind, though, that fibre reinforced materials are not universal substitutes for other
materials and should be selected for their own particular qualities. However, the advantages ofFRP
will certainly encourage designers to achieve structural systems which could not be built using
conventional materials.
One of the major problems that readily reduces the life time of concrete structures is the
corrosion of steel reinforcement. This problem becomes more serious in cold climate countries,
where de-icing salts accelerate the deterioration. A first leading characteristic of FRP is its corrosion
5

" ... ,.,.. \
resistance, which is a major advantage over conventional materials. The potential result is a longer
life of the structures, requiring minimum maintenance, which will significantly offset the high material
cost.
A second leading characteristic ofFRP is a high strength-to-weight ratio, ranging from three
to five times that for prestressing steel. The light weight of the FRP makes handling and installation
generally much easier and reduces costs of assembly. This also makes advanced composite materials,
ACM, very attractive as a rehabilitation material. The other important properties of ACM are the
electro-magnetic neutrality and relatively favourable fatigue behaviour.
The use ofFRP has been introduced in structural applications through different avenues:
1- Short Span Bridges
Different pedestrian bridges have been constructed using FRP. The University of
Pennsylvania in collaboration with a local Philadelphia company, E.T. Techtonics (CSCE 1991), have
constructed a pedestrian bridge using Kevlar 49 (a commercial FRP product) cables to prestress
glass-reinforced plastic tube trusses, which support the deck of the bridge. Bridges of 7 to 10m
spans have been constructed.
Fibre reinforced plastic, FRP, tendons were also used to reinforce and prestress concrete to
produce a more durable structure than that with conventional prestressing steel. In addition to the
previously mentioned advantages of composite materials, FRP tendons are characterised by high
tensile strength, low relaxation under sustained hi~h load, especially for carbon and glass-based FRP
and excellent fatigue properties, especially for carbon and aramid FRP tendons (Rostasy 1988). The
6

low Young's modulus ofFRP tendons results in a reduction in the losses due to prestressing. These
characteristics greatly enhance the use of FRP as prestressing tendons for short span bridges. A
number of pedestrian and highway bridges in different countries were built using FRP as structural
sections and as prestressing elements for concrete girders and slabs (CSCE 1991, and Minosaku
1992).
2- Long Span Bridges
As a result of the superior advantage of very high strength-to-weight ratio ofFRP compared
to conventional materials, FRP competes 'with steel and concrete in the construction of long span
bridges. FRP structural sections can be utilized in the construction of the bridge girders, while the
~ unidirectional FRP tendons can be used as cables under tension.
3- Repair of Structures
A number of chimneys have been strengthened with CFRP products, to protect them against
earthquake damage. Two products are available for this type of retrofitting. These are unidirectional
carbon fibre tape and carbon fibre winding strands. For flexural strengthening, the. auto-adhesive
unidirectional tape is to be applied to the surface such that the direction of the tape is in the
longitudinal direction of the chimney. Confinement is provided by the winding strand, as shown in
Fig.2-1 which is impregnated with adhesive resin as it is wound around the chimney.
7

4- Repair of Bridges
Many highway bridges built around 40 years ago have deteriorated due to the increase in the
weight of trucks legally permitted on highways. In addition, the corrosion problem, caused by de
icing salts, has made the deterioration even more severe. Strengthening deteriorated steel and
concrete structures by bonding carbon fibre reinforced epoxy laminates to the exterior of the
structure, has been studied in Germany and Switzerland (CSCE 1991). The study has shown that the
use of CFRP laminates in place of steel plates for such applications could reduce the total cost of a
reinforcing project by about 20%. Although the materials themselves are much costlier than steel,
the lighter weight, and better corrosion- resistant properties can result in significant reductions in
fabrication and long term costs.
5- Bridge Enclosures
The concept of "Bridge Enclosure" involves hanging a floor from the steel girders of a
composite bridge, at the level of the bottom flanges of the girders, so as to provide access for
inspection and maintenance. The floor is sealed to the outside girders, to provide protection from
the environment. Corrosion rates of steel within such enclosures have been found to drop to
negligible levels. The first system of this type in the world was installed on the A19 Tees Viaduct in
Middlesbrough, England in 1989, and the material used was GFRP. The structural floor of the
enclosure, as shown in Fig. 2-2 is composed of pultruded GFRP panels which are characterised by
light weight and high durability. The modular GFRP panels were selected on the basis of a
8

costlbenefit analysis, which took into account total costs of inspection and maintenance of the steel
plate girders. Other cost-saving attributes of the system taken into account were the minimum
weight, reliable life to first maintenance (3 0 years), good fire resistance and good long term
appearance.
6- Tunnel lining
FRP grids can be used in tunnel lining to reinforce shot crete. It has advantages over
conventional materials due to its high corrosion-resistance, its flexibility which makes it suitable for
curved SUlfaces (as shown in Fig. 2-3), and its excellent alkali, acid and chemical resisting properties.
The material is very light weight, having approximately one fourth the specific gravity of steel, and
may be cut easily with a hack-saw. FRP grids have been used in many tunnel lining projects
(NEFMAC 1987) such as "Kakkonda Hydroelectric Power Plant", where GFRP was used to
reinforce the arch, side wall and invert of water-conveyance tunnel for crack preventation of a total
area of430 m2•
7- Marine Structures
GFRP has been used for over 45 years in marine applications. Fibreglass boats are standard
of the industry with roughly 95% of all boats constructed offibreglass. Durability and performance
offibreglass in salt water has thus been proven with time. Sen et al (1992) reported feasibility study
of fibreglass pretensioned piles in a marine environment.
9

B- SHEAR BEHAVIOUR OF REINFORCED CONCRETE MEMBERS
2.4 Introduction
In the design of concrete structures an adequate margin of safety must be provided against
any mode of failure that might occur under the forces that act on the structure during its lifetime.
One general type offailure that must be prevented is the so-called "shear failure" which in reality is
a failure under combined shearing force and bending moment, plus, occasionally, axial load, or
torsion, or both.
Flexure-shear interaction analysis has shown that beams may fail without attaining their full
flexural capacity. In this case shear governs the failure. Concrete tensile stresses occur both in the
~ compression zone (above the neutral axis), where concrete issubjec~ed to a multiaxial state of stress,
and in the tension zone by means of the aggregate interlock mechanism and dowel action. The tensile
strain capacity of concrete being low, shear failure i.s generally brittle, and hence more dangerous than
a flexural failure in which the tensile strain capacity of the reinforcement causes ductile behaviour.
2.5 Beams without Stirrups
Studies on beams without web reinforcement have shown that the influence of shear on the
beam failure depends mainly on the shear-span-to-depth ratio aid and the reinforcement ratio
p=~/bd, where Aa = area of tensile reinforcement, b = width, and d = effective depth of the beam.
The parameter aid takes into account the ratio between the bending moment M and shear force V
10

occurring simultaneously in the same cross section. In relation to the values of the parameters aid
and p, the beam may reach failure under a bending moment about half that which the beam can
sustain without shear.
2.6 Internal Forces in a Beam without Stirrups
The forces transferring shear across an inclined crack in a beam without stirrups are illustrated
in Fig. 2-4. Shear is transferred across line A-B-C by Vez, the shear in the compression zone; Vay ,
the vertical component of the shear transferred across the crack by interlock of the aggregate
particles on the two faces of the crack; and V d , the dowel action of the longitudinal reinforcement.
Immediately after inclined cracking, as much as 40 to 60 % of the total shear may be carried by V d
~ and Vay together.
Considering the portion D-E-F below the crack, and sumnung moments about the
reinforcement at point E shows that V d and Va cause a moment about E which must be equilibrated
by a compression force C '1. Horizontal force equilibrium on. section A-B-D-E shows that
T 1 = C1 + C 'I t and finally, T I and CI + C'I must equilibrate the external moment at this section.
As the crack widens, Va decreases, increasing the fraction of the shear resisted by Vez and
V d. The dowel shear, V d, leads to a splitting crack in the concrete along the reinforcement
(Fig. 2-5). When this crack occurs, Vd drops to zero. When Va and Vd disappear, so do VI ez and
C ' 1 , with the result that all the shear and compression are transmitted in the width AB above the
crack. This may cause crushing of this region.
11

2.7 Shear Transfer
Shear is transmitted from one plane to another in various ways in reinforced concrete
members. The behaviour, including the failure modes, depends on the method of shear transmission.
The main types of shear transfer can be considered as follows:
(a) Shear Transfer by Concrete Shear Stress
The simplest method of shear transfer is by shearing stresses. This occurs in uncracked
members or in the uncracked portions of structural members. Shear stress alone or the interaction
of shear stresses with tensile and compressive stresses may cause inclined cracking failure of the
r" concrete.
(b) Interface Shear Transfer
There are several instances in which shear must be transferred across a definite plane or
surface where slip may occur. Researchers have called this mechanism aggregate interlock, surface
roughness shear transfer, shear friction and tangential shear transfer.
If the plane under consideration is an existing crack or interface, failure usually involves
slippage or relative movement along the crack or plane. If the plane is located in the monolithic
concrete, a number of diagonal cracks occur across the interface and failure resembles a truss action
along the plane composed of tension in the bars across the plane and compression in struts between
12

(c) Dowel shear
If reinforcing bars cross a crack, shearing displacements along the crack will be resisted, in
part, by a dowelling force in the bar. The dowel force gives rise to tensions in the surrounding
concrete and these in combination with the wedging action of the bar deformations produce splitting
cracks along the reinforcement. This in turn decreases the stiffness of the concrete around the bar
and therefore the dowel force.
Relative to other shear transfer mechanisms, the dowel shear force is generally not dominant
in beams. On the other hand, its role in the failure mechanisms of some types of structural elements
is important. In beams, splitting cracks develop along the tension reinforcement at inclined cracks
as a result of the dowel effects. This allows the inclined cracks to open, which in turn reduces the
r- interface shear transfer along the diagonal crack and thus leads to failure.
(d) Arch Action
In deep beams and slabs, part of the load is transmitted to the supports by arch action. This
is not a shear mechanism in the sense that it does not transmit a force to a nearby parallel plane.
However, arch action does pennit the transfer of a vertical concentrated force to a reaction in a deep
member and thereby reduces the contribution of the other types of shear transfer.
F or arch action to develop, a horizontal reaction component is required at the base of the
arch. In beams this is usually provided by the tie action of the longitudinal bars and failure may occur
due to loss of the anchorage of these bars.
13

In beams, arch action occurs not only outside the outermost cracks but also between diagonal
tension cracks. Part of the arch compression is resisted by dowel forces and therefore splitting cracks
may develop along the bars.
2.8 Modes of Inclined Cracking and Shear Failure
Shear failure of beams is characterized by the occurrence of inclined cracks. In some cases
inclined cracking is immediately followed by member failure and in other cases, the inclined cracks
stabilize and substantially more shear force may be applied before the member fails.
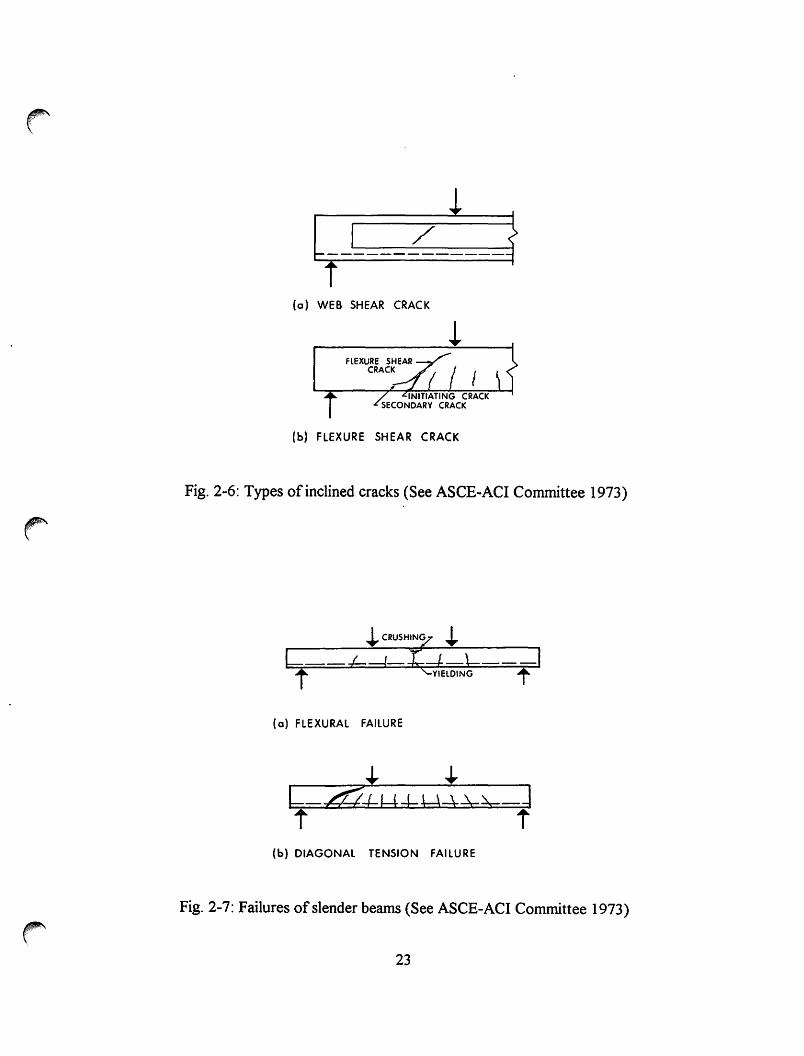
Inclined cracks in the web of a beam may develop either before a flexural crack occurs in
their vicinity or as an extension of a previously developed flexural crack. This first type of inclined
'" crack is often referred to as a "web-shear crack" as shown in Fig. 2-6(a). The second type is often
identified as a "flexural-shear crack", and the flexural crack causing the inclined crack is referred to
as the "initiating flexural crack" , Fig. 2-6(b).
In addition to primary cracks ( flexural and two types of inclined cracks), secondary cracks
often result from splitting forces developed by the deformed bars when slip between concrete and
steel reinforcement occurs, or from dowel action forces in the longitudinal bars transferring shear
across the crack.
14

2.9 Effect of Shear-Span-to-Depth Ratio
The influence of the aid ratio on the cracking of a rectangular simple supported reinforced
concrete beam, when all other things are kept constant, can be illustrated by considering beams of
varying slenderness with two synunetrically placed concentrated loads placed a distance, a, from the
supports.
(a) Normal and Long Beams of Rectangular Cross Section: aid >2.5
Very shallow beams will usually fail in flexure, Fig. 2-7(a). The first crack will form due to
flexural tension at the cross section of maximum moment. As the beam load increases prior to failure,
r' the tensile cracking may spread to regions of lesser moment, but failure occurs in flexure near the
section of maximum moment.
For a beam with a somewhat smaller value of aid, the fatal crack may well be a flexure-shear
crack, as shown in Fig. 2-6(b). Such a crack may cause the beam to fail before its full flexural
capacity is developed.
In moderately slender beams one of the cracks may continue to propagate through the beams
with further load until at some stage it becomes unstable and extends through the beam as shown in
Fig.2-7(b). This type offailure is called a "diagonal tension failure".
15

(b) Short Beams: 1 < aid < 2.5
A curved tensile crack in a region of combined moment and shear may also trigger one of two
additional modes of failure. A secondary crack may propagate backward along the longitudinal
reinforcement from the inclined crack, perhaps because of dowel action in the longitudinal
reinforcement, Fig. 2-5(a). This crack will cause a loss of bond. As the main reinforcement begins
to slip, the wedging action of the bar deformations contributes to a splitting of the concrete and a
further propagation of the crack, resulting in an anchorage failure of the longitudinal reinforcement,
called a "shear-tension"failure. Prior to such a failure, the beam acts as a tied arch.
Alternatively, the concrete above the upper end of the inclined crack may fail by crushing
resulting in a shear-compression failure. Fig. 2-5(b).
(c) Deep Beams: 0 < aid < 1
In deep beams, significant principal compression and tension, respectively, exist along and
across the line joining the load and the reaction plates (Fig. 2-8). In· some cases the cracks appear to
be initiated by flexural cracks originating in this region, and in other cases by the principal tensions
across the line joining the load and reaction, as in an indirect tension test.
After inclined cracking occurs, a deep beam without web reinforcement transforms almost
immediately into a tied-arch which can fail in a number of ways. The numbers in Fig. 2-8 correspond
to the following modes of failure: (1) Anchorage failure of the tension reinforcement, usually
combined with a dowel splitting effect; (2) crushing failure at the reactions; (3) flexural failure-either
16

of the steel reinforcement due to yielding or fracture, or the" crown of the arch" when the concrete
crushes; or (4) tension failure of the "arch-rib"by cracking over the support; followed by (5) crushing
the crack.
Early analysis of reinforced concrete deep beams was based on. the classical theory of
elasticity, with the beam assumed to be homogeneous. Reinforcing was placed in regions where
tensile stresses were above the estimated strength of the concrete. Some of the earliest work in this
area was performed by Dischinger, and distributed as a design aid by the Portland Cement
Association.
Leonhardt and Walther (1966) considered two states, the uncracked and cracked. They found
that the cracking followed the tensile stress trajectories; however, after cracking and stress
redistribution, the elastic approach did not adequately describe the stress distribution of deep beams.
Actual stresses exceeded theoretical stresses at sections near the centre of the span.
Crack patterns and failures of deep beams have been observed under many different loading
conditions, a single concentrated load, concentrated loads at the one-third points of the span, and
uniform loads. Some of these tests included beams subjected to dynamically applied loads (ASCE
ACI Committee 1973).
In these investigations deep beams were observed to fail in either shear or flexure. Although
the inclined cracking load was relatively independent of aid ratio, the ultimate strength increased as
aid decreased below about 3, as shown in Fig. 2-9. This was only true if the loads and reactions were
opposite faces of the beam so that a compression thrust could develop between the load and the
support. Load applied on the tension flange through a shelf resulted in lower strengths than did loads
applied directly to the compression flange. Thus the ultimate shear stress, v u , in a beam without web
17

.r' reinforcement is approximately equal to the inclined cracking shear stress, v c' for members loaded
at the tension flange and will be greater than Vc for directly loaded beams (ASCE-ACI Committee
1973).
Many of the shear failures observed in tests were precipitated by anchorage and bearing
problems, emphasizing the importance of careful detailing of members carrying large loads. When
anchorage and bearing problems are avoided, the shear failures generally occur due to crushing of the
concrete in the compressive region above an inclined crack, termed II shear compression," or due to
propagation of an inclined crack, through the compressive region, and also to and along the
longitudinal reinforcement, termed "diagonal tension. II
In general, as the span-to-depth ratio of a beam decreases, the angle of inclination of the shear
cracks, 6Q becomes greater than the value of 45° commonly assumed for ordinary reinforced concrete
beams. The relationship of this parameter to the span-to-depth ratio of a beam is shown in Fig. 2-10
(ASCE-ACI Committee 1973). In Fig. 2-10 the dashed portion of the line is carried out to the value
associated with ordinary beams.
2.10 Existing Models
The characteristic parameter for the flexure-shear interaction is usually assumed as the ratio
Mul Ma, where Mu is the ultimate moment (moment capacity including the shear influence) and Mo
is the moment capacity in pure flexure. The moment reduction was visualized by Kani (1979) in a
three-dime~ional coordinate system with axes of aid, p, and Mu I Mo. The experimental II vall ey of
diagonal failure II is shown in Fig. 2-11.
18

In Fig. 2-12, the model proposed by Krauthammer, Hall (1982) and Krauthammer, Shahriar,
and Shanaa (1987) is plotted. One can observe that this model is founded on the numerical evaluation
of the results experimentally obtained only by Kani. Moreover, it is not based on any mechanical
analysis.
The analytical model proposed by Ahmad and Lue (1987) for both high-and normal strength
concrete beams is plotted in Fig. 2-13. This model is similar to the procedure for analyzing diagonal
strength developed by Kani.
2.11 Shear Strength of Beams Using CFRM
The diagonal cracking load of beams reinforced with Carbon Fibre Reinforced Materials
f' (CFRM) as longitudinal reinforcements tends to be smaller than that of ordinary reinforced concrete
beams (Macida 1993). Some reports indicate that the reduction of strength occurring when CFRM
are used may be computed assuming ~x (Ei xEs) (Ei :Young's modulus ofCFRM, Es: Young
modulus of steel bar and ~: cross sectional area oflongitudinal.FRP bar) instead of ordinary ~
(Saito, Tsuji, Sekijima and Ogawa 1988).
19

Fig. 2-1 : Retrofitting of ch imney (See Abdelrahman and Rizkalla 1994)
20

ACCESS TO SERVICES
PROTECTION TO STEELWORK-__ ~'+_\ (REDUCED INTERNAL PAINT
SPECIFICA nON) AND REDUCED MAINTENANCE
PROTECT/ON FOR AND
ACCESS TO BRIDGE BEARINGS I
'---- FOR CONCRETE REINFORCEMENT
/' PROTEC T/ON TO AND MASKING OF BRACING
ACCESS FOR CONS TRUCTION ACCESS FOR INSPECTION, REPAIR t AND MAINTENANCE
LOw WEIGHT-CELLULAR GAP ENCLOSURE
Fig. 2-2: Structural floor of bridge enclosure (See Abdelrahman and Rizkalla 1994)
Fig. 2-3: Tunnel lining by FRP grids (See Abdelrahman and Rizkalla 1994)
21

R
A
:1--.... T1 E
~---------------
Fig. 2-4: Internal forces in a cracked beam without stirrups (See ASCE-ACI Committee 1973)
(0) SHEAR - TENSION FAILURE
(b) SHEAR - COMPRESSION FAILURE
old: 1 TO 2.S
Fig. 2-5: Typical shear failures in short beams (See ASCE-ACI Committee 1973)
22
/
(0) WEB SHEAR CRACK
(b) FLEXURE SHEAR CRACK
Fig. 2-6: Types of inclined cracks (See ASCE-ACI Committee 1973)
L b-d L b t YIELDING t
-I
(0) flEXURAL FAILURE
(b) DIAGONAL TENSION FAILURE
Fig. 2-7: Failures of slender beams (See ASCE-ACI Committee 1973)
23

TYPE OF FAILURE
I. ANCHORAGE FAILURE 2. BEARING FAILURE 3. FLEXURE FAILURE
4.&5. ARCH - RIB FAILURE
o/d=OTOl
Fig. 2-8: Modes offailure of deep beams (See ASCE-ACI Committee 1973)
V') 1500 V') w a:: ..... V')
('oj
a:: .: « ..... 1000 w ..Il :I: V') I
W >=» ..... « 500 ~ ..... .....J
:::>
MOMENT/SHEAR RATIO M/Vd = old o 2 3 4 5 6 7
LOAD 0 UNIFORM LOAD
---INCLINED CRACKING
1ct- d
~ ~...i ~b~+
C 11111 J I-Ln-1
4 8 12 16 20 24 28
SLENDERNESS RATIO ln /d
120
100
80 N
E u .....
60 ~ I
=» 40 >
20
0
Fig. 2-9: Reserve shear capacity of deep beams (See Leonhardt 1968)
24

.~
70
60 8
DEGREES
50
.............. ............ ............
40~------~------~-------o 2.5 5
Fig. 2-10: Inclination of shear cracks in deep beams (See Crist 1971)
0.8
0.61--+---Pl\.
0.41--+--+--+--+--f--+---+-----I
02 1--+--+---+--+---f-+--+---1
123 4
Fig. 2-11: Relative beam strength Mu / Mo versus aid and p (See Kani 1979)
25

1.0 P,
0.5
(a)
o~~~~~~~~~--~~~-
o 5 aid
10
Fig. 2-12: Model for flexure-shear interaction (See Krautharnmer and Hall 1982 and
1.0
0.1
o o
Krauthammer et a11987)
B.C. 1
FBA
/" r " (b' " I ...... 'I
"'/' I ......... _
,,( 1 --- BC2 ,," r r - - - - -=-----1 ..
1.0 FBA
Fig. 2-13: Model for flexure-shear interaction: (See Ahmad and Lue 1987)
26

CHAPTER 3
EXPER~ENTALPROGRAM
3.1 General
The experimental program was designed to evaluate shear behaviour of GFRP reinforcements
and estimate concrete contribution in shear resistance Vc' A total of twelve beams were tested, nine
beams reinforced with ISOROD-GFRP and three beams reinforced with steel which were used as
control beams. The main parameters considered in this study were the shear span-to-depth ratio and
longitudinal reinforcement percentage. Since the main objective of this study is to evaluate Vc, no
shear reinforcement was used.
3.2 Materials
This experimental program involves the manufacturing and testing of GFRP and steel
reinforced beams. The following sections describe the material characteristics of the GFRP, steel
reinforcements and the concrete.
27

3.2.1 Fibre properties
Fibres are the principal constituent in FRP material as they occupy the largest volume fraction
and share the major portion of the load acting on a composite structure. Proper selection of the type,
amount and orientation of fibres is very important, since it influences the tensile and compressive
properties ofFRP product as well as the electrical and thermal conductivities and cost.
It has been reported that the variability is an important aspect of the mechanical properties
of fibres as tests on individual fibres show a w~de range of strengths (Hull 1981). However, a
comparison between the tensile stress-strain behaviour for different fibres is given in Fig 3-1. The
fibres are characterised with linear behaviour up to failure and all the fibres fracture in a brittle manner
without any yield or flow. Carbon and glass fibres are almost completely brittle and fracture without
f:' any reduction in cross section, while for Kevlar 49 fibres, necking precedes fracture and final
separation occurs after a large amount of local drawing. The stress-strain curves show that the high
modulus fibres have a much lower strain to failure. Carbon fibres have the highest specific Young's
modulus (modulus / density) and the lowest ultimate strain, followed by Kevlar 49 and glass. The
values of tensile strength vary less than those of the modulus of elasticity. The mechanical properties
of aligned composite materials transverse to the fibres are much less than those parallel to the fibres.
.~
3.2.2 Glass
Two types of glass fibres, E-glass and S-glass, are commonly used in FRP industry. E-glass
has the lowest cost of all commercially available reinforcing fibres, which is the reason for its
28

widespread use. S-glass has the highest tensile strength among all fibres in use (Mallick 1988).
However, the compositional difference and higher manufacturing cost make it more expensive than
E-glass.
The average tensile strength offreshly drawn glass fibres may exceed 3.45 GPa. However,
surface damage (flaws) produced by abrasion, either by rubbing against each other or by contact with
the processing equipment, tends to reduce it to values that are in the range of 1.72 to 2.07 GPa.
Strength degradation is increased as the surface flaws grow under cyclic loads, which is one of the
major disadvantages of using glass fibres in fatigue applications.
The tensile strength of glass fibres is also reduced in the presence of water or under sustained
loads (static fatigue). Water bleaches out the alkalis from the surface and deepens the surface flaws
already present in fibres. Under sustained loads, the growth of surface flaws is accelerated owing to
stress corrosion by atmospheric moisture. As a result, the tensile strength of glass fibres is decreased
with increasing load duration (Mallick 1988).
3.2.3 GFRP Reinforcements
Table 3-1 and Fig. 3-2 provide fundamental mechanical behaviour of the ISOROD-GFRP
rods which were used in this program. The ISOROD bars were produced by Pultrall Inc., Thetford
Mines, Quebec, Canada. ISOROD reinforcements are fabricated using E-glass continuous fibres and
thermosetting polyester resin. To enhance the bond characteristics, the surface is wrapped by the
helically glass fibre strands and covered by sand mixed with polyester resin. The GFRP
reinforcements used in this program were 9.5 mm, 12.7 mm, and 15 mm in diameter.
29

3.2.3.1 Bond Properties of GFRP Reinforcements
Based on investigations on bond performance of GFRP reinforcements at the University of
Sherbrooke in 1994, Benmokrane, Tighiouart, and ChaaIlal found that the bond strength of GFRP
rebars is lower than that of steel rebars, depending on the size of rebars. They also found that the
optimal bond length of GFRP rebars to develop an ultimate tensile force varies from 16db to 27 db,
depending upon the diameter (db) of the bars.
Michaluk, during his study on the flexural behaviour of one-way concrete slabs reinforced by
ISOROD-GFRP in 1996, indicated that as the bar diameters are increased from 9.5 mm to 12.7 mm,
the percentage of achieved tensile stresses at the level of reinforcements increased from 76.8% to
95.4% of the ultimate tensile stress. This also resulted in a reduction of the step-wise behaviour in
~ the corresponding load-deflection curves, suggesting a reduction in the amount of localized failure
of individual fibres of the ISOROD-GFRP bars. In accordance with the percentage of ultimate tensile
stress achieved, the observed ultimate loads were closer to the predicted ultimate loads for the slabs
achieving a higher percentage of the ultimate tensile stress at the level of reinforcements. When the
ISOROD bar diameter is increased from 12.7 mm to 15.9 mm, the achieved percentage of ultimate
tensile stress at the level of reinforcements decreased from 95.4% to 81.0%. Michaluk also observed
the bond failure cracks and slippage of the ISOROD-GFRP bars.
Unlike steel rebars, GFRP rods are made of thousands of layers of glass fibres. The actual
stresses due to interlaminate shear lag leads to the development of a central region of the GFRP bar
which is virtually unstressed. Thus decreasing the effective area of the GFRP reinforcement, and in
tum increasing the tensile stresses in the remaining fibres within the GFRP bar.
30

Michaluk suggests that increases in the ISOROD bar diameter above 12.7 mm results in a
reduction of ISOROD-GFRP bar strength due to interlaminate shear lag and, therefore, lower
ultimate tensile stress levels are achieved in the larger diameter ISOROD-GFRP bars. This
phenomenon was also observed during tension tests done by others (Malvar 1995) on GFRP bars,
including ISOROD reinforcements.
These findings lead to the development of a proposed tensile force equation which will
account for the tensile behaviour ofISOROD-GFRP bars as reinforcement in concrete members.
In this equation (J FU is the ultimate tensile strength of FRP. The material factors, P 1 and P 2' account
for the reductions in tensile strengths of the GFRP bars due to the diameter effect and the general
behaviour of the specific type of GFRP bar while embedded in ~oncrete. The material factor to
account for the diameter, Pb is based on the reduction of stressed area of the GFRP bar due to
interlaminate shear lag, and is determined by tension tests. The material factor to account for the
general behaviour of the specific type ofGFRP ( i.e. ISOROD), P2' depends on the reinforcement
ratio, and is based on the manufacturing process of the bar, the type of ~esins used, the type of
deformations and the bond strength of the GFRP bar. Detennination of material factor P 2 is achieved
by bending tests of the specific GFRP bar in concrete specimens.
31

3.2.4 Steel Reinforcements
All the steel reinforcements used in this study had a specified minimum 300 MPa yield
strength and a diameter of 15 mm.
3.2.5 Concrete
The concrete used in all the beams was designed for a normal strength of 30 MPa after twenty
eight days, and provided by local ready mix concrete company, Perimeter Concrete Ltd. The
concrete had a 14 mm maximum aggregate size, a water cement ratio of 0.37, and a slump of
approximately 90 mm. The slump was achieved with the use of a superplasticizing admixture,
"Reobuild 1000", in the quantity of approximately 311m3. A summary of the concrete mix design
can be seen in Table 3-2.
The mechanical properties of various reinforced beams are expected to vary under different
conditions. Therefore concrete cylinders were mixed and cured under the. same conditions as the test
beams. Three cylinders 150 mm x 300 mm were cast according to ASTM C39-86 for each beam in
order to monitor the concrete strengths.
32

3.3 Instrumentation
3.3.1 Crack Width Measurements
To measure the crack widths in the beams; stainless steel demec points were attached to one
side of the beam at the level of reinforcements. Also depending on the length of the shear span, eight
or ten stations were located on each shear span, covering all possible areas that were likely to
experience diagonal cracking.
Strain readings were recorded manually using a demec gauge of 200 mm length. The
arrangement of the demec points is shown in Fig. 3-3. Each station consisted of a typical 45 degree
strain rosette. With this configuration, the crack width can be computed using the expressions in
r' Appendix A.
3.3.2 Deflection Measurements
Deflections were measured at the mid span of the beam using two linear variable differential
transducers (LVDT). These LVDTs were located on two sides of the beam, on the mid span and
under the bottom of the beam. These L VDTs which had a range of ± 38 mm were placed against an
aluminum plate which were glued to the beam using an epoxy resin. This is shown in Fig. 3-4.
33

3.3.3 Data Acquisition System
A Validyne Data Acquisition System was used to monitor and store L VDT, load cell, machine
load, and strike readings, continuously throughout the tests. The system also included an mM
compatible 386 computer, and a six volt amplifier. Applied load, displacement of the beam at mid
span were stored in a file and was also displayed graphically on the computer screen during the test
(Fig. 3-5). The graphical displays were done during the test. The graphical displays were done using
the data acquisition software program "Labtech Notebook".
3.3.4 Pilot Studies
The final design of the test beams which is presented in Chapter 4 is based on pilot studies.
Since the shear behaviour of GFRP reinforced concrete beams was still unknown, to approximate the
shear capacity ofISOROD-GFRP, Pilot Beam # 1 was designed and cast (Fig. 3-6). This beam was
designed based on a fc=30 1v.IPa, and was expected to fail in a shear mode. But the concrete which
was delivered had a fc = 551v.1Pa after twenty eight days. This beam failed in a flexural mode (Fig.
3-10 and 3-13).
At this stage, to increase the flexural capacity and reduce the risk of flexural failure, it was
decided to place 300 MPa steel reinforcements 500 mm long at 25 min above the longitudinal tension
reinforcements, in the middle of the pilot beams. In order to initiate shear cracks, two steel angles
were placed at the corresponding location of the critical shear cracks (Kim and White 1991). See Fig.
3-9. With these provisions Pilot Beam #2 and #3 were designed and cast (Fig. 3-7 and
34

3-8).
These beams were tested after twenty eight days under shear span-to-depth ratios of two and
three and failed in a flexural shear mode. But in both of these beams only one crack line was
observed. These crack lines started at the location of the angles and continued toward the
compression zone. Fig. 3-11, 3-12 and 3-13.
Because of occurrence of only one crack in the total length of the beams and initiation at the
location of the angles, it was decided that in the rest of the. beams no more angle be used.
3.3.5 Fabrication of the Specimens
The beams were fabricated in the Struct.ural Engineering Laboratory at the University of
Manitoba. Four forms made of plywood were used for casting purposes. The sides of the forms
were clamped to insure that they did not move during moulding and vibrating.
In order to facilitate form removal and clean up, before placing reinforcements forms were
cleaned and lubricated with pella oil. The reinforcements were held securely in place in the forms
during mixing and vibrating by means of 6 mm steel bars, in the width of the forms, drilled at the
appropriate depths and with holes equal to bar diameter sizes.
To increase bond between longitudinal reinforcements and concrete, steel spirals were placed
within the distance between the supports and the ends of the beams (Fig. 3-14).
As was previously mentioned, to increase the flexural capacity and reduce the risk of flexural
failure, in all of the test beams, 300 IvIPA steel reinforcements that were 500 nun long were placed
at 25 nun above the longitudinal GFRP tension reinforcements, in the middle of the test beams
35

r' (Fig. 3-15).
.~
A vibrator was used to vibrate the concrete in order to avoid honeycombing. The beams were
cured by sprinkling water over them and covering with plastic sheets· for three days. Then, the
specimens were lifted from the form and cured in the laboratory atmosphere for at least twenty five
days.
To determine the concrete strength twelve standard concrete cylinders of 150 nun diameter
and 300 nun length were cast from the each batch of concrete used to cast the specimens. The
cylinders were cured under the same conditions as the specimens. Three cylinders were tested on the
day of testing of each beam. The minimum age of testing the beams was 28 days.
3.3.6 Test Set-up
A 50 kip (222.4 kN) load cell, installed on a Baldwin Hydraulic Testing machine with a 600
kip (2668.8 kN) capacity was used to measure transmitted load to the test beams. All beams were
simply supported and tested under three-point loading. Loads and reactions were applied through
rollers and bearing blocks to allow free rotation ~d horizontal movement of the end supports (Fig.
3-4 and Fig. 3-16)
A flat 25 nun thick, 45 nun wide and 300 mm long steel plate was placed on the top of the
test beam below the load cell at the mid span. Quick -set plaster bags were used in between the steel
plate and the concrete surface to provide proper contact. A whitewash was applied to the beam
surface to identify small cracks. Initial demec readings were taken before applying the loads.
36

r 3.3.7 Testing procedure
. ~
Once the beam was levelled and properly aligned with the use of an overhead crane, the
L VDTs were connected to the data acquisition system. All instrumentation was checked and zeroed
prior to the start of testing.
The beams were subjected to static loading under deflectio~ control. Beams were loaded to
failure at a rate of 5 kN/min. During the tests, developing crack patterns were marked on the beam
surfaces with black felt pen and periodically the.deflection was held constant for demec readings.
Photographs were taken before and after failure.
Load and deflection were monitored automatically until the end of the test by the data
acquisition system. The demec readings were taken up to 85 percent of the expected ultimate load .
37

Ultimate Stress (MPa) Ultimate Strain (0/0) Elastic Modulus (GPa)
Average an Average an Average an
Value Value Value
692 19.4 1.767 0.047 41.3 1.25
Table 3-1: Tensile properties ofISOROD-GFRP reinforcements
Quantity kg/m3
Portland cement 400
Coarse aggregate 1149.6
(14 mm max. diameter)
Fine aggregate 679.8
(passing #sieve)
Water 148.5
S uperplasticizer 3*
(Reobuild 1000)
Notes:
* approximate value
- water/cement ratio = 0.37
Table 3-2: Concrete mix design
38
% by weight
16.8
48.3
28.6
6.2
-

.~
700 ,--------------------.,q830
600
500 3q50
;;; HIGH Q.
"" "< 0 qOO 2760 ..-f 0-...... 5 CI) CI) CI)
r' UJ CI) e::: UJ l- e::: CI) I-
CI) w 300 =
w CI) = z CI) w Z I- w
I-
200 1380
o L-____ ~~--~~----~------~----~O o 5.0
TENSILE STRAJN (%)
Fig. 3-1: Tensile stress-strain diagrams for various reinforcing fibres
39

1000~----------------------________________________ ~
800
Cii 600 a. :! -ft) ft) G ...
en 400
200
0.5 1 1.5 2. 2.5 3 3.5 4 Strain (%)
Fig. 3-2: Material characteristics ofISOROD-GFRP reinforcements
· mk· .;f5rA/Y.
Fig. 3-3: Arrangement of demec points
40

Fig. 3-4: L VDT configuration for midspan deflection measurements
Fig. 3-5 : Genera1 ·view of test set-up
41
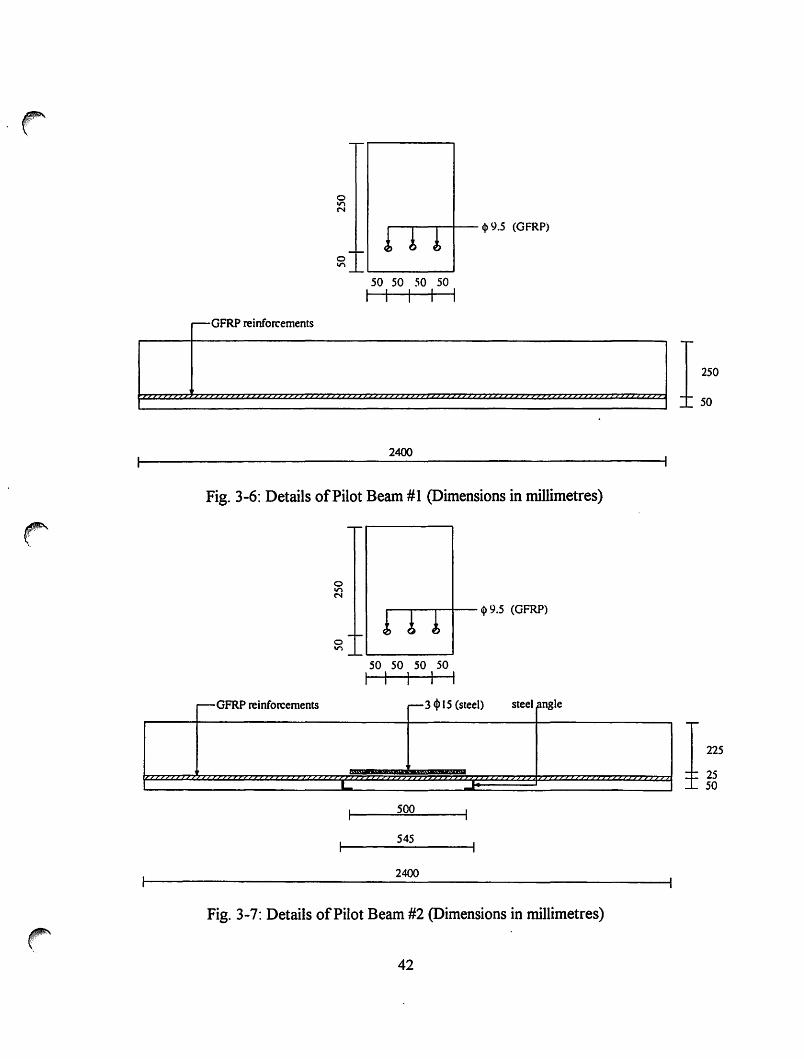
-GFRP reinforcements
o V'\ N
o V'\
___ ---.--1-- til 9.5 (GFRP)
50 SO 50 50 I I I I I
2400
Fig. 3-6: Details of Pilot Beam #1 (Dimensions in millimetres)
~ FRP reinforcements G
o V'\ N
o V'\
L
.-------.--+- 4> 9.5 (GFRP)
50 50 50 50 I I I I I
-3 4> IS (steel) stee ang e
500
545
2400
Fig. 3-7: Details of Pilot Beam #2 (Dimensions in millimetres)
42
I 250
SO
I 225
25 50

-
r---r--r--+- $ Y.5 (GFRP)
1 l ~ ~ 1'---_---'
50 50 50 50 I I I I
r-GFRP rcinrOrCellll!lIlS r--3 q,15 (steel) sl~el angk
500
900
2400
Fig. 3-8: Details of Pi lot Beam #3 (Dimensions in millimetres)
Fig. 3-9: Steel angles and steel reinforcements in the middle of the beams
43

•
. " , . •
'h ,
. ,
.'
~ • /0 ~
bt; , , .", 53
~
.. ~
.. , . ' • 4-
Fig, 3-10: Crack patterns of Pilot Beam # \
(
, \
• ./~ .
• ••
..
•
Fig. 3-\\ : Crack patterns of Pilot Beam #2
44
:.
-

· ..
Fig. 3-1 2: Crack patterns of Pilot Beam #3
45

1 Pilot Beam #1
Pilot Beam #2
Pilot Beam #3
Fig. 3-13: Sketches of crack patterns of Pilot Beam #1 (aJd=3), Pilot Beam #2 (aJd=2) and Pilot
Beam #3 (aJd=3)
46

Fig. 3- 14: Steel spirals at the end of the beams
Fig. 3-15 : Steel rein forcements in the middle of the beams
47

I'
machine column
two L VDTs. one on each side of
400mm
S200mm
Fig. 3-16: Schematic of test set-up
48
load bearing pI me machine base
test

CHAPTER 4
TEST RESULTS
4.1 General
In this chapter, the results obtained for all the beams tested .in this experimental program are
presented. These results include the concrete strengths, shear strength of test beams, and
displacements of the L VDTs. The observed behaviour of all the tested beams is also described in this
chapter.
4.2 Behaviour of Test Beams
This section describes the most important aspects observed during the testing of the
specimens. The photographs and the measured load-deflection of the test beams are presented in
Figure 4-13 to 4-36. In addition, the sketches of crack patterns at failure of all the test specimens are
shown in Figure 4-37 to 4-40. Based on the strain readings during the tests, load-crack width
diagram of all the beams except CBEAM 1, which had a very sudden failure, are illustrated in Fig. 4-
41 to Fig. 4-51.
49

4.2.1 Beam #1
Beam #1 consisted ofa 2800 mm long beam with a 2000 mm span. Details of Beam #1 are
illustrated in Fig. 4-1, showing the placement of the reinforcements, which consisted of two 9.5 mm
and one 12.7 mm diameter ISOROD-GFRP bars used as tension reinforcements and three MIS steel
bars 500 mm long which were placed at 25 mm above the longitudinal tension reinforcements at mid
span. Shear span-to-depth ratio for this beam was 4. The behaviour of this beam can be summarized
as follows:
a- First flexural cracks were initiated at 15 kN in station 5 (st. 5), and 6.
b- At a load of about 20 kN another flexural crack was initiated at st. 7 with a small load drop.
c- The first flexural shear crack initiated at a load of about 28 kN in st. 4. Initiation of this crack
r' included drop in load and noise. At this stage propagation of the flexural crack at st.7 was also
observed.
d- The flexural shear crack propagated until a load of about 36 kN which the second flexural shear
crack initiated at st. 3 with a drop in load. At this stage propagation offlexural crack at st. 7, flexural
shear crack in st.4 and also initiation of three minor flexural cracks in st.4 was also observed.
e- Flexural shear failure took place at a load of 47.4 leN in st. 3. This failure was sudden and loud.
The crack patterns and load-deflection diagram of this beam are shown respectively in Fig.
4-13 and Fig. 4-25.
50
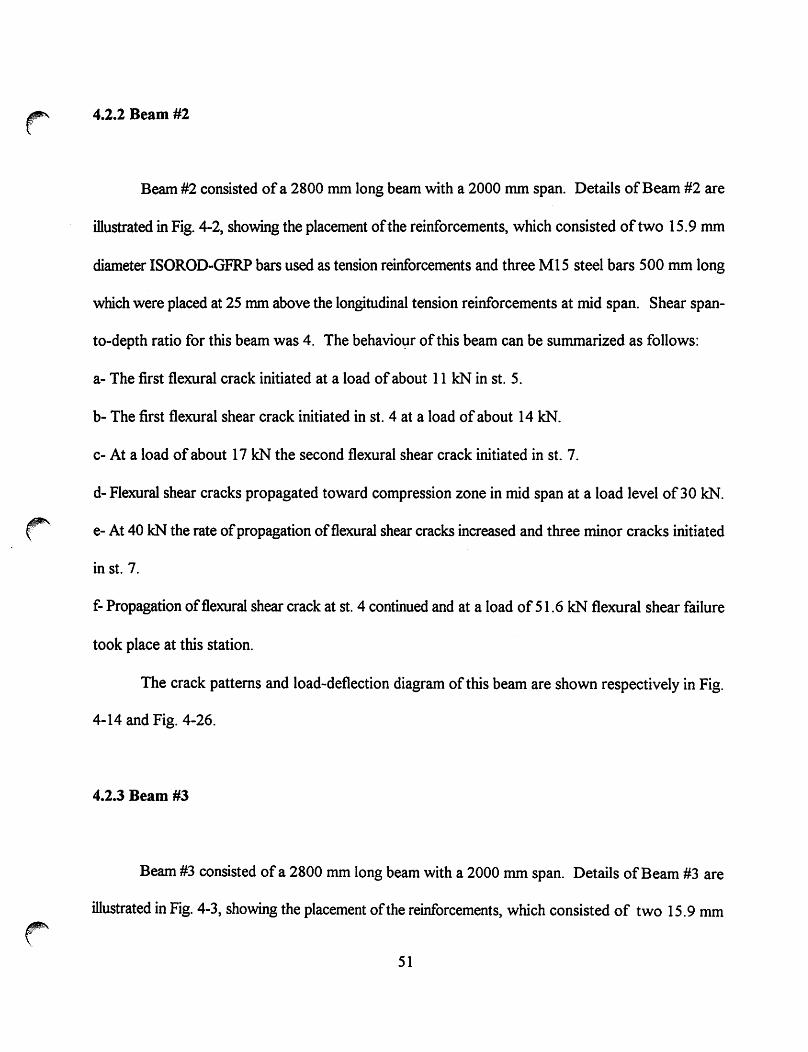
4.2.2 Beam #2
Beam #2 consisted of a 2800 nun long beam with a 2000 nun span. Details of Beam #2 are
illustrated in Fig. 4-2, showing the placement of the reinforcements, which consisted of two 15.9 nun
diameter ISOROD-GFRP bars used as tension reinforcements and three MIS steel bars 500 nun long
which were placed at 25 mm above the longitudinal tension reinforcements at mid span. Shear span
to-depth ratio for this beam was 4. The behavio1;lr of this beam can be summarized as follows:
a- The first flexural crack initiated at a load of about 11 leN in st. 5.
b- The first flexural shear crack initiated in st. 4 at a load of about 14 leN.
c- At a load of about 17 leN the second flexural shear crack initiated in st. 7.
d- Flexural shear cracks propagated toward compression zone in mid span at a load level of30 kN.
"... e- At 40 kN the rate of propagation of flexural shear cracks increased and three minor cracks initiated
in st. 7.
f- Propagation of flexural shear crack at st. 4 continued and at a load of 51.6 kN flexural shear failure
took place at this station.
The crack patterns and load-deflection diagram of this beam are shown respectively in Fig.
4-14 and Fig. 4-26.
4.2.3 Beam #3
Beam #3 consisted of a 2800 mm long beam with a 2000 nun span. Details of Beam #3 are
illustrated in Fig. 4-3, showing the placement of the reinforcements, which consisted of two 15.9 mm
51

and two 9.5 nun diameter ISOROD-GFRP bars us"ed as tension reinforcements and three MIS steel
bars 500 nun long which were placed at 25 mm above the longitudinal tension reinforcements at mid
span. Shear span-to-depth ratio for this beam was 4. The behaviour of this beam can be summarized
as follows:
a- The first flexural crack initiated in st. 5 at a load of about 5 kN.
b- At a load of about 20 kN the second flexural crack initiated at st. 6 with a drop in load.
c- The first flexural shear cracks initiated simultaneously in st. 3, and 7 at a load of about 21 kN.
Initiation of this crack included a drop in load.
d- At a load of about 29 kN the third flexural shear crack initiated in st. 4 with a drop in load. At this
stage propagation of other flexural shear cracks toward mid span was also observed.
e- Propagation oftlexural shear cracks continued until 41 kN, at which another flexural shear crack
r- initiated in st. 8. Initiation of this crack included a drop in load.
d- All flexural shear cracks propagated until 65.2 kN, at which beam suddenly failed in a flexural
shear mode on a big sudden crack which was started in st. 8.
The crack patterns and load-deflection diagram of this beam are shown respectively in Fig.
4-15 and Fig. 4-27.
4.2.4 Beam #4
Beam #4 consisted of a 2000 mm long beam with a 1500 mm span. Details of Beam #4 are
illustrated in Fig. 4-4, showing the placement of the reinforcements, which consisted of two 12.7 mm
diameter ISOROD-GFRP bars used as tension reinforcements and three MIS steel bars 500 mm long
52

which were placed at 25 nun above the longitudinal tension reinforcements at mid span. Shear span
to-depth ratio for this beam was 3. The behaviour of this beam can be summarized as follows:
a- The first flexural crack initiated at a load of about 22 kN in st. 5.
b- At a load of about 35 kN the second flexural crack initiated in st. 4.
c- The first flexural shear crack initiated with a big sudden crack at a load of about 44 kN in st. 6.
Initiation of this crack included a drop in load.
d- All cracks propagated until 57 kN, at which another big flexural shear crack initiated in st. 3.
Initiation of this crack included a big drop in load.
e- Propagation of all cracks continued until a load of 59.8 kN, at which beam suddenly failed in a
flexural shear mode in st. 6.
The crack patterns and load-deflection diagram of this beam are shown respectively in Fig.
r- 4-16 and Fig. 4-28.
4.2.5 Beam #5
Beam #5 consisted of a 2000 nun long beam with a 1500 mm span. Details of Beam #5 are
illustrated in Fig. 4-5, showing the placement of the reinforcements, which consisted of three 12.7
mm diameter ISOROD-GFRP bars used as tension reinforcements and three M15 steel bars 500 mm
long which were placed at 25 nun above the longitudinal tension reinforcements at mid span. Shear
span-to-depth ratio for this beam was 3. The behaviour of this beam can be summarized as follows:
a- The first flexural crack initiated in st. 5 in a load of about 20 kN.
b- At a load of about 25 kN the second flexural crack initiated in st. 4. Initiation of this crack
53

included a small drop in load.
c- Flexural cracks propagated slowly until a load of about 35 kN, at which a sudden flexural crack
initiated in st. 3.
d- Flexural cracks, slowly, and flexural shear cracks, rapidly propagated until 57 kN, at which the
second flexural shear crack suddenly initiated in st. 6. Initiation of this crack included a drop in load.
e- Flexural shear cracks propagated with increasing load and they were marked on the beam surface
every 10 kN.
f- No new crack was observed until 78.6 kN, at which beam suddenly failed in a flexural shear mode
in st. 6.
The crack patterns and load-deflection diagram of this beam are shown respectively in Fig.
4-17 and Fig. 4-29.
4.2.6 Beam #6
Beam #6 consisted ofa 2000 nun long beam with a 1500 mm span. Details of Beam #6 are
illustrated in Fig. 4-6, showing the placement of the reinforcements, which consisted of four 12.7 nun
diameter ISOROD-GFRP bars used as tension reinforcements and three MI5 steel bars 500 nun long
which were placed at 25 nun above the longitudinal tension reinforcements at mid span. Shear span
to-depth ratio for this beam was 3. The behaviour of this beam can be summarized as follows:
a- The first flexural cracks initiated in st. 4, and 5 in a load of about 20 kN. Initiation of these cracks
included a drop in load.
b- With increasing load flexural cracks propagated slowly toward compression zone. This
54

" .......... , \
propagation was marked on the beam surface.
c- At a load of about 43 kN the first flexural shear crack initiated in st. 3. Initiation of this crack
included a big drop in load and noise.
d- This flexural shear crack propagated until 62 kN, at which another flexural shear crack initiated
in st. 6. Initiation of this crack also included a drop in load and was loud.
e- Flexural shear cracks propagated toward mid span until the load of 74.4 kN, at which a few minor
cracks initiated in st. 3 and the beam failed on a flexural shear mode in this station.
The crack patterns and load-deflection diagram of this beam are shown respectively in Fig.
4-18 and Fig. 4-30.
4.2.7 Beam #7
Beam #7 consisted of a 2000 mm long beam with a 1000 mm span. Details of Beam #7 are
illustrated in Fig. 4-7, showing the placement of the reinforcements, which consisted of two 12.7 mm
diameter ISOROD-GFRP bars used as tension reinforcements and three MIS steel bars 500 mm long
which were placed at 25 mm above the longitudinal tension reinforcements at mid span. Shear span-
to-depth ratio for this beam was 2. The behaviour of this beam can be summarized as follows:
a- The first flexural crack initiated in st. 2 at a load of about 35 kN.
b- This flexural crack propagated slowly with increasing load and at a load of 65 kN beam failed in
a flexural shear mode with a big sudden crack in st. 1. At this stage another flexural crack was also
observed in st. 2. Initiation of these cracks was loud.
The crack patterns and load-deflection diagram of this beam are shown respectively in Fig.
55

4-19 and Fig. 4-31.
4.2.8 Beam #8
Beam #8 consisted of a 2000 mm long beam with a 1000 mm span. Details of Beam #8 are
illustrated in Fig. 4-8, showing the placement of the reinforcements, which consisted of three 12.7
mm diameter ISOROD-GFRP bars used as tension reinforcements and three M15 steel bars 500 mm
long which were placed at 25 mm above the longitudinal tension reinforcements at mid span. Shear
span-to-depth ratio for this beam was 2. The behaviour of this beam can be summarized as follows:
a- The first flexural cracks initiated at st. 2 and 3 at a load of about 43 leN. No significant drop in
load was observed at this stage.
r' b- Flexural cracks at st. 2, and 3 propagated slowly with increasing load. This propagation was
marked on the beam surface.
c- At a load of 80 leN beam suddenly failed with a big flexural shear crack started in st. 4 and
continuing toward compression zone in mid span. This failure included a big noise.
The crack patterns and load-deflection diagram of this beam are shown respectively in Fig.
4-20 and Fig. 4-32.
4.2.9 Beam #9
Beam #9 consisted of a 2000 mm long beam with a 1000 mm span. Details of Beam #9 are
illustrated in Fig. 4-9, showing the placement of the reinforcements, which consisted of four 12.7 mm
56

diameter ISOROD-GFRP bars used as tension reinforcements and three MIS steel bars 500 mm long
which were placed at 25 mm above the longitudinal tension reinforcements at mid span. Shear span
to-depth ratio for this beam was 2. The behaviour of this beam can be summarized as follows:
a- The first flexural cracks initiated in st. 2, and 3 at a load of about 36 kN. Initiation of these cracks
included a small drop in load.
b- At a load of about 51 kN the second flexural crack initiated in st. 3.
c- The flexural cracks propagated slowly until the load of87.2 kN, at which beam failed in a flexural
shear mode with a big crack started in st.1 and continuing to compression zone in mid span. This
failure was sudden and loud.
The crack patterns and load-deflection diagram of this beam are shown respectively in Fig.
4-21 and Fig. 4-33.
4.2.10 CBEAMI
CBEAMI consisted ofa 2400 mm long beam with a 2000 mm span. Details ofCBEAMI
are illustrated in Fig. 4-10, showing the placement of the reinforcements, which consisted of three
MIS steel bars used as tension reinforcements and also three M15 steel bars 500 mm long which were
placed at 25 mm above the longitudinal tension reinforcements at mid span. Shear span-to-depth
ratio for this beam was 4. The behaviour of this beam can be summarized as follows:
a- The first flexural cracks started at a load of about 10 kN in st. 4, 5, 6, and 7.
b- These flexural cracks propagated until a load of about 20 kN, at which new flexural cracks initiated
in st. 3, and 8.
57

c- These flexural cracks propagated slowly with increasing load and this propagation was marked on
the beam surface.
d- No new crack was obsetved until 110 kN, at which some new flexural cracks were initiated in st.
4, and 6.
e- None of these cracks propagated until the load of 123 kN, at which beam suddenly failed in a
flexural shear mode. The failure line started in bottom of the beam and continued to compression
zone in mid span.
The crack patterns and load-deflection diagram of this beam are shown respectively in Fig.
4-22 and Fig. 4-34.
4.2.11 CBEAM2
CBEAM2 consisted of a 2000 mm long beam with a 1500 mm span. Details of CBEAM2
are illustrated in Fig. 4-11, showing the placement of the reinforcements, which consisted of three
MIS steel bars used as tension reinforcements and also three MIS steel bars 500 mm long which were
placed at 25 mm above the longitudinal tension reinforcements at mid span. Shear span-to-depth
ratio for this beam was 3. The behaviour of this beam can be summarized as follows:
a- At a load of about 58 kN, three flexural cracks started in mid span, in st. 3, 4, and 5 with a drop
in load.
b- First flexural shear cracks initiated simultaneously in st. 3 and 6 at a load of about 69 kN.
Initiation of these cracks included a drop in load.
c- At a load of about 110 kN slow propagation of flexural cracks and fast propagation of flexural
58

shear cracks were observed.
d- Propagation of flexural shear crack continued until a load of about 122 kN, at which beam
suddenly failed in a flexural shear mode in st 6. This failure was brittle and loud.
The crack patterns and load-deflection diagram of this beam are shown respectively in Fig.
4-23 and Fig. 4-35.
4.2.12 CBEAM3
CBEAM3 consisted of a 2000 mm long beam with a 1000 mm span. Details of CBEAM3
are illustrated in Fig. 4-12, showing the placement of the reinforcements, which consisted of three
MIS steel bars used as tension reinforcements and also three MI5 st~el bars 500 mm long which were
r- placed at 25 mm above the longitudinal tension reinforcements at mid span. Shear span-to-depth
ratio for this beam was 2. The behaviour of this beam can be summarized as follows:
a- The first flexural cracks were observed at a load of about 70 kN in st. 2, and 3.
b- These flexural cracks propagated toward mid span until the load of about 110 kN, at which big
sudden flexural shear cracks initiated in st. 2, and 4.
c- The flexural shear cracks propagated until 140 kN, at which another flexural shear crack initiated
in st. 4.
d- These cracks propagated until the load of 194 kN, at which beam suddenly failed in a flexural
failure mode in st. 4. This failure was brittle and loud.
The crack patterns and load-deflection diagram of this beam are shown respectively in Fig.
4-24 and Fig. 4-36.
59
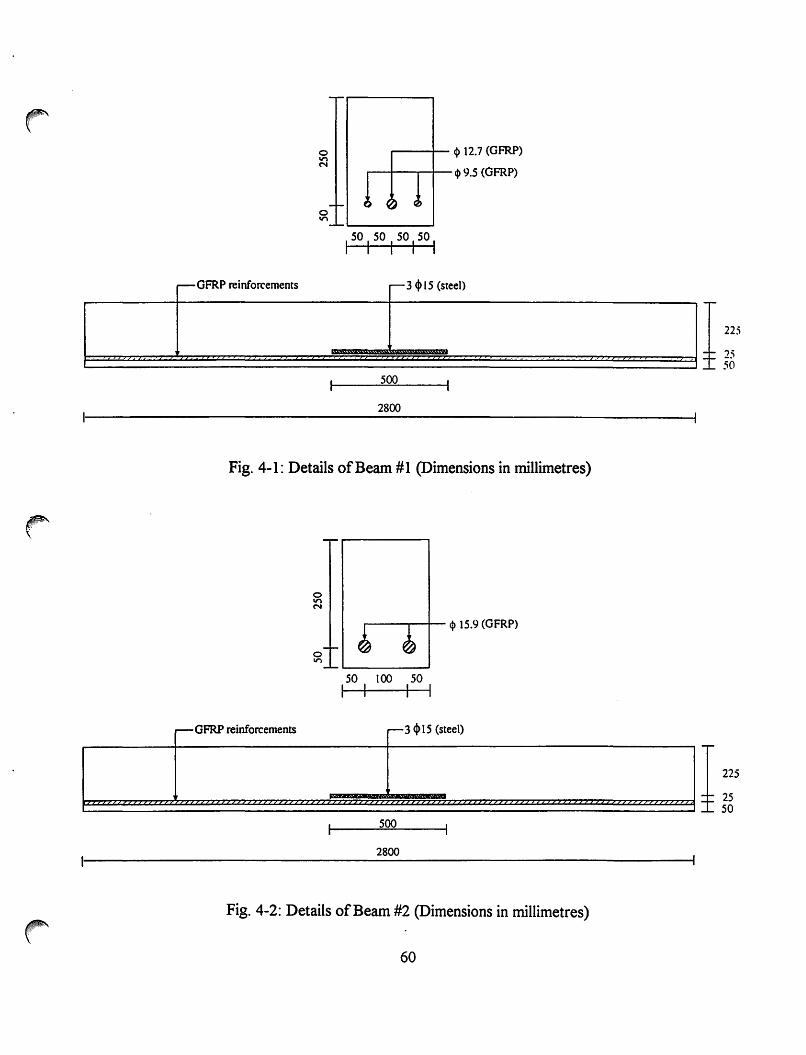
~GFRP reinforcemen s
o V'\
~-+-- 4112.7 (GFRP)
~-t--,---t-- ~ 9.5 (GFRP)
r-3 <I> 15 (steel)
500
2800
Fig. 4-1: Details of Beam # 1 (Dimensions in millimetres)
~ GFRP reinforcements
o V'\ N
o V'\
r---~-t-- ¢I 15.9 (GFRP)
50 tOO 50 I I I I
~3 <1>15 (steel)
500
2800
Fig. 4-2: Details of Beam #2 (Dimensions in millimetres)
60

o ." N
o ."
__ --1-- <p 15.9 (GFRP)
~I--I--r-f-- $ 9.S (GFRP)
-'--l ____ ....J
50 50 50 SO 50 I I I I I I
GFRP inti ts ~. re orcemen ~ 3«1>15(t 1) see
500
2800
Fig. 4-3: Details of Beam #3 (Dimensions in millimetres)
o ." N
o ."
~GFRP remforcements
_-...--1---$ 12.7(GFRP)
.-3 «I> 15 (steel)
500
2000
Fig. 4-4: Details of Beam #4 (Dimensions in millimetres)
61
I 225
25 50
I 225
25 50

~-r----r-t-- ~ 12.7(GFRP)
50 50 50 50 I I I I I
r-GFRP reinforcements r-3 <p 15 (steel)
500
2000
Fig. 4-5: Details of Beam #5 (Dimensions in millimetres)
GFRP 'nfi r-I rei orcements
~-r--.......---r-+- ~ 12.7 (GFRP)
50 50 50 50 50 I I I I I I
~ 3<\>15 ( I) stee
500
2000
Fig. 4-6: Details of Beam #6 (Dimensions in millimetres)
62
I 225
25 50
I 225
25 50
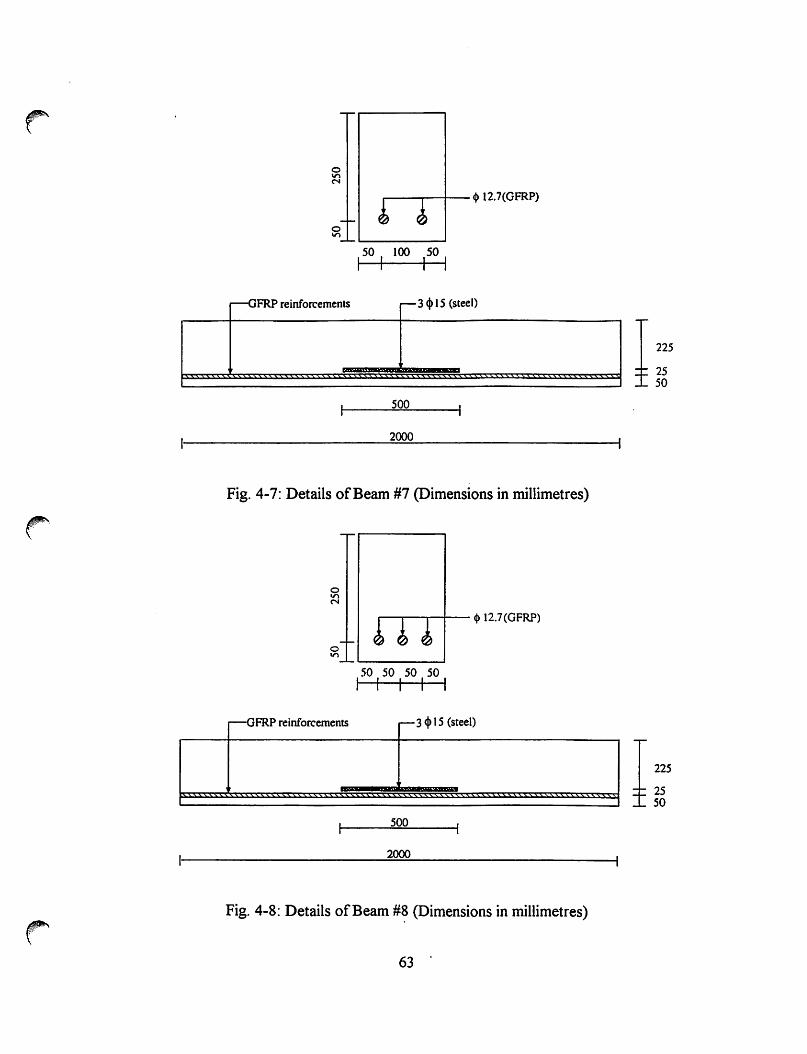
~--r----+-- 4112. 7 (GFRP)
-GFRP reinforcements r-3 <\> IS (steel)
500
2000
Fig. 4-7: Details of Beam #7 (Dimensions in millimetres)
~.
r---r----.--+-- 4112.7 (GFRP)
50 SO SO 50 I I I I I
GFRP ·nti -I rei orcements - 3<\>15(t l) see
500
2000
Fig. 4-8: Details of Beam #~ (Dimensions in millimetres)
63
I 225
25 50
I 225
25 50

.r'
o 11"\ N
o 11"\
r--GFRP reinforcements
~...--~"'T""'-f- ~ 12.7 (GFRP)
50 50 50 50 50 I I I I I I
-3 «t> 15 (steel)
500
2000
Fig. 4-9: Details of Beam #9 (Dimensions in millimetres)
- steel reinforcemen s
o 11"\ N
~~--,---+-- ~ 15 (steel)
50 50 50 50 I I I I I
~3 $15 (steel)
500
2400
Fig. 4-10: Details ofCBEAMl (Dimensions in millimetres)
64
I 225
25 50
I 225
25 50

o V'I
-steel reinforcements
_-.--__._-1-- $ 15 (steel)
so SO SO SO I I I I I
-3 ct> 15 (steel)
500
2000
Fig. 4-11: Details of CBEAM2 (Dimensions in millimetres)
o In
-steel reinforcements
.----.-----r---+-- $ 15 (stee 1 )
50 SO SO SO I I I I I
~3 ct> 15 (steel)
500
2000
Fig. 4-12: Details of CBEAM3 (Dimensions in millimetres)
65
I 225
25 50
I 225
25 SO

Fig. 4-1 3: Crack patterns of Beam # 1
Fig. 4-14 : Crack patterns of Beam #2
66

Fig. 4-15 : Crack patterns of Beam #3
Fig . 4- 16: Crack patterns of Beam #4
67

Fig. 4-1 7: Crack patterns of Beam #5
Fig. 4- 18 Crack patterns of Beam #6
68

Fig. 4- 19: Crack patterns of Beam #7
Fig. 4-20: Crack patterns of Beam #8
69

Fig. 4-21 : Crack patterns of Beam #9
Fig. 4-22 Crack pat terns of CBEAlvii
70

Fig. 4-23 : Crack patterns of CBEAM2
Fig . 4-24 Crack patterns of CBEAM3
71

200----------------------------------------------------·
160
120 Z .:.: -
80
40
10 20 Deflection (mm)
30
Fig. 4-25: Load-deflection diagram of Beam #1
40
200~--------------------------------------------------~
160
_ 120 z e "D
~ 80
20 Deflection (mm)
30
Fig. 4-26: Load-deflection diagram of Beam #2
72
40

#'. ~'
200~--------------------------------------------------~
160
_ 120 z e " as .9 80
40
10 20 Deflection (mm)
30
Fig. 4-27: Load-deflection diagram of Beam #3
40
200~--------------------------------------------------~
160
120 Z .:.: -
80
40
o+-----------~------------~----------~~----------~ o 10 20 Deflection (mm)
30
Fig. 4-28: Load-deflection diagram of Beam #4
73
40

200.---------------------------------__________________ ~
160
_ 120 z ~ -" as .9 80
40
10 20. 30 40 Deflection (mm)
Fig. 4-29: Load-deflection diagram of Beam #5
200~--------------------------------------------------,
160
_ 120 z ~ -
80
10 20 Deflection (mm)
30
Fig. 4-30: Load-deflection diagram of Beam #6
74
40

2oo------------------------------------------------------,
160
_ 120 z e "a as .9 80-
40-(\ 0~0-----------------------1TO-----------------iro---------------3rO·----------------~40
Deflection (mm)
Fig. 4-31: Load-deflection diagram of Beam #7
200~--------------------------------------------------------------------~
160-
120-Z e "a as .9
80- A.. 40- I \
O+---------------r-I------------~I--------------~I~----------------~ o 10 20 30 40
Deflection (mm)
Fig. 4-32: Load-deflection diagram of Beam #8
75

"',
" \'
200~--------------------------------------------------~
160-
- 120-z .:.= -"0 as .9 80- n
40-
O~----------~I------------'I------------'-----------~ o 10 20 30 40 Deflection (mm)
Fig. 4-33: Load-deflection diagram of Beam #9
200~---------------------------------------------------
160
_ 120 z .:.= -"0 as .9 80
40
10 20 Deflection (mm)
30
Fig. 4-34: Load-deflection diagram ofCBEAMI
76
40

200~--------------------------------------------------_
160
_ 120 z .:.: -
80
40
o+-----------~------------~----------~~----------~ o 10 20 Deflection (mm)
30
Fig. 4-35: Load-deflection diagram ofCBEAM2
40
200~--------------------------------------------------~
160
Z 120 .:.: -~
CIS
.9 80
40
o'~----------~------------~------------~----------~ o 10 20 Deflection (mm)
30
Fig. 4-36: Load-deflection diagram ofCBEAM3
77
40

Beam #1
st.4 st. 5 st. 7
Beam #2
Beam #3
Fig. 4-37: Sketches of crack patterns of Beams #1, #2 and #3 (a/d= 4)
78

Beam #4
Beam #5
Beam #6
Fig. 4-38: Sketches of crack patterns of Beams #4, #5 and #6 (a1d=3)
79
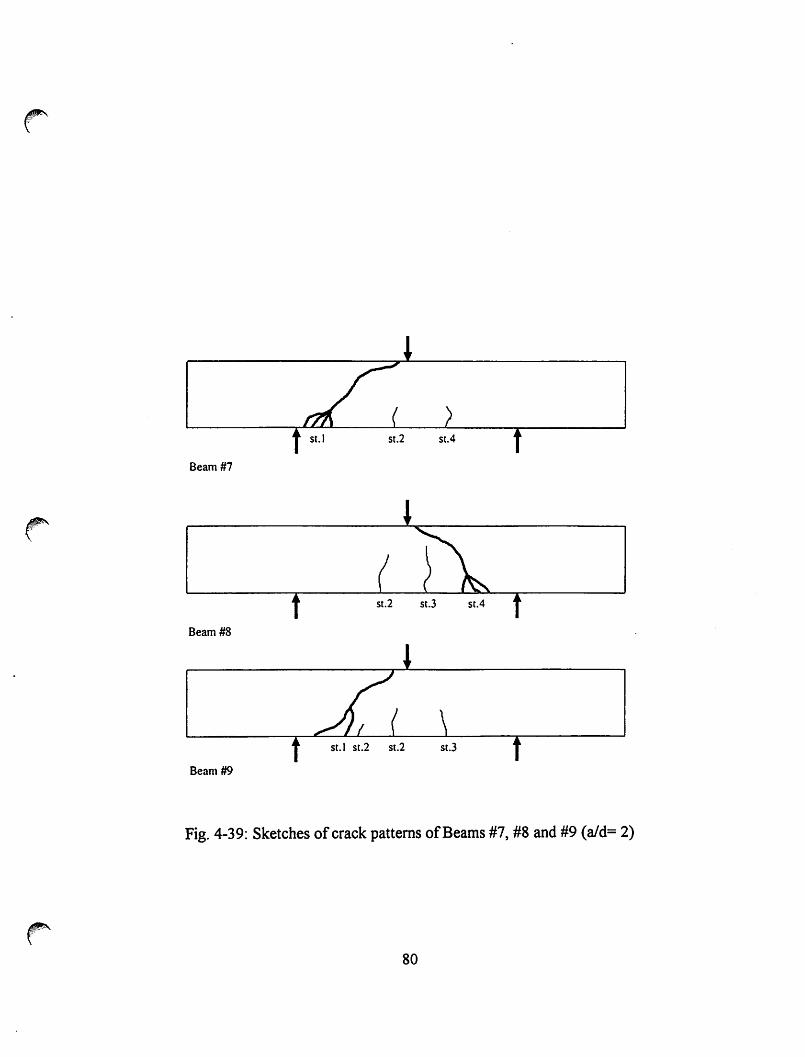
Beam #7
Beam #8
Beam #9
Fig. 4-39: Sketches of crack patterns of Beams #7, #8 and #9 (a1d= 2)
80

CBEAMI
CBEAM2
CBEAM3
Fig. 4-40: Sketches of crack patterns ofCBEAMI (a/d=4), CBEAM2 (a/d=3),
and CBEAM3 (aJd=2)
81

r' 180
150-
120-
-z e 90-
" CIS 0
..J
60-
~
30-~,
0 I I T I
0 0.4 0.8 1.2 1.6 2 Crack Width (mm)
Fig. 4-41: Load-crack width diagram of Beam #1
~ " 180
150
120
-z .:.: - 90 " CIS 0
..J
60
30
0 0 0.4 0.8 1.2 1.6 2
Crack Width (mm)
Fig. 4-42: Load-crack width diagram of Beam #2
82

180
150-
120-
-z ~ - 90-'tr as 0
...I
60-X
~/
30-
. 0
0~4 0:8 I I
0 1.2 1.6 2 Crack Width (mm)
Fig. 4-43: Load-crack width diagram of Beam #3
180~------------------------------------------------------------------------------------------------------~
150-
120-
90-
60-
O+------------------,--------------------~I--------------------~I--------------------~I------------------~ o 0.4 0.8 1.2 1.6 2 Crack Width (mm)
Fig. 4-44: Load-crack width diagram of Beam #4
83
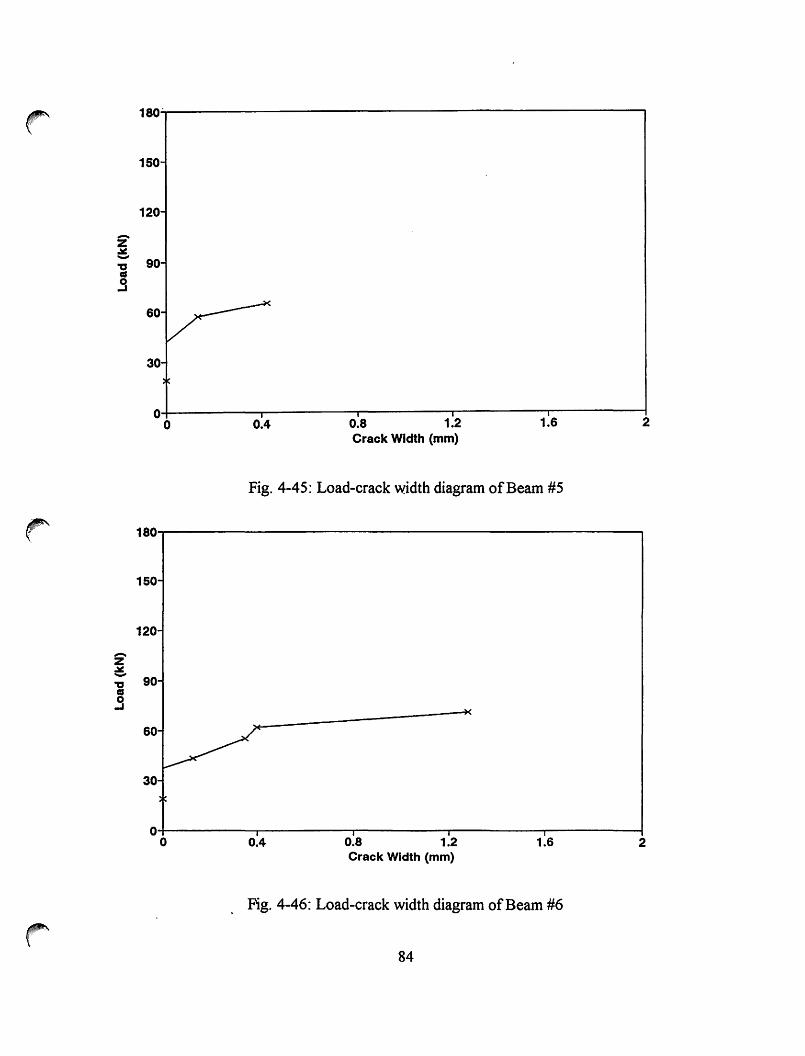
180~'-----------------------------------------------------,
150-
120-
z ~ - 90-
60.~
30-:
04---------~----------r-1--------11r_--------'1--------~ o 0:4 0.8 1.2 1.6 2
Crack W1dth (mm)
Fig. 4-45: Load-crack width diagram of Beam #5
180----------------------------------------------------------------~
150-
120-
-z ~ -" 90-a .9
60.~
30-.~
04------------~I---------r-I--------~------------~--------~ o 0.4 0.8 1.2 1.6 2 Crack Width (mm)
Fig. 4-46: Load-crack width diagram of Beam #6
84

Z e
z ~
180~--------------------------------------------------~
150-
120-
90-
60-VX 30-
O'~--------~I----------~--------~Ir---------~I'-------~ o 0.4 0.8 1.2 1.6 2
Crack Width (mm)
Fig. 4-47: Load-crack width diagram of Beam #7
180-------------------------------------------------------------------------~
150-
120-
:; 90-
as V .9 60-
30-
04----------~1---------------~1----------------~1----------~1--------------~ o 0.4 0.8 1.2 1.6 2
Crack Width (mm)
Fig. 4-48: Load-crack width diagram of Beam #8
85

Z .:.: -
r
-z .:.: -"0
CIS 0
..J
180-----------------------------------------------------,
150-
120-
90-~
60-
~
30-~
0+0-------------r-,-----------.------------,O.,r3----------~04 ~1 ~2 .
Crack width (mm)
Fig. 4-49: Load-crack width diagram of Beam #9
180
150-
120-
90-
60~~
30-
0 I
0 0.4 I I
0.8 1.2 1~6 2 Crack Width (mm)
Fig. 4-50: Load-crack width diagram ofCBEAM2
86

180.-------------------------------------------------~
150
120
Z e. 'tr 90 as .9
60
30
O+---------~--------~--------~------------------~ o 0.4 0.8 1.2
Crack Width (mm) 1.6
Fig. 4-51: Load-crack width diagram of CBEAM3
87
2

CHAPTERS
ANALYSIS AND DISCUSSION OF TEST RESULTS
5.1 Introduction
In this chapter, the behaviour of all the specimens tested in this program are analyzed and
discussed in detail. The measured shear capacity of GFRP beams is compared to the steel reinforced
beams and current provisions of the American Concrete Institute [ACI], Canadian Standards
Association [CSA], Japanese Society of Civil Engineers [JSCE], and Zsutty for estimating concrete
contribution in shear resistance. The results of test specimens are also compared to modifications of
existing equations by multiplying p, and Vcby different ratios of (EGFRP I Es,cc0.
5.2 General
The results from all the test beams are listed in Table 5-1. A few flexural cracks were
observed in the test beams in the high-moment region. However, the amount of longitudinal tensile
reinforcement was quite sufficient to prevent flexural failures. All beams failed in a flexural shear
mode.
88

5.3 Effect of Shear-Span-to-Depth Ratio:
In specimens with ald=3 and 4, diagonal shear cracks were obselVed at loads ranging from
27 % to 57% of the ultimate loads. In specimens with ald=2, these cracks occurred at a stage close
to failure. In deep beams, these cracks were also failure lines. All test beams developed diagonal
shear cracks and behaved essentially as tied arches until collapse. These cracks initiated along a line
joining the loading and reaction points (Fig. 4-37 to 4-40).
Comparing the load-deflection of the test beams with the same amount of p shows the
significant effect of aid on the ductility of the beams (Fig. 5-1 to 5-4). Beams with ald=2 exhibit
brittle behaviour, while it appears that beams with aid > 2 provide some warning of impending
collapse. For beams with ald=2, the failure was sudden and catastrophic.
The high shear strength of beams with aid of 2 may be ~ttributed to arch action. Many
researchers (Elzanaty, Nilson, and Slate 1986) have shown that for low aid, part of the load is
transmitted directly by diagonal compression to the supports. This is not a shear transfer mechanism,
in the sense that it does not transmit a tangential force to a nearby parallel plane, but permits the
direct transfer of a vertical concentrated force to a reaction and thereby reduces the demand on the
other types of load transfer.
It is generally recognized that increasing aid decreases the shear strength (Fig. 5-5). For the
same applied load, larger aid means larger bending moment in the shear span; thus the depth of
penetration of the flexural cracks increases, and hence the flexural stresses near the crack tip increase.
By increasing aid, the probability grows that a flexural crack will develop into an inclined one.
89
5.4 Effect of Reinforcement Ratio
Comparing the shear strength of test beams indicates the effect of th~ longitudinal
reinforcement ratio on the basic shear transfer mechanisms (Fig. 5-6). An important factor that
affects the rate at which a flexural crack develops into an inclined one is the magnitude of shear
stresses near the tip of that crack. The intensity of principal stresses above·the flexural crack depends
on the depth of penetration of the crack. The greater the value of p, the lower the penetration of
flexural cracks and the narrower the cracks. The lower the penetration of flexural cracks, the lower
the principal stresses for a given applied load, and consequently, the greater must be the applied shear
to cause the principal stresses that will result in diagonal tension cracking.
Increasing p also increases the dowel capacity of the member by increasing the dowel area
r' and hence decreasing the tensile stresses induced in the surrounding conerete. Many researchers
(Elzanaty, Nilson, and Slate 1986 ) have pointed out that the reinforcement stress at the time of
shear failure is a significant factor in determining the dowel force carried by the reinforcing bars, and
hence the shear capacity of the concrete beam.
Increasing p also affects the aggregate interlock capacity. Beams with low p have wide, long
cracks in contrast to the shorter, narrow cracks found in beams with high p. Since the aggregate
interlock mechanism depends on the crack width an increase in the aggregate interlock force is to be
expected with an increase in p.
For beams with aid of2, p had a significant effect on the shear strength. Increasing p from
0.507% to 1.014% increased the shear strength by 36%.
90

r' 5.5 Comparison of GFRP Beams and Control Beams
Comparison of the load-deflection diagrams of the GFRP beams and the control beams with
the same amount of reinforcement and the same aid ratios indicates a significant difference in flexural
behaviour of GFRP and steel (Fig. 5-7 to 5-9). Compared with steel reinforced beams, GFRP beams
have much larger deflections and wider cracks before failure. The reason for this is the large
difference in modulus of elasticity (EGFRP = 41.3 rv1P A, Estcc1 = 200 Iv1P A).
In the beams with ald=3 and 4, the shear strength of the GFRP beams is about 62% that of
steel reinforced beams with the same amount of reinforcement. However in deep beams with ald=2,
this ratio drops to about 45%. It seems that the behaviour of the beams reinforced with steel is more
affected by the ratios of aid than the behaviour of GFRP beams.
5.6 Comparison of Test Results and Existing Equations
The shear strength of all twelve test beams was compared with predi9tions made using the
equations provided by: ACI (1992), CSA (1994), JSCE (1984), and Zsutty (1968) (Fig. 5-10 to 5-14
and Table 5-2). These equations are as follow:
A CI Clause 11.3.2.1 lSI}:
[ JJ:+120 P ~: 1 V = b d~ 0.3 Gi'f'b d (N)
c 7 w VJc' w
91

Vd where : -"- = d/ a
M"
ACI Clause IJ.3.J.l[SI}:
[N]
JSCE [SI}:
[kg]
where: P d=(lOO /d)1/4_1 ~ 0 (d[cm])
P,.= M/Mdsl (Mo= decompression moment, Md= applied moment)
92

Zsutty [SII:
CSA Simplified Method [SII:
v = O.2.J"/ (1/2)b d c :J c w
These equations were also modified for beams p with GFRP by multiplying p by the ratio
of the moduli of elasticity of GFRP and steel as follows: p x ( EGFRP / Esteel), V r, x ( EGFRP / ESteel ),
5.6.1 CONTROL BEAMS:
Fig. 5-15 and Table 5-2 shows the comparison of the shear strength of the control beams and
the predicted values.
- It can be seen that ACI equations are conservative in predicting the shear strength of steel
reinforced beams. This conservative approach is m.ore severe in deep beams. The reason is probably
the underestimation of the importance of both p and aid in ACI clause 11.3.2.1 and eliminating these
93

factors in ACI clause 11.3.1.1.
- Similar to ACI predictions, JSCE underestimates the shear capacity of steel reinforced
beams especially in shorter shear spans.
- Compared with ACI and JSCE, CSA provides better predictions with ald=4 and 3. But like
the others, CSA is conservative when ald=2. Similar to ACI clause 11.3 .1.1, the reason for this
underestimation is eliminating effects of the p and aid and mixing two different behaviours of deep
and slender beams (MacGregor 1988).
- By taking the rate of 113 for p and aid, instead of 112, and multiplying Vc by (2.5 d1a) for
aid < 2.5, Zsutty provides closer predictions to the test results. Compared with other predictions,
close correlation of predictions using Zsutty's equation and test results is more recognizable when
ald=2.
5.6.2 GFRP BEAMS:
The different moduli of elasticity for GFRP and steel is one of the main reasons for the
different flexural and shear behaviour of beams reinforced with GFRP and steel. When modifying
existing equations by multiplying p and Vc by the ratio of( EG~stccl) it was found that:
1- Multiplying Vc by ( EG~stccl ) is a very conservative prediction for the shear strength of
GFRP beams (Table 5-3 to 5-7 and Fig. 5-16 to 5-20).
2- Multiplying Vc by ( EG~steel )112 is a better modification than ( EG~steel ), but it still
underestimates the shear strength of these materials (Table 5-3 to 5-7 and Fig. 5-2'1 to 5-25).
3- Vc x (EG~slccl )113 provides the best modification of existing equations to estimate the
94

shear strength of GFRP beams (Table 5-3 to 5-7 and Fig. 5-26 to 5-30).
4- Modification of V c by mUltiplying p by ( EGrnJEslCCI) is a conservative method to predict
the shear strength ofGFRP beams (Table 5-8 and Fig. 5-31 to 5-35), except when used to modify
Zsutty's equation where this method provides identical numbers as the method using Vex (
EGrnJEstccl )113 .
5- Among the existing equations, multiplying Vc from Zsutty's equation by (EGrnJEslccJ1/3 is
the best estimation for the shear strength of GFRP beams.
95

Beam Material aid p% rc(MPa) Vc (kN)
Beam #1 GFRP 0.537 31.2 23.7
Beam #2 GFRP 4 0.794 31.2 25.8
Beam #3 GFRP 1.078 31.2 32.6
CBEAMI Steel 1.060 43 61.5
Beam #4 GFRP 0.507 35 29.9
Beam #5 GFRP 3 0.760 35 39.3
Beam #6 GFRP 1.014 35 37.2
CBEAM2 Steel 1.060 35 61
Beam #7 GFRP 0.507 31 32.1
Beam #8 GFRP 2 0.760 32.5 40
Beam #9 GFRP 1.014 32.5 43.6
CBEAM3 Steel 1.060 32.5 97
Table 5-1: Description of test beams and test results
96

Beam Material aid p 0/0 Vc(kN) Vc(kN) Vc(kN) Vc(kN) Vc(kN) Vc(kN)
ACI ACI Zsutty JSCE CSA Test
11.3.1.1 11.3.2.1
Beam #1 GFRP 0.537 46.5 41 37.8 35.9 55.8 23.7
Beam #2 GFRP 4 0.794 46.5 41.6 43 40.9 55.8 25.8
Beam #3 GFRP 1.078 46.5 42.2 47.6 45.7 55.8 32.6
CBEAMI Steel 1.060 54.6 49.1 52.7 50.4 65.6 61.5
Beam #4 GFRP 0.507 49.3 43.7 42.4 36.6 59.2 29.9
Beam #5 GFRP 3 0.760 49.3 44.4 48.5 41.9 59.2 39.3
Beam #6 GFRP 1.014 49.3 45.1 53.4 46.3 59.2 37.2
CBEAM2 Steel 1.060 49.3 45.3 54.2 47.1 59.2 61
Beam #7 GFRP 0.507 46.4 41.9 58.2 35.2 55.7 32.1
Beam #8 GFRP 2 0.760 47.5 44 67.7 40.8 57 40
Beam #9 GFRP 1.014 47.5 45.1 74.5 45.1 57 43.6
CBEAM3 Steel 1.060 47.5 45.3 75.6 45.9 57 97
Table 5-2: Comparison of test results and predicted values
97

Beam AClll.3.1.1(EG~stHI) ACI 11.3.1.1(EGFRPlEstHI)1Il ACI 11.3.1.1(EGFRPlEsteel)I/J Test
No. Vcp(kN) VcI'Icp Vcp(kN) VJVcp Vcp(kN) Vc/Vcp Vet
1 9.3 2.55 20.8 1.14 27.2 0.87 23.7
2 9.3 2.77 20.8 1.24 27.2 0.95 25.8
3 9.3 3.5 20.8 1.57 27.2 1.2 32.6
4 9.86 3.03 22 1.36 28.8 1.04 29.9
5 9.86 3.98 22 1.79 28.8 1.36 39.3
6 9.86 3.77 22 1.69 28.8 1.29 37.2
7 9.28 3.46 20.7 1.55 27.1 1.18 32.1
8 9.5 4.2 21.2 1.89 27.8 1.44 40
9 9.5 4.59 21.2 2.06 27.8 1.57 43.6
Table 5-3: Comparison of test results and mUltiplying Vcfrom ACI 11.3.1.1 by different ratios of
(EGFRP"EstccJ
Beam A Clll.3.2.1 (EGFRPlEslHl) ACI 1 1.3.2. 1 (EGFRPIESlHl) 112 A CI 11.3.2.1 (ECFRPIEStHI) 1/3 Test
No. Vc:p(kN) ,VetlVc:p Vc:p(kN) VetNc:p Vc:p(kN) VetlVcp Vet
1 8.2 2.89 18.33 1.29 24 0.99 23.7
2 8.32 3.1 18.6 1.39 24.3 1.06 25.8
3 8.44 3.86 18.9 1.72 24.7 1.32 32.6
4 8.74 3.42 19.5 1.53 25.5 1.17 29.9
5 8.88 4.42 19.8 1.98 26 1.51 39.3
6 9.02 4.12 20.2 1.84 26.4 1.41 37.2
7 8.38 3.83 18.7 1.72 24.5 1.31 32.1
8 8.8 4.54 19.7 2.03 25.7 1.56 40
9 9.02 4.83 20.2 2.16 26.4 1.65 43.6
Table 5-4: Comparison of test results and multiplying Vc from ACI 11.3.2.1 by different ratios of
(EGFRP"Estccl)
98

Beam Zsutty (EGFRP,Es'eel) Zsutty (EGFRPlEsleel)lll Zsutty (EGFRPlEsleel)l13 Test
No. Vcp(kN) VclVcp Vcp(kN) VclVcp Vcp(kN) VcIVcp Vet
1 7.56 3.13 16.9 1.4 22.1 1.07 23.7
2 8.6 3 19.2 1.34 .25.1 1.03 25.8
3 9.52 3.42 21.3 1.53 27.8 1.17 32.6
4 8.44 3.5 19 1.57 24.8 1.2 29.9
5 9.7 4.05 21.7 1.81 28.4 1.38 39.3
6 10.68 3.48 23.9 1.56 31.2 1.19 37.2
7 11.64 2.76 26 1.23 34 0.94 32.1
8 13.54 2.95 30.3 1.32 35.6 1.12 40
9 14.9 2.93 33.3 1.31 43.6 1 43.6
Table 5-5: Comparison of test results and mUltiplying Vc from Zsutty's equation by different
Beam CSA(EGFRPlEsteel) CSA (EGFRPlEsteel)III CSA(EGFRPlEstee')113 Test
No. Vcp(kN) Vc/Vcp Vcp(kN) Vc/Vcp Vcp(kN) Vc!Vcp Vet
1 11.2 2.12 24.9 0.95 32.6 0.73 23.7
2 11.2 2.3 24.9 1.04 32.6 0.79 25.8
3 11.2 2.91 24.9 1.31 32.6 1 32.6
4 11.8 2.53 26.5 1.13 34.6 0.86 29.9
5 11.8 3.33 26.5 1.48 34.6 1.13 29.3
6 11.8 3.15 26.5 1.4 34.6 1.07 37.2
7 11.1 2.89 24.9 1.29 32.6 0.98 32.1
8 11.4 3.51 25.5 1.57 33.3 1.2 40
9 11.4 3.82 25.5 1.71 33.3 1.31 43.6
Table 5-6: Companson of test results and multiplying Vc from CSA simplified method by
different ratios of (EoFRP"Es,ccJ
99

Beam JSCE(Ec~steel) JSCE(EcFRPlEsteel)lIl JSCE(ECFRPlEsteel) 113 Test
No. Vc:p(kN) Vc:tNc:p Vc:p(kN) Vc:tNc:p Vc:p(kN) Vc:tNc:p Vc:p
1 7.18 3.3 16.05 1.48 21 1.13 23.7
2 8.18 3.15 18.3 1.41 23.9 1.08 25.8
3 9.14 3.57 20.4 1.6 26.7 1.22 32.6
4 7.32 4.08 16.4 1.82 21.4 1.4 29.9
5 8.38 4.69 18.7 2.1 24.5 1.6 39.3
6 9.26 4.02 20.7 1.8 27.1 1.37 37.2
7 7.04 4.5 15.7 2.04 20.6 1.56 32.1
8 8.16 4.9 18.2 2.2 23.8 1.68 40
9 9.02 4.83 20.2 2.16 26.4 1.65 43.6
Table 5-7: Comparison of test results and mUltiplying Vc from JSCE by different ratios of
Beam aid p% Vc(kN) Vc(kN) Vc(kN) Vc(kN)
No. ACI 11.3.2.1 Zsutty JSCE Test
1 0.537 40.1 22.1 23.3 23.7
2 4 0.794 40.2 25.1 25.5 25.8
3 1.078 40.3 27.8 27.7 32.6
4 0.507 42.5 24.8 23.9 29.9
5 3 0.760 42.7 28.4 26.2 39.3
6 1.014 42.8 31.2 28.1 37.2
7 0.507 40.2 34 22.9 32.1
8 2 0.760 41.4 35.6 25.5 40
9 1.014 41.6 43.6 27.4 43.6
Table 5-8: Companson of test results and modifying Vcfrom ACI 11.3.2.1, Zsutty and JSCE
by mUltiplying p by (EomJEstccU
100

200~----------------------------------------------~
Beam#7 (a/d=2) 160
_ 120 z
Beam#4 (a/d=3)
~ -80 /Beam#1 (a/d=4)
o~-----------,------------~----------~~----------~ o 10 20 Deflection (mm)
30 40
Fig. 5-1: Comparing the load-deflection diagram of Beams # 1, #4 and #7
200---------------------------------------------------.
160 Beam#8 (a/d=2)
_ 120 z
Beam#5 (a/d=3)
/ Beam#2 (a/d=4) e -g .9 L 80
40
o~----------~------------.------------.------------~ o 10 20 30 40 Deflection (mm)
Fig. 5-2: Comparing the load-deflection diagram of Beams #2, #5 and #8
101

200.---------------------------------------------------
160
120 Z .:.: -" ca .9
-z .:.: -" ca .9
80
40
o~----------~----------~------------~----------~ o 10 20 Deflection (mm)
30
Fig. 5-3: Comparing the load-deflection diagram of Beams #3, #6 and #9
40
200~------------------------------------------------~
160 ..... 1------------- CBEAM3 (a/d=2)
120 CBEAM2 (aId =3)
80 CBEAM1 (ald=4)
40
o+-----------~----------~~----------~----------~ o 10 20
Deflection (mm) 30 40
Fig. 5-4: Comparing the load-deflection diagram of CBEAM1 , CBEAM2 and CBEAM3
102

r-
t:! ... ~
~
"'" >~
20
---p=1.060% (Steel)
~ -t-p=1.014% (GFRP)
15
\ ~
p=0.760% (GFRP) -a-p=O.507% (GFRP)
'" 10
-----------~
~ :s=:: 5
O+-----------------~------~--------~------~------~ o 1 2 3 4 5 6 aId
Fig. 5-5: Shear strength verses aid for the test beams
20~------------------------------------~========~
15
5
aId =2 (Steel)o
a/d=3 (Steelb a'.d =4 (Steel)o
---a/d=2 (GFRP)
a/d=3 (GFRP) -t-a/d=4 (GFRP)
o+---------~----------~--------,---------~--------~ o 0.3 0.6 0.9 1.2 1.5 P%
Fig. 5-6: Shear strength ,:,erses p for the test beams
103

" ... ",.,
"
200~------------------------------------------------~
160
120 Z p=1.060% (CBEAM1) .JII: -i .9
-z .JII: -"D as .9
80
p= 1.078% (8eam#3)
40
O+------------.----------~------------~----------~ o 10 20 Deflection (mm)
30
Fig. 5-7: Load-deflection diagram of Beam #3 and CBEAMI (a/d=4)
40
200--------------------------------------------------~
160
120 p= 1.060% (CBEAB2)
80
40
o+-----------~----------~r-----------,-----------~ o 10 20 30 40 Deflection (mm)
Fig. 5-8: Load-deflection diagram of Beam #6 and CBEAM2 (a/d=3)
104

Z C "C co 0 -'
Q.
~ u >
200,---------------------------------------------------,
160
120
p~1.060%(CBEAM3)
80
40 p~1.014%(Beam#9)
O~----------_.------------._----------~r_----------~ o 10 20
Deflection (mm) 30
Fig. 5-9: Load-deflection diagram of Beam #9 and CBEAM3 (aJd=2)
1 +1····_············· ···_······_······_···_·······_···· .......... _ .. ............. _._.-.... _ .......................... _ .......................... _,
1 2 3 4 5 6 7 8 9 Beam Number
40
Fig. 5-10: Comparison of the shear strength ofGFRP beams and ACI 11.3 .1.1
105

,co
1 -11-............... .
Fig. 5-15 : Comparison of the shear strength of control beams and different equations
a. " ~ " >
2
1-14··_·········
1 2 3 4 5 6 7 8 9 Beam Number
Fig. 5-16 : Comparison of test results and multiplying Y, from ACI 11 .3. 1.1 by (EGFR.P"E,,,,,)
108

Co o ~ 1.5 ~
Co o ~ 1 o >
l fl··--·_·_······_····_·_··············_··········_-_· ......... -._ .......... _ ... __ ... - ............... _ ................ _ ...... .
1 2 3 4 5 6 7 8 9 Beam Number
Fig. 5-11: Comparison of the shear strength ofGFRP beams and ACI 11.3.2. 1
2
1 ~·················-·· ·· ·······-······· ··- ·· ·· · ······· ............ ......................................................... .... - ......................................... .......................... j
1 2 3 4 5 6 7 8 9 Beam Number
Fig. 5-12: Comparison of the shear strength ofGFRP beams and Zsutty's equation
106

a. o ~ 1.5 g
Beam Number
Fig. 5-13: Comparison of the shear strength of GFRP beams and CSA
1 2 3 4 5 6 '7 8 9 Beam Number
Fig. 5- 14: Comparison of the shear strength of GFRP beams and JSCE
107

c.
~ o >
1 +1 .. _ ....... _.
1 2 3 4 5 6 7 8 9 Beam Number
Fig. 5-17: Comparison of test results and multiplying Y, from ACI 11 .3.2. 1 by (EG~"'d)
c. o ~ 1j >
1 -¥l·· .... · .. · .. · ..
1 2 3 4 5 6 7 8 9 Beam Number
Fig. 5-18: Comparison of test results and multiplying YJrom Zsutty's equation by (EG~E""I)
109

Co ~ o >
1-¥l··_·_·-
o-J.C::= 1 2 3 4 5 6 7 8 9
Beam Number
Fig. 5-19: Comparison of test results and multiplying Y, from CSA by (EGFruiE,"d)
Co ~ o >
1 2 3 4 Beam Number
Fig. 5-20: Comparison of test results and multiplying VJrom JSCE by (EGFRIE"",)
11 0
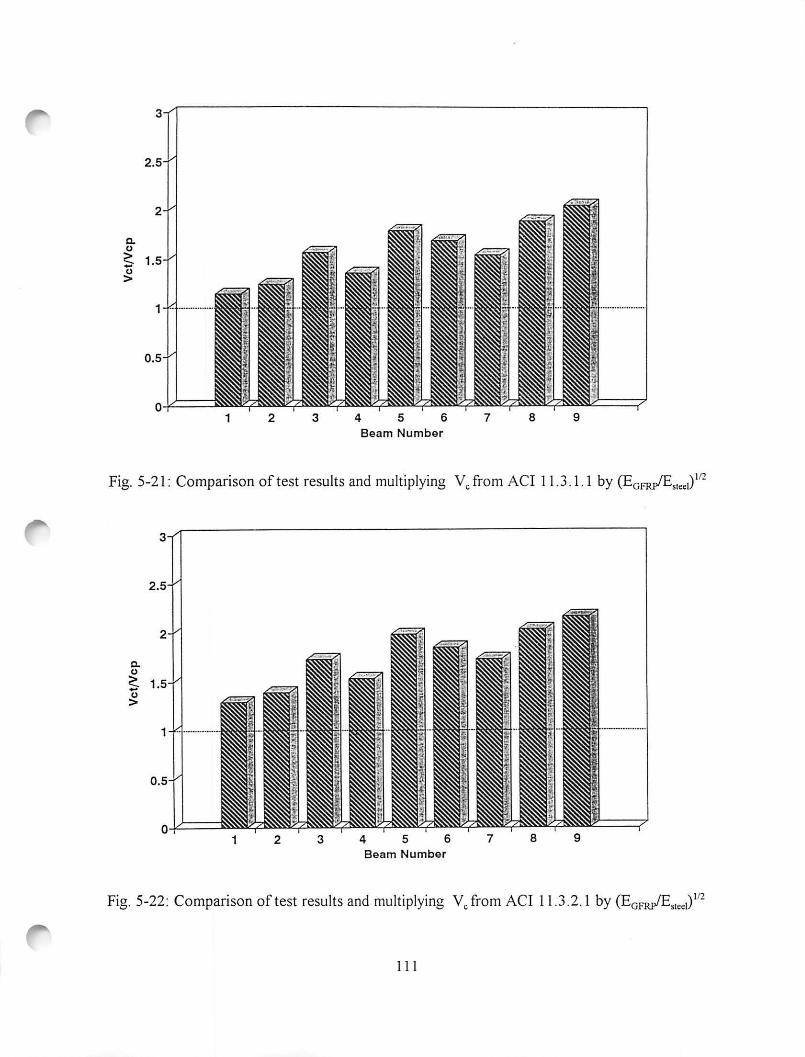
a. " ~ " >
1-1"1·················
1 2 3 4 5 6 7 8 9 Beam Number
Fig. 5-21: Comparison of test results and multiplying VJrom ACI 11.3 .1.1 by (EGrnlE'''ol) l12
a.
~ (; >
1 -+"1·_··_···········
1 2 3 4 5 6 7 8 9 Beam Number
Fig. 5-22: Comparison of test results and multi plying VJrom ACI 11.3.2. 1 by (EGrn/E",d) l12
I 1 1

2
c.
~ 1. ~
1 -¥-J. __ .. _--.
1 2 3 4 5 6 7 8 9 Beam Number
Fig. 5-23 : Comparison of test results and multiplying VJrom Zsutty's equation by (EOFlUJ E,,,,,)'12
2
1-¥-J··_ .... · .... ·
1 2 3 4 5 6 7 8 9 Beam Number
Fig. 5-24 : Comparison of test results and multiplying VJrom CSA by (EocruiE' ''d)'12
112

a. u ~ 1 "0 >
2
1 2 3 4 5 6 7 8 9 Beam Number
Fig. 5-25: Comparison of test results and multiplying VJrom JSCE by (EGFR,IE,,,,~ 'n
3
2.5
2
a. u
~ 1.5 u >
1
0.5
0 1 2 3 4 5 6 7 8 9
Beam Number
Fig. 5-26: Comparison of test resu lts and multip lying VJrom ACI 11.3.1.1 by (EGFlu/E"",) '!3
11 3

2
c. " ~ 1
" >
1
0.5
0 2 3 4 5 6 7 8 9
Beam Number
Fig. 5-27: Comparison of test results and multiplying V, from 11.3.2.1 by (EoFruiE",,;J'13
c. " ~ " >
1 +1 .. _._ ...... .
1 2 3 4 5 6 7 8 9 Beam Number
Fig. 5-28: Comparison of test results and multiplying V, from Zsutty's equation by (EOFruiE",,\)'13
11 4

a. u
~ u >
a. u
~ u >
1-r-J---···_··_·····_·_·_-_···· __ ·
1 2 3 4 5 6 . 7 8 9 Beam Number
Fig. 5-29: Comparison of test results and multiplying VJrom CSA by (EG~SI"I)"3
1-+1················
1 2 3 4 5 6 7 Beam Number
Fig. 5-30: Comparison of test resu lts and mUltiplying V, from JSCE by (EG~ESI"I)1/3

a.
~ u >
1 ~+'-----" '-'--'---""""-""-"" '-'-"-""'-'-' .. -.--~
1 2 3 4 5 6 Beam Number
7 8 9
Fig. 5-31: Comparison of test results and modifYing V, from ACI 11 .3.2. 1 by multiplying p by
a.
~ u >
1 2 3 4 5 6 7 8 9 Beam Number
Fig. 5-32 : Comparison of test results and modifYing V, from Zsutty's equation by multiplying p by
11 6

2
a.
~ 1.5 CJ >
1 2 3 4 5 6 7 8 9 Beam Number
Fig. 5-33 : Comparison of test results and modifying Y, from JSCE by multiplying p by (EGFRiE"",)
117

CHAPTER 6
SUMMARY AND CONCLUSIONS
6.1 Summary
The main purpose of this research was to study the shear behaviour of GFRP beams. Nine
beams reinforced with GFRP reinforcements and three control beams reinforced with steel were
tested. Shear reinforcement was not used in any of these beams. All of these beams had a 200 mm
x 300 mm cross section and were tested under a three-point load over a simple span. In this study
the effect of the longitudinal reinforcement and shear span-to-depth ratio on the shear strength of
--------------GFRPbeams wer investigated. Test results were compared to the ACI, CSA, JSCE, and Zsutty
::;::=: .
equations which are provided for prediction of the shear strength of steel reinforced concrete and
modifications of these equations for GFRP. Test results provide some recommendations and
guidelines toward the development of design codes which will address the use of GFRP bars as
reinforcement for structural concrete members.
6.2 Conclusions
Based on the experimental results and the observed behaviou'r, the following conclusions may
118

be made:
1- Stiffness of beams reinforced by ISOROD-GFRP reinforcement is significantly reduced after
initiation of cracks in comparison to the beams reinforced by steel bars.
2- The shear strength of GFRP and steel reinforced beams increases with the increase of p.
3- Decreasing aid increases the shear strength of GFRP and steel reinforced beams.
4- In slender beams ( a/d=4 and 3), the shear strength of GFRP beams is about 62% of the shear
strength of steel reinforced beams. This ratio drops to 45% in de~p beams (a/d=2).
5- Because of the low modulus of elasticity ofGFRP, beams reinforced with this material have larger
deflections and wider cracks than beams reinforced with steel.
6- Beams reinforced by ISOROD-GFRP bars exhibit adequate warning prior to failure through large
and deep cracks, accompanied by large deflections. / 1 ~-------', ~ . r- 5- In order to estimate shear strength ofGFRP beam(,:UItiP\yin?y. by (EG~stcd)113 is the best
way to modifY existing equations which have been prOviOell~e\ reinforced beams.
6- Among the existing equations, regarding the different behaviour of deep beams and slender beams,
multiplying Vc in Zsutty's equation by (EG~stcct )113 is the best evaluation of the shear strength of
GFRPbeams.
6.3 Recommendations for Future Work
Based on the experimental program and analysis the following recommendations are made:
1- Because of the limited number of specimens tested in this program, it is recommended that similar
specimens be tested to corroborate the findings of this study.
119

r 2- This research was limited to ISOROD-GFRP. Other commercially available GFRP reinforcements
should be tested to compare the effect on Vc'
3- Based on the conclusions found, future study should consider the modular ratio EG~stcc" to be
an important factor in the determination of V c.
120
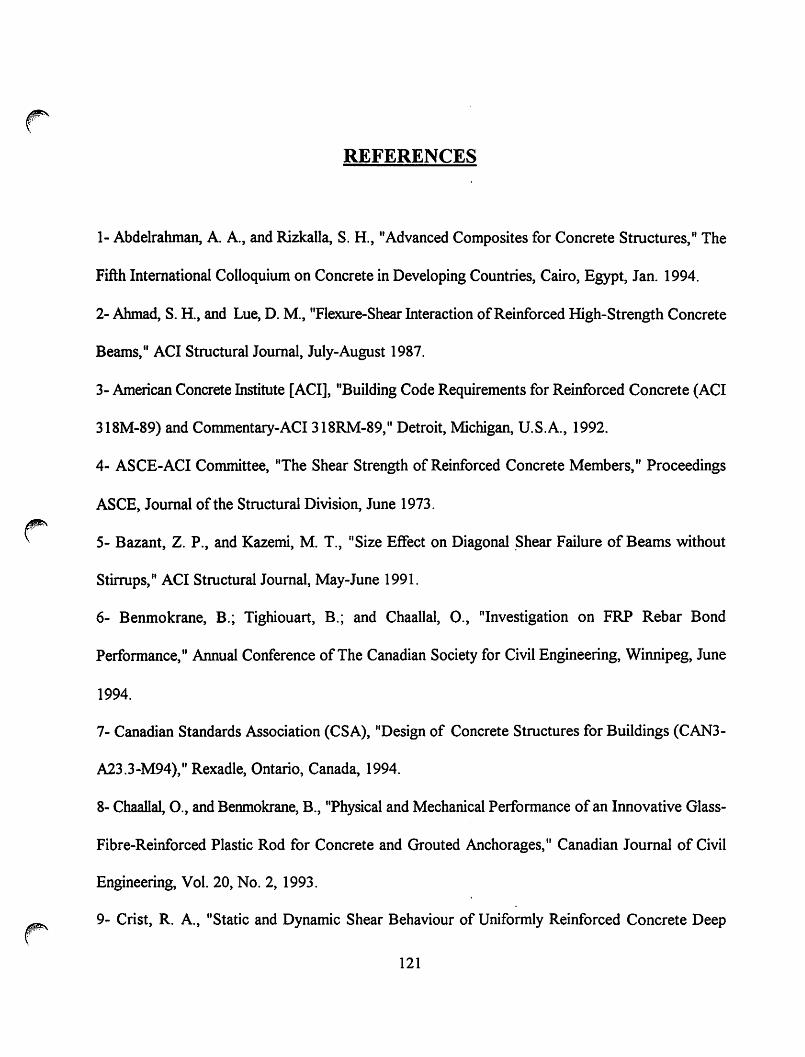
REFERENCES
1- Abdelrahman, A. A., and Rizkalla, S. H., "Advanced Composites for Concrete Structures," The
Fifth International Colloquium on Concrete in Developing Countries, Cairo, Egypt, Jan. 1994.
2- Ahmad, S. H., and Lue, D. M., "Flexure-Shear Interaction of Reinforced High-Strength Concrete
Beams," ACI Structural Journal, July-August 1987.
3- American Concrete Institute [ACI], "Building Code Requirements for Reinforced Concrete (ACI
318M-89) and Commentary-ACI 318RM-89," Detroit, Michigan, U.S.A., 1992.
4- ASCE-ACI Committee, "The Shear Strength of Reinforced Concrete Members," Proceedings
ASCE, Journal of the Structural Division, June 1973.
5- Bazant, Z. P., and Kazemi, M. T., "Size Effect on Diagonal .Shear Failure of Beams without
Stirrups," ACI Structural Journal, May-June 1991.
6- Benmokrane, B.~ Tighiouart, B.; and Chaallal, 0., "Investigation on FRP Rebar Bond
Performance," Annual Conference of The Canadian Society for Civil Engineering, Winnipeg, June
1994.
7- Canadian Standards Association (CSA), "Design of Concrete Structures for Buildings (CAN3-
A23.3-M94)," Rexadle, Ontario, Canada, 1994.
8- Chaallal, 0., and Benmokrane, B., "Physical and Mechanical Performance of an Innovative Glass
Fibre-Reinforced Plastic Rod for Concrete and Grouted Anchorages," Canadian Journal of Civil
Engineering, Vol. 20, No.2, 1993.
9- Crist, R. A., "Static and Dynamic Shear Behaviour of Uniformly Reinforced Concrete Deep
121
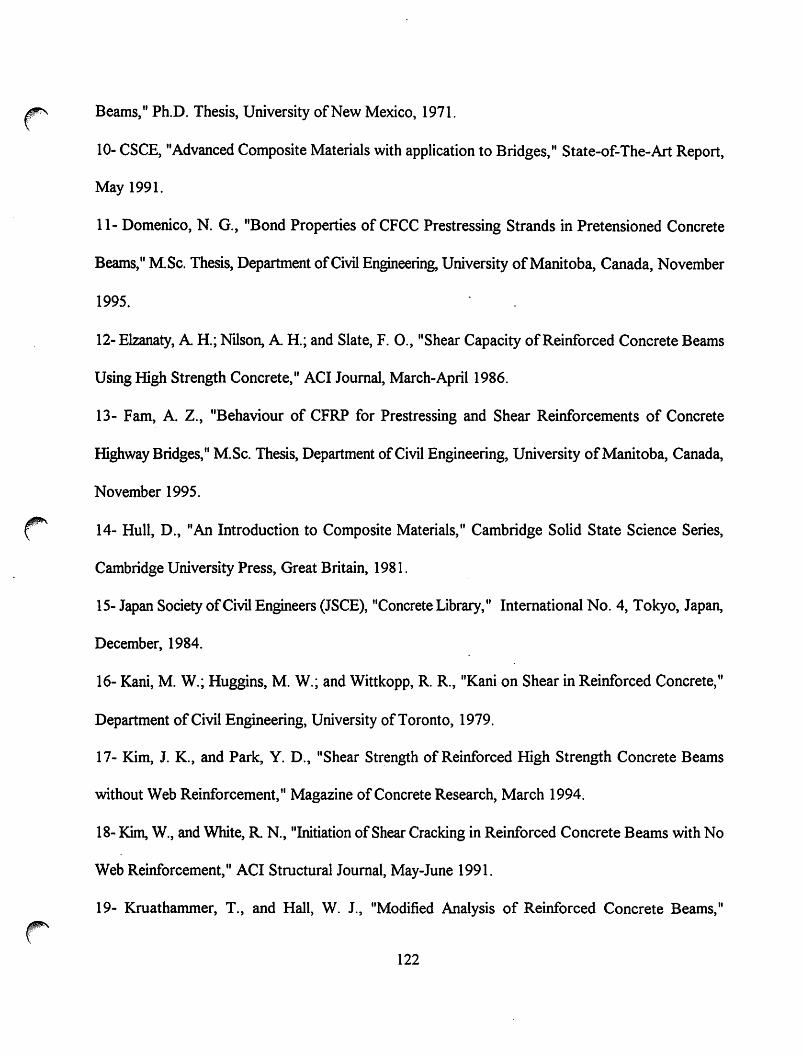
r' Beams," Ph.D. Thesis, University of New Mexico, 1971.
10- CSCE, "Advanced Composite Materials with application to Bridges," State-of-The-Art Report,
May 1991.
11- Domenico, N. G., "Bond Properties of CFCC Prestressing Strands in Pretensioned Concrete
Beams," M.Sc. Thesis, Department of Civil Engineering, University of Manitoba, Canada, November
1995.
12- Elzanaty, A H.; Nilson, A H.; and Slate, F. 0., "Shear Capacity of Reinforced Concrete Beams
Using High Strength Concrete," ACI Journal, March-April 1986.
13- Fam, A. Z., "Behaviour of CFRP for Prestressing and Shear Reinforcements of Concrete
Highway Bridges," M.Sc. Thesis, Department of Civil Engineering, University of Manitoba, Canada,
November 1995.
14- Hull, D., "An Introduction to Composite Materials," Cambridge Solid State Science Series,
Cambridge University Press, Great Britain, 1981.
15- Japan Society of Civil Engineers (JSCE), "Concrete Library," International No.4, Tokyo, Japan,
December, 1984.
16- Kani, M. W.; Huggins, M. W.; and Wittkopp, R. R., "Kani on Shear in Reinforced Concrete,"
Department of Civil Engineering, University of Toronto, 1979.
17- Kim, 1. K., and Park, Y. D., "Shear Strength of Reinforced High Strength Concrete Beams
without Web Reinforcement," Magazine of Concrete Research, March 1994.
18- Kim, W., and White, R N., "Initiation of Shear Cracking in Reinforced Concrete Beams with No
Web Reinforcement," ACI Structural Journal, May-June 1991.
19- Kruathammer, T., and Hall, W. J., "Modified Analysis of Reinforced Concrete Beams,"
122
Proceedings, ASCE, Vol. 108, Feb. 1982.
20- Kruathammer, T.; Shahriar, S.; and Shanaa, H. M., "Analysis of Reinforced Concrete Beams
Subjected to Severe Concentrated Loads," ACI Structural Journal, November-December 1987.
21- Leonhardt, F., and Walther, R., "Wandartige Trager Deutscher," Ausschuss fur Stahlbeton, vol.
178, Wilhelm Ernst und Sohn, Berlin, West Germany, 1966.
22- Leonhardt, F., "Deep Beams-Plane Structures Loaded Parallel to their Mid-Plane," Bulletin D'
Information No. 65, Comite Europeen du Beton, Paris, France, Feb. 1968.
23- MacGregor, 1. G., and Hanson, 1. M., "Proposed Changes in Shear Provisions for Reinforced and
Prestressed Concrete Beams," ACI Journal, April 1969.
24- MacGregor, 1. G., "Reinforced Concrete, Mechanics & Design," Printice Hall, 1988.
25- Machida, A, "State-of-the Art Report on Continuous Fibre Reinforcing Materials," Japan Society
~ of Civil Engineers, October 1993.
26- Mallick, P .K., "Fibre Reinforced Composites: Materials, Manufacturing and Design," Library of
Congress, U.S.A., 1988.
27- Marti, P., "Basic Tools of Reinforced Concrete Beam Design," ACI Journal, January-February
1985.
28- Michaluk, C. R., "Flexural Behaviour of One-Way Concrete Slabs Reinforced by Glass-Fibre
Reinforcements," M.Sc Thesis, Department of Civil Engineering, University of Manitoba, Canada,
February 1996.
29- Muosaku, M., "Using FRP Materials in Prestressed Concrete Structures," Concrete International,
August 1992.
30- Mphonde, A. G., and Frantz, G. C., "Shear Tests of High-and Low-Strength Concrete Beams
123
without Stirrups," ACI Journal, July-August 1984.
31- Narayanan, R., and Darwish, I. Y. S., "Fibre Concrete Deep Beams in Shear," ACI Structural
Journal, March-April 1988.
32- NEFMAC, "Technical Leaflet 2, New Fibre Composite Material for Reinforcing Shotcrete,"
NEFCOM Corporation, Japan, 1987.
33- Ojha, S. K., "Deformations of Reinforced Concrete Rectangular Beams Under Combined
Torsion, Bending, and Shear," ACI Journal, August 1974.
34- Pincheira, Jose, "Welded Wire Fabric as Shear Reinforcement in Concrete T-Beams Subjected
to Cyclic Loading," M.Sc. Thesis, Department of Civil Engineering, University of Manitoba, Canada,
July 1988.
35- Poli, S. D.; Prisco, M. D.; and Gambarova, P. G., "Shear Response, Deformations, and Subgrade
r' of a Dowel Bar Embedded in Concrete," ACI Structural Journal, ~ovember-December 1992.
36- Portland Cement Association, "Design of Deep Girders," Concrete Information.
37- Rebeiz, K. S.; Serhal, S. P.; and Fowler, D. W., "Recommended Design Procedure in Shear for
Steel-Reinforced Polymer Concrete," ACI Structural Journal, September-October 1993.
38- Rostasy, F.S., "Tendons of High-strength Composites-Developments and Chances," Les
Materiaux Nouveaux pour la Precontrainte et la Reinforcement d' ouvrages d' art, Paris, Oct. 1988.
39- Russo, G.; Zingone, G.; and Puleri, G., "Flexure-Shear Interaction Model for Longitudinally
Reinforced Beams," ACI Structural Journal, January-February 1991.
40- Saito; Tsuji; Sekijma; and Ogawa, "Flexural and Shear Behaviour of Concrete Beams Reinforced
with FRP," Proceedings of the Japan Concrete Institute, Vol. 10, No.3, 1988.
41- Sen, R.; Issa, M.; and I yer, S., "F easibility of Fibreglass Pretensioned Piles in a Marine
124

Envirorunent," Final Report, University of South Florida, Jan. 1992.
42- Zsutty, T. C., "Beam Shear Strength Prediction by Analysis of Existing Data," ACI Journal,
November 1968.
125
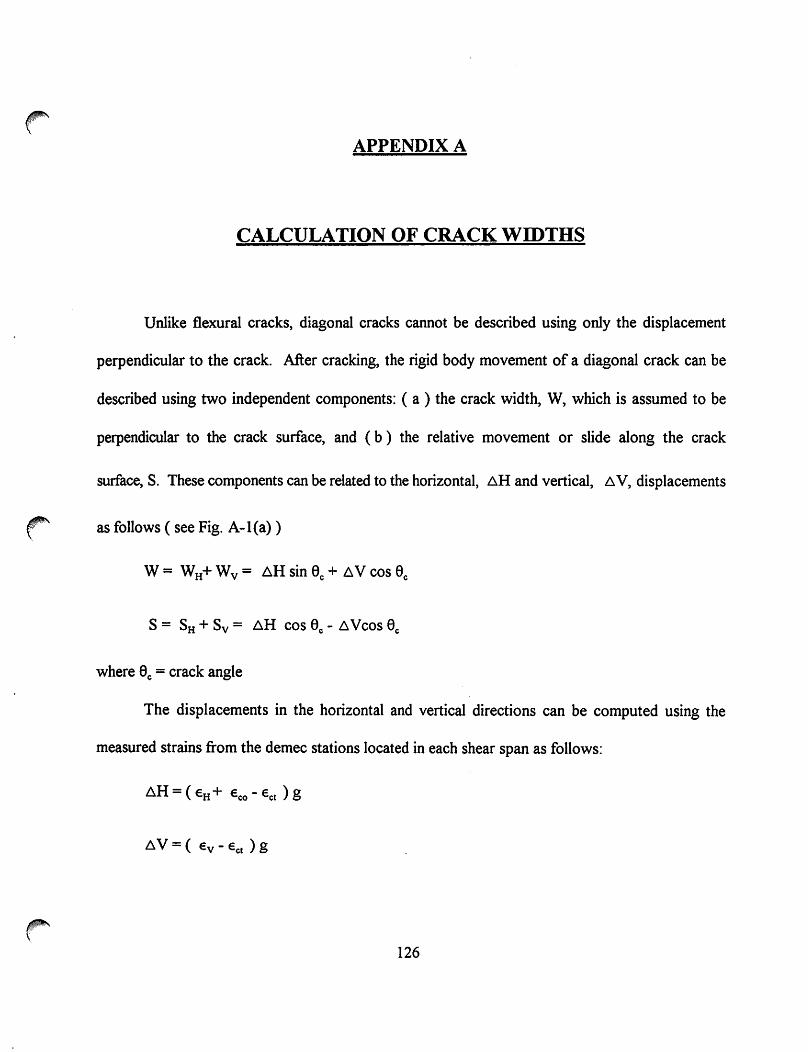
APPENDIX A
CALCULATION OF CRACK WIDTHS
Unlike flexural cracks, diagonal cracks cannot be described using only the displacement
perpendicular to the crack. After cracking, the rigid body movement of a diagonal crack can be
described using two independent components: ( a ) the crack width, W, which is assumed to be
perpendicular to the crack surface, and (b) the relative movement or slide along the crack
surface, S. These components can be related to the horizontal, DoH and vertical, Do V, displacements
r' as follows (see Fig. A-l(a) )
W = WH+ Wv = ~H sin ae + ~ V cos ae
S = SH + Sv = ~H cos ae - Do V cos ae
where ae = crack angle
The displacements in the horizontal and vertical directions can be computed using the
measured strains from the demec stations located in each shear span as follows:
~H = ( EH + Eeo - Eel ) g
Do V = ( €v - Eel ) g
126

where Eco = precompressive strain of concrete due to the prestressing force at the level of the station
being considered ( negative quantity)
Eet = tensile cracking strain of concrete, taken equal to 100 x 10-6
g = gauge length
EH, Ev as previously defined
Note that the diagonal strain measured at an angle of 45 degrees can be related to the vertical
and horizontal strains through the following expression ( see Fig. A-I (b»:
..[2 Eo= EH + Ev
Thus, the crack width and crack slides can also be calculated using either the horizontal or
vertical strain and the strain measured at an angle of 45 degrees. The expressions utilized to compute
the crack widths of the beams tested in this study are given below:
~ ( a ) : Considering demec readings in the horizontal and vertical directions:
WI = g [ ( EH + Eco - Eel) sinee + ( EV - Eet ) COS ee]
( b ) : Considering demec readings in the vertical and diagonal directions:
W2 = g [(.,[2 ED - EV+Eeo- Eet ) sinee + (Ev - Eel) COS ee]
( c ): Considering demec readings in the horizontal and diagonal directions:
W3 = g [ ( EH + Eeo - Eel) sinee + ( .,[2 ED - EH + Eeo - Eel) COS eel
and W = (WI + W2 + W3 ) / 3
Note that since none of the beams in this experimental program were prestressed, Eco was set
to zero in the above equations.
127

la)
Ib)
+
E .( d
Fig. A-I: Relationship between crack width and the demec readings (See Pincheira 1988)
128