Embed Size (px)
Citation preview


Presentation Content
1. Growth Challenges2. Legislative Context3. South Bay Planning 4. Mobility Analysis5. Development Models6. Land Use Analysis7. Economic Analysis8. Next Steps9. Resources
Agenda

1. GROWTH CHALLENGES | South Bay
1

• Traffic Congestion• Limited Transportation Options• High Gas Prices• Aging Infrastructure• Poor Air Quality & Related Health Risks• Underperforming Retail • Unstable Revenue Generation• Changing Demographics (Youth/Senior)• Accommodating Projected Growth• Legislative Compliance (AB 32, SB 375)
Image Source: www.uvm.edu
Challenges?
Image Source: RBF Consulting
Image Source: www.nctimes.com
2
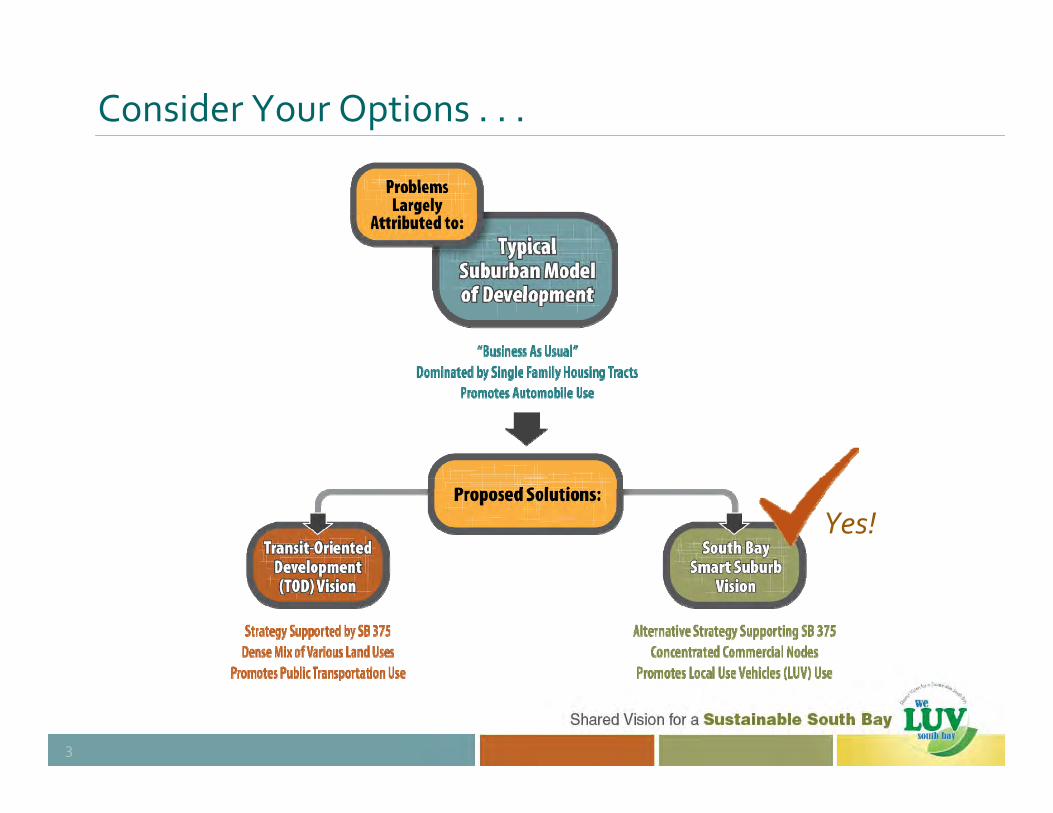
Consider Your Options . . .
3
Yes!

Call To Action!
• Consider Implementing South Bay Smart Suburb Vision
– Land Use Vision (Long‐Term)– Mobility Vision (Near‐Term)
• Consider Implications of Continuing “Business As Usual”
– South Bay Challenges Exacerbated – Growth (Change) is Inevitable– Opportunity to Manage Growth
4
Yes!

2. LEGISLATIVE CONTEXT | California
5

California Legislation
Legislative Mandates to Reduce Greenhouse Gas (GHG) Emissions:
– SB 1771 (Alarcon, 2000): Requires statewide GHG inventory – AB 32 (Nunez, 2006): Reduce GHG emissions to 1990 levels– SB 375 (Steinberg, 2008): Reduce GHGs from passenger vehicles
Image Source: www.smartgirlpolitics.ning.com
6

SB 1771 – Greenhouse Gas Emissions Inventory
• Legislative Requirements– California Energy Commission Required to Update Statewide Inventory of GHG Emissions in January 2002– Inventory Update Required Every 5 Years
• Inventory Used to Develop GHG‐Related Policies by Industry Sector
Image Source: www.thehui.wordpress.com
6‐A

AB 32 – California Global Warming Solutions Act
• Landmark Legislation – Leading the Nation! • First Comprehensive Program in World
– Goal: Reduce GHG Emissions to 1990 Levels by Year 2020
Chart Source: Southern California Association of Governments, 2009
7

AB 32 – Scoping Plan
• Adopted December 2008• Primary Strategies Evaluated to Reduce GHG Emissions
– Electricity & Energy (Renewable)– Transportation (Public Transit)– Cap‐and‐Trade Program– Forestry Protection– Urban Agriculture Programs–Waste & Recycling Incentives
7‐A
Image Source: www.roselawgroup.com

AB 32 – GHG Emissions By Sector
Chart Source: California Air Resources Board Greenhouse Gas Emissions Inventory, November 2007
8
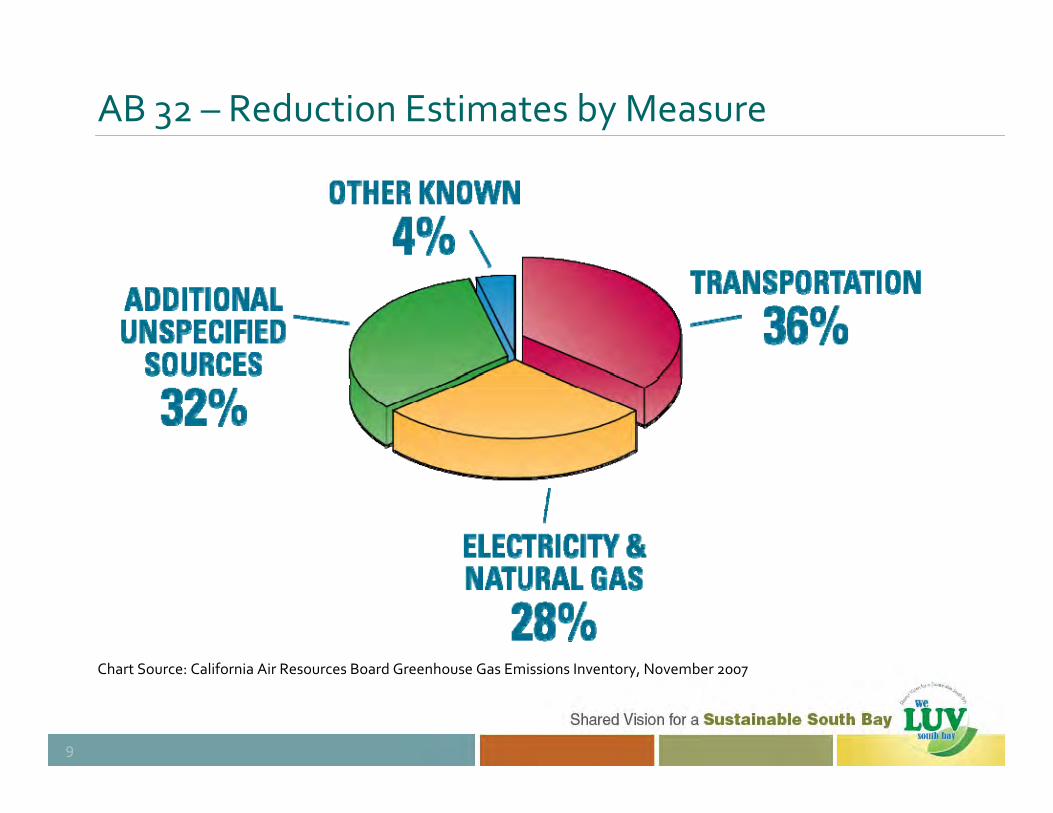
AB 32 – Reduction Estimates by Measure
Chart Source: California Air Resources Board Greenhouse Gas Emissions Inventory, November 2007
9

AB 32 – Reduction Estimates by Measure
Chart Source: California Air Resources Board Greenhouse Gas Emissions Inventory, November 2007
10

SB 375 – Redesigning Communities to Reduce GHGs
• Implementing Legislation of AB 32• Effective January 2009
– Goal: Reduce GHG Emissions from Cars and Light Trucks
• Integration of Related Approaches– Land Use Planning– Transportation Policies– Transportation Investments
Image Source: RBF Photo Library
11

SB 375 – Reduction Targets
DRAFT California Air Resources Board (CARB) GHG Emission Reduction Targets for SCAG Region
– Draft targets as of June 30, 2010– 2005 Baseline Year– 2020 SCAG Goal = 5% to 10% Per Capita– 2035 SCAG Goal = 3% to 12% Per Capita
12

SB 375 – Roles and Responsibilities
CARB (State):– Set GHG Reduction Targets for Years 2020 and 2035– 8‐Year Target Update Cycle
SCAG (MPO):– Develop Regional Sustainable Communities Strategy (SCS)– Include Strategies in Regional Transportation Plan (RTP)
Sub‐Regions (South Bay):– Collaborate w/ SCAG on Regional SCS Development
Image Source: SCAG Regional Transportation Plan, 2008
12‐A

SB 375 – Agency Stakeholders
RTPAs within MPOs
MPO Areas
Non‐MPO Rural RTPA Areas
Los Angeles CountySan Bernardino CountyRiverside CountyImperial CountyOrange CountyVentura County
Metropolitan Planning Organizations (MPO) SCAG Sub‐Regions
12‐B

SB 375 – Process Chart
12‐C
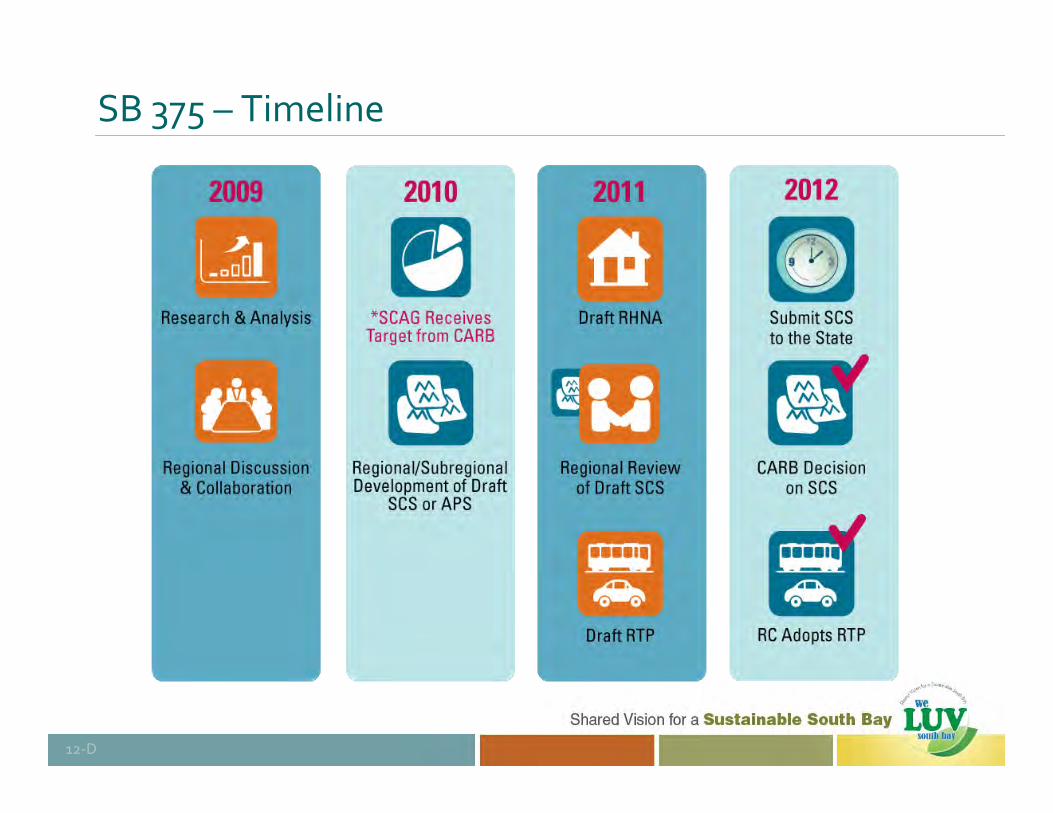
SB 375 – Timeline
12‐D

3. SOUTH BAY PLANNING | Context
13

Images Source: www.commons.wikipedia.org
South Bay Cities
17 Jurisdictions– Beach Cities– Peninsula Cities– Inland Cities
Image Source: South Bay Cities COG
14
Images Source: www.discoverlosangeles.comImages Source: RBF Photo Library

South Bay Planning Context
• Transit Poor Sub‐Region• Highly Congested Streets• Dominant Street Grid • Dense, Low‐Rise Residential• Aging, Underperforming Corridor Commercial Uses• Abundant Single‐Function Centers
15
Images Source: RBF Consulting

• Accommodate Projected Growth – Help Cities Meet RHNA– Jobs/Housing Balance
• Provide Robust Mobility Alternatives– Reduced Fossil Fuel Reliance– Reduced Reliance on Transit Subsidies
• Relieve Traffic Congestion– Improved Air Quality
• Provide Vibrant Retail Centers – Concentrated Neighborhood‐Serving Retail
• Reduce Stress on Aging Infrastructure– Focused Investment
• Strengthen City Revenues
South Bay Cities COG Objectives
16
Images Source: www.graphicreflections.org

Sustainable South Bay Strategy (SSBS)
• 5‐Year Research Study– Land Use Vision: Distributed Commercial Concentrations– Mobility Vision: Short‐Range Circulation Mode
• Baseline Strategy for Inclusion in SCAG Sustainable Communities Strategy (SCS)• Local Use Vehicle (LUV) Pilot Program
17

4. MOBILITY ANALYSIS | South Bay
37

Complete Streets Legislation
Assembly Bill 1358 (2008) requires balanced circulation element accounting for “all users”
– Goal: Replace auto with bike, foot, or bus– Including motorists, pedestrians, bicyclists,children, persons with disabilities, seniors,movers of commercial goods, and transit users– Adaptation per circumstances expected– Act does not specifically highlightNEVs or Segways– Cities Must Integrate byJanuary 1, 2011
38
Images Source: RBF Consulting

South Bay Mobility Vision (SSBS)
Multi‐Layered, Multi‐Modal Strategy– Customized to match South Bay;– 50% of retail trips within 3‐4 mile range– Carbon footprint reduced by replacing2nd & 3rd cars to Local Use Vehicles (LUVs)
• Walking• Segways;• Neighborhood Electric Vehicles;• Electric Bicycles/Scooters, etc.
– Electric, efficient LUVs serve short distance trips, minimize transport costs, parking space requirements, & use current infrastructure.
39
Images Source: RBF Consulting

Mobility Policy Considerations
• Consider safety, right‐of‐way, and legal constraints• Select pilot program and complimentary land uses• Designate specific network using preliminary COG maps• Consider interface with other modes (bikes, peds, cars)• Determine adaptation in development project (preferred parking, incentives, charging stations, etc.)• Seek local, state, and federal funding support
– Sustainability– Air Quality– Transportation
39‐A

Mobility – Appropriate Transportation Modes
0 –½MileWalking
45‐B
0 – 5 MilesLocal Use Vehicle (LUV):
NEV, Segway, EN‐V, Bikes
≥ 5 MilesLong‐Range Vehicle:Auto, BRT or Subway

Mobility Analysis – LUV Pilot Program
Early Lessons Learned– 8 NEVs in use– Average month (early in program) results [INSERT JUNE; AVG DATA]:
•Average of 68 cold starts eliminated• Average of 180 Vehicle Miles Traveled (VMT) replaced with NEV trips• Approximately 70% of trips within 2 mile radius
– Positive feedback among various demographic groups (families, singles, empty‐nesters)
40
Image Source: RBF Consulting
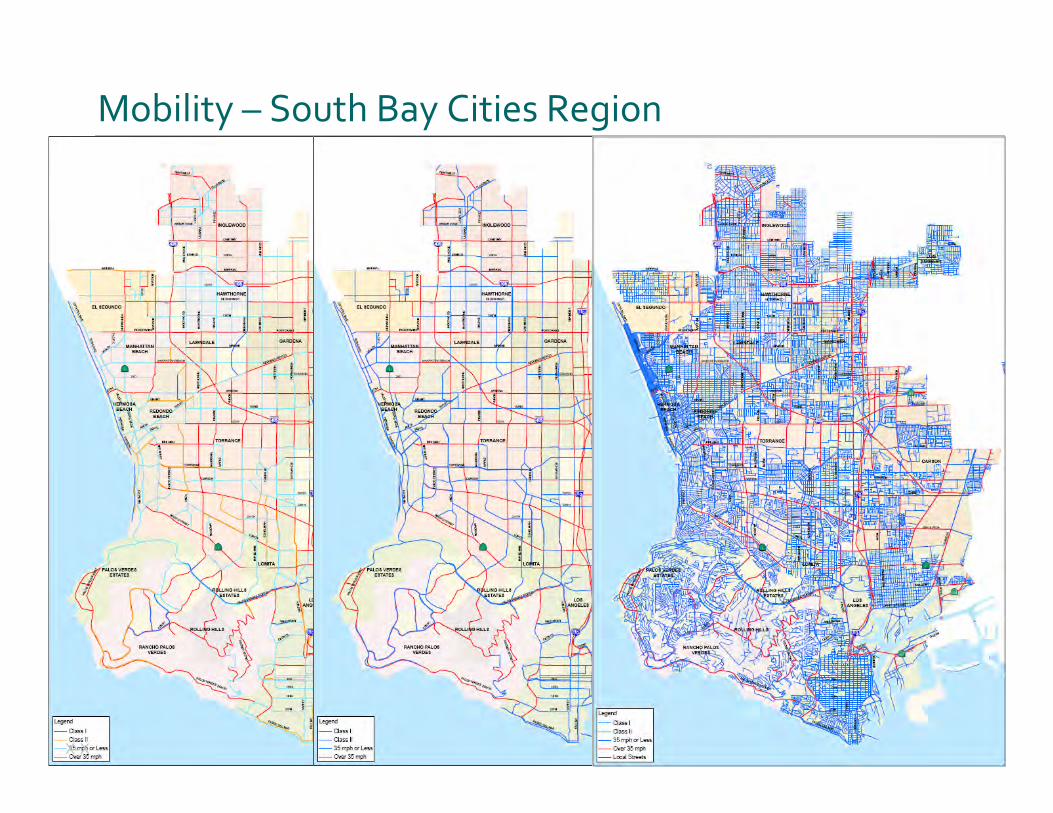
Mobility – South Bay Cities Region
X‐X

Mobility – Local Use Vehicle (LUV) Network
Analysis of Existing Infrastructure/Documents– Includes Certain Bike Lanes:
• Class I Trails (Off‐Street trails)• Class II Lanes (On‐Street lane/shoulder)
– Doesn’t include Class III Lanes(Signed without right‐of‐way)– Includes low‐speed roads– Review based on:
• MTA Bicycle Network Map• South Bay Cities COG Speed Maps
41‐A
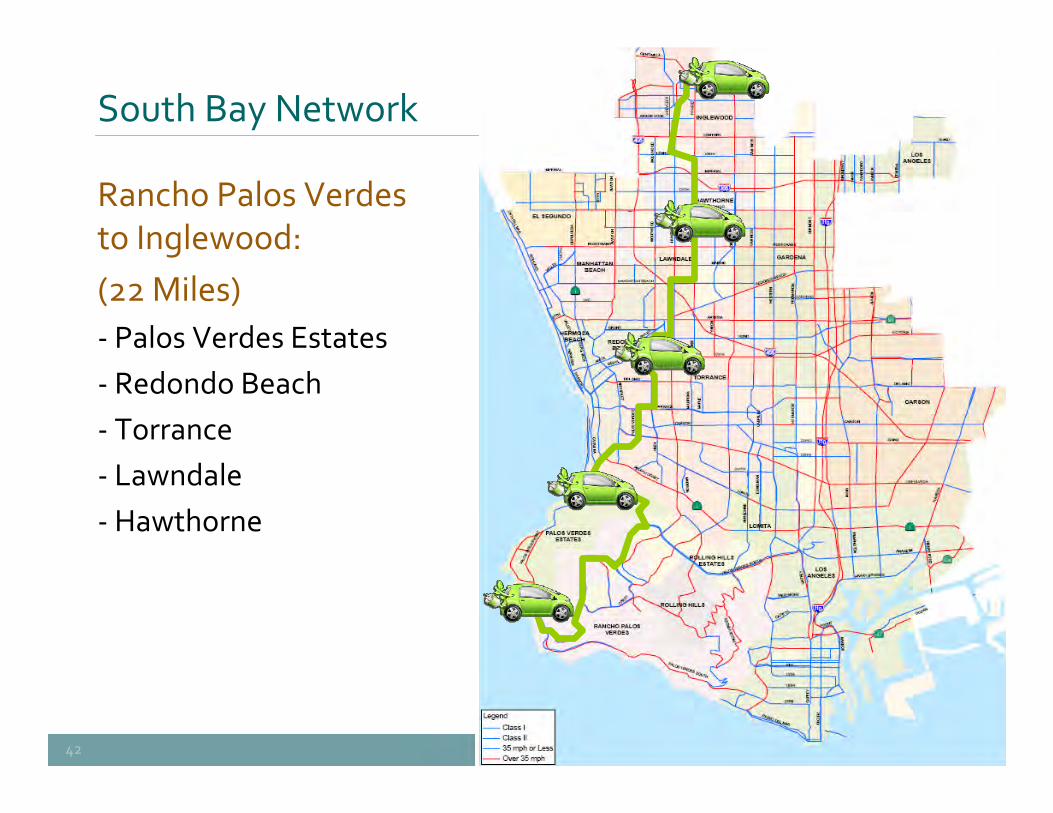
South Bay Network
42
Rancho Palos Verdes to Inglewood:(22 Miles)‐ Palos Verdes Estates‐ Redondo Beach‐ Torrance‐ Lawndale‐Hawthorne

South Bay Network
43
El Segundo to Carson:(13 Miles)‐Manhattan Beach‐ Lawndale‐Hawthorne‐ Torrance‐Gardena‐ Los Angeles

South Bay Network
44
Los Angeles (North End) to Ports Area:(23 Miles)‐Gardena‐ Carson‐ Torrance‐ Lomita

Mobility Case Study Findings
• Consider policies to support alternative mode use (NEVs, Segways, etc.) by resident and commercial populations• Adapt public infrastructure to support alternative modes•Work with private sector to create feasible business‐models for alternative transport• Support policies to incentivize private sector investment in transit‐like programs such as Jitney• Support land use development that strengthens nodes where served by existing transit and shuttle service. • Better link existing DASH‐like service
45

Mobility Review – Options Considered
Topics Reviewed– Operational Characteristics– Where Deployed– Cost of Use– Applicable Legislation– Public Infrastructure Required– Opportunities/Constraints to Commonplace Use– Applicability to South Bay Cities
45‐A
Images Source: RBF Consulting

Mobility Review – Selected LUV Case Studies
• Neighborhood Electric Vehicle (NEV)• Segway• Demand Responsive Transit (DRT)• Neighborhood Shuttle• Jitney (Shared Taxi/Shuttle)• Car Reservation System
45‐B
Images Source: RBF Consulting

Mobility Case Study No. 1
Neighborhood Electric Vehicle (NEV)– Low Speed Vehicle Serving Community or Citywide Needs (1 to 4 passengers)– Purchase/Operation Similar to Passenger Car
• $7,000 to $15,000 Purchase• $0.15 to $0.20/kWh• 0.233 kWh/mile• 40 Mile Range (equivalent to 150 mpg)
– No Direct Tailpipe Emissions– NEV Trails System Needed (Can Adapt to Bike Trail System)– Citywide Program/Legislation Required– Door‐to‐Door, On‐Demand Mode– Applicable to Replacing 2nd or 3rd Car– Pilot Program Underway
45‐C
Images Source: RBF Consulting

Mobility Case Study No. 2
Segway– Self‐Balancing Two‐Wheel Scooter (1 passenger)
• Ex: Security Patrol, City Tours– Electric, Low Speed, Short Range
• $5,000 to $7,000 Purchase• $0.15 to $0.20/kWh• 0.052 kWh/mile (5x NEV efficiency)• 16 to 24 Mile Range (equivalent to 250 mpg)
– No Direct Air Emissions – Legislated Statewide; Streets/ Sidewalk Debate Managed Locally
• Ex: San Francisco Prohibits Sidewalk Use– Flexible Lower Cost NEV Option, Learning Curve and Safety Concerns– Applicability for Individual User on Short Trip
45‐D
Images Source: RBF Consulting

Mobility Case Study No. 3
Demand Responsive Transit (DRT)– Agency‐Funded Taxi Service Serving Mobility‐Limited Persons (Ex: Elderly, Disabled)
• Ex: Carson Circuit DRT, Beach Cities WAVE– Flexible Route, Flexible Schedule– Minimal Costs to User
• $1 to $5 Round Trip (Torrance Transit)• Limited to City Region• Typically 1 to 2 Passengers
– Alternative Fuels Can Limit Air Emissions– Minimal Legislation/Infrastructure Needed– High Cost/Trip ($24 DRT vs. $3 Bus)– Subsidized Funding Required– High Cost Competes with Jitney– Low Applicability to South Bay
45‐E

Mobility Case Study No. 4
Neighborhood Shuttle– High Frequency Agency‐Funded Circulator Shuttle Serving Dynamic Users
• Ex: Over 50 South Bay Routes, Lawndale Beat, Carson Circuit, Torrance Transit
– Fixed Route, Fixed Schedule– Highlight Key Operational Information
• Subsidized Low User Costs ($0.25)• Limited to City or Region• 1 to 40 Passengers
– Alternative Fuels Can Limit Air Emissions– Minimal Legislation/Infrastructure Needed– Neighborhood Strengthening, Circuitous Route and Funding is Agency‐Dependent– More Applicability with Land Use Intensification
45‐F

Mobility Case Study No. 5
Jitney (Shared Taxi/Shuttle)– Public/Privately Funded Shared Taxi/Shuttle
• Ex: Fly‐A‐Way, SuperShuttle Service to Airport, Concert, Special Events, Casinos
– Flexible Route, Flexible Schedule– Typical Taxi/Shuttle Operations
• Pay‐As‐You‐Go• Limited to City or Region• 1 to 40 Passengers
– Alternative Fuels Can Limit Air Emissions– Minimal Legislation/Infrastructure Needed– Limited to Destination Activities– Competition from Publicly Subsidized DRT
45‐G

Mobility Case Study No. 6
Car Reservation System– Pay‐As‐You‐Go Access to Shared Car
• Ex: ZipCar, Hertz Connect– User‐Defined Route and Schedule– Typical Passenger Car Operations
• $1,000 Initial Cost and $5 Hourly Fee• 300 Miles Per Tank of Gasoline• Typically 1 to 4 Passengers
– Alternative Fuels Can Limit Air Emissions; Higher Trip Chaining Means Reduced VMT– 1 Shared Car Removes 10 to 15 Personal Cars– Minimal Legislation/Infrastructure Needed– Limited Deployment (Downtowns, Schools)– High Applicability with Established Rental Network
45‐H

5. DEVELOPMENT MODELS | Concepts
18

Street Grid Spatial Structure
19
• 4 Miles Square• 25 Natural Walking Neighborhoods within ½Mile of Intersections• Street Grid Relatable to South Bay Cities

Typical Suburban Model
• Auto‐Centric Development Pattern• Dominated by Single‐Family Housing Tracts and Retail/Commercial Uses Located Along Corridors• Surface Parking in Large Concentrations at Street Edge
Images Source: RBF Photo Library
20‐A

20
• Street Grid Pattern
Typical Suburban Model

20
• Street Grid Pattern• SFR Tracts Develop
Typical Suburban Model

20
• Street Grid Pattern• SFR Tracts Develop• Development Continues
– Civic/Institutional– Parks/Open Space– Commercial Centers (Employment, Retail)
Typical Suburban Model

20
• Street Grid Pattern• SFR Tracts Develop• Development Continues• Commercial Corridors Develop:
– Major Arterials– Retail Corridors Connecting All Uses– Auto Dominant
Typical Suburban Model

20
• Street Grid Pattern• SFR Tracts Develop• Development Continues• Commercial Corridors Develop• SFR Tracts Continue
– Further Outside Core
Typical Suburban Model

20
• Street Grid Pattern• SFR Tracts Develop• Development Continues• Commercial Corridors Develop• SFR Tracts Develop Further Outside Core • Commercial Corridors Extend to Accommodate Development
Typical Suburban Model

20
• Few Concentrations of Compact Mix of Uses, Walkable Neighborhods• Aging and Under‐performing Commercial Corridors• Competing Public and Private Investment Due to Multiple Commercial Corridors
Typical Suburban Model

21
• Assumes No Change to Typical Suburban Format
Transit‐Oriented Development (TOD) Model

Transit‐Oriented Development (TOD) Model
• Model Supported by SB 375 • Densification• Uses Centered Around Public Transportation Hubs
Images Source: RBF Photo Library
21‐A

21
• Assumes No Change to Typical Suburban Format• Addition of TOD Corridor Development Only• Investment Now Focused Around Singular Corridor• Few Concentrations of Compact Mix of Uses, Walkable Neighborhoods• Aging and Under‐performing Commercial Corridors Remain
Transit‐Oriented Development (TOD) Model

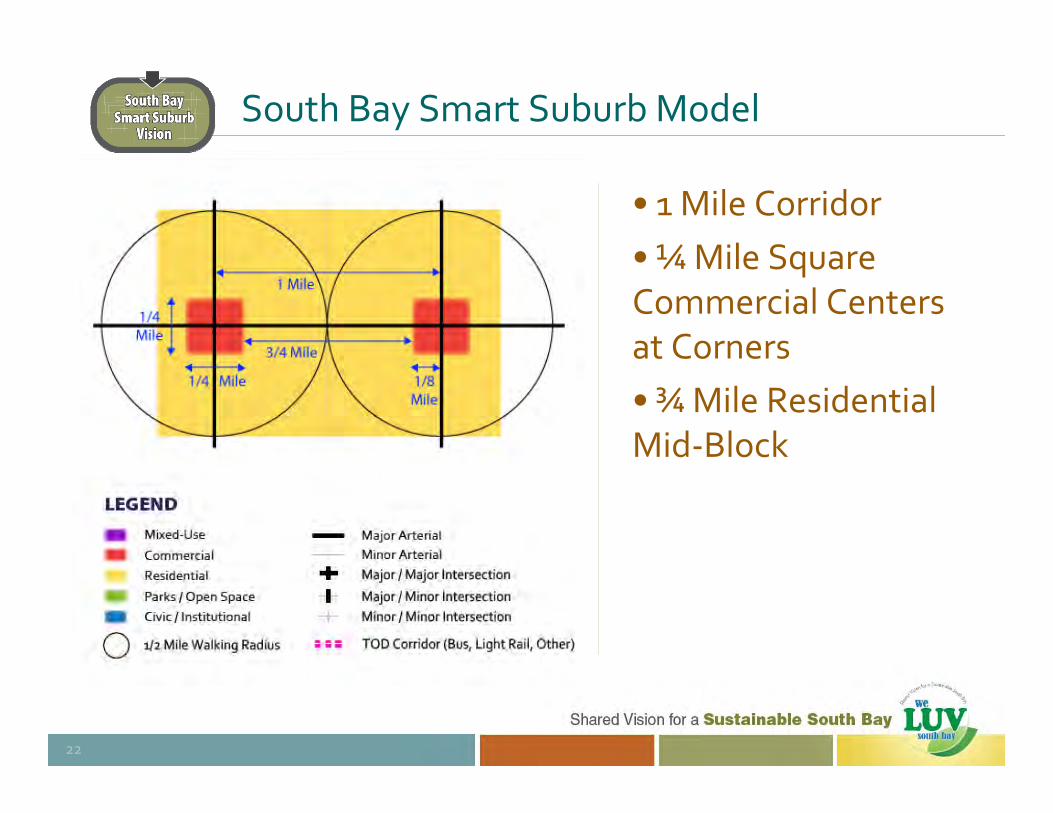
South Bay Smart Suburb Model
• Transition of Mid‐Block Strip Commercial to Residential• Intensified Commercial at Corners of Major Arterials• Street‐Fronting Buildings with Parking at Rear
Image Source: www.ci.gardena.ca.us
22‐A
Image Source: RBF Consulting
South Bay Smart Suburb Model
22
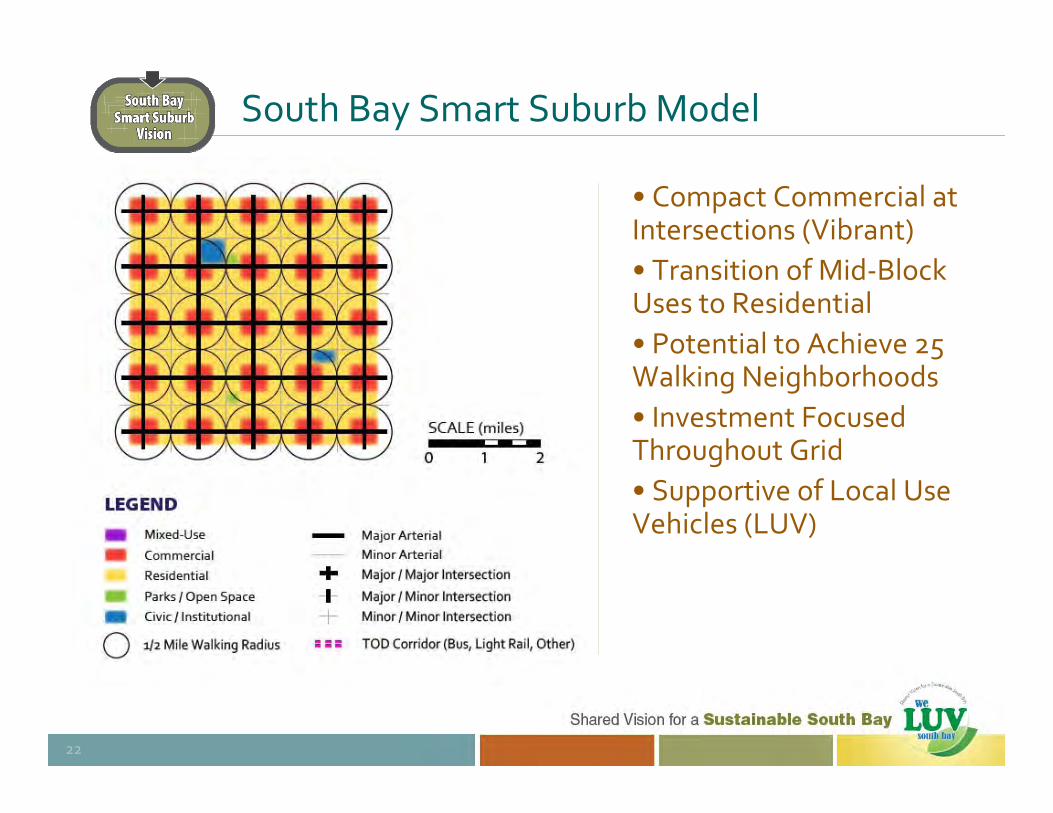
• Compact Commercial at Intersections (Vibrant)• Transition of Mid‐Block Uses to Residential • Potential to Achieve 25 Walking Neighborhoods• Investment Focused Throughout Grid• Supportive of Local Use Vehicles (LUV)
South Bay Smart Suburb Model
22
• 1 Mile Corridor• ¼Mile Square Commercial Centers at Corners• ¾Mile Residential Mid‐Block

South Bay Smart Suburb Model
22
Development Potential– Proposed Corner Commercial (1/4 Mile Square = 40 Acres)
• Combined Corners Accommodate:– 870,000 SF (One Story) – 1.75 Million SF (Two Stories)
• Assumes 50% Lot Coverage
– Existing Mid‐Block Commercial (3/4 Mile = 24 Acres)• Approximately 366,000 SF (One Story)
– Proposed Mid‐Block Residential (3/4 Mile = 24 Acres)• Approximately 785 DUs (32 DUs/Acre)• Assumes 50% Lot Coverage (Two Stories)
6. LAND USE ANALYSIS | South Bay
23
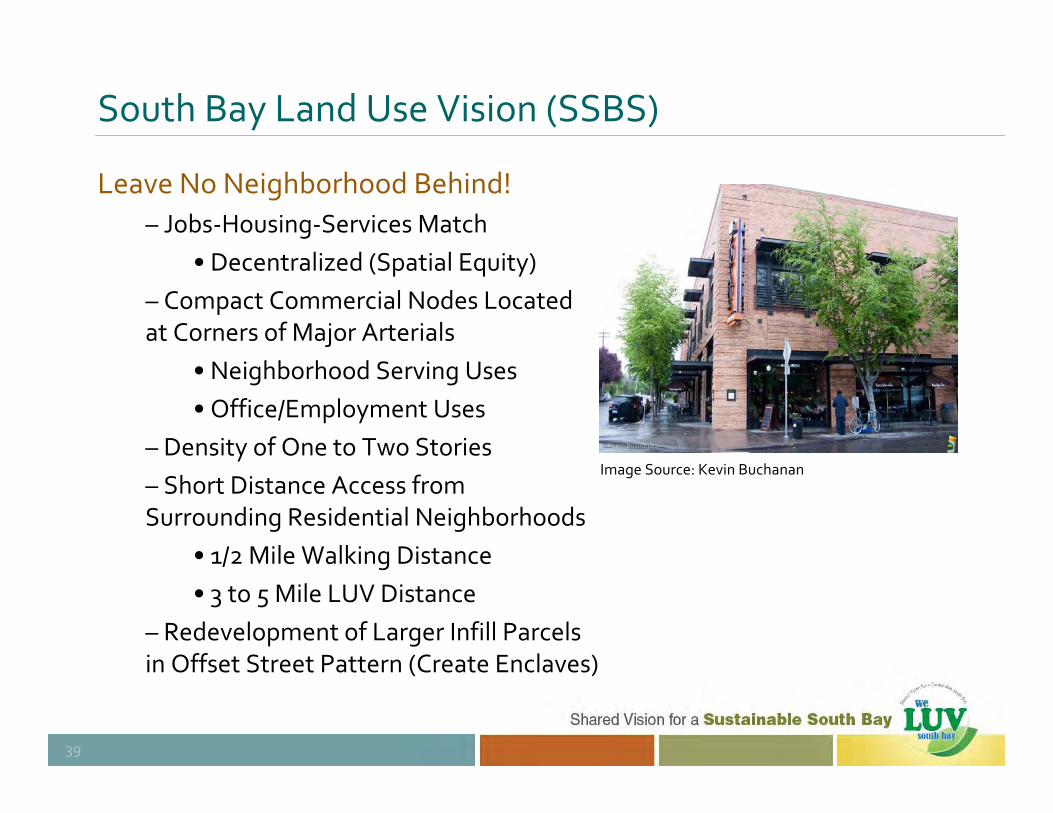
South Bay Land Use Vision (SSBS)
Leave No Neighborhood Behind!– Jobs‐Housing‐Services Match
• Decentralized (Spatial Equity)– Compact Commercial Nodes Located at Corners of Major Arterials
• Neighborhood Serving Uses• Office/Employment Uses
– Density of One to Two Stories – Short Distance Access from Surrounding Residential Neighborhoods
• 1/2 Mile Walking Distance• 3 to 5 Mile LUV Distance
– Redevelopment of Larger Infill Parcels in Offset Street Pattern (Create Enclaves)
39
Image Source: Kevin Buchanan

Land Use Findings
• South Bay Smart Suburb Model Tailored to Region
– Meets Intent of SB 375– Resolves Many South Bay Challenges
• South Bay Region Needs Sub‐Regional Planning Guidance SB 375: Regional SCS Development
– Corner Commercial and Corridor Planning is Multi‐Jurisdictional
• Land Use Vision Most Effective When Adopted by South Bay Cities
24
Yes!

Case Study Findings
• Policy Plans Most Effective Means of Implementing Smart Suburb Model
– General Plan Land Use Element– Specific Plans (Corridor)
• Retail Tenants Adjusting to More Urban Commercial Format
– Concerns about Site Access and Parking at Rear– Street Fronting Retail Needs to Provide Pedestrian Access from Sidewalk
• Sensitivities Exist Regarding Residential Parking Requirement Reductions
– Affordable Unit Owner/Renters Indifferent– Market Rate Unit Owners Opposed
25
Images Source: RBF Consulting

Land Use Case Studies
• Six (6) Detailed Case Studies– (4) Mid‐Block Commercial Transitioned to Residential
• Low to Moderate Density
– (2) Intensified Commercial at Corners of Major Arterials• Parking Located at Rear or On‐Street
• Examples of Smart Suburb Model of Development Difficult to Find in South Bay
– Development Has Occurred in Typical Suburban Fashion– Searched Other Counties: Orange County, Los Angeles– Commercial Search Modeled After Lomita Example– Residential Search Modeled After Redondo Beach Example
26

2008 Pictometry Image
Commercial Example: Lomita (Lomita Avenue & Narbonne Avenue)
27

Land Use Case Studies
Selected Case Studies (In‐Depth Review)– No. 1: Torrance, Artesia and Crenshaw– No. 2: Redondo Beach, Pacific Coast Highway and Francisca– No. 3: Anaheim, Brookhurst and Gilbert– No. 4: Anaheim, Anaheim and Santa Ana– No. 5: Glendora, Grand and Alosta
27‐A

2002 Pictometry Image 2008 Pictometry Image
Land Use Case Study No. 1 – Corner Commercial
Torrance (Artesia and Crenshaw)
27‐B

Land Use Case Study No. 1
Western Plaza – 0.63 Acre– Previous Use: Gas Station (600 SF)– New Uses: Intensified Commercial (9,350 SF)
• Street‐Fronting Retail: Wachovia Bank, T‐Mobile– Parking: 56 On‐Site Spaces at Rear of Property– Zoning: General Commercial (Since 1960s) – Project Approved and Permits Pulled in 2006– Project Complete in 2008– No City or RDA Subsidy – 2009 Land Value = $4.7 Million
27‐C

Land Use Case Study No. 2 – Mid‐Block Residential
Redondo Beach (Pacific Coast Highway and Francisca)
1994 Google Earth Image 2008 Google Earth Image
27‐D

Land Use Case Study No. 2
Seasons Senior Living Apartments– 4.18 Acres– Previous Use: Elementary School (26,000 SF)– New Use: Intensified Residential (56,000 SF Lot Coverage)
• 150 Units (35.8 DUs/Acre) • 20% Set‐Aside for Very Low Income Senior Citizens
– Density Bonus of 10 DU/Acre for Affordable Senior Units– Parking:
• 150 Spaces and 25 Visitor On‐Site; On‐Street Permitted• Approved 1 Space/DU versus 2 Spaces/DU Typically Required
27‐E

Land Use Case Study No. 2
Seasons Senior Living Apartments– Zoning:
• West Half Property: High‐Density MFR (28 DU/Acre) • East Half Property: Low Density MFR (17.5 DU/Acre)• General Plan: Permits Up to 52 DU/Acre for Affordable Senior Project Approved
– Project Approved in 1994– Project Complete in 1996– Redondo Beach Redevelopment Agency Financing
• Issuance of Tax‐Exempt Bonds Secured by Project Rents• 20% Guarantee of Bond Payments • $2 Million Loan from Housing Set‐Aside Funds
27‐F

Land Use Case Study No. 3 – Mid‐Block Residential
Anaheim (Brookhurst and Gilbert)
2003 Pictometry Image 2008 Pictometry Image
27‐G

Land Use Case Study No. 3
Cantada Square – 9 Acres– Previous Use: Target Shopping Center (89,700 SF)– New Uses: Multi‐Family Residential
• 82 SFR Court Homes (9.1 DU/Acre)• 1,750 to 2,650 SF Each• 41 Units Affordable Units (Low/Moderate)
– Parking: 2‐Car Garage/Unit and 108 Dedicated On‐Street Parking–West Anaheim Commercial Corridors Redevelopment Project Area– Zoning:
• Previous: Commercial Limited; Brookhurst Corridor Overlay Zone• Current: Multiple‐Family Residential Zone (Allows Up to 18 DU/Acre)
27‐H

Land Use Case Study No. 3
Cantada Square – Incentives:
• Developer Did Not Accept Waivers of Setback, Height, Building Separation and Minimum Landscaping Requirements• Developer Accepted Streamlined Entitlement Processing
– Pre‐Project Land Value = $10.2 Million– City or RDA Subsidy
• $5.75 Million Land Write‐Down• $1.02 Million Down Payment Assistance• No Tax Increment Financing• 2010 Unit “For Sale” Price = $300,000 to $600,000
– Project Approved in 2003– Project Complete in 2004– Site Previously Reserved for Anaheim Home Depot in 2001
27‐I
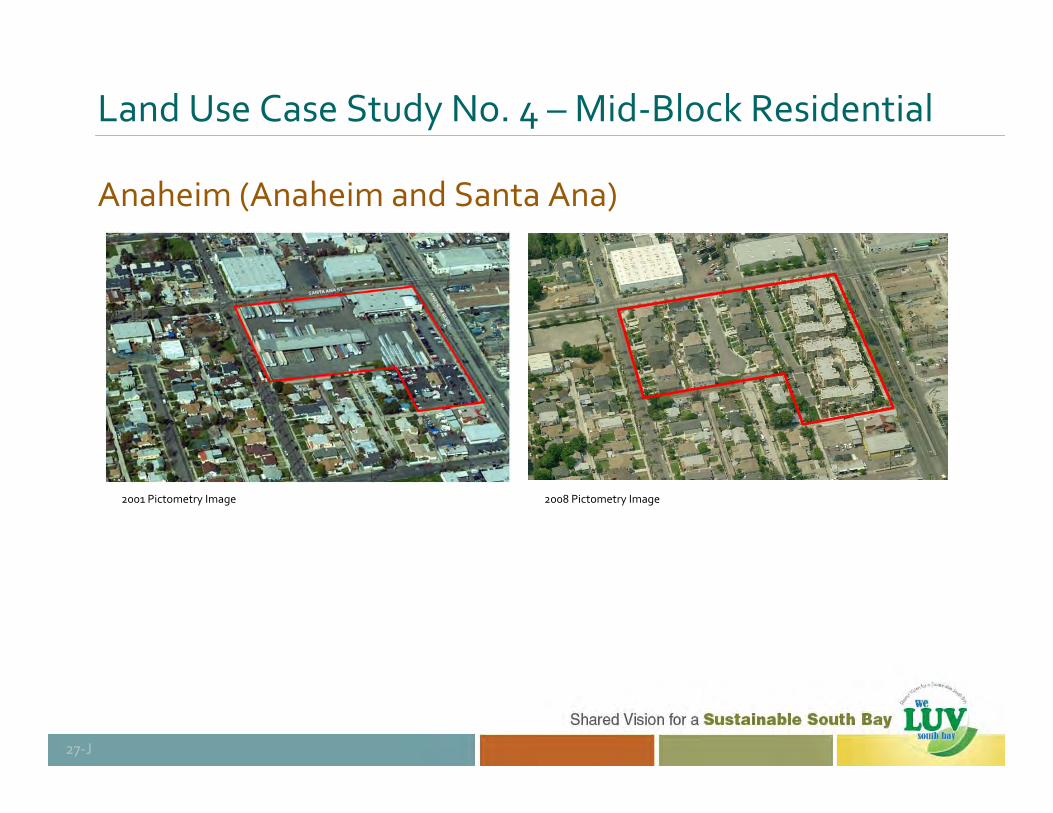
Land Use Case Study No. 4 – Mid‐Block Residential
Anaheim (Anaheim and Santa Ana)
2001 Pictometry Image 2008 Pictometry Image
27‐J

Land Use Case Study No. 4 – Mid‐Block Residential
Cantada Square – 5.3 Acres– Previous Use: Industrial Distribution Center– New Uses: Single‐ and Multi‐Family Residential
• XX SFR Court Homes (9.1 DU/Acre)• 1,750 to 2,650 SF Each• 41 Units Affordable Units (Low/Moderate)
– Parking: 2‐Car Garage/Unit and 108 Dedicated On‐Street Parking–West Anaheim Commercial Corridors Redevelopment Project Area– Zoning:
• Previous: Commercial Limited; Brookhurst Corridor Overlay Zone• Current: Multiple‐Family Residential Zone (Allows Up to 18 DU/Acre)
27‐K

GOAL 3.1Pursue land uses along major corridors that enhance City’s image and stimulate appropriate development at strategic locations.
Policies:• Designate existing underutilized mid‐block commercial uses for residential development
• Concentrate commercial uses at key intersections.
Corridor Residential (0‐13.0 DUs/Acre)
Anaheim – 2004 General Plan Update
27‐K

27‐L
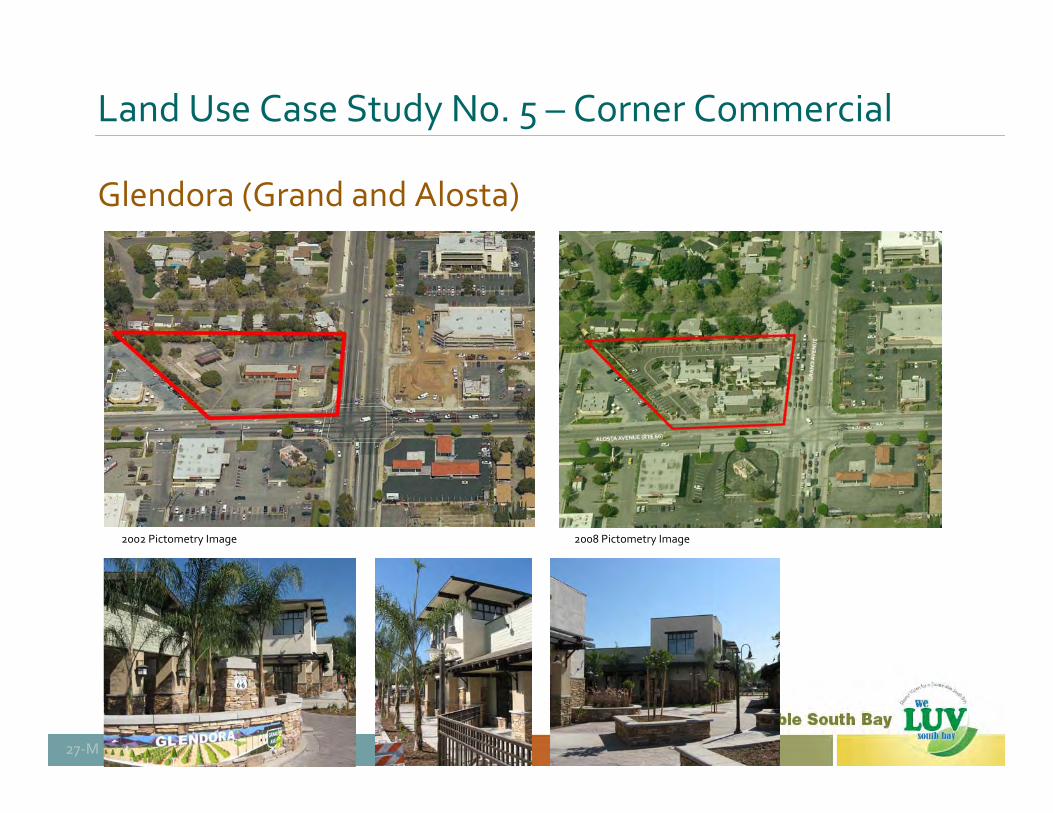
Land Use Case Study No. 5 – Corner Commercial
Glendora (Grand and Alosta)
2002 Pictometry Image 2008 Pictometry Image
27‐M
Land Use Case Study No. 5 – Corner Commercial
Route 66 Plaza– 1.67 Acres– Previous Use: Gas Service Station (5,950 SF)– New Uses: Intensified Commercial (18,500 SF)
• Mix of Uses: Bank, Dentist, Jamba Juice, Other Retail• 1 and 2 Stories Fronting Street
– Parking: 96 Spaces On‐Site at Rear and Side of Property– Route 66 Specific Plan: Redevelopment Project Area No. 3– Grand Avenue Mixed‐Use Overlay; Grand Avenue Gateway (GRG)– Zoning:
• Previous: Commercial Limited; Brookhurst Corridor Overlay Zone• Current: Multiple‐Family Residential Zone (Allows Up to 18 DU/Acre)
27‐N
Land Use Case Study No. 5 – Corner Commercial
Route 66 Plaza– Incentives:
• 10% Parking Reduction (City Wanted to Issue More Reduction, but Developer Concerned with Tenant Expectations)• Streamlined Specific Plan EIR Processing
– No City or RDA Subsidy– Specific Plan Approved in 2003– Project Complete in 2007– Challenges with Retaining Tenants due to Market; Project in Mixed‐Use Area, but Surrounding Density Not Conducive to Locally‐Serving, Walkable Retail
27‐O

Land Use Case Study No. 6
Fresh & Easy Neighborhood Market– Tesco: United Kingdom Based Grocery Chain– First Store Completed in 2007– 135 Stores Built To‐Date (CA, AZ, NV) – Average Store Size: 10,000 to 15,000 SF– 2 to 3 Mile Customer Market– 50% Employees Located within 3 Miles– Urban and Suburban Retail Floor Plate
• Urban Ex: South Los Angeles; San Francisco– Prefer “Green” Building Locations– Donates $1,000 to Local Organization of Choice for Every New Store – 60% of Produce is Locally Source Images Source: www.gabreport.com
27‐P

7. ECONOMIC ANALYSIS | South Bay
28

Hypothetical Development Scenarios
Cities of Lawndale and Hawthorne
Image Source: Eagle Aerial Imagery, 2009
30
Haw
thorne Blvd
Marine Avenue
Prairie Ave
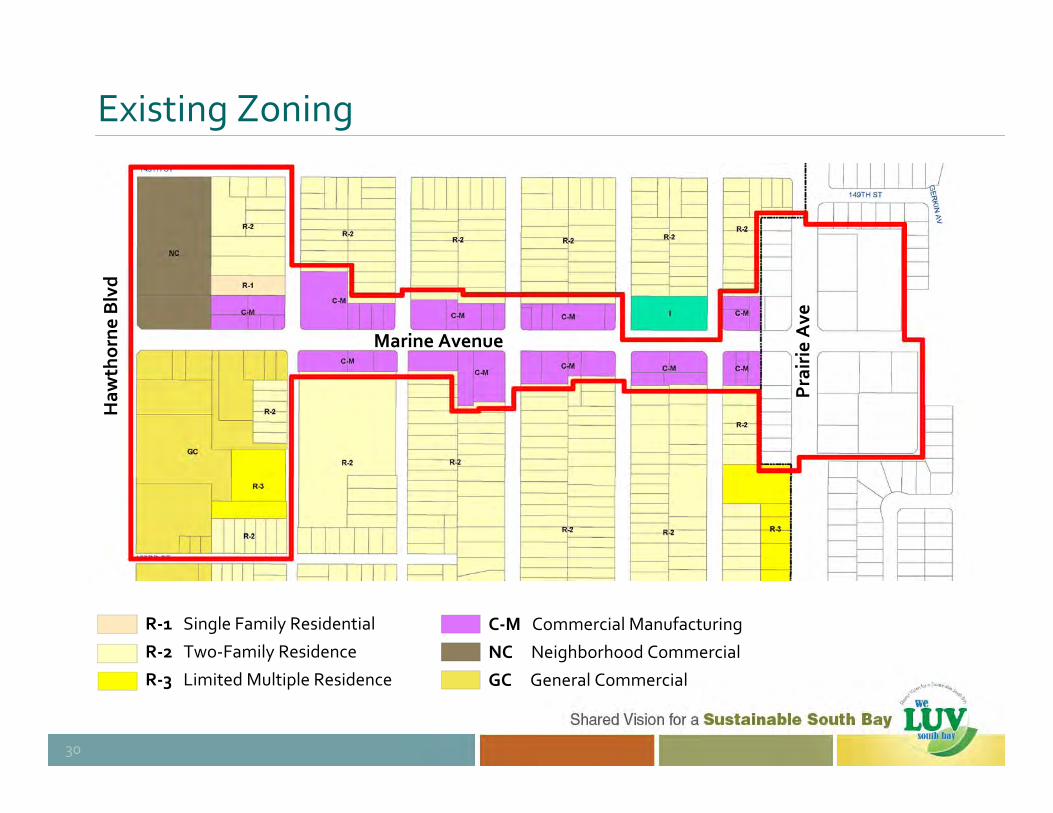
Existing Zoning
30
C‐M Commercial Manufacturing
NC Neighborhood Commercial
GC General Commercial
R‐1 Single Family Residential
R‐2 Two‐Family Residence
R‐3 Limited Multiple Residence
Haw
thorne Blvd
Prairie Ave
Marine Avenue

Candidate Areas (Land Assembly)
31
Total = 109 Parcels | 35 Acres

Inventory of Existing Uses
• Corner Uses– Neighborhood Serving Retail (Eateries, Specialty)– Hotel / Motel– Fast Food (Drive‐Thru)– Larger Format Retailers
• Mid‐Block Uses– Automotive Repair and Maintenance Shops– Small Offices (Vacant)– Thrift Store
Images Source: RBF Site Survey
32

Existing Development Pattern
31
Commercial Uses
Residential Uses

Proposed Smart Suburb Development Pattern
31

Scenario One – Entire Corridor
Analyze Net Change in Revenue Generation:
– Sales Tax: Intensified Corner Commercial– Revenue Tax: Transition of Mid‐Block Commercial to Residential
33

Scenario One – “Before” and “After”
34

Scenario Two – Corner Commercial
Pro Forma Analysis– Intensification of Commercial SF– No Residential– Reconfigured Site:
• Street Fronting Uses• Parking at Rear
33

Scenario Two – “Before” and “After”
34

Scenario Three – Mid‐Block Residential
Pro Forma Analysis– Parcel = 0.9 Acres– Lot Coverage = 22% – Two (2) Story Model– Total Units = 18 DUs– Average Unit Size = 850 SF– Three (3) Parking Scenarios:
• 1 Space/Unit• 1.5 Spaces/Unit• 2 Spaces/Unit
33

Scenario Three – Mid‐Block Residential
33
Pro Forma Analysis– Parcel = 0.8 Acres– Lot Coverage = 24% – Three (3) Story Model– Total Units = 23 DUs– Average Unit Size = 1,000 SF– Three (3) Parking Scenarios:
• 1 Space/Unit• 1.5 Spaces/Unit• 2 Spaces/Unit

Scenario Three – “Before” and “After”
34

8. NEXT STEPS | Summary
46

Next Steps
• South Bay Cities Council of Governments – Consider Formal Adoption of Shared Vision for a Sustainable South Bay Strategy– Presentations of Strategy to Individual Member Agencies
• City Councils• Planning Commissions
– Monthly Livable Communities Working Group (LCWG) Updates– Request SCAG to Integrate Strategy in Regional Sustainable Communities Strategy (SCS) Required by SB 375
• South Bay Jurisdictions– Pursue Planning Grants that Support Shared Strategy– Consider Integration of Strategy in Key Planning Documents
47

9. RESOURCES | Additional Information
48

Resources
• Sustainable South Bay Strategy, July 2009 www.southbaycities.org
• California’s Climate Change Portalwww.climatechange.ca.gov
• California Air Resources Board (CARB)www.arb.ca.gov
• California Greenhouse Gas Emissions Inventorywww.arb.ca.gov/cc/inventory/inventory.htm
49

Acknowledgements
This is a project of the South Bay Cities Council of Governments with funding provided by the Southern California Association of Governments’ (SCAG) Compass Blueprint Demonstration Project Program. Compass Blueprint assists Southern California cities and other organizations in evaluating planning options and stimulating development consistent with the region’s goals.
The preparation of this report was funded in part through grants from the United States Department of Transportation (USDOT)—Federal Highway Administration and Federal Transit Administration, in accordance with the Metropolitan Planning Program, Section 104(f) of Title 23 of the U.S. Code. Additional assistance was provided by the State of California Business, Transportation and Housing Agency through a California Regional Blueprint Planning Grant.
The contents of this report reflect the views of the author who is responsible for the facts and accuracy of the data presented herein. The contents do not necessarily reflect the official views or policies of SCAG, USDOT or the State of California. This report does not constitute a standard, specification or regulation. SCAG shall not be responsible for the future use or adaptation of the report.
2009 Grant Funded Demonstration Project
50

QUESTIONS OR COMMENTS?
Wally Siembab, Special Projects ManagerSouth Bay Cities Council of Governments (SBCCOG)
51