Embed Size (px)
Citation preview

Complete Mobility in CalgaryA research report sponsored by Siemens examining Complete Mobility solutions
www.siemens.ca

2 Complete Mobility in Calgary
Content
Content
Foreword 4
1.0 Executive Summary 6
1.1 Complete Mobility 6
1.2 Approach to the study 6
1.3 Complete Mobility in Canada: Canadian cities on the Complete Mobility Index 7
1.4 Looking to the future: mobility scenarios 8
1.5 Delivering Complete Mobility in Calgary 9
2.0 Introduction 10
2.1 Background to the study 10
2.2 Aims of the study 10
2.3 The Complete Mobility concept 11
2.4 The Complete Mobility Index 12
2.5 Methodology followed 13
2.6 Complete Mobility in Canada 13
3.0 The Calgary Complete Mobility appraisal 14
3.1 The Calgary Census Metropolitan Area 14
3.2 Relevance of Complete Mobility to Calgary and the Calgary Regional Partnership 15
3.3 Complete Mobility performance of Calgary 17
3.4 Performance across components of Complete Mobility 18
3.5 Summary 22
4.0 Calgary’s future mobility scenario: Currently Committed 24
4.1 Plans and policy hierarchy 24
4.2 Strategic objectives 26
4.3 Committed initiatives 27
4.4 Impact of committed projects 28
4.5 Summary 29
3Complete Mobility in Calgary
5.0 Calgary’s future mobility scenario: Complete Mobility 30
5.1 Complete Mobility packages 30
5.2 Developing the packages 31
5.3 Complete Mobility package: Centre City 33
5.4 Complete Mobility package: Visitors 36
5.5 Complete Mobility package: Regional Communities 40
5.6 Complete Mobility package: Freight 44
5.7 Complete Mobility package: Smart Infrastructure 48
5.8 Complete Mobility package: High Speed Rail 51
5.9 Summary 55
6.0 Delivery concerns for Calgary 56
6.1 SWOT analysis of Calgary 56
6.2 Effective governance and delivery 57
6.3 Adequate and sustainable funding 58
6.4 Getting the priorities right 59
6.5 Integrated transport and land use 60
6.6 Green solutions 61
6.7 Delivering Complete Mobility 62
6.8 Summary 63
7.0 Conclusions 64
Downtown, Calgary

4
Globally, with their economic importance on the rise, cities have become the growth en-gines of the future. This development, however, combined with the impact of global meg-atrends such as demographic change, urbanization, climate change and globalization, are creating serious challenges for urban centres. Today more than ever, municipal infrastruc-tures are being pushed closer and closer to their limits. In addition, cities consume vast amounts of natural resources; they account for 75 per cent of the world’s total energy con-sumption and generate 80 per cent of its greenhouse gases. Sustainable, energy-efficient infrastructures for buildings, transportation, power and water supply are urgently needed to preserve the quality of life, ensure competitiveness, conserve natural resources and protect the environment. These are facts.
When it comes to telling a story, the better the facts, the better the outcome—and for this reason, we at Siemens have invested a great deal of time and effort in developing a number of research studies: The Sustainable Cities Challenge in Canada; the US & Canada Green City Index and our Complete Mobility for Canadian Cities Series. Our report on Calgary is the second in a series of three, which already includes the Greater Toronto and Hamilton Area and Edmonton. This series is based on one simple concept—Complete Mobility. It has been derived from detailed analysis of megatrends and their future impact on freight and passenger transport across all modes. To help decision-makers understand their current and potential mobility systems, a Complete Mobility Index was developed which ranks the performance of global cities against this concept of Complete Mobility.
Calgary is economically strong, continues to grow and has engaged residents and busi-nesses. However successful management of growth is being jeopardized by a failure to manage mobility effectively and seamlessly. The strongest elements of Calgary’s mobility system are the LRT services, the airport and other isolated initiatives, such as parking man-agement and bike paths.
Foreword
Foreword
Complete Mobility in Calgary

5
Calgary was born as a strategic transportation centre and much of the city’s current suc-cess is still based on that, even if the average citizen doesn’t ‘see’ it. Today, transportation can be the key to unlocking the full potential as a sustainable and economically competi-tive global centre. The Complete Mobility packages presented in this report offer building blocks for the development of the new policies and practices that can unleash and sustain the economic, environmental and social potential of Calgary. The technologies to make Complete Mobility a reality are already available. What’s really needed is a unified vision and leadership among all the involved parties to jointly craft region-wide solutions that will build integrated mobility systems. The most important thing is for the diverse parties involved in city management to accept the premise that mobility is the glue that binds an urban region together and drives its success. Awareness is the first step to Com-plete Mobility. The most important aspect of the Complete Mobility research series is its abil-ity to draw attention to cities’ strengths, weaknesses and potential in the context of mobility. If the reports can trigger key stakeholders to ponder the issue, then we will have succeeded.
On behalf of Siemens in Canada, I am proud to share this report. I encourage you to par-take in the subsequent dialogue, with the expectation that we can engage stakeholders to embrace and possibly rethink what the future of mobility in Calgary can look like.
Marco JungbekerVice President, MobilitySiemens Canada Limited
Downtown, Calgary
Complete Mobility in Calgary

6
Executive Summary
1.0
As a first step, the six largest cities in Can-ada were measured using the concept of Complete Mobility and placed on the Com-plete Mobility Index. Next, Calgary’s mobil-ity performance was analyzed through a detailed review of its position on the Com-plete Mobility Index and an in-depth study of the city and the region.
The study involved workshops and inter-views with public and private sector stake-holders from the City of Calgary, the Cal-gary Regional Partnership and the Province of Alberta. Participants addressed different transport modes—air, rail, and road—and covered planning, policy, strategy and aca-demic professions.
In addition, Calgary’s plans and policies were analyzed in terms of Complete Mo-bility. This analysis was used to develop the first scenario for mobility in Calgary in 2030. A second scenario was developed based on the noticeable areas for improve-ment in the current plans. This scenario offers six integrated packages beyond the current plans that would take Calgary to-wards the forefront of Complete Mobility development.
Delivery issues concerning this latter scen-ario were also described and developed.
1.1 Complete Mobility
The Complete Mobility concept aims to define a system that moves people and freight by developing sustainable, efficient and user-focused infrastructure that offers a high level of service and is safe, reliable and environmentally friendly for cities, metropolitan areas and major hubs.
1.2 Approach to the study
1.0 Executive Summary1.1 Complete Mobility | 1.2 Approach to the study
Complete Mobility in Calgary
7
Downtown, Calgary
Complete Mobility in Calgary
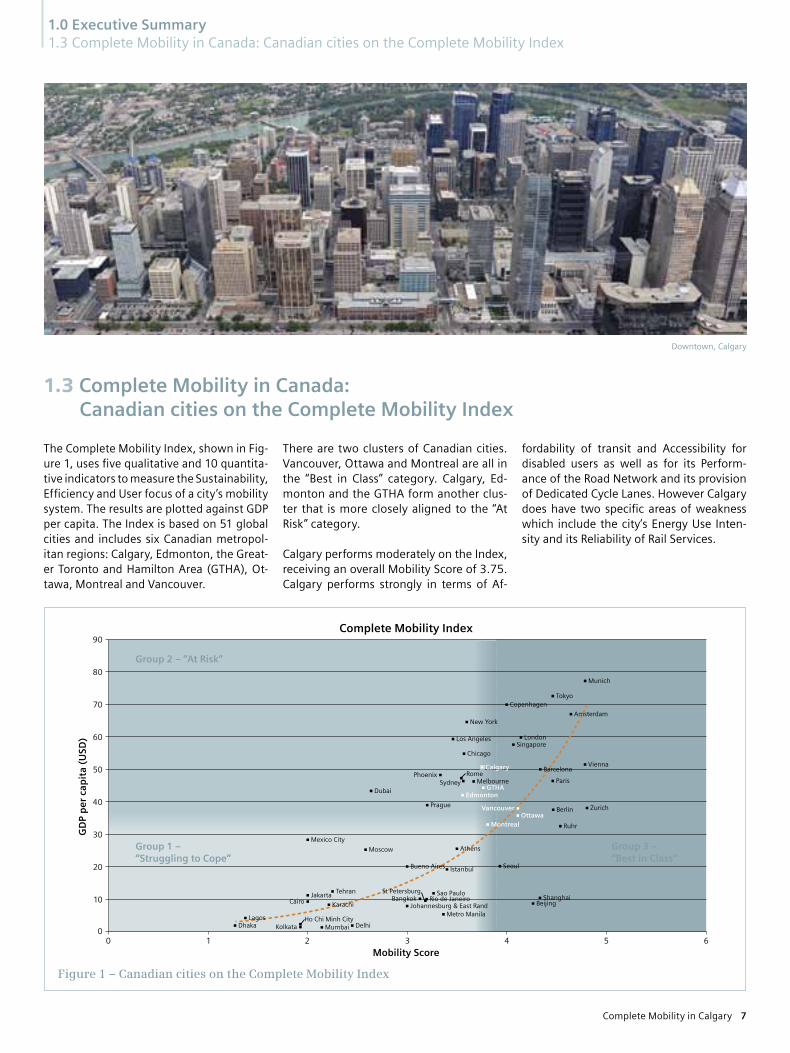
The Complete Mobility Index, shown in Fig-ure 1, uses five qualitative and 10 quantita-tive indicators to measure the Sustainability, Efficiency and User focus of a city’s mobility system. The results are plotted against GDP per capita. The Index is based on 51 global cities and includes six Canadian metropol-itan regions: Calgary, Edmonton, the Great-er Toronto and Hamilton Area (GTHA), Ot-tawa, Montreal and Vancouver.
There are two clusters of Canadian cities. Vancouver, Ottawa and Montreal are all in the “Best in Class” category. Calgary, Ed-monton and the GTHA form another clus-ter that is more closely aligned to the “At Risk” category.
Calgary performs moderately on the Index, receiving an overall Mobility Score of 3.75. Calgary performs strongly in terms of Af-
fordability of transit and Accessibility for disabled users as well as for its Perform-ance of the Road Network and its provision of Dedicated Cycle Lanes. However Calgary does have two specific areas of weakness which include the city’s Energy Use Inten-sity and its Reliability of Rail Services.
1.3 Complete Mobility in Canada: Canadian cities on the Complete Mobility Index
GD
P p
er c
apit
a (U
SD)
Complete Mobility Index
Mobility Score0 1 2 3 4 5 6
0
10
20
30
40
50
60
70
80
90
Group 1 – “Struggling to Cope”
Group 2 – “At Risk”
DhakaLagos
JakartaCairo Karachi
Tehran
Mumbai Delhi
Metro ManilaJohannesburg & East Rand
IstanbulBueno Aires
AthensMoscow
Mexico City
Seoul
ShanghaiBeijing
Ruhr
ZurichBerlin
Paris
BarcelonaVienna
SingaporeLondon
Amsterdam
Tokyo
Munich
Copenhagen
New York
Los Angeles
Chicago
Prague
Melbourne
Dubai
Group 3 – “Best in Class”
KolkataHo Chi Minh City
Bangkok Rio de JaneiroSt Petersburg Sao Paulo
PhoenixSydney
RomeCalgary
Edmonton
MontrealOttawa
Vancouver
GTHA
Figure 1 – Canadian cities on the Complete Mobility Index
1.0 Executive Summary1.3 Complete Mobility in Canada: Canadian cities on the Complete Mobility Index

8
Two future mobility scenarios were de-veloped for Calgary in 2030 through an an-alysis of the city’s strategic objectives and its current plans and policies, in addition to a trend analysis to determine future mobil-ity requirements.
The Currently Committed scenarioThis scenario examines the likely develop-ments and progress based on the principal initiatives currently committed within the city, region and province. This scenario is based on both funded and unfunded initia-tives as referred to in (1) the City of Calgary’s Approved Business Plan and Budgets 2009-2011, (2) the city’s Transportation Infra-structure Investment Plan 2009-2018, and (3) various regional and provincial initiatives.
These commitments cover road and high-way investments, pedestrian and cycle infrastructure, C-Train Light Rail Transit (LRT) expansion, express bus services with-in regional communities, Bus Rapid Transit (BRT), park and ride facilities, operations
and maintenance facilities, electronic fare collection, real time customer information and airport access and expansion.
The analysis found Calgary’s plans and poli-cies are moving in the right direction to improve the Sustainability, Efficiency and User focus of transportation in the city and region, but also that key aspects are lack-ing. The policies, for example, are largely focused on increasing the supply of trans-port infrastructure with little concentration on demand management, incentives to in-fluence behavior or the balancing of space. Furthermore, they do not perform as well in terms of integration of modes and the deliv-ery of mobility systems individually tailored to each user. Without these important as-pects, it is unlikely that transit modal share will keep pace with population growth. Therefore, car use will continue to increase as transit does not meet the users’ require-ments, and worsening congestion and pol-lution will result. As such, it becomes dif-ficult to meet the city’s strategic objectives
1.4 Looking to the future: mobility scenarios
and goals stated in ImagineCALGARY. Cal-gary, for instance, might not be able to be-come the more livable and environmentally sustainable city it aspires to be.
The Complete Mobility scenarioThis second scenario offers a series of six integrated packages that will take Calgary towards a mobility system at the forefront of Complete Mobility development. It will move Calgary into the “Best in Class” group of cities and provide a Complete Mobil-ity system that will help deliver the city’s objectives. This scenario builds on what Calgary has done and is planning to do, and addresses the areas for improvement identified in the City of Calgary’s current plans and policies. Each package includes a number of specific initiatives tailored to the Calgary context and is supported by global best practice examples. Without this approach, Calgary’s future mobility system will be constrained and the city will be in danger of losing ground to its global eco-nomic competitors.
1.0 Executive Summary1.4 Looking to the future: mobility scenarios
Banff Trail LRT Station, Calgary Calgary International Airport, Calgary
Complete Mobility in Calgary

9
Highway construction, Calgary
Complete Mobility in Calgary
The Complete Mobility scenario aims to show what can be done. However, there are inevit-ably some barriers and constraints within the Calgary community that might work against the implementation of new ideas, even if they are generally accepted as necessary.
Effective governance and deliveryComplete Mobility has a focus on users. This element requires information, equal access to services, empowerment of indi-viduals and the creation of a system where every user has valued options. Complete Mobility provides a picture of how meeting these requirements would look in practice, as well as defining some of the steps to-wards getting there.
Most public local government services in Calgary continue to be provided in the trad-itional way, via the Province of Alberta, the City of Calgary and its neighbouring munici-palities. However, the Calgary Regional Part-nership, along with the associated 10 year Regional Economic Development Strategy and the Calgary Metropolitan Plan, already provide a strategic view of the region.
The Calgary Regional Partnership demon-strates that when municipalities act togeth-er, they are more likely to recognize and
understand key strategic issues and craft solutions that may require joint implemen-tation. This should give the region a greater voice provincially and nationally, one that is appropriate to the increased size of the city and the metropolitan region.
Adequate and sustainable fundingAny implementation program, including one that takes Calgary closer to Complete Mobility, requires appropriate, consistent and long-term funding, which is often a key barrier for the execution phase. The traditional answer is for public sector bod-ies to provide funds from local, provincial or federal sources. Although these are still important funding sources, new and additional responses are needed to ensure that partnerships, innovative ideas and other forms of funding generation are all explored. A program should be developed that ensures the best performing projects and initiatives are funded first, and that any projects not meeting overall city objectives are put to the bottom of the list.
Getting the priorities rightIn Calgary, there is a dislocation between what the province considers to be its pri-orities and what appear as priorities in the main Calgary and Calgary Regional Partner-
1.5 Delivering Complete Mobility in Calgary
ship plans. Both approaches have a link to overarching aims and objectives, but nei-ther can demonstrate clearly that the prior-ity projects listed are the best fit with the economic, environmental and social object-ives, including those from associated part-ners such as the private sector. The Calgary Complete Mobility study proposes a project prioritization framework offering a method-ology to score any project or policy against stated city, regional or provincial objectives.
Integrated transport and land useThe Calgary Complete Mobility study has revealed many examples of good local poli-cies for integrating land use and transport, particularly the need to adequately serve and manage growth. However, the suc-cess of growth management appears to be mixed, as some excellent initiatives, like fo-cusing on development at transport nodes and corridors, are combined with less intuitive plans, such as allowing new de-velopment and sprawl and not supporting them with adequate transit. Improving this situation is a slow process of engagement with developers, working closely with mu-nicipalities and creating awareness among individuals to encourage them to critically look at residential locations and thereby in-fluence the market.
1.0 Executive Summary1.5 Delivering Complete Mobility in Calgary
Bike path along Memorial Drive, Calgary

10
Introduction
2.0
2.0 Introduction2.1 Background to the study | 2.2 Aims of the study
In 2010, Siemens completed a study called The Sustainable Cities Challenge in Canada, which examined stakeholder perceptions of the sustainability and infrastructure issues facing Canadians. This was based on the re-sults of a survey of 243 experts across 12 Canadian cities on transportation, energy, water, health care, safety and security. The Canadian experts believe transportation is the most important infrastructural system for attracting investment to their cities and they predict it will require the lion’s share of infrastructure investment.
The results of the 2010 study closely mir-rored the findings of the Siemens commis-sioned Megacity Challenges study. Con-ducted in 2006, it examined 25 megacities and included interviews with over 500 city leaders. Mobility was identified by 27 per cent of respondents as the most important issue by a factor of three.
2.1 Background to the study
The Megacity Challenges study demon-strated that, although all cities are unique, they are all on the same development path-way and are all facing common growth trends while striving to be like the cities with higher scores. The study also con-firmed that all cities are driven primarily by global economic competitiveness.
Mobility is a critical factor for the economic success of any city. As cities progress along the development pathway, they move from a mobility system that is not integrated and offers poor, fragmented services to a fully integrated system that is intrinsically part of a city management system. This end state is Complete Mobility. Calgary needs to have a mobility investment strategy that achieves this.
This study aims to provide new insight into the current mobility system of the Calgary Census Metropolitan Area relative to its global competitors and establish the path-way to achieve Complete Mobility within 20 years. The study initially presents an Index that measures performance towards the end state of Complete Mobility (see Sec-tion 2.6) and places Calgary alongside Ed-monton, the GTHA, Ottawa, Montreal and Vancouver to show its relative position. The study then provides an assessment of Cal-gary’s performance with respect to its Mo-bility Score and an analysis of the current and future challenges it faces in achieving Complete Mobility by 2030.
Lastly, the study presents two scenarios for future development of mobility within Cal-gary and discusses their affect on the city’s progress towards Complete Mobility.
2.2 Aims of the study
Complete Mobility in Calgary

11
Prince’s Island Park, Calgary
Complete Mobility in Calgary
2.0 Introduction2.3 The Complete Mobility concept
Following on from the Megacity Challen-ges report, further work examined trends in over 50 other cities, with populations from 500,000 to megacities in the tens of mil-lions. The work was extensive, covering eco-nomic, demographic, lifestyle, social, trans-port and technological trends. A selection is shown in Table 1. The work concluded that, as cities develop, so does the strength of these trends in influencing the city’s mobility needs. For example, sprawl and suburban-ization result in longer and more complex journeys. For cities, it becomes increasingly difficult to offer transit that meets all of the required travel patterns. This reinforces car dominance, adding to the demand for road and parking space, increasing traffic flows and congestion levels, and elevating emissions. Ultimately, these trends lead to the conclusion that mobility systems in the future will have to be Sustainable, Efficient and User focused.
2.3 The Complete Mobility concept
Economic trends Demographic trends Lifestyle and social trends
Increased disposable income
UrbanizationPersonal lifestyles (expecta-
tions, needs, behaviour)
Globalization Suburbanization Safety and security
Increased motorization Smaller householdsEnvironmental
awareness
Scarcity of fossil fuels Aging population
Increased workforce participation
Table 1 – Megatrends

12
2.0 Introduction2.4 The Complete Mobility Index
The Complete Mobility Index was developed to gain a better under-standing of Complete Mobility and the relationship between mobil-ity and economic competitiveness. A city’s position on the Index re-flects its performance in achieving Complete Mobility with respect to GDP per capita. The Complete Mobility Score is a combination of the 15 qualitative and quantitative indicators shown in Table 2.
Each indicator is scored on a scale of 1 to 6, with 1 being the lowest and 6 the highest. The final Mobility Score is an un-weighted average of all 15 indicators. The 15 indicators rep-resent key elements of the Complete Mobility concept: User focus, Sustainability and Efficiency.
2.4 The Complete Mobility Index
Complete Mobility in Calgary
Indicator number
Name Definition Measure
1 Local Public Transport Services Level of organizational, regulatory and modal integration which enhances user experience, service efficiency and urban management
Qualitative
2 Transport Management,Control and Security
Uptake of urban traffic control and security systems and their application which provide infrastructure for proactive management of mobility
Qualitative
3 Transport Informationand Payment Systems
Implementation of customer facing tools for journey planning and payment to support both trip decision-making and city objectives
Qualitative
4 Air Transport Level of connectivity of national and international air travel and integration of airport facilities with urban infrastructure
Qualitative
5 Sea Transport Level of connectivity of national and international sea travel and integration of port facilities with urban infrastructure
Qualitative
6 Road Infrastructure Optimized provision of road space per 1,000 of the population Road km-lane/1,000 of the population
7 Accidents Rate of fatal accidents from transport Fatalities/1,000 vehicle of the population
8 Pollution Level of emissions arising as a consequence of transport Emissions mg/m3 (CO)
9 Energy Use Intensity Level of energy use intensity from transport kJ/$GDP
10 Cost of Transport Provision Cost of transport provision for the community Cost/GDP (split for road and rail network)
11 Performance of the Road Network
Average journey time on road network % change (over 5 year period) of average journey time on core route into urban centre during peak hours
12 Affordability Average cost of travel by public transport as a percentage of household income
Average household expenditure on public transport as a percentage income
13 Reliability of Rail Services Reliability of rail journey time Reliability of rail journey time – percentage of services “on time”
14 Dedicated Cycle Lanes Level of provision of dedicated cycle lanes Dedicated cycle km-lane/1,000 of the population
15 Accessibility Percentage of stations with disabled access Percentage of stations with lift
Table 2 – Indicators from the Complete Mobility Index

13
The Complete Mobility Index uses quantita-tive data from an independent data collec-tion agency, as well as qualitative scoring completed by an internal panel. The Index analysis is supported by a detailed under-standing of local plans, policies and trends. In addition, important insight was gained through liaison with a group of local stake-holders via 10 one-to-one telephone inter-views and two workshops. These stake-holders included public and private sector representatives from across the Calgary Census Metropolitan Area. They covered different transport modes and land use planning, policy and strategy expertise.
2.5 Methodology followed
Urban area GDP per capita (USD) Mobility Score
Ottawa 35.84 4.11
Vancouver 38.05 4.11
Montreal 33.01 3.81
GTHA 44.54 3.76
Calgary 55.68 3.75
Edmonton 37.30 3.56
Table 3 – Final Mobility Scores
The Complete Mobility Index is globally ap-plicable. In Canada, the Index includes the Census Metropolitan Areas (CMAs) of the Greater Toronto and Hamilton Area, Cal-gary, Edmonton, Ottawa, Montreal, and Vancouver.
Table 3 shows the GDP per capita and the Mobility Scores achieved by the six Can-adian cities.
2.6 Complete Mobility in Canada
2.0 Introduction2.5 Methodology followed | 2.6 Complete Mobility in Canada
Bike ramp at Bridgeland Memorial LRT Station, CalgaryBike path along Memorial Drive, Calgary
Complete Mobility in Calgary

14
3.0 The Calgary Complete Mobility appraisal3.1 The Calgary Census Metropolitan Area
3.0
The Calgary Complete Mobility appraisal
The area used for the calculation of Com-plete Mobility is the Calgary Census Metro-politan Area. This area is shown in Figure 2 and is defined by Statistics Canada as the following subdivisions: Airdrie, Beiseker, Calgary, Chestermere, Cochrane, Cross-field, Irricana and Rocky View No. 44.
The study has also made reference to the Calgary Regional Partnership (CRP). The CRP is a cooperative of 15 urban munici-palities in the greater Calgary area and is one of 13 Regional Economic Development Agencies in Alberta. As shown in Figure 2, the CRP spans a large geographical area with an approximate radius of 125 kilom-eters that centers on the City of Calgary. The cooperative focuses on issues related to regional growth, coordinated planning and inter-municipal relationships. There are strong links between the CRP’s agenda and the topics covered by this study.
3.1 The Calgary Census Metropolitan Area
City ofCalgary
Wheatland County
Municipal District of Rocky View
Municipal District of Foothills
Crossfield Beiseker
Irricana
Strathmore Hussar
Airdrie
Cochrane
Banff
CanmoreRedwoodMeadows
Tsuu T’inaNation I.R.
Chestermere
High River
Longview
OkotoksBlack Diamond
Turner Valley
CRP perimeter
Towns and villages
Municipal District of Foothills
Municipal District of Rocky View
Wheatland County
Tsuu T’ina NationPossible project partner status
Figure 2 - The Calgary Regional Partnership
Complete Mobility in Calgary
source: calgary regional partnership

15Complete Mobility in Calgary
Glenmore Trail at 14th Street, Calgary
3.2 Relevance of Complete Mobility to Calgary and the Calgary Regional Partnership
As previously explained, the concept of Com-plete Mobility is underpinned by a series of global trends. Tables 4, 5 and 6 present data demonstrating that these global trends and Complete Mobility are relevant to Calgary. In addition, the study recognizes there are a series of significant localized trends which must also be considered.
The trends combine to create a complex range of requirements the transportation system must respond to if it is to success-fully support the aims and objectives of Calgary. Complete Mobility provides the vi-sion and initiatives that will allow the city to plan for the impact of the trends, take advantage of their potential and proactive-ly manage the mobility system to achieve its goals.
Economic trends Evidence in Calgary
Increased disposable income
Calgary had the highest personal income per capita of the major Canadian Census Metropolitan Areas (CMAs) at $54,422 in 2009.
The average annual wage and salary in the Calgary Economic Region was estimated at $49,400 in 2006 and is expected to increase to $60,200 by 2012.
Globalization Both oil and gas extraction and chemical manufacturing exports saw high growth over the last decade, with the former seeing an increase of 220% and the latter growing by 156%.
Alberta’s exports of goods and services more than tripled between 1995 and 2005 to about $87.8 billion.
Motorization The number of registered vehicles in Calgary grew from 735 per 1,000 people in 2005 to 774 per 1,000 people in 2007. This is a growth of 3%. Calgarians own 22% more vehicles than the national average of 597 per 1,000 people.
Scarcity of fossil fuels The heavy reliance of Calgary’s economy on the oil and gas industries could result in damaging impacts from the instability of fuel prices.
Table 4 – Global and local trends in Calgary
3.0 The Calgary Complete Mobility appraisal3.2 Relevance of Complete Mobility to Calgary and the Calgary Regional Partnership

16
Social trends Evidence in Calgary
Population Under a high growth scenario, the population of the Calgary CMA is expected to increase from 1,242,624 in 2010 to 2,003,000 in 2031.
Urbanization and suburbanization
From 2005 to 2010, 70% of Calgary’s housing growth occurred in new suburbs, which have accommodated nearly 94% of the population increase.
Smaller households Household size is expected to decline from 2.6 people to 2.4 people between 2001 and 2031.
Aging Calgary expects a rise in residents over 65 years old from 9.8% in 2006 to 15.4% in 2033.
Increased workforce participation Economic growth is expected to generate an increase in employment from 498,000 in 2001 to 705,000 in 2033.
Immigration The Calgary CMA experienced a net gain of 85,710 migrants in the five years to 2007 and expects to maintain a steady immigrant population of 20-22% between 2001 and 2026.
Growth of urban aboriginal population
The number of Aboriginal people in Calgary doubled from 1.2% in 1981 to 2.3% in 2001. Estimates suggest the Aboriginal population may grow by 7,000 between 2001 and 2017.
Balance between jobs and skills
Jobs requiring a university education are the fastest growing skill level segment in Calgary’s job market, with 62,200 new jobs expected between 2007 and 2017 requiring a university education. This growth is outpacing the average annual graduates from the University of Calgary.
Income disparity, poverty and lack of affordable housing
In 2003, there were approximately 161,000 Calgarians living in poor households - a 25% increase from 2002 and a 27% increase over the previous five years.
Lifestyle trends Evidence in Calgary
Personalization of lifestyles In 2010, the Canadian Council on Learning ranked Calgary as Canada’s Most Wired City and third in the Smartest City category based on formal education, applied skills, social values of the community and cultural opportunities and spending.
Calgary also ranked fifth in the Economist Intelligence Unit’s Liveable City Ranking.
Livability and quality of life In a survey of Calgarians, 41% expected liveability and quality of life to be worse in 2038 than it was in 2008.
Safety and security In the Economist Intelligence Unit’s Liveable City Ranking, Calgary scores high across its “Stability” category, which covers the prevalence of petty and violent crime, in addition to the threat of conflict and terrorism.
Environmental awareness ImagineCALGARY includes an aim that Calgary’s ecological footprint will decrease by 2036 to below the 2001 Canadian average of 7.25 hectares per capita through initiatives such as the Blue Cart recycling program. In 2010, approximately 70,000 tonnes of material were recycled from blue carts and community recycling depots. That was a 70% increase in the amount recycled before the carts were in place. In the 2010 Citizen Satisfaction Survey, 83% of Calgarians stated they were satisfied with the residential Blue Cart recycling program.
3.0 The Calgary Complete Mobility appraisal3.2 Relevance of Complete Mobility to Calgary and the Calgary Regional Partnership
McMahon Stadium, Calgary
Complete Mobility in Calgary
Table 5 – Global and local trends in Calgary
Table 6 – Global and local trends in Calgary

17
Alberta Children’s Hospital, Calgary
Complete Mobility in Calgary
Calgary’s Mobility Score is 3.75 against a pos-sible maximum of 6. This score is the average from across the 14 relevant Complete Mobil-ity indicators. (Note: As “Sea Transport” is not applicable in Calgary this indicator has not been included in the score.)
Based on this Mobility Score and the GDP per capita, the Calgary CMA is on the boundary between the “At Risk” and “Best in Class” categories.
Figure 3 reveals that Calgary outperforms cities such as Phoenix and Chicago, who possess GDP per capita levels similar to or higher than Calgary, but who generate a lower Mobility Score. A number of cities perform relatively better than Calgary based on this comparison. Vienna, Barce-
lona and Paris all have levels of GDP per capita comparable to Calgary, but their Mobility Scores and their progress in at-taining Complete Mobility are significantly better.
Calgary can also be analyzed against its Mo-bility Score peer group as shown in Figure 4. Calgary’s Mobility Score is very similar to the CMAs of the GTHA (3.76) and Montreal (3.81). Chicago and Melbourne also have comparable scores and levels of GDP per capita. Seoul and Montreal are performing better than Calgary because they have achieved a similar Mobility Score with a lower level of GDP per capita. On the other hand, New York did not perform as well as Calgary, failing to transform its higher GDP per capita into a higher Mobility Score.
3.3 Complete Mobility performance of Calgary
Figure 4 – Mobility Score peer group
GD
P p
er C
apit
a (U
SD)
Complete Mobility Index
Mobility Score0 1 2 3 4 5 6
0
10
20
30
40
50
60
70
80
90
Group 1 – “Struggling to cope”
Group 2 – “At Risk”
DhakaLagos
JakartaCairo Karachi
Tehran
Mumbai Delhi
Metro ManilaJohannesburg & East Rand
IstanbulBueno Aires
AthensMoscow
Mexico City
Seoul
ShanghaiBeijing
Ruhr
ZurichBerlin
Paris
BarcelonaVienna
SingaporeLondon
Amsterdam
Tokyo
Munich
Copenhagen
New York
Los Angeles
Chicago
Prague
Melbourne
Dubai
Group 3 – “Best in Class”
KolkataHo Chi Minh City
Bangkok Rio de JaneiroSt Petersburg Sao Paulo
PhoenixSydney
RomeCalgary
Edmonton
MontrealOttawa
Vancouver
GTHA
Figure 3 – GDP peer group
50
3.0 The Calgary Complete Mobility appraisal3.3 Complete Mobility performance of Calgary

18
University LRT Station, Calgary
Complete Mobility in Calgary
3.0 The Calgary Complete Mobility appraisal3.4 Performance across components of Complete Mobility
Average
Transport Management,Control and Security
Dedicated Cycle Lanes
Air Transport
Accidents
Energy Use Intensity
Pollution
Mobility ScoresPoor Performance Strong Performance
1 62 3 4 5
Sust
ain
abili
ty
Performance of theRoad Network
Sea Transport
Road Infrastructure
Cost of TransportProvision
Local PublicTransport Services
Transport Informationand Payment Systems
Affordability
Reliability of Rail Services
Accessibility
Effi
cien
cyU
ser
focu
s
Not Applicable
Table 8 – Overview of Complete Mobility performance
Qualitative Indicator Mobility Score
Local Public Transport Services 4.19
Transport Management, Control and Security 3.88
Transport Information and Payment Systems 4.06
Air Transport 3.44
Sea Transport N/A
The three core components of Complete Mobility—Sustainability, Efficiency and User focus—have previ-ously been highlighted. An assessment of Calgary’s mobility system’s performance against each of these components has been completed making use of both indicator scores and stakeholder insights.
Table 8 offers an overview of the scores received by Calgary for each of the applicable 14 indicators. The qualitative scores, unlike the quantitative scores, are not necessarily whole numbers. Therefore, Table 7 has been included to show the exact scores for the five qualitative indicators.
Calgary scored mainly 3.0s and 4.0s, but a cluster of indicators scoring above 5.0 brought the average up to 3.75. The highest scores were for Performance of the Road Network, Affordability, Dedicated Cycle Lanes and Accessibility, while Energy Use Intensity and Reliability of Rail Services were the lowest scor-ing indicators.
3.4 Performance across components of Complete Mobility
Table 7 – Qualitative Mobility Score details
19
Anderson LRT Station, Calgary
Complete Mobility in Calgary
0
1
2
3
4
5
6
Calgary - Sustainability Accidents
Energy Use Intensity
DedicatedCycle Lanes
Pollution
Figure 5 – Performance for Sustainability indicators
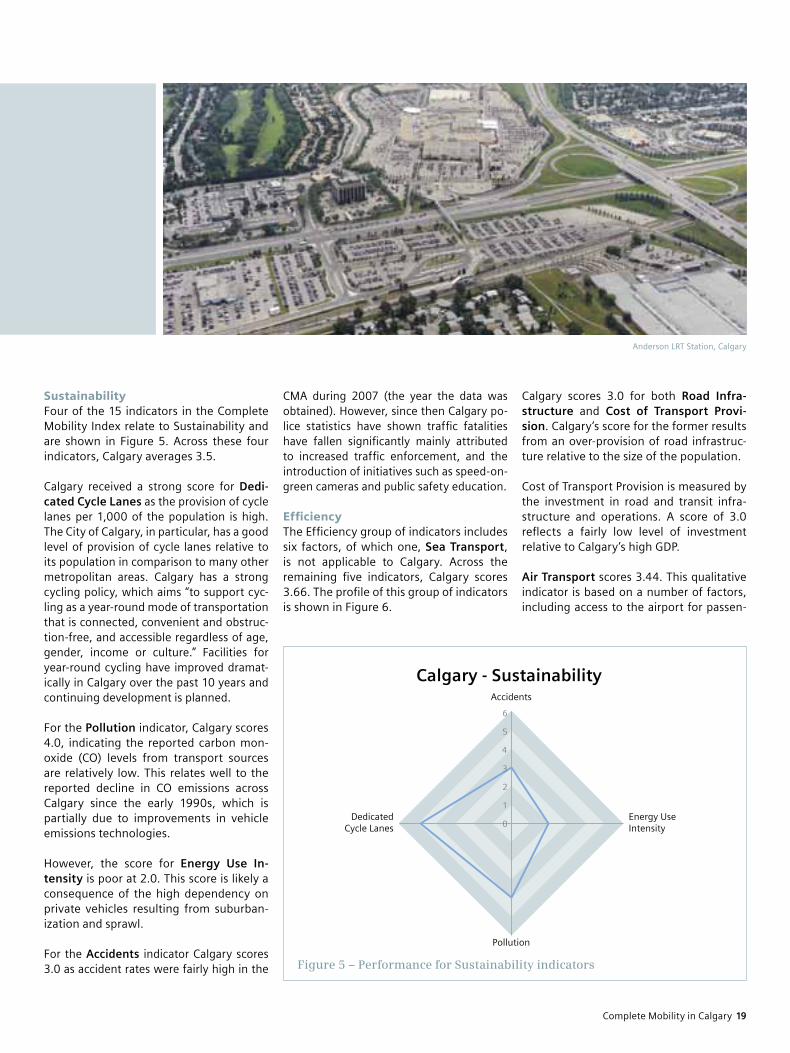
SustainabilityFour of the 15 indicators in the Complete Mobility Index relate to Sustainability and are shown in Figure 5. Across these four indicators, Calgary averages 3.5.
Calgary received a strong score for Dedi-cated Cycle Lanes as the provision of cycle lanes per 1,000 of the population is high. The City of Calgary, in particular, has a good level of provision of cycle lanes relative to its population in comparison to many other metropolitan areas. Calgary has a strong cycling policy, which aims “to support cyc-ling as a year-round mode of transportation that is connected, convenient and obstruc-tion-free, and accessible regardless of age, gender, income or culture.” Facilities for year-round cycling have improved dramat-ically in Calgary over the past 10 years and continuing development is planned.
For the Pollution indicator, Calgary scores 4.0, indicating the reported carbon mon-oxide (CO) levels from transport sources are relatively low. This relates well to the reported decline in CO emissions across Calgary since the early 1990s, which is partially due to improvements in vehicle emissions technologies.
However, the score for Energy Use In-tensity is poor at 2.0. This score is likely a consequence of the high dependency on private vehicles resulting from suburban-ization and sprawl.
For the Accidents indicator Calgary scores 3.0 as accident rates were fairly high in the
CMA during 2007 (the year the data was obtained). However, since then Calgary po-lice statistics have shown traffic fatalities have fallen significantly mainly attributed to increased traffic enforcement, and the introduction of initiatives such as speed-on-green cameras and public safety education.
EfficiencyThe Efficiency group of indicators includes six factors, of which one, Sea Transport, is not applicable to Calgary. Across the remaining five indicators, Calgary scores 3.66. The profile of this group of indicators is shown in Figure 6.
Calgary scores 3.0 for both Road Infra-structure and Cost of Transport Provi-sion. Calgary’s score for the former results from an over-provision of road infrastruc-ture relative to the size of the population.
Cost of Transport Provision is measured by the investment in road and transit infra-structure and operations. A score of 3.0 reflects a fairly low level of investment relative to Calgary’s high GDP.
Air Transport scores 3.44. This qualitative indicator is based on a number of factors, including access to the airport for passen-

20
3.0 The Calgary Complete Mobility appraisal3.4 Performance across components of Complete Mobility
Complete Mobility in Calgary
gers and freight, the facilities within the air-port and the number of national and inter-national destinations served. It is expected that this score will increase following the expansion of the Calgary International Air-port however, as of late, strategic links and critical investments are missing.
Calgary received a score of 3.88 for Trans-port Management, Control and Security. This indicator focuses on the implementa-tion of traffic management and security systems across all modes. Calgary has em-ployed some management and security systems within its transportation network. Centre Street is a good example, combin-ing traffic signal priority for transit, an HOV lane and lane reversals during peak hours. However, these initiatives need to be em-ployed more widely for transport manage-ment to work on a city scale. In addition, aside from Calgary’s Downtown Parking Strategy, the use of demand management is not as extensive as it could be and there is a lack of integration across the modes to enable proactive management.
Performance of the Road Network gains the highest score in this category. Per-formance of the Road Network considers the change in journey times on a key route into the city over a five-year period. The reported journey times over the period in-creased by a relatively small amount. This suggests that issues such as congestion have not significantly increased in the time period. Freight movement on highways
and at key areas such as the airport is gen-erally effective and operationally efficient. Any traffic peaks currently appear to be of short duration due to plentiful highway space. There are, however, some key pinch points within the system that need to be addressed. For instance, significant traffic congestion occurs at all of the river cross-ings for northbound traffic and significant traffic congestion can be observed in the centre city on inbound links.
User focus User focus is probably the most important
aspect of Complete Mobility. Without a system centered on the needs of its cur-rent and potential users, it will be difficult to achieve the two other ambitions of Sustainability and Efficiency. Five indica-tors fall within the User focus category as shown in Figure 7. Across these five, Cal-gary averages a score of 4.05.
Calgary receives a score of 5.0 for both Ac-cessibility and Affordability. Accessibility examines the ability of disabled passen-gers to use stations and services. Universal access to the transportation system is a
Calgary - EfficiencyTransport Management,
Control and Security
Road Infrastructure
0
1
2
3
4
5
6
Air Transport
Sea Transport
Performance ofthe Road Network
Cost of TransportProvision
Figure 6 – Performance for Efficiency indicators
Queen Elizabeth II Highway at Glenmore Trail, Calgary

21Complete Mobility in Calgary
Calgary - User focusLocal Public Transport Services
Transport Informationand Payment Systems
Affordability
Accessibility
Reliability ofRail Services
0
1
2
3
4
5
6
Figure 7 – Performance for User focus indicators
Calgary - User focusLocal Public Transport Services
Transport Informationand Payment Systems
Affordability
Accessibility
Reliability ofRail Services
0
1
2
3
4
5
6
key policy within Calgary’s transportation plan. While all C-Train stations are access-ible by ramps, not all have elevators which prevents Calgary from scoring a 6.0.
Affordability is measured by the percent-age of household expenditure devoted to public transport. This information is only available at the provincial level, so it was assumed that the amount did not vary much across Alberta. The data reveals a relatively low percentage of household expenditure is applied to public transit. Transit affordability in Calgary is supported through the availability of a low income monthly transit pass, made available to those with income lower than 75 per cent of the federal cut off.
Calgary received a 4.19 for Local Public Transport Services. This reflects the cover-age, level of service (including comfort, re-liability and degree of overcrowding) and overall integration of public transport. Cal-gary’s public transport system performs reasonably well and is gradually improving. For example, LRT route expansion is under-way and provision is being made for four-car trains. In addition, there is a good bus net-work, which mainly acts as a feeder system for the LRT service; park and ride lots are well positioned to intercept and steer people onto the LRT system; the dedicated C-Train route along 7th Avenue and the fare-free zone downtown is a good feature of the city; and Stephen Avenue provides a well-designed pedestrianized zone as a focus for retail shops and restaurants. In sum, trips destined
for downtown appear to be accessible and convenient. Outbound trips, however, can be challenging. Bus service can be very infre-quent on some routes connecting with the C-Train, particularly outside peak periods. This is exacerbated by a lack of comfortable wait-ing facilities for bus passengers as the transit station infrastructure is outdated. Therefore, improvement to outbound transit is required to increase the score towards a 6.0.
Calgary’s Transport Information and Pay-ment Systems received a score of 4.06. Information regarding transit routes and
schedules is available and Calgary Transit’s website contains adequate information for most users, but improvements are desir-able. Real-time passenger information and directional signage is often lacking outside downtown and currently payment options for transit users are limited.
Finally, Calgary received a low score of 2.0 for Reliability of Rail Services based on the C-Train services. Periods of high demand and limited spare capacity on the LRT net-work are the main reasons for this lack of service consistency.
Crowchild Trail at Bow Trail, Calgary

22 Complete Mobility in Calgary
3.5 Summary
3.0 The Calgary Complete Mobility appraisal3.5 Summary
Calgary scores moderately well in all three components of Complete Mobility. In addi-tion, stakeholder consultations have re-vealed there are strengths resulting from significant planned improvements that will make transport more Sustainable, Effi-cient and User focused once implemented, thus further improving the Mobility Scores. Calgary’s mobility system provides a good foundation on which to build a future sys-tem based on Complete Mobility.
Despite this good foundation, there are some trends and resulting challenges fa-cing the city that will hinder its success to-wards Complete Mobility. The following is a summary of the most significant trends in Calgary and their resulting challenges.
Trend 1 – Economic competitiveness and oil and natural gas dependenceCalgary’s economy has long been largely dependent on the oil and natural gas in-dustries which can be highly volatile, lead-ing to an economy subject to boom and bust periods.
Resulting challenge – Economic diversity Calgary must attract new businesses and skilled immigrants by becoming more liv-able. A legible and energetic downtown as well as strong international connections are critical.
Trend 2 – Population growthCalgary’s population is expected to grow significantly in the next decades as high incomes and good job opportunities at-tract many national and international im-migrants.
Resulting challenge – Accommodating population growth without increasing sprawl Calgary must ensure that higher density options are available and attractive, and that sufficient transit options reach those living in lower density areas.
Centre Street Bridge, Calgary
23Complete Mobility in Calgary
Trend 3 – Changing demographicsIn Calgary the elderly are becoming an in-creasingly large proportion of the popula-tion, household sizes are decreasing and the number of urban aboriginals is rising.
Resulting challenge – Integration and equality Calgary needs to ensure that all segments of its society are well integrated and have equal access to the services and facilities they require.
Trend 4 – Car dominanceThere is a dominant car culture in Calgary. Many journeys can only realistically be undertaken by private auto. When energy prices rise the personal costs of automotive use will increase, making such a car-fo-cussed lifestyle environmentally and eco-nomically unsustainable. In addition, car- dependent lifestyles have adverse impacts on health through both emissions and a lack of exercise.
Resulting challenge – Car dominance is unsustainable with population growth Congestion is not a major issue in Calgary yet, but it quickly could be. In addition to integrated land use and transport plan-ning, Calgary must provide adequate road and transit networks and create the con-ditions for integration among all modes. Transit and active transport should be real options. The use of incentives may be re-quired to promote behavioural change.
Trend 5 – Mixed priorities between city, region and provinceThere are different governance, funding and delivery issues which need to be resolved in Calgary. The mismatch of priorities between the City of Calgary and the Province of Al-berta is most likely the biggest barrier to successful implementation of an improved transportation system.
Resulting challenge – Find mutually-supportive objectives Mutually supportive objectives will ensure that funding is directed to the most suit-able transport projects and initiatives.
7th Avenue, Calgary

24
Calgary’s future mobility scenario: Currently Committed
4.0
4.0 Calgary’s future mobility scenario: Currently Committed4.1 Plans and policy hierarchy
This chapter examines the likely future developments and progress with respect to Calgary’s transportation and mobility systems based on the principal initiatives currently committed within the city, region and province. This includes both funded and unfunded initiatives.
The first step in developing this scenario was gaining a thorough understanding of the plans and policy hierarchy within Cal-gary. It is important to understand how the different transport-related policies interact with each other. This is shown in Figure 8.
ImagineCALGARY is an initiative first launched in 2005 to allow for wide com-munity input into a long-range urban sus-tainability plan. With input from 18,000 Calgarians, this is one of the largest cit-izen involvements in a visioning process anywhere in the world. The objectives and principles developed within Imagine- CALGARY have guided the city’s Plan It Cal-gary process, which includes the Calgary Transportation Plan (CTP) and the Muni-cipal Development Plan (MDP). Various other documents, such as Transit Friendly Design Guidelines, have also fed into the development of the CTP and MDP.
In a parallel process, the Calgary Regional Partnership (CRP) has developed plans at the regional level. The Calgary Metropol-itan Plan (CMP) is the guiding document in this instance. The CMP is a vision for a sus-tainable region that includes statements of regional outcomes, integrated strategies and policies, as well as conceptual maps to help the region achieve its vision over the next 60 to 70 years.
The Plan It Calgary and Calgary Regional Partnership components are not officially linked. There is, however, some level of consultation between the two, including a shared modelling function.
4.1 Plans and policy hierarchy
Complete Mobility in Calgary

25
Figure 8 – Plans and policy hierarchy for Calgary
Crowchild Trail at Glenmore Trail, Calgary Glenmore Trail at 14th Street, Calgary
Complete Mobility in Calgary
LRT Projects:• South LRT• Northeast LRT• Northwest LRT• West LRT**• Southeast LRT• North Central LRT• 8th Avenue Subway• Downtown Refurbishment Project• 4-Car Platform Extensions (South, NE, NW Lines)
HOV Projects:• 52nd Street*• MacLeod Trail*
BRT Projects:• BRT Network Plan (2010- ongoing)• SW BRT Downtown to Woodbine Functional Study (2010)• 17 Avenue SE Transportation Planning Study (2009-2020)
Airport Projects:• Runway Expansion• Terminal Concourse Expansion• Airport Underpass/ Airport Trail Functional Study - Airport to Stoney Trail (ongoing by City of Calgary)
Centre CityMobility Plan
(2010)
Cycling Strategy DRAFT
(2011)
Calgary Regional Partnership
* Currently under study** Currently under construction
august 15, 2011
Plan It Calgary
Calgary Transportation Plan(2009)
Municipal Development Plan(2009)
Transit Oriented Development
Policy Guidelines (2005)
Transit Friendly Design Guidelines
(2006)
Centre City Plan (2007)
Calgary HOV Network Plan
(2008)
Pedestrian Policy & Needs Report
(2008)
Imagine Calgary Plan (2006)
Calgary Metropolitan Plan
(2009)
Regional Transit Plan (2009)
• Commuter Rail• Regional Express Bus Service• Local Transit Systems• Local Transit Hubs• TOD
26
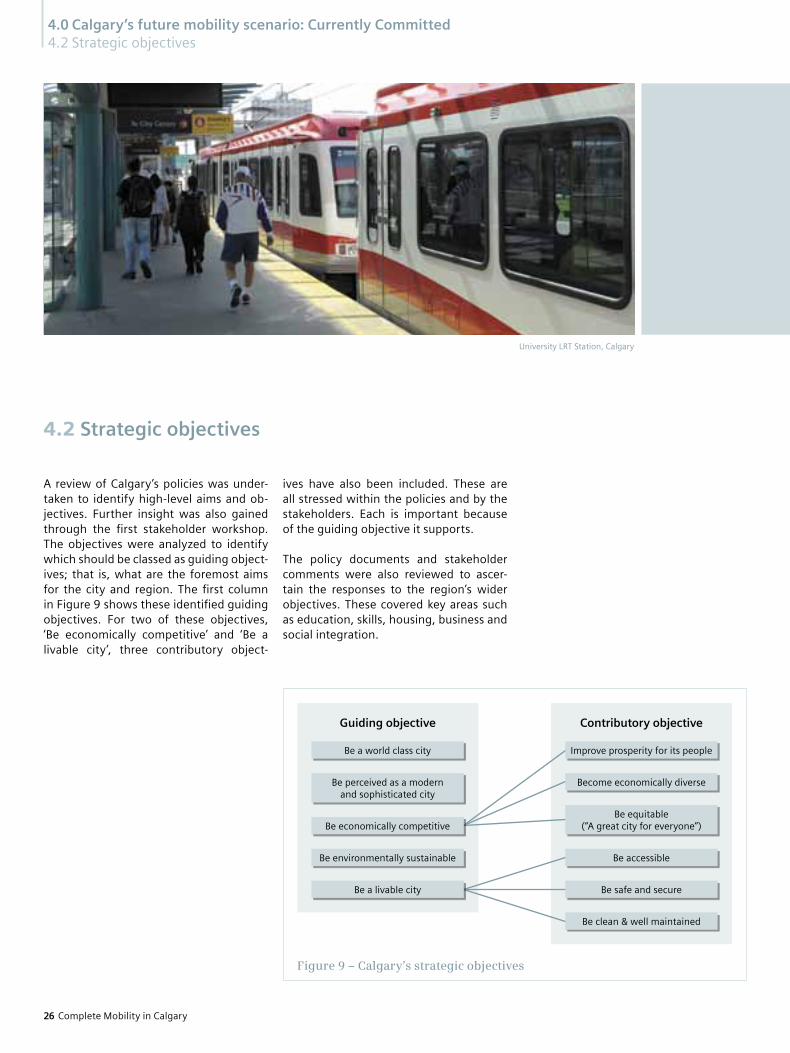
A review of Calgary’s policies was under-taken to identify high-level aims and ob-jectives. Further insight was also gained through the first stakeholder workshop. The objectives were analyzed to identify which should be classed as guiding object-ives; that is, what are the foremost aims for the city and region. The first column in Figure 9 shows these identified guiding objectives. For two of these objectives, ‘Be economically competitive’ and ‘Be a livable city’, three contributory object-
ives have also been included. These are all stressed within the policies and by the stakeholders. Each is important because of the guiding objective it supports.
The policy documents and stakeholder comments were also reviewed to ascer-tain the responses to the region’s wider objectives. These covered key areas such as education, skills, housing, business and social integration.
4.2 Strategic objectives
4.0 Calgary’s future mobility scenario: Currently Committed4.2 Strategic objectives
Figure 9 – Calgary’s strategic objectives
University LRT Station, Calgary
Complete Mobility in Calgary
Guiding objective Contributory objective
Improve prosperity for its people
Become economically diverse
Be equitable (“A great city for everyone”)
Be accessible
Be safe and secure
Be clean & well maintained
Be a world class city
Be perceived as a modern and sophisticated city
Be economically competitive
Be environmentally sustainable
Be a livable city

27Complete Mobility in Calgary
It has been necessary to make some as-sumptions regarding the initiatives to which Calgary is committed; these are shown in Table 9. Two documents, the City of Calgary’s Approved Business Plan and Budgets 2009-2011 and the Transporta-tion Infrastructure Investment Plan 2009-2018, have been particularly valuable alongside information received regarding regional and provincial initiatives.
4.0 Calgary’s future mobility scenario: Currently Committed4.3 Committed initiatives
4.3 Committed initiatives
Scheme/Project Explanation (example initiatives)
Pedestrian and cycle infrastructure
• Pedestrian overpasses• Improved bikeways (e.g., around the University, key C-Train stations, centre city)• Bike storage
LRT expansion • West LRT• NE LRT expansion• NW LRT expansion• 4-car trains and platform extensions
Improvements and expansion of express bus services within regional communities
• Examining move to a publicly planned and supported private operation model• Planning for new or more frequent services between regional communities
and the City of Calgary, including new customer terminals and stops
BRT • 2 BRT schemes
Park and ride • It is not known exactly how many new lots or expansions are planned
Operations and maintenance facilities
• Operations facility• Maintenance facility
Electronic fare collection
• Upgrades, replacement and purchase of new ticket vending machines on the LRT system, and bus fare boxes
Real-time customer information
• Various interchange improvements across the strategic road network• Various road widening initiatives across the strategic road network
Airport access • Airport tunnel under construction• Dedicated bus trial between downtown and the airport terminal
Airport expansion • $2 billion investment for new concourse (22 gates) and runway
Provincial ring road • Completion of ring road
Table 9 – Committed initiatives

28
The analysis of the impact of the commit-ted projects relates to the three key areas of Sustainability, Efficiency and User focus.
Sustainability Through improvements to pedestrian and cycling facilities, there is firm support for the city’s pledge to increase the level of pri-ority given to more sustainable modes of transport. Calgary already scores well for the provision of Dedicated Cycle Lanes, but this should further improve its score.
There are strong plans for LRT expansion within the City of Calgary and express bus services for the regional communities. These, alongside additional initiatives such as electronic fare collection and real-time information, will encourage travel by transit. Modal shift from private vehicles should occur, improving the Pollution and Energy Use Intensity indicators. In addi-tion, these actions should all support the city’s strategic objectives to create a more livable and accessible city.
Although significant improvements to Sus-tainability are expected, the committed in-itiatives do not go far enough, particularly when consideration is given to the expected high levels of population growth across Cal-gary. Adequate transit to the suburbs will still be lacking and the express buses for the regional communities may not have the de-sired outcomes on their own.
Alongside the LRT and other transit improvements, there are also several improvements to the road system planned, such as the ring road. This is clearly advan-tageous for freight movement, which is vitally important to Calgary. However, the improvements will almost certainly also encourage increased personal auto use. Suburban growth and increased commut-ing journeys are also major challenges. Suburban communities are often not well served by transit, but tend to have easy ac-cess to highways. Highway improvements, therefore, are likely to further add to the unsustainable travel patterns of many resi-dents within these communities.
A key component to creating a more en-vironmentally sustainable transportation system would be to encourage the use of alternative, “greener” modes of transport. It does not yet appear that these are be-ing actively encouraged on a wide scale in Calgary for either public or private trans-portation.
Overall, it is expected that the combined changes across the Sustainability indicators would nudge the average nearer to the 4.0 mark. However, improvements beyond are not likely as Pollution and Energy Use Inten-sity, for example, would not be expected to improve significantly.
4.4 Impact of committed projects
EfficiencyIf the airport expansion is well managed and the trial of the dedicated express air-port transit link becomes permanent, Air Transport will almost certainly improve from 3.44 to above 5.0. The improvements will result in better international connec-tivity and will support the city’s strategic objective to be a world class, modern and sophisticated city, as well as being more economically competitive & diverse.
There is a more mixed picture for many of the other Efficiency indicators. It is as-sumed road flow will improve following the planned road widening and junction improvements which may improve the Per-formance of the Road Network indicator. However, the Road Infrastructure indica-tor could potentially fall as there is already an over-provision of road infrastructure in relation to Calgary’s population.
Transport Management, Control and Se-curity is an important underlying require-ment based on proactive and integrated management across modes. The planned operations and maintenance facilities are expected to support this indicator, however, in order to reach a score of 5.0 or even 6.0, Transport Management, Control and Secur-ity must be integrated with other city ser-vices such as emergency response, health provision and education. Furthermore,
4.0 Calgary’s future mobility scenario: Currently Committed4.4 Impact of committed projects
7th Avenue, Calgary
Complete Mobility in Calgary

29
there needs to be integration with charging and payment systems, as well as informa-tion provision, in order to manage demand.
In summary, improvements are being made with respect to the Efficiency related indica-tors that will have a positive impact on Cal-gary’s Mobility Score. However, the focus of these improvements is supply side through provision of new infrastructure which will not be sustainable in the long term. Calgary must consider demand-side measures, such as control and management through choice and incentives, to change behaviour and manage demand.
User focusImplementation of real-time information across the bus network and development of electronic fare payment should increase the score received for Transport Informa-tion and Payment Systems. However, in order to gain the highest score, payment systems would need to be integrated across all modes for the entire region. Addi-tionally, comprehensive journey planning information should be available pre-trip and during the trip to respond to real-time system performance. This would cover all transport options and allow for easy, mode-neutral travel choices.
The Local Public Transport Services indicator considers the transport options
available to users, while recognizing that different users have different needs. To some extent, the committed initiatives will increase the transport options available to residents and visitors. This supports the city’s strategic objective to be equitable and provide “A great city for everyone”. Within the LRT expansion and upgrading, steps are being taken to ensure disabled users can ac-cess the platforms easily. This will increase the Accessibility score. Furthermore, Ac-cess Calgary is expanding transportation services for Calgarians unable to use Cal-gary Transit buses and C-Trains by offering a shared-ride, door-to-door service within the Calgary city limits. Also key to the Local Public Transport Services indicator is that investment or expenditure decision-making is objective-led with a level playing field for prioritization across a wide range of poten-tial solutions. There does not seem to be an objective-led prioritization process in place nor are there plans for it in the future. This is a weakness that needs to be addressed.
Overall, there is potential for the User focus indicators to improve based on the commit-ted initiatives. However, without a strong methodology for customer segmentation and customer relationship management as well as the development of a seamless transport system that operates as a single system, it will be difficult to achieve any in-creases of real significance.
7th Avenue, Calgary
Complete Mobility in Calgary
4.0 Calgary’s future mobility scenario: Currently Committed4.5 Summary
Calgary’s plans and policies are moving in the right direction to improve the Sustain-ability, Efficiency and level of User focus of transportation in the city and the region. Currently, Calgary scores an average of 3.50 for the Sustainability indicators, 3.66 for the Efficiency indicators and 4.05 for the User focus indicators. The current plans and policies will improve these scores, but they will be unable to gain scores of 5.0 to 6.0 because key aspects are lacking. The policies, for example, are largely fo-cused on increasing the supply of transport infrastructure with little concentration on demand management, such as incentives to influence behavior or the balancing of space. Furthermore, they are deficient in integrating the modes and the delivery of mobility systems individually tailored to each user. Without these important as-pects, it is likely transit modal share will not grow enough against the backdrop of population growth. Car use will continue to increase because transit does not meet the users’ requirements and congestion and pollution will worsen. As such, the city’s strategic objectives and goals stated in Im-agineCALGARY, will not be met and ultim-ately Calgary could quickly become less liv-able and less attractive to foreign investors.
4.5 Summary

30
Calgary’s future mobility scenario: Complete Mobility
5.0
5.0 Calgary’s future mobility scenario: Complete Mobility5.1 Complete Mobility packages
Six Complete Mobility packages applicable and beneficial to Calgary are shown in Figure 10. These packages build on what Calgary has done and is planning to do, and address the areas for improvement previously discussed.
The Centre City, Visitors and Regional Communities packages are ideal initial applications for the kind of smart infrastruc-ture needed for Complete Mobility. The Smart Infrastructure package is a foundational package which needs to be applied city-wide and integrated with all other packages. The High Speed Rail package would be a provincial project, but would also need to be integrated with some of the other packages.
5.1 Complete Mobility packages
Complete Mobility in Calgary
Figure 10 – Complete Mobility packages for Calgary
Centre CityRegional
CommunitiesVisitor
High Speed Rail
Freight
Smart Infrastructure

31
Downtown, Calgary
Complete Mobility in Calgary
of improvement in Calgary’s transportation system based on current policies, and the strategic objectives and trends and challen-ges specific to the city.
Figure 11 and Figure 12 present two ex-amples of the linkages from Calgary’s stra-tegic objectives to the Complete Mobility packages.
Each of the packages shown have been de-veloped through research and analysis of a number of factors including the concept and vision of Complete Mobility, the areas
5.2 Developing the packages
Figure 11 – Packages supporting economic competitiveness
Strategic objective Next level objectives Mobility requirementsCentre City
package
Visitor package
Freight package
Be economically competitive
City centre place making
Valued transport options
International transport links
Freight ease of movement
Economic diversification
International competitiveness
5.0 Calgary’s future mobility scenario: Complete Mobility5.2 Developing the packages
32
Old City Hall, Calgary
Complete Mobility in Calgary
5.0 Calgary’s future mobility scenario: Complete Mobility5.2 Developing the packages
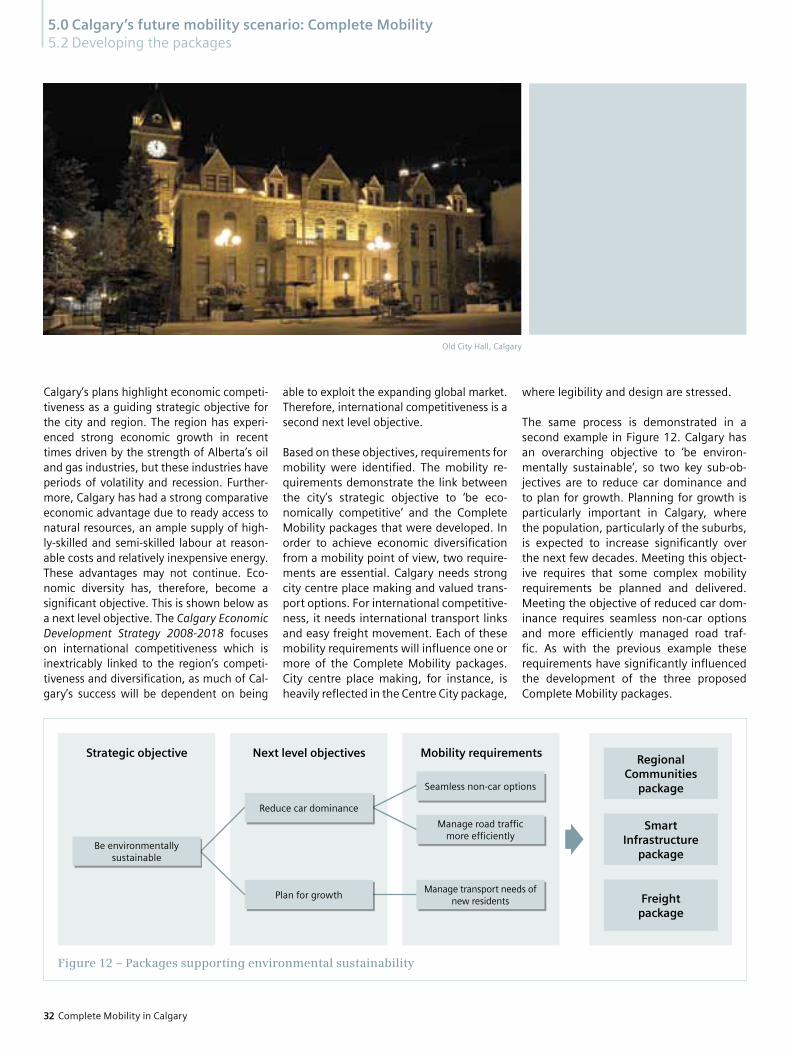
Calgary’s plans highlight economic competi-tiveness as a guiding strategic objective for the city and region. The region has experi-enced strong economic growth in recent times driven by the strength of Alberta’s oil and gas industries, but these industries have periods of volatility and recession. Further-more, Calgary has had a strong comparative economic advantage due to ready access to natural resources, an ample supply of high-ly-skilled and semi-skilled labour at reason-able costs and relatively inexpensive energy. These advantages may not continue. Eco-nomic diversity has, therefore, become a significant objective. This is shown below as a next level objective. The Calgary Economic Development Strategy 2008-2018 focuses on international competitiveness which is inextricably linked to the region’s competi-tiveness and diversification, as much of Cal-gary’s success will be dependent on being
able to exploit the expanding global market. Therefore, international competitiveness is a second next level objective.
Based on these objectives, requirements for mobility were identified. The mobility re-quirements demonstrate the link between the city’s strategic objective to ‘be eco-nomically competitive’ and the Complete Mobility packages that were developed. In order to achieve economic diversification from a mobility point of view, two require-ments are essential. Calgary needs strong city centre place making and valued trans-port options. For international competitive-ness, it needs international transport links and easy freight movement. Each of these mobility requirements will influence one or more of the Complete Mobility packages. City centre place making, for instance, is heavily reflected in the Centre City package,
where legibility and design are stressed.
The same process is demonstrated in a second example in Figure 12. Calgary has an overarching objective to ‘be environ-mentally sustainable’, so two key sub-ob-jectives are to reduce car dominance and to plan for growth. Planning for growth is particularly important in Calgary, where the population, particularly of the suburbs, is expected to increase significantly over the next few decades. Meeting this object-ive requires that some complex mobility requirements be planned and delivered. Meeting the objective of reduced car dom-inance requires seamless non-car options and more efficiently managed road traf-fic. As with the previous example these requirements have significantly influenced the development of the three proposed Complete Mobility packages.
Figure 12 – Packages supporting environmental sustainability
Strategic objective Next level objectives Mobility requirements Regional Communities
package
Smart Infrastructure
package
Freight package
Be environmentally sustainable
Seamless non-car options
Manage road traffic more efficiently
Manage transport needs of new residents
Reduce car dominance
Plan for growth

33Complete Mobility in Calgary
Trans-Canada Highway at Crowchild Trail, Calgary
5.0 Calgary’s future mobility scenario: Complete Mobility5.3 Complete Mobility package: Centre City
13 AVE
9 AVE
14 S
T
6 AVE
MAC
LEOD
TR A
ILSE
4 ST
SW
17 AVE
5 AVE
10 S
T SW
8 ST
SW
5 ST
SW
1 ST
SW
1 ST
SE
ELBO
W RIV
ER
3 AVE
7 AVE
CENT
RE S
T S
8 ST
SW
16 S
T SW
BOW RI
VER
Downtown
Stampede Park
West End
East Village
West Connaught
Eau Claire
Victorial Crossing CentreConnaught Centre
Chinatown
East Victoria Crossing
Calgary's Centre City
X:\4
86_C
entre
City
Inte
grat
ed A
ctio
n Pl
an\
Busin
ess_
Tech
_Ser
v\gi
s\m
aps
_ana
lysis
\Dra
ft_Ja
n_20
11\C
C_c
omm
uniti
es.m
xd
Stampede Grounds
N
EW
S
WestVillage
0 160 320 480 640
Meters
LegendPlan Boundary
Neighbourhoods
Downtown
Stampede Park
(As shown in the Centre City Plan)
Centre City concept from the City of Calgary’s Centre City Plan 2007
The centre city is of vital importance to Calgary’s economic success and sustain-ability. The Centre City package focuses on networks—pedestrian, cycling and tran-sit—and principles for accommodating all travel modes.
The package includes a series of measures to assist the desired movement patterns of people and vehicles through the centre city, while encouraging a higher priority for more sustainable modes. The package fully supports and compliments the City of Calgary’s Centre City Plan and Centre City Mobility Plan.
Four initiatives are included in this package:1. Transit mobility hubs and transit
oriented development2. Greener modes3. Parking management4. First step: Legible city
In combination, these will make the centre city more User focused, Efficient and Sus-tainable—essential elements of Complete Mobility.
1. Transit mobility hubs and transit oriented development Calgary’s MDP and TMP both encourage the introduction of transit oriented de-velopment to integrate land use and trans-port planning through the development of
(1) activity centres and corridors and (2) transit mobility hubs. The plans describe a transit mobility hub as:
“A place of connectivity where different modes of transportation (walking, cyc-ling, bus and rail transit), come together seamlessly and where there is an attract-ive, intensive and diverse concentration of housing, employment, shopping and other amenities around a major transit station.”
5.3 Complete Mobility package: Centre City
source: www.calgary.ca
This package strongly encourages this strategy, and highlights the potential role of hubs as places that deliver seamless interchange; ease of transit use for resi-dents and visitors; and efficient movement of both transit vehicles and passengers. Furthermore, the transit mobility hubs should be exploited to improve the legi-bility of Calgary, becoming landmarks in themselves by assisting with wayfinding throughout the centre city and beyond.

34
Calgary Zoo, Calgary
Complete Mobility in Calgary
5.0 Calgary’s future mobility scenario: Complete Mobility5.3 Complete Mobility package: Centre City
As an added benefit, there is much evi-dence that demonstrates land and property values within one kilometre of a transit sta-tion can increase 10-20 per cent purely due to the improved connectivity.
Best practiceBremen, Germany – Mobility hubs in Bre-men bring together all modes of transport in a single location, giving the user a seam-lessly integrated experience combining car sharing, taxis, cycling and public transport, as well as shops and services like child care. The management of this system is enabled by the successful coordination between the service providers. An umbrella associa-tion brings together 35 transit operators in the 4800 km2 region, including local and regional rail, buses and trams. This means one ticket, one tariff and one information system for all transport modes -- and one integrated smart card for transit, car-shar-ing, and banking needs.
2. Greener modesComplete Mobility encourages the smart use of private vehicles within a seamless sys-tem. Its aim is to achieve a balanced system where travel choices are mode neutral and people use whatever combination is best for their needs at that particular time. Where appropriate, this includes the continued use of cars, vans and trucks, using low-polluting electric or hybrid vehicles where possible. This might be particularly applicable to ser-vice vehicles such as delivery vans or taxis.
Best practiceSan Francisco, USA – In 2002 the govern-
ment of San Francisco passed a resolution calling for a citywide reduction of green-house gas emissions to 20 percent below 1990 levels by 2012. The taxi fleet then con-sisted of about 800 cabs which, when multi-plied by an average of 87 tons of carbon dioxide per year, resulted in average green-house gas emissions of 72,000 tons per year. By 2010, 55 per cent of the fleet were fuel-efficient hybrid or natural gas vehicles that had reduced gas consumption by 2.9 million gallons and greenhouse gas emissions by 35,000 tons annually. This is the equivalent of taking 4,700 passenger cars off the road.
3. Parking managementParking management allows road users to find an available spot in an efficient way. It should be used alongside a parking guid-ance system that directs road users to a parking lot with available spots.
For Calgary’s centre city, the aim is to use technology to ensure that convenient, af-fordable parking is available when and where it is needed, while also reducing the levels of congestion and increasing rev-enue for the city.
It is important that the management of parking facilities is integrated with other elements of the transport system, such as road network management and pub-lic transit operations. This would build on existing initiatives, but could also include:• A user friendly parking system to provide
an easy way to pay for parking (coins, cred-it card, and pay per minute parking card) including an extension of the parking time
with the possibility to pay at any display machine in the city or by cell phone.
• Dynamic parking regulation and charging using new technology to provide infor-mation on the availability of on- and off-street parking to avoid driving for spaces. Additionally, spaces could be charged ac-cording to demand.
• Incentives and offers to enable effect-ive parking, especially during non peak hours, and encouraging the use of al-ternatives to the car during peak hours.
Parking management can also meet other objectives. The City of Calgary is pioneering an innovative scheme to allow curb-side parking on commuter routes at off-peak times in order to encourage walking and improve vitality. This could be extended to other areas and could also be linked to the use of technologies that provide offers and incentives at local shops and services.
Pay-and-display machine
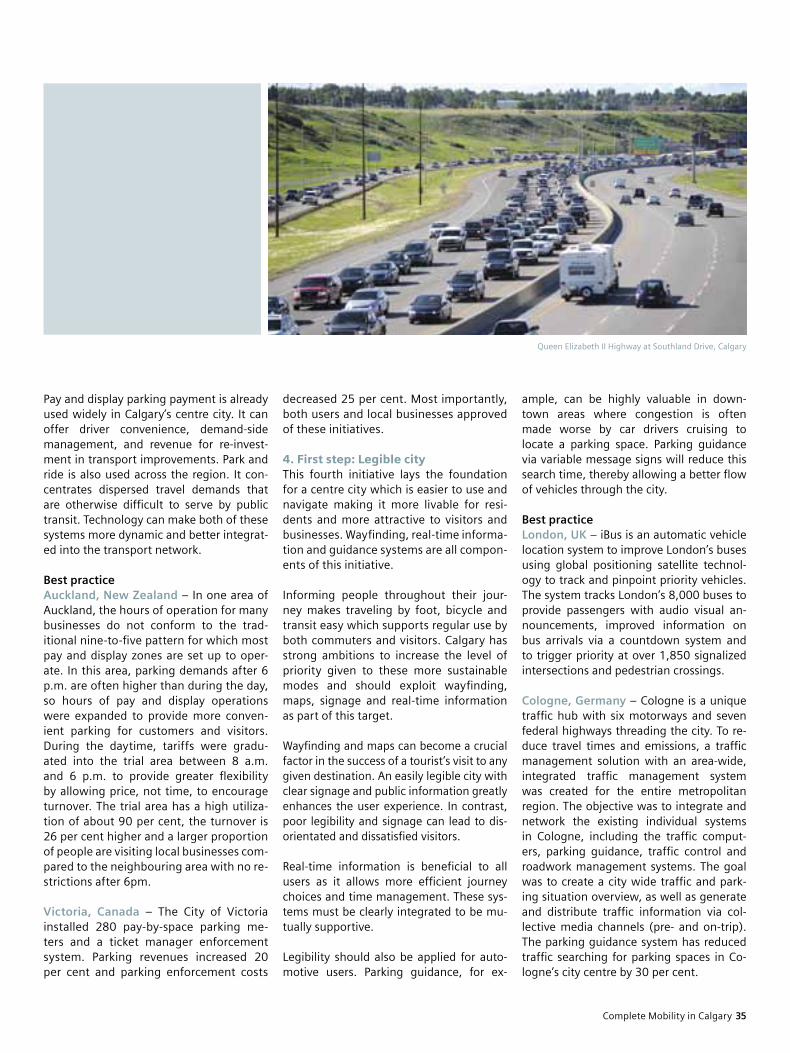
35
Queen Elizabeth II Highway at Southland Drive, Calgary
Complete Mobility in Calgary
decreased 25 per cent. Most importantly, both users and local businesses approved of these initiatives.
4. First step: Legible cityThis fourth initiative lays the foundation for a centre city which is easier to use and navigate making it more livable for resi-dents and more attractive to visitors and businesses. Wayfinding, real-time informa-tion and guidance systems are all compon-ents of this initiative.
Informing people throughout their jour-ney makes traveling by foot, bicycle and transit easy which supports regular use by both commuters and visitors. Calgary has strong ambitions to increase the level of priority given to these more sustainable modes and should exploit wayfinding, maps, signage and real-time information as part of this target. Wayfinding and maps can become a crucial factor in the success of a tourist’s visit to any given destination. An easily legible city with clear signage and public information greatly enhances the user experience. In contrast, poor legibility and signage can lead to dis-orientated and dissatisfied visitors.
Real-time information is beneficial to all users as it allows more efficient journey choices and time management. These sys-tems must be clearly integrated to be mu-tually supportive.
Legibility should also be applied for auto-motive users. Parking guidance, for ex-
ample, can be highly valuable in down-town areas where congestion is often made worse by car drivers cruising to locate a parking space. Parking guidance via variable message signs will reduce this search time, thereby allowing a better flow of vehicles through the city.
Best practiceLondon, UK – iBus is an automatic vehicle location system to improve London’s buses using global positioning satellite technol-ogy to track and pinpoint priority vehicles. The system tracks London’s 8,000 buses to provide passengers with audio visual an-nouncements, improved information on bus arrivals via a countdown system and to trigger priority at over 1,850 signalized intersections and pedestrian crossings. Cologne, Germany – Cologne is a unique traffic hub with six motorways and seven federal highways threading the city. To re-duce travel times and emissions, a traffic management solution with an area-wide, integrated traffic management system was created for the entire metropolitan region. The objective was to integrate and network the existing individual systems in Cologne, including the traffic comput-ers, parking guidance, traffic control and roadwork management systems. The goal was to create a city wide traffic and park-ing situation overview, as well as generate and distribute traffic information via col-lective media channels (pre- and on-trip). The parking guidance system has reduced traffic searching for parking spaces in Co-logne’s city centre by 30 per cent.
Pay and display parking payment is already used widely in Calgary’s centre city. It can offer driver convenience, demand-side management, and revenue for re-invest-ment in transport improvements. Park and ride is also used across the region. It con-centrates dispersed travel demands that are otherwise difficult to serve by public transit. Technology can make both of these systems more dynamic and better integrat-ed into the transport network.
Best practiceAuckland, New Zealand – In one area of Auckland, the hours of operation for many businesses do not conform to the trad-itional nine-to-five pattern for which most pay and display zones are set up to oper-ate. In this area, parking demands after 6 p.m. are often higher than during the day, so hours of pay and display operations were expanded to provide more conven-ient parking for customers and visitors. During the daytime, tariffs were gradu-ated into the trial area between 8 a.m. and 6 p.m. to provide greater flexibility by allowing price, not time, to encourage turnover. The trial area has a high utiliza-tion of about 90 per cent, the turnover is 26 per cent higher and a larger proportion of people are visiting local businesses com-pared to the neighbouring area with no re-strictions after 6pm.
Victoria, Canada – The City of Victoria installed 280 pay-by-space parking me-ters and a ticket manager enforcement system. Parking revenues increased 20 per cent and parking enforcement costs
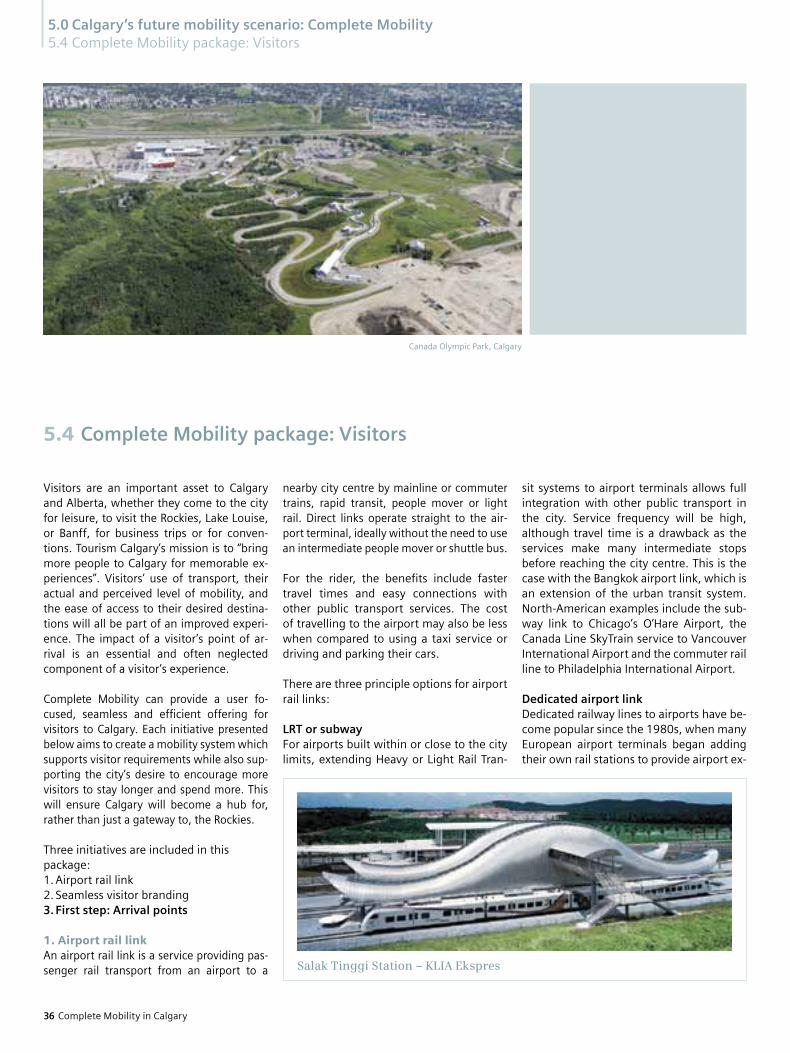
36 Complete Mobility in Calgary
Canada Olympic Park, Calgary
5.0 Calgary’s future mobility scenario: Complete Mobility5.4 Complete Mobility package: Visitors
Visitors are an important asset to Calgary and Alberta, whether they come to the city for leisure, to visit the Rockies, Lake Louise, or Banff, for business trips or for conven-tions. Tourism Calgary’s mission is to “bring more people to Calgary for memorable ex-periences”. Visitors’ use of transport, their actual and perceived level of mobility, and the ease of access to their desired destina-tions will all be part of an improved experi-ence. The impact of a visitor’s point of ar-rival is an essential and often neglected component of a visitor’s experience.
Complete Mobility can provide a user fo-cused, seamless and efficient offering for visitors to Calgary. Each initiative presented below aims to create a mobility system which supports visitor requirements while also sup-porting the city’s desire to encourage more visitors to stay longer and spend more. This will ensure Calgary will become a hub for, rather than just a gateway to, the Rockies. Three initiatives are included in this package:1. Airport rail link2. Seamless visitor branding 3. First step: Arrival points
1. Airport rail linkAn airport rail link is a service providing pas-senger rail transport from an airport to a
nearby city centre by mainline or commuter trains, rapid transit, people mover or light rail. Direct links operate straight to the air-port terminal, ideally without the need to use an intermediate people mover or shuttle bus.
For the rider, the benefits include faster travel times and easy connections with other public transport services. The cost of travelling to the airport may also be less when compared to using a taxi service or driving and parking their cars.
There are three principle options for airport rail links:
LRT or subwayFor airports built within or close to the city limits, extending Heavy or Light Rail Tran-
5.4 Complete Mobility package: Visitors
sit systems to airport terminals allows full integration with other public transport in the city. Service frequency will be high, although travel time is a drawback as the services make many intermediate stops before reaching the city centre. This is the case with the Bangkok airport link, which is an extension of the urban transit system. North-American examples include the sub-way link to Chicago’s O’Hare Airport, the Canada Line SkyTrain service to Vancouver International Airport and the commuter rail line to Philadelphia International Airport.
Dedicated airport linkDedicated railway lines to airports have be-come popular since the 1980s, when many European airport terminals began adding their own rail stations to provide airport ex-
Salak Tinggi Station – KLIA Ekspres

37Complete Mobility in Calgary
Canada Olympic Park, Calgary
press, intercity and commuter trains to take passengers directly to the check-in halls. In some cases, this has required the construc-tion of all-new lines. In others, it has been possible to serve airports with short spurs connected to existing lines. The latter is the case with the rail link between Toronto Union Station and Pearson International Airport, which is now under construction.
Integration with intercity servicesIntegration with intercity services has pro-duced alliances where airlines are able to sell flight tickets in combination with con-necting rail services. In Central Europe, do-mestic and international HSR services oper-ate directly to and from some major airports.
Other airports have instead opted for air-port express trains dedicated to high speed transport from the airport to the city cen-tre. This option is often selected where the airport is located outside the urban area and far from the mass transit system, such as the Flytoget trains serving Oslo’s inter-national airport. Other airports are served by both express trains and rapid transit, such as London’s Heathrow Airport.
Visitors arriving at Calgary International Airport should have a choice of ground transportation options. There is currently a trial of a dedicated bus route to downtown, but this uses the main highways and could become caught up in traffic congestion. To allow for a more reliable and attractive connection, an LRT expansion could be
provided. In the longer term, a dedicated airport rail link should be considered. Not only would this provide direct, fast access to and from the airport, but it would also reduce congestion in the city and at the air-port drop-off areas.
Best practiceCologne/Bonn Germany – The airport link is an integral part of the Cologne – Rhine/Main high speed line, reducing the travel time between the airport and the cities of Cologne and Bonn. With its new rail link, the airport has become a model of an inter-modal transport link. Nowhere else does the transfer between air, train and car entail such short distances; passengers walk only 100 metres between the terminal, station or multi-storey car park. Bangkok, Thailand – Air passengers check-in at the city rail station and travel to the airport in comfort on the airport ex-press trains without having to carry their bags. This allows for a more seamless jour-ney for all travellers, but particularly for the elderly, disabled and mobility impaired.
Kuala Lumpur, Malaysia – The 57-km route in the Malayan capital links Kuala Lumpur International Airport (KLIA) with the main downtown station in only 28 minutes. Ser-vice is provided by KLIA Express trains that provide non-stop service and KLIA transit commuter trains, which make three inter-mediate stops and have no robust internal fittings and a generous amount of standing
room. Both types of trains are technically identical except for the internal fittings, so that rational maintenance is possible.
In order to meet the demands made by the growing numbers of passengers, the trains consist of multiple unit rolling stock which can be easily expanded according to de-mand. Baggage may be checked in and re-trieved at the downtown Kuala Lumpur Cen-tral Station, so that train passengers only need to take their hand baggage with them.
2. Seamless visitor brandingIncreasing tourist numbers and associated spending is a priority for Calgary. This pack-age recognizes that visitors (both leisure
Makkasan station baggage check-in – Bangkok

38
5.0 Calgary’s future mobility scenario: Complete Mobility5.4 Complete Mobility package: Visitors
Complete Mobility in Calgary
and business) have different needs com-pared to residents. On arrival, they may not know how to travel between the airport and the city, where their hotel is located or which attractions are available. There needs to be good provision of informa-tion regarding all aspects of a visitor’s stay before they arrive. The www.visitcalgary.com website is a good start to this. There should also be appropriate information for visitors at their point of arrival, hotels and activity centres. The city should consider how to integrate marketing efforts and of-ferings across different visitor services. For example, there might be a joint ticket for use at tourist attractions and on transit.
One possibility to achieve this integration is to use a city visitor smart card. This would offer significant benefits:
• Track visitor spending – It would provide valuable insight into purchasing behav-iour and trends, and provide evidence of the effectiveness to government.
• Target visitor services – Calgary could tar-get services to individuals based on their demographic profile, adding value to marketing and promotional efforts.
• Increase spending – Calgary could seg-ment the market and offer information on those services and attractions that are likely to be of most interest to individuals.
• Shape behaviour – It can be used to actively shape visitor behaviour and manage de-mands for different attractions and services.
• Grow the market – It can be used to ex-pand the market into other sectors, such as visitor/delegate families and friends.
Best practiceAmsterdam, The Netherlands – Amster-dam has developed “I amsterdam”. This motto creates the brand for the city and people of Amsterdam. The key to this is an “I amsterdam” card, which provides visitors with free access to museums, reduced-fare public transit and maps of the city.
Potential application: Calgary StampedeThe Calgary Stampede is one of the most important annual attractions for visitors. In 2012, the Stampede will mark its 100th an-niversary and is expected to draw increased attendees and worldwide media attention. The organizers are also promoting it as “a remarkable opportunity for commun-ity groups and businesses to leverage the national and international spotlight. The Stampede is encouraging all local organiza-tions to participate in their own way.”
Attracting 1,174,697 visitors in 2011, the Stampede is not only a major tourism driv-er, it is also a huge economic driver for the region. It is reported that “the Stampede’s
economic impact is substantial with park visitors annually spending an estimated $345 million in Alberta, of which $300 million is spent in Calgary supporting local hotels, restaurants, retail shops and other businesses.” In addition to this, the Stam-pede also generates millions of dollars in uncalculated economic value by attracting events such as trade and consumer shows.
Transport and mobility are an important part of the smooth operation of the Stam-pede. Easy and safe access around Calgary is necessary if the maximum possible eco-nomic value is to be extracted from it each year. Not only will this keep leisure visitors coming back year after year, it will also con-tinue to attract businesses holding supple-mentary events and trade shows during the Stampede. This may become more dif-ficult if numbers increase significantly dur-ing the centennial event. Calgary Transit works hard to move visitors from the air-port to downtown and between hotels, the
Stampede Park, Calgary

39Complete Mobility in Calgary
Crowchild Trail at Memorial Drive, Calgary
Stampede ground and other venues. An ex-tra 4,000 hours of service are provided dur-ing the 10 days of the Calgary Stampede, including 24-hour C Train service and dedi-cated express bus services.
The potential application, therefore, is the development of a Stampede smart card, which would act as an ID card, hold visitors’ event tickets, be used for transit payments and allow small purchase payments.
3. First step: Arrival pointsA vitally important aspect of the mobility sys-tem in a thriving city is the image and vitality of its transport hubs including gateways such as airports and rail and bus stations. Their function as attractive and welcoming arrival points directly contribute to the attractive-ness of the city and they send a strong mes-sage about its overall success, whether inten-tional or not. From a visitor’s perspective, the identity of a city is often defined by the qual-ity of its key transport nodes, particularly if they are highly-visible structures. The provi-sion of arrival points which create a positive city image for both new visitors and regular travellers alike, as well as offering a safe and secure environment, is crucial for the con-tinued success of Calgary.
The over-riding vision for the city of Cal-gary is to become a modern, world-class
city. There is recognition of the need for economic diversification and a desire to make Calgary a more attractive, livable place. The role of arrival points in achieving these goals cannot be underestimated, as these gateways form the visitor’s first and most lasting impression of the city. They also demonstrate a commitment to a qual-ity mobility system that has a huge advan-tage, especially if the city wants to attract inward investment to boost the economy.
Arrival points can be iconic landmarks which welcome visitors to cities, send the message the city wants to generate and move people in comfort and safety to the downtown heart ,as well as offering visitors an exciting yet efficient arrival ex-perience. World class arrival points impress businesses and people looking at the city as a place to settle. This supports the immi-gration needed for a growing and diversi-fying economy. As well as impressing new arrivals to a city, successful arrival points can help existing residents through the cre-ation of a vibrant and exciting city to live in.
Best practiceNew York, USA – Grand Central Terminal is one of the worlds greatest and most famous arrival points. Its iconic Main Con-course is a visitor destination and tourist attraction in its own right. The message it
sends is that one has arrived in an import-ant, powerful world city.
Berlin, Germany – Berlin’s Central Sta-tion provides an example of how to fit a new station into existing urban fabric. It was completed in 2006 and occupies the former border between East and West Ger-many. With a population of five million people in the greater metropolitan area, the station serves about 350,000 passen-gers per day, has 860 underground park-ing spaces and creates connections to the city, the station plaza and the Spree River. New development within a mile of the sta-tion includes retail, office, and hotel uses in the 4.3-acre Station Quarter. In addition, there is the planned 40-acre EuropaCity to the north of the station, which is being developed by a public-private partnership. The six neighborhoods of EuropaCity will include 6.5 million square feet of residen-tial, office, retail and cultural space.

40 Complete Mobility in Calgary
5.0 Calgary’s future mobility scenario: Complete Mobility5.5 Complete Mobility package: Regional Communities
5.5 Complete Mobility package: Regional Communities
It is expected that the metropolitan popula-tion of Calgary will grow rapidly over the next few decades and much of this popu-lation growth will be in the regional com-munities such as Airdrie, Cochrane and Strathmore. There are important travel im-plications arising from this growth. Many of the people currently living in, or relocat-ing to, these communities will commute to other communities or to downtown for work. The level of inter-municipal trips will increase and it will be unsustainable in the long term. While most of the regional communities have their own local transit services, links between them are poor. Between Airdrie and downtown Calgary, there is only one scheduled peak-hour service.
The initiatives within this package will pro-vide attractive mobility options upon which to build a culture of transit use and vibrant transit oriented design. Without these links, congestion on the roads between the communities and to key nodes such as the airport will worsen, damaging the success of Calgary.
There are two initiatives included in this package:1. Commuter rail2. First step: e-BRT
1. Commuter railThe CRP’s transit plan focuses on the use of express bus services between the regional communities and downtown to begin the process of building a transit culture. These will contribute towards the needs we have
identified. However, there is a risk with this approach. If the requirements and desires of potential transit users are not met, demand will remain low. The highest quality service should be offered; especially for transit run-ning on a dedicated lane or on rail.
Calgary Regional Partnership commute distances
Wheatland County
Strathmore
ChestermereTsuu T’inaNation
RedwoodMeadows
Canmore
Cochrane
Calgary
InternationalAirport
Airdrie
CrossfieldMunicipalDistrict ofBighorn Municipal
District ofRocky View
Banff
MunicipalDistrict ofFoothills
HighRiver
TurnerValley Black
Diamond
Nanton
Okotoks
22x 22x
2
2
2
24
25
2a
2a
7
22
22
22
1A
1
1
9
72
1
22
8 1A
Commute distancesto downtown Calgary25 km
50 km
100 km
source: calgary regional partnership
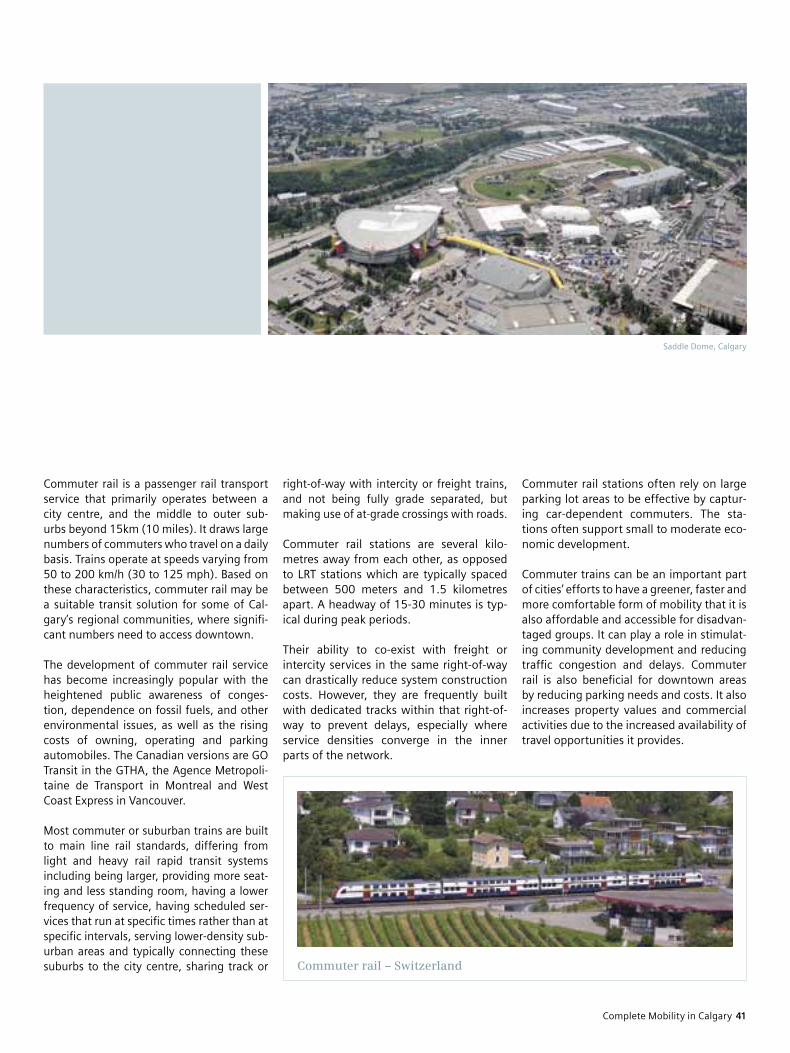
41Complete Mobility in Calgary
Saddle Dome, Calgary
Commuter rail is a passenger rail transport service that primarily operates between a city centre, and the middle to outer sub-urbs beyond 15km (10 miles). It draws large numbers of commuters who travel on a daily basis. Trains operate at speeds varying from 50 to 200 km/h (30 to 125 mph). Based on these characteristics, commuter rail may be a suitable transit solution for some of Cal-gary’s regional communities, where signifi-cant numbers need to access downtown.
The development of commuter rail service has become increasingly popular with the heightened public awareness of conges-tion, dependence on fossil fuels, and other environmental issues, as well as the rising costs of owning, operating and parking automobiles. The Canadian versions are GO Transit in the GTHA, the Agence Metropoli-taine de Transport in Montreal and West Coast Express in Vancouver.
Most commuter or suburban trains are built to main line rail standards, differing from light and heavy rail rapid transit systems including being larger, providing more seat-ing and less standing room, having a lower frequency of service, having scheduled ser-vices that run at specific times rather than at specific intervals, serving lower-density sub-urban areas and typically connecting these suburbs to the city centre, sharing track or
right-of-way with intercity or freight trains, and not being fully grade separated, but making use of at-grade crossings with roads.
Commuter rail stations are several kilo-metres away from each other, as opposed to LRT stations which are typically spaced between 500 meters and 1.5 kilometres apart. A headway of 15-30 minutes is typ-ical during peak periods.
Their ability to co-exist with freight or intercity services in the same right-of-way can drastically reduce system construction costs. However, they are frequently built with dedicated tracks within that right-of-way to prevent delays, especially where service densities converge in the inner parts of the network.
Commuter rail stations often rely on large parking lot areas to be effective by captur-ing car-dependent commuters. The sta-tions often support small to moderate eco-nomic development.
Commuter trains can be an important part of cities’ efforts to have a greener, faster and more comfortable form of mobility that it is also affordable and accessible for disadvan-taged groups. It can play a role in stimulat-ing community development and reducing traffic congestion and delays. Commuter rail is also beneficial for downtown areas by reducing parking needs and costs. It also increases property values and commercial activities due to the increased availability of travel opportunities it provides.
Commuter rail – Switzerland

42 Complete Mobility in Calgary
Glenmore Trail at Barlow Trail, Calgary
Best practiceLondon, UK – Thameslink is a key com-ponent of London’s commuter rail sys-tem. As part of a £6 billion expansion program, 1,200 new cars will be built for Thameslink. These will be used to increase the current train lengths, providing sig-nificantly greater capacity and allowing for faster boarding and alighting. The new trains will have more spacious inter-iors and will be lighter and more energy-efficient. They will cause less wear to the track, allow for faster acceleration and braking, and be more reliable. Their de-sign also makes them easier to clean and maintain. Passenger information systems fed with real-time travel information will be mounted within the car. Additionally, passenger loading information will be transmitted to central London platforms to advise people where to stand so they can board cars with the most space.
2. First step: e-BRTe-BRT is the acronym for electrical Bus Rap-id Transit. It is the intermediate solution be-tween conventional Bus Rapid Transit (BRT) using fossil fuels and electric LRT. Similar to LRT, e-BRT has a greener carbon footprint and lower maintenance requirements than conventional BRT. However, its capital and operating costs are lower than LRT. In addi-tion, it has the same advantages as the conventional BRT systems, such as shorter headways, relatively easy and fast imple-mentation, and simple stations.
Calgary’s regional communities require suitable transit options to remain sustain-able in the long term. Commuter rail is a good option for medium-distance journeys between the regional communities and downtown. e-BRT can provide a relevant solution for local transit services. It could be used for both travel within the regional communities or between nearby suburbs, forming an important part of a high quality network valued by citizens.
To cope with growing transportation de-mands and the implementation of a new system, transit authorities must consid-er many factors including the available budget, current and planned capacity, fu-ture operation and maintenance costs, and sustainability. Selecting the correct trans-portation system is critical for regional de-
velopment. One of the key considerations is matching the capacity of the system type to the anticipated ridership per hour in each direction. With that quantity, and with the mean distance between stops or stations, Figure 13 indicates what system or combination of systems will satisfy a region’s transportation needs. The overlap areas indicate there is no unique solution and the system selection should also con-sider the other above mentioned factors. A final factor of equal importance is the en-vironmental impact on the region and its inhabitants. Given all these factors, a good solution for a system with short distance journeys is e-BRT.
e-BRT is based on an extremely energy-effi-cient electric traction system consisting of a state-of-the-art regenerative set of inverter
Commuter rail – United Kingdom
5.0 Calgary’s future mobility scenario: Complete Mobility5.5 Complete Mobility package: Regional Communities

43Complete Mobility in Calgary
Queen Elizabeth II Highway at Barlow Trail, Calgary
and motor together with an onboard elec-tric energy storage unit using super-cap-acitors and batteries. An e-Bus is a silent, comfortable vehicle that is pollution-free. An e-BRT system has no overhead lines and can be guided or not, meaning it can oper-ate with or without driver intervention.
The energy storage unit is first charged at the maintenance facility and replenished in less than 20 seconds at bus stops where re-charging substations are located. The main requirements for the implementation of an e-BRT system would be civil works for the stations and depot, a local bus manufac-turer, the electric drive-motor set manufac-turer and a fare collection system.
The e-Bus is a low-floor vehicle with pos-itioning for level boarding for handicapped persons and wheelchairs, providing com-fort and accessibility to everyone. It may be equipped with passenger informa-tion and communication as directed by an operations control center. For difficult situations such as power outages, an emer-gency generator is always included. It also is compatible with conventional overhead wire systems used for trolley buses.
e-BRT is the perfect “green start” that can lead to an LRT system once an appropri-ate ridership has been reached. With ad-equate design and sizing, the bus stop substations may be reused for the future LRT vehicles.
Charging e-BRT at bus stop
100,000
Pass
eng
ers
per
ho
ur
and
dir
ecti
on
50,000
25,000
10,000
1 km 10 km Mean distance between stops
System capacityThe system’s maximum capacity isdetermined by the amount of passengersper hour and the direction at peak hour.
Subway
LRT
e-BRT
Commuter train
Intercity train
Figure 13 – Adequate system selection

44 Complete Mobility in Calgary
5.0 Calgary’s future mobility scenario: Complete Mobility5.6 Complete Mobility package: Freight
Efficient and reliable goods movement and distribution is economically vital to the Cal-gary Census Metropolitan Area. There is a need to reduce the conflict between freight and passenger transport.
There are three initiatives in this package:1. Freight traffic management2. Freight consolidation centres3. First step: Last mile delivery
1. Freight traffic managementFreight movement is essential to the life of any city. External connections are vital for trade, while internal connections allow the
distribution of the goods that a city produ-ces and consumes. Effective freight traffic management ensures a city can be sup-ported logistically without compromising the needs of other users.
This is particularly true in Calgary. The Calgary Economic Development Strategy explains:
“Calgary’s geographic location in Western Canada and its integrated multi-modal transportation and logistics infrastructure has also contributed to it becoming a centre for an increasing number of transportation
and warehousing operations. This includes an expanding international air cargo and passenger hub operation at Calgary Inter-national Airport, rail and intermodal auto and trainload facilities from both Canadian Pacific Railway and Canadian National serv-ing every major city in North America, and access to the Canamex ’smart corridor’ that runs between Alaska and Mexico City.”
This growing role as a logistics hub and freight interchange centre is important for the current economic performance of the region and as an enabler of future econom-ic diversification.
5.6 Complete Mobility package: Freight
Consolidation centres – Mexico City

45Complete Mobility in Calgary
Nose Hill Drive at 87th Street, Calgary
Freight traffic management systems en-hance the awareness of current traffic con-ditions for port personnel, the public and especially truckers and their dispatchers. They facilitate navigation around incidents and efficient evacuation if needed. These systems enhance coordination of traffic management activities done by the various operating agencies by gathering historical data for use in performance monitoring and facilities planning.
In order to implement functional and ef-ficient freight traffic management, these topics must be considered:• Vehicle detectors to measure traffic flow• License plate readers to measure link
travel times (especially on non-freeways) and gather origin-destination data
• CCTV cameras for remote viewing• Changeable message signs for incident
information to motorists• Web-based real-time information for all users• Data exchange with other transportation
management systems• Data availability to travel information
services
Adaptive freight traffic management, re-sponsive to city traffic demands, will en-sure a reliable and efficient system.
Best practicePort of Long Beach California, USA – With approximately 18 million residents in the vicinity, the Port of Long Beach is one the largest ports in the United States and is one
of the world’s busiest seaports. Together with the Port of Los Angeles, both ports handle more than 40 per cent of the na-tion’s containerized imports. The success of the port’s sustained growth relies on a well coordinated transportation system.
The Port of Long Beach and the City of Los Angeles cooperate to enhance the real-time traffic management in and around the port area. They also provide real-time trav-eller information regarding arterials and freeways around the port area to the truck-ing community and the travelling public.
The planned Advanced Transportation Management Information System (ATMIS) will be composed of computer software communicating with various field devices, with other computer systems, and with human operators. This will enable better monitoring and management of roadway conditions, and especially truck traffic, on the roadways within and surrounding the Port of Long Beach and Los Angeles.
ATMIS will be used by operations person-nel at both ports and will provide data to Caltrans, the cities of Los Angeles and Long Beach, trucking company dispatchers and other interested parties, including port ter-minal operators. The web-based user inter-face and alerts by e-mail and text messages will keep users informed of current condi-tions on roadways in the port area, including current traffic volumes and speeds, incidents and current and planned lane closures. Au-
thorized users will be able to view live video feeds from roadside cameras in the area and view information about current conditions and incidents, on a map-based web page. Data collected from field devices on port property will be made available to regional data sharing systems, including the Metro-politan Transportation Authority’s Regional Integration of Information Technology Sys-tems (RIITS) and Los Angeles County’s Infor-mation Exchange Network (IEN).
2. Freight consolidation centresA thriving city attracts more businesses, which require a greater and more diverse quantity of goods. New suppliers need to make deliveries to new businesses, in addi-tion to the current suppliers already mak-ing existing deliveries. This increased de-mand for deliveries requires more vehicles on the road, which ultimately strains the road network.
One way to combat this challenge is to better coordinate the flow of goods in and around the downtown area. Freight consolidation centres aim to reduce single-item deliveries by providing a facility in which part loads, destined for the same locality, are collected at strategic locations outside the city centre and then sent to their final destination using a smaller number of full delivery trucks.
At smart consolidation centres, the part-full vehicles drop off their loads using bulk unloading technologies to speed up this process. Once inside the consolidation cen-

46 Complete Mobility in Calgary
5.0 Calgary’s future mobility scenario: Complete Mobility5.6 Complete Mobility package: Freight
Glenmore Trail at 84th Street,Calgary
tre, items are tagged for easier identifica-tion and location. Goods destined for the same location are then sorted and gathered into complete shipments, decreasing the number of trips to each destination. These complete shipments can then be stored in depots located strategically around the city until required by the end consumer. Final-ly, the consolidated shipments are loaded onto a delivery truck and organized accord-ing to its delivery route, so that the last load in is the first load out.
Both suppliers and retailers benefit from the use of consolidation centres through the creation of a more efficient and reliable supply chain. Businesses have increased control over their deliveries and are able to more closely monitor the expected delivery times of their shipments, making their in-ternal processing more streamlined.
By simplifying freight distribution, consoli-dation centres can provide many benefits to the wider city environment and the citizens living within it. By reducing the number of vehicle trips, they decrease traffic conges-tion, cut carbon emissions and minimize noise and air pollution. Ultimately, the ef-fective use of consolidation centres can al-low a city to raise its image and increase its competitiveness.
Best practiceLondon, UK – The London Construction
Consolidation Centre (LCCC) focuses on construction traffic by providing on-time supply, with a smaller amount of deliveries to the construction sites. The LCCC has been successful in reducing the number of construction vehicles entering the City of London and in reducing the number of vehicles delivering to other sites served by the LCCC. The number of vehicles has been reduced by 68 per cent and supplier jour-ney times have been reduced by two hours (including loading and unloading at the LCCC). Due to the reduction in vehicle trav-el, CO2
emissions have reportedly reduced by about 75 per cent.
3. First step: Last mile deliveryMany goods, before arriving at their final destination, pass through a very long and complex distribution network. In such cases, the long distance portion of the de-livery is typically well serviced by high cap-acity modes and terminals.
The real challenge with freight distribution is how to approach the last mile. This re-fers to the final link within a distribution network, specifically the connection that delivers the goods to the retailer or final consumer. Within this last mile, a single customer will seldom be the consignee for
City logistics, general concept source: china development institute/dhl/siemens

47Complete Mobility in Calgary
Ogden Shops Rail Yard, Calgary
an entire container. Therefore, that con-tainer must be broken down into smaller loads and delivered to various locations throughout a city by many different trucks.
Ineffective final mile distribution can in-crease the number of vehicles in the city, harm the environment and damage the quality of the local public realm. From the perspective of Complete Mobility, a focus on the needs of end-users is particularly important in designing a logistics chain to distribute both commercial goods to busi-nesses and domestic items, such as grocer-ies, to local residents. The development of a flexible, seamless system which can directly deliver time-critical items to any city location as required, yet also store less-urgent consignments in a network of local holding centres for later collection by the user, is essential for achieving a successful and sustainable city.
Calgary wants to be a world-class city per-ceived as modern and sophisticated. In order to make the city more economically competitive, as well as a more attractive place to live, freight delivery issues must be addressed in a manner which is more efficient for business and more sustainable in terms of energy and emissions. The ef-fective movement of goods around a city is vitally important to create a successful logistics system capable of serving a thriv-ing economy in a sustainable manner.
By creating a smart system for last mile deliveries, it is possible to reduce traffic congestion in the downtown area, to cut the city’s overall carbon footprint and to improve the quality of the urban environ-ment through reduced emissions and noise pollution. These benefits are greatly increased when coupled with an effective coordination system to manage the fleet of delivery vehicles and schedule deliv-eries efficiently. One of the key aspects in improving the sustainability of last mile deliveries is the use of fewer, more environmentally friend-
ly vehicles. Electric and hybrid vehicles, with a variety of different sizes, distance ranges and carrying capacities, are par-ticularly suitable for addressing the varying needs of a truly flexible and integrated last mile delivery system.
Best practiceDresden, Germany – The CarGo Tram is a system used by Volkswagen to transport car parts across the city centre between the local logistics centre and the factory. It uses a specially designed freight tram running over infrastructure normally used to move passengers.
CarGo Tram

48 Complete Mobility in Calgary
CPR Alyth Yard, Calgary
5.0 Calgary’s future mobility scenario: Complete Mobility5.7 Complete Mobility package: Smart Infrastructure
This package will provide the base upon which to build Complete Mobility in Cal-gary. The proactive management of the mobility network will ensure a balanced system within which transit is an attractive choice for travellers and traffic is managed to minimize congestion.
The smart infrastructure suggested for Cal-gary would enable collection and collation of data from across the transport network. The resulting information and control systems can be used to proactively manage the sys-tem, as well as provide accurate and timely travel information to users, operators and managers. This will make the system more efficient and effective.
There are two initiatives in this package:1. Integrated smart ticketing2. First step: Multi-modal traffic
management
1. Integrated smart ticketingSmart ticketing is the glue that binds the various elements of a multi-modal trans-port system. Multi-modal integration can be greatly enhanced by the ability to pay for different transport services, such as parking and transit, using the same smart device.
Smart ticketing incorporates a wide range of features to cater to today’s demanding
5.7 Complete Mobility package: Smart Infrastructure
users, such as sophisticated cashless pay-ments, secure access passes, price dis-counts, bonus points, loyalty schemes and security systems.
In the setting of a multi-modal transport system, the smart card can be programmed with public transport passes, driver’s license details and parking credits. It could also of-fer the following non-transport applications:
• E-payment – cashless transactions at convenience, grocery and other stores.
• Secure access – residential, venue and business facilities entrance
• Mobile ticket – event electronic purchase and validation of tickets for transit sys-tems, venues and events
• Parking – lot and venue parking• VIP – exclusive access to certain zones or
services at facilities, venues and parking
Smart ticketing applications
Traffic and public transportation
Harbor
Airport
Healthcare
Financial services
Public administration Education
Waste / Wastewater
Building technology
Energy and envi-ronmental care
Metropolitan and event security
Sports venues, fairs and sites
Lighting
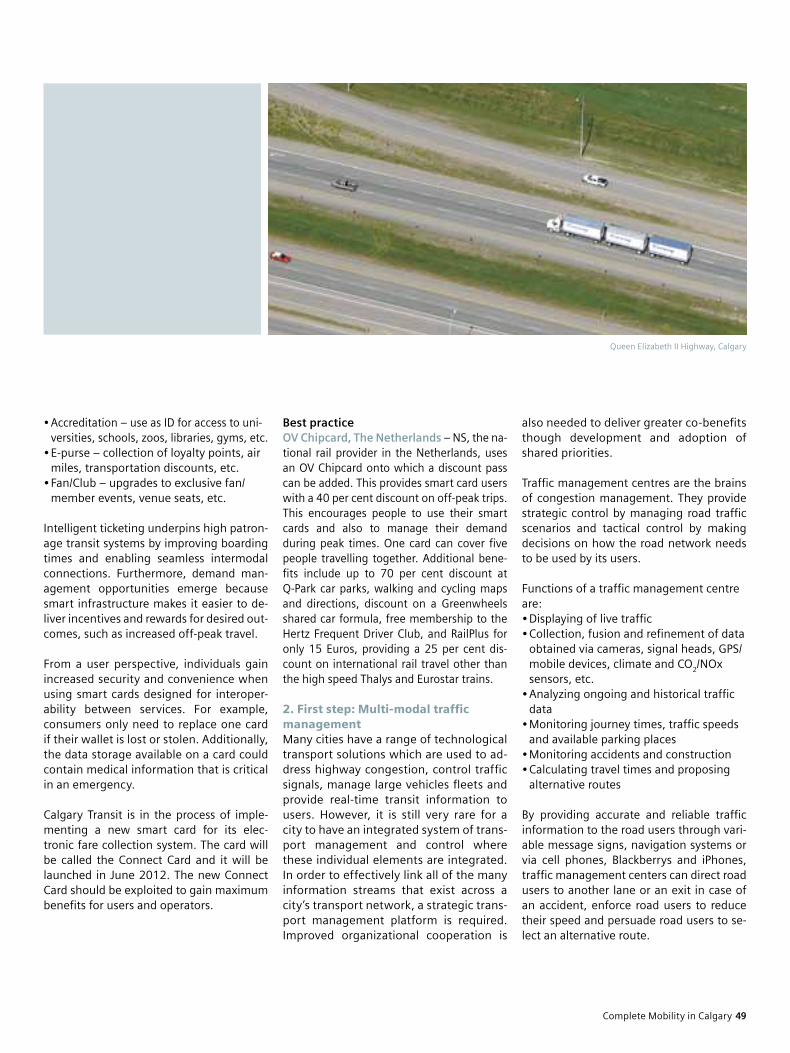
49Complete Mobility in Calgary
Queen Elizabeth II Highway, Calgary
• Accreditation – use as ID for access to uni-versities, schools, zoos, libraries, gyms, etc.
• E-purse – collection of loyalty points, air miles, transportation discounts, etc.
• Fan/Club – upgrades to exclusive fan/member events, venue seats, etc.
Intelligent ticketing underpins high patron-age transit systems by improving boarding times and enabling seamless intermodal connections. Furthermore, demand man-agement opportunities emerge because smart infrastructure makes it easier to de-liver incentives and rewards for desired out-comes, such as increased off-peak travel.
From a user perspective, individuals gain increased security and convenience when using smart cards designed for interoper-ability between services. For example, consumers only need to replace one card if their wallet is lost or stolen. Additionally, the data storage available on a card could contain medical information that is critical in an emergency.
Calgary Transit is in the process of imple-menting a new smart card for its elec-tronic fare collection system. The card will be called the Connect Card and it will be launched in June 2012. The new Connect Card should be exploited to gain maximum benefits for users and operators.
Best practiceOV Chipcard, The Netherlands – NS, the na-tional rail provider in the Netherlands, uses an OV Chipcard onto which a discount pass can be added. This provides smart card users with a 40 per cent discount on off-peak trips. This encourages people to use their smart cards and also to manage their demand during peak times. One card can cover five people travelling together. Additional bene-fits include up to 70 per cent discount at Q-Park car parks, walking and cycling maps and directions, discount on a Greenwheels shared car formula, free membership to the Hertz Frequent Driver Club, and RailPlus for only 15 Euros, providing a 25 per cent dis-count on international rail travel other than the high speed Thalys and Eurostar trains.
2. First step: Multi-modal traffic managementMany cities have a range of technological transport solutions which are used to ad-dress highway congestion, control traffic signals, manage large vehicles fleets and provide real-time transit information to users. However, it is still very rare for a city to have an integrated system of trans-port management and control where these individual elements are integrated. In order to effectively link all of the many information streams that exist across a city’s transport network, a strategic trans-port management platform is required. Improved organizational cooperation is
also needed to deliver greater co-benefits though development and adoption of shared priorities.
Traffic management centres are the brains of congestion management. They provide strategic control by managing road traffic scenarios and tactical control by making decisions on how the road network needs to be used by its users.
Functions of a traffic management centre are:• Displaying of live traffic• Collection, fusion and refinement of data
obtained via cameras, signal heads, GPS/mobile devices, climate and CO
2/NOx
sensors, etc.• Analyzing ongoing and historical traffic
data• Monitoring journey times, traffic speeds
and available parking places• Monitoring accidents and construction• Calculating travel times and proposing
alternative routes
By providing accurate and reliable traffic information to the road users through vari-able message signs, navigation systems or via cell phones, Blackberrys and iPhones, traffic management centers can direct road users to another lane or an exit in case of an accident, enforce road users to reduce their speed and persuade road users to se-lect an alternative route.

50 Complete Mobility in Calgary
5.0 Calgary’s future mobility scenario: Complete Mobility5.7 Complete Mobility package: Smart Infrastructure
Downtown, Calgary
The City of Calgary already has several in-telligent transport initiatives in existence such as Calgary Transit’s Teleride system to inform riders of bus schedules, a Road Weather Information System (RWIS) to provide continuous information on local climate conditions, and the Management Information System for Transportation (MIST) to monitor and control the traffic signal network.
The key justification for combining existing smart transport systems and their associated information streams is to make the most efficient use of a city’s existing transportation infrastructure and to lock-in the benefits of all past and future trans-port investments. From a user perspective the networks for each different transport mode should be fully-integrated into one seamless easy-to-use system which in-corporates elements such as local and inter-city transit information, urban traffic control, downtown parking guidance, as well as freeway traffic management. The system should also maximize opportun-ities for future developments such as the incorporation of smart-card technologies to provide incentives for altering travel be-haviours as required by the operation and performance of the whole transport sys-tem at any given time.
Best practiceThe Ruhr, Germany – The traffic supervision system in the Ruhr can integrate a range of transport infrastructure components from roads, multi-storey car parks and highways, to buses and railways. It can manage ex-tremely high traffic volumes in very large conurbations and during one-off events such as high-profile sporting fixtures. The system can incorporate elements including GIS mapping, automatic plate recognition, video surveillance, network operational control, air quality monitoring, parking guidance, automatic incident detection and roadwork
management. However, the system is more than just the sum of its parts, as there is significant benefit in having these separate modules integrated together by one flexible and open management platform. Toronto, Canada – After the installation of the traffic management centre in Toronto which manages the 75 busiest intersec-tions of the city, travel time was reduced by 8%, vehicle stops were reduced by 22%, and vehicle delays where reduced by 17%. This translates into 13,100 litres of fuel savings and one ton of CO
2 reduction per intersection.
Traffic control centre

51Complete Mobility in Calgary
University of Calgary, Calgary
5.0 Calgary’s future mobility scenario: Complete Mobility5.8 Complete Mobility package: High Speed Rail
BackgroundThe Calgary-Edmonton corridor stretches 300 kilometres and includes Red Deer, in addition to many other smaller commun-ities. According to the 2006 Canadian census, the population of the Calgary–Ed-monton corridor was 2.4 million, account-ing for more than 73 per cent of Alberta’s population.
The Queen Elizabeth II Highway or High-way 2 is the central spine of the Calgary–Edmonton corridor. In 2006, an estimated 5 million passenger auto trips took place along this highway plus 236,000 passen-ger bus trips on the Greyhound and Red Arrow services. There were also 616,000 passenger air trips between the two cities.
Benefits of HSR connectionsConvenience and mobilityAt distances of less than 700 kilometres, HSR trains can deliver people downtown-to-downtown almost as fast as airplanes at a fraction of the cost, and can do so in virtually all weather. With wide seats, fax machines, places to plug in a laptop com-puter, and food service, they provide a con-venient, productive alternative to cars and airplanes. A single railway track can carry as many people as a 10-lane highway at a fraction of the cost.
5.8 Complete Mobility package: High Speed Rail
The environmental factorElectrically powered trains are more environ-mentally friendly than any other means of transport. Consumption optimized multiple unit train sets can cover 100 kilometres at only 0.33 litres of fuel per passenger seat. In fact, compared to airplanes, these train sets emit up to 90 percent less carbon dioxide per person per kilometre.
EmissionsHigh speed trains can be three times as energy efficient as cars and six times as energy efficient as planes. In just the four cities studied in this report, an HSR system will reduce annual carbon emissions for intercity travel by 2.8 million tons a year. These reductions amount to more than one-third of the total CO
2 currently created
by intercity travel in the four cities.
0
20
40
60
80
100Paris – Brussels
Paris – Lyon
Madrid – Barcelona
Tokyo – Osaka
Paris – Bordeaux Paris – London
Paris – Montpellier Paris – Amsterdam
Paris – Strasbourg
0 1 2 3 4 5 6 7
Rome – Milan
Rome – Bologna
Milan – Naples
Hig
h s
pee
d r
ail v
s. fl
igh
t (%
)
In 2 hours far above 80%
In 3 hours far above 60%
In 4 hours above 40%
Travel time via high speed rail (hours)
Paris – Marseilles
Moscow – St. Petersburg
Beijing – Tianjin
Wuhan – Guangzhou
Cologne – Frankfurt
Berlin – Hannover
Paris – Toulouse
Paris – Frankfurt
Modal split between high speed rail and flight

52 Complete Mobility in Calgary
5.0 Calgary’s future mobility scenario: Complete Mobility5.8 Complete Mobility package: High Speed Rail
Queen Elizabeth II Highway at Glenmore Trail, Calgary
Intercity car tripsIn the four cities, HSR can take as many as 28 million car trips off the road, reducing intercity car travel by more than 27 per cent.
Short-haul intercity air travelIn the four cities, which represent some of our nation’s busiest airports, HSR elimin-ates nearly 900,000 short-haul intercity air trips per year, reducing highly polluting avi-ation emissions and freeing up capacity at our congested airports.
Local transit connectionsHSR stations can serve as a link to feeder systems and as direct connections of airline hubs. Those stations also may have park and ride lots to allow easy access for commuters. For those with the need of a car but far from home, these stations may also have car rental facilities. To increase green initiatives, there may be car sharing among commut-ers. The HSR ticketing system can be inte-grated with local transit systems, providing seamless passenger transfer.
Regional economic patternsHSR has widened the effective reach of urban regions. Research in Europe has made
a distinction between the catalyst role that HSR can have on small and medium-sized cities, by providing wider network connec-tions that draw new activity, and the facili-tating role they can have on large cities, by providing market accessibility enabling them to keep pace with their continuing growth. (Source: The Economic Impact of High-Speed Trains on Urban Regions, Peter M.J. Pol, Erasmus University Rotterdam).
Station area developmentHigh density office, retail, and residential development is sometimes spurred in areas adjacent to HSR stations.
Economic competitionCountries with the greatest length of HSR lines operating at 160 km/hour or more tend to be globally competitive economic regions with high density urban environ-ments. These include Japan, China, France, and Germany, along with the Netherlands, South Korea and Taiwan.
Efficiency advantagesHSR trains use regenerative braking to re-turn energy to the grid.
Improved land useDowntown railway stations will pull jobs, people and business back into the country’s central cities, helping to reverse sprawl. HSR reduces the need for new outlying highways and airports, which exacerbate sprawl.
CompatibilityHigh performance HSR trains are now oper-ating in four climatic zones and on different track gauges. HSR trains are designed to operate interchangeably on different line voltage systems, providing border-crossing capability. Compatibility is ensured with the infrastructure, global standards, and smooth integration of state-of-the-art and next-generation train protection and com-munication systems.
High speed rail in Alberta
Fort McMurray
Edmonton
Red Deer
CalgaryCityHSRFeeder system
In Los Angeles, HSR may generate as much as $7.6 billion a year in new business sales, providing up to 55,000 new jobs and $3 billion in new wages.

53Complete Mobility in Calgary
Motivation for the Calgary-Edmonton HSR lineAn HSR connection between Calgary and Edmonton would be a substantial invest-ment for the province and could provide an alternative, more sustainable mode for trav-el between the two cities. It would become a core component of the provincial trans-port infrastructure, providing fast, efficient and timely transport between Calgary and Edmonton, as well as the cities along this corridor. While HSR is predominantly used for passenger movement, it could also be suitable for the movement of goods and freight in the Calgary-Edmonton context.
HSR can be a real driver for all the other packages outlined above. An HSR terminus in the Calgary centre city would be a key legibility landmark and interchange within the city. It would become a key focus for the initiatives which form part of the Cen-tre City package.
HSR can become the backbone of pub-lic transportation systems. Connectivity between all different modes of transport has to be ensured (station parking, taxi, bus, light rail, commuter rail, etc.) to allow other modes to feed into HSR and facilitat-ing region-wide access to the service. This, in turn, can support efficient utilization of capacity and services.
HSR would connect the two main cities of Alberta along with other en route towns, Passenger intermodality
Plane
High speed rail
Car
Rental car
Bicycle
Taxi
Bus
Light rail
Metro
Commuter rail
Passenger intermodality
Travel times between Calgary and Edmonton:
By car: 3h 30min
By high speed train: 1h 15 min (downtown to downtown, including check-in)
By flight: 2h 15 min (downtown to downtown, including check-in)
strengthening the province’s competitive-ness. The land value around the HSR line would significantly increase in both Cal-gary and Edmonton. This should act to attract commercial and industrial develop-ments, resulting in the creation of jobs and fiscal revenues. HSR can also give impulse for tourist-based development and would allow high capacity transport for events such as the Calgary Stampede.

54 Complete Mobility in Calgary
5.0 Calgary’s future mobility scenario: Complete Mobility5.8 Complete Mobility package: High Speed Rail
Expected results of an HSR line between Calgary and Edmonton• 3 million annual riders u $200 million annually in user- generated revenues
• 20 daily departures in both directions• 1h 15min travel times between the cen-
tres of Calgary and Edmonton• $1.4 billion per year increase in business
sales • 15,000 new jobs and an additional $500
billion in wages each year in the HSR region• $100 million in new annual visitor spend-
ing in Calgary and Edmonton
Experience elsewhere with HSR suggests it would be an important contributor to Al-berta’s future economic development. HSR
has the potential to reshape growth and development, strengthen the flow of trade and labour between cities in the corridor and transform international perceptions of the region.
Best practiceSpain: high speed under the Spanish sunIn Spain, HSR allows for travel between Barcelona and Madrid, a distance of 625 kilometres, in less than 2½ hours. The trains used are specially equipped for ser-vice in Spain’s heat, being 25 per cent more powerful than trains used in cooler climates and incorporating redundant air conditioning systems.
The constant expansion of the HSR net-
work has led to a significant momentum in the Spanish economy and provided export opportunities through the development, design, implementation and operation of the domestic projects. For example, the regions along the Madrid – Seville line im-mediately profited from the fast rail link, in Ciudad Real the high speed traffic un-leashed an impressive economic boom, and private investments in the agricultural Murcia province increased by 20 per cent.
China: new capacityChina’s HSR trains are specially tailored for the large passenger volume they must serve. They use wider cars with 2+3 seat-ing arrangements to accommodate 601 passengers per train. The 115 kilometre
High speed train – Spain High speed train – Russia

55Complete Mobility in Calgary
Calgary Tower, Calgary
Country Current network high speed rail
Maximum operating speed
Highlights Future plans
China 4,300 miles (6,920 km)
217 mph (350 km/h)
125,000 passengers a day from Beijing to Tianjin
> 8,000 miles by 2012
Japan 1,351 miles (2,175 km)
186 mph (300 km/h)
Already in 1994: EUR 3.7 billion economic benefits
> 1,800 miles by 2015
France 1,143 miles (1,840 km)
199 mph (320 km/h)
Paris is the central hub for all HSR connections in France
> 2,500 miles by 2025
Germany 1,056 miles (1,700 km)
186 mph (300 km/h)
German ICE trains traveled > 14 million miles in 2009
> 1,500 miles by 2025
Spain 633 miles (1,020 km)
186 mph (300 km/h)
HSR absorbed 50% of airline traffic Barcelona - Madrid
> 2,000 miles by 2020
Italy 547 miles (923 km)
186 mph (300 km/h)
70 daily connections in 37 min from Bologna to Florence
> 800 miles by 2020
Russia 403 miles (650 km)
155 mph (250 km/h)
411,000 passengers in first four months of operation
> 7,000 miles by 2030
USA* 435 miles (700 km)
149 mph (240 km/h)
Acela linking Washington – New York – Boston
> 1,200 miles in CA, Fl, Midwest by 2020
* not true high speed rail, starting at 150 mph up to 220 mph
Global comparison of high speed rail
Beijing–Tianjin trip can be completed in 30 minutes with a traction power rating of 8,800 kW and at a maximum speed of 300 kilometres per hour. A similar service is now being provided on the Beijing-Shanghai route and others are under construction.
Russia: high availability at low temperaturesDespite the very low temperatures in Rus-sia, reliable HSR services are being pro-
vided. Travel between Moscow and St. Petersburg, a distance of 650 kilometres, is possible in only 3½ hours. The trains are adapted for harsh climatic challenges, such as temperatures ranging from -40°C to 40°C. There is extra insulation and specially adapted ventilation and cooling systems. Air intakes are on the roof to avoid the haz-ards of drifting snow and a more powerful heating system in the interior makes for agreeable temperatures.
Six packages have been presented as part of a future Complete Mobility scenario for Calgary. This scenario offers the required initiatives to create a mobility system that will meet Calgary’s future urban challenges and reinforce the use of mobility as a tool to support a wide range of city and regional objectives.
This scenario goes beyond the limitations of Calgary’s Currently Committed scenario by focusing on the requirement to create a single system that presents a seamless choice of mobility options for residents, businesses and visitors oriented to their needs. The six packages will all improve the Sustainability, Efficiency and User focus of the system to take Calgary into the “Best in Class” group of cities. Complete Mobility of-fers a real opportunity to transform Calgary into a more sustainable and livable world class city.
5.9 Summary
5.0 Calgary’s future mobility scenario: Complete Mobility5.9 Summary

56
Delivery concerns for Calgary
6.0
6.0 Delivery concerns for Calgary
Complete Mobility in Calgary
The Complete Mobility packages illustrate what can be done. However, there are in-evitably some barriers and constraints that may work against the implementation of new ideas, even if they are generally ac-cepted as being necessary.
In general, Calgary has well developed ad-ministrative arrangements, but faces prob-lems in ensuring that policies are supported by citizens and necessary partners so that agreed policies are actually implemented. Table 10 summarizes the observed situa-tion for Calgary, taking into account views from our interviews and workshops.
6.1 SWOT analysis of Calgary
6.1 SWOT analysis for Calgary
Strengths Weaknesses
• Fast growing city region• Ambitious local government and politicians• Inclusive planning• Nearby oil sands and gas reserves• Proximity to the Rockies• Successful and growing international airport• Generally excellent environmental and living
conditions• High percentage commute to city centre by
transit• Calgary Partnership Board with strategic view
• Economy dependent on oil and gas• Dependent on cars for personal mobility• Low educational attainment• Low retention of immigrants • Not able to unify partners and citizens in a single
vision and set of actions• Inadequate affordable housing supply to meet
needs• City centre needs continued support and
development to match growth
Opportunities Threats
• ImagineCALGARY and associated policy docu-ments harnessing local energy and enthusiasm
• Further potential for joint working in Calgary region• Tourism potential can be further exploited
(e.g., implementation of the airport link and Visitor package)
• A diversified economy to be built up in the city centre or transit node and corridor development sites (e.g., Regional Communities package)
• Extended regional joint working on prioritized list of projects to meet growth needs
• Innovative funding of necessary projects• Integrated mobility management focused on
needs of both goods and people (e.g., Smart Infrastructure package)
• To the oil and gas economy – stringent environmen-tal regulation, bad management of resources, price fluctuations, new reserves discovered elsewhere
• Weak planning in practice – historical and con-tinuing sprawl, continued car dominance; not matching infrastructure provision to growth
• Over reliance on property taxes for public funds• Potential to be left behind by other competitors
if can’t agree on vision and priorities• ‘Hollowing out’ of the city if centre city policies
and actions are not strong enough• Not planning adequately for better educational
level and provision of housing, healthcare, etc.; not matching social requirements to economic ones
Table 10 – SWOT analysis

57
Downtown, Calgary
Complete Mobility in Calgary
Governance arrangements for any city tend to suffer from a degree of inertia. They were often created for a previous histor-ical situation, but remain in place because of political difficulties in changing them. But all the trends specified in Chapter 2 contribute towards changing views of the purpose and effectiveness of governance arrangements.
Today there is a greater desire to work in partnership with other public organizations and with businesses, lobby groups, univer-sities and other ad hoc groups of residents or workers, as well as individuals directly.
ImagineCALGARY is a good example of this in action and considers 100-year goals under the headings of access, conflict reso-lution, equity, and self determination. Each of these has a resonance for future mobil-ity planning as they aim to empower indi-viduals, include individuals in the decision making process, maintain a sustainable environment and recognize that Calgary needs to be actively engaged beyond the local community.
The Calgary Regional Partnership is an-other good representation of the current desire to work in partnerships. The CRP
6.2 Effective governance and delivery
6.0 Delivery concerns for Calgary6.2 Effective governance and delivery
recognizes that when municipalities act together, they are more likely to realize and understand key strategic issues and to begin to craft solutions requiring joint implementation.
There are some good examples of new gov-ernance arrangements that have been suc-cessful in generating the required behav-ioural change in neighbouring provinces. TransLink in British Columbia is a jointly governed transit operator that is account-able to the province, City of Vancouver and neighbouring municipalities. This could be a long term model for the Calgary region.

58
6.3 Adequate and sustainable funding
ImagineCALGARY includes the following governance system targets:
•T3 By 2036, the City of Calgary reduces its dependence on property taxes to no more than 25 per cent of revenue.
•T4 By 2036, all general revenues are based on the principle of progressive taxation.
•T5 By 2036, all publicly provided goods and services are affordable, accessible and priced in accordance with their public benefits.
Any implementation program, including one that takes Calgary closer to Complete Mobility, requires appropriate, consistent and long-term funding. This is often a key barrier. The traditional answer is for public sector bodies to provide funds from local, provincial or federal sources. Although these are still important funding sources, new
Complete Mobility in Calgary
responses are needed to ensure that part-nerships, innovative ideas and other forms of generating funding are all explored. A second program should be developed to en-sure the best performing projects and initia-tives are funded first, and that projects not meeting overall city objectives are placed at the bottom of the funding list.
There is a range of funding possibil-ities that are available to Calgary to fund these improvements. These include conditional government block funding, broad beneficiary fees such as property tax and development charges, user fees such as road tolls, transit fares and tolls, as well as debt instruments to name a few. Further study is required to con-sider options that are specifically relevant to Calgary, particularly in view of the ImagineCALGARY target to reduce depend-ence on property taxes to no more than 25 per cent of revenue.
6.0 Delivery concerns for Calgary6.3 Adequate and sustainable funding

59Complete Mobility in Calgary
6.4 Getting the priorities right
The relevant public sector organizations publish investment plans for transporta-tion and other necessary infrastructure that falls within their jurisdiction. Calgary has funding from a few federal funds in-cluding The Building Canada fund, the Can-adian Strategic Infrastructure Fund and the Gateways and Border Crossings Fund. De-spite having access to all these funds, the money has been directed to road building – the Calgary ring road, in particular.
The Province of Alberta’s 20-Year capital plan ”anticipates the need to invest, on average, $6 billion ($2007) per year to meet short and medium-term objectives. The vision is to have a fully-integrated, world class transportation system.” How-ever, the provincial government then goes on to say it will ”place a high priority on stra-tegic investments in our highway network.” It is noticeable that provincial funding has historically been predominantly directed to road building. This is beginning to change with the introduction of the Green Transit Incentives Program (GreenTRIP), a one-time capital funding program to support public transit in Alberta. As a result of GreenTRIP,
7th Avenue, Calgary
the Town of Cochrane will receive up to $6.1 million through the program to pur-chase four double-decker transit buses and four community shuttle buses, build a pub-lic transit terminal, and design a bus stor-age and maintenance facility.
The Alberta Capital Plan appears to place higher priority on highways because of their importance for freight and business.
In contrast, the 10-year Calgary Trans-portation Infrastructure and Investment Plan (TIIP) focuses on urban mobility with an integrated approach, including transit and active transport. The view appears to be that mobility is key to successful city growth management, which is required for economic and other reasons.
Despite GreenTRIP, there is still a disloca-tion between the provincial priorities and those in the Calgary and Calgary Regional Partnership plans. Both approaches link to overarching aims and objectives, but nei-ther can demonstrate clearly that the pri-ority projects listed are the ones that best fit the economic, environmental and social
objectives, including those from associated partners such as businesses.
What is needed is a project prioritization framework. This should not be confused with the project appraisal process, which still needs to be undertaken, but is a way to score any project or policy against stated city, regional or provincial objectives. A clear prioritization process from the province, re-gion and city has the following benefits:
• All relevant stakeholders in the region and province become aware of the full range of objectives
• A joint, rational and transparent pro-cess would be undertaken to prioritize projects and initiatives against these key objectives.
• A final list of priorities would be agreed upon jointly, on the basis of robust evidence.
This final list of priorities could then be measured against such indications as value for money, capital cost and deliverability. This priority list would be the one promot-ed, funded and implemented jointly.
6.0 Delivery concerns for Calgary6.4 Getting the priorities right

60 Complete Mobility in Calgary
6.5 Integrated transport and land use
Our review of the key regional policy docu-ments and the municipal land use and transportation plans, has revealed many examples of good policies for integrating land use and transport, particularly with regard to the need to adequately serve and manage growth. For example, the goal of Plan It Calgary is to set out a long-term direction for sustainable growth to accom-modate another 1.3 million people over the next 60 years. The plan embraces sus-tainability principles for land use and mo-bility focused on a compact city form that cultivates walking, cycling and transit, and preserves open space, parks and other en-vironmental amenities.
Another good example is the Transit Ori-ented Development Policy Guidelines which provide direction for the development of areas typically within 600 metres of an existing or future transit station. This type of development creates a higher density, walk-able, mixed-use environment to optimize the use of existing transit infrastructure and create mobility options for Calgarians.
Assessing whether these policies are work-ing is very difficult. Views from the work-shops and interviews were mixed. Some stakeholders recognized excellent ex-amples, such as development focused on transport nodes and corridors. Others fo-cused on poor examples, such as allowing new development and sprawl to be poorly
served by transit. For the latter, the situa-tion has severe impacts, and improving it is a slow process of talking to developers, working closely with municipalities and influencing the market by creating aware-ness to encourage people to look critically at residential locations.
There are other necessary requirements to ensure growth is properly planned and integrated in Calgary including a focus on the city’s centre. The city centre is the heart of activity and often represents the image of the city as a whole. It is an important contributor to economic and quality of life objectives. Land use and transport plans should recognize this. A city’s centre must be a user-friendly place to arrive and stay, with impressive public spaces and build-ings, world class arrival points, and effi-cient mobility systems.
The centre city should focus on maximiz-ing the use of exchange space. Exchange space, both public and private, generates the wealth in a city. The movement space simply gets people to the exchange space. It is vitally important that exchange space is maximized and the productivity of the al-located movement space is maximized. If this is out of balance, then the city’s com-petitiveness and attractiveness will suffer.
In mobility terms, this means the city centre should be a showcase for transit. The mo-
bility system needs to deliver large volumes of people to the downtown area in an ef-ficient and attractive way while minimizing the amount of movement space. This can only be done through transit. Successful cities around the world have all realized the importance of this balance as shown in the following example:
New York City, USA – In 2006, New York leaders began to consider and re-imagine how Times Square performs as a public space. Project for Public Spaces identified a number of issues. Most building bases in the district did not support sidewalk activity. There was high demand for use and activity in the area, but there were no amenities in square to support it. Street design did not support pedestrian move-ment. There was a lack of flexibility in the space and side streets (especially theatre blocks) were underperforming as destina-tions in their own right. Times Square is now a permanent pedestrian plaza. The city quickly found that revenues from busi-nesses in Times Square increased 71 per cent and injuries to motorists and passen-gers in the area dropped 63 per cent. The city installed GPS units in 13,000 taxis so the Department of Transportation could track the impact on car traffic and found that northbound trips in the west midtown area around Times Square were 17 per cent faster.
6.0 Delivery concerns for Calgary6.5 Integrated transport and land use
City Hall, Calgary

61Complete Mobility in Calgary
6.0 Delivery concerns for Calgary6.6 Green solutions
6.6 Green solutions
For the next two decades, fossil fuels will remain dominant, however renewable energy resources will become increasingly important. The demand for energy will grow from 20,300 TWh in 2008 to 33,000 TWh in 2030 with the share of renewable energy growing from 580 TWh in 2008 to 5,580 TWh in 2030.
Consequently, cities are becoming increas-ingly aware of the need to ”go green” – to use, where possible, the most environ-mentally friendly products and energy-ef-ficient solutions. Some examples include:
• Energy from renewable resources• CO
2-free production of energy
• Energy management in buildings that can produce an energy reduction of up to 30 per cent
• Traffic management systems to maintain mobility
• High voltage urban links for efficient energy transport to the end consumer
• Optimization of industry components, which could save up to 40 per cent in energy consumption
• Making public transit more attractive, which could save up to 20 per cent in fuel consumption
• Lighting poles equipped with LED lights to reduce CO
2
What is the challenge for Calgary?Calgary has one of the largest carbon foot-prints in the world, producing 17.7 tonnes of greenhouse gas emissions per capita each year. Vehicular fuel is the second largest lo-cal greenhouse gas source, contributing 29.6 per cent of total emissions in 2009. These issues are recognized in Calgary’s plans and policies, but more action could be taken.
Despite Calgary scoring relatively well for Pollution in the Complete Mobility Index, further research indicates the city does ex-perience some problems with air quality, especially on indicators related to emis-sions from transport sources such as par-ticulate matter and nitrous oxides.
What is Calgary doing already?In January, 2007, Calgary city council adopted its Sustainability Principles for Land Use and Mobility, which include objectives to “preserve open space, agri-cultural land, natural beauty and critical environmental areas” and to “utilize green infrastructure and buildings”. In 2009, the Integrated Municipal Development Plan (MDP) and Calgary Transport Plan (CTP) were approved following the Plan It Cal-gary process, which was grounded in city council’s Sustainability Principles.
Complete Mobility green solutionsIn the transportation sector, there is a strong movement towards greener tech-nologies and more sustainable practices. This embraces cleaner transit vehicles, adoption of alternative fuel systems and modal shift in favour of walking and cyc-ling. Sustainable mobility can be achieved by implementing Complete Mobility solu-tions such as:
• Plug-in electric vehicles: The Electric Drive Transportation Association (EDTA) is implementing a Plug-in Electric Vehicle Acceleration Initiative throughout North America, providing education and outreach programs to extend demand of electric vehicles beyond first buyers.
• Hydrogen and fuel cells: Canada is a hub of leading hydrogen and fuel cell companies and research institutions, with world-recognized expertise in this field. Hydrogen and fuel cells in trans-port applications are expected to surge in the next few years as public hydrogen stations are installed and commercial vehicles, including buses, become in-creasingly available.
• Biodiesel buses: Halifax, Saskatoon and Brampton have all engaged in programs to test the use of biodiesel in their transit and municipal vehicle fleets. The precise biodiesel mixes varied depending upon
Fish Creek Provincial Park, Calgary

62 Complete Mobility in Calgary
local bio-oil availability and climate to optimize performance. Each city success-fully implemented greener fuel transit with significant reductions in particulate matter, carbon monoxide and dioxide, and hydrocarbons in exhaust emissions.
• Eco-driving: FleetSmart is an eco-energy program offered by Natural Resources Canada in conjunction with Alberta Transportation. It offers free practical advice, training and awareness programs on how energy-efficient vehicles and eco-driving practices can reduce fleet operating costs, improve productivity and increase competitiveness.
• Electric rapid transit: Environmentally friendly rapid transit by bus or light rail produces zero localized emissions and high energy efficiency due to technolo-gies such as advanced electric traction and complete kinetic energy recovery when braking.
• Electric rail: Modern, environmentally-friendly trains can achieve up to a 50 per cent reduction in energy consump-tion due to their light weight, improved aerodynamics, LED-lighting, intelligent air conditioning and regenerative braking technology.
• Virtual workplace: Remote accessing and teleconferencing are becoming more
important as mobility solutions. Such systems allow for a significant reduc-tion in the environmental externalities resulting from business travel.
• Smarter payment systems: As well as providing an effective method of manag-ing demand, smart payment systems can also help encourage behavioural change for users through incentives.
• Pricing: Road tolling, congestion charges and emission fines can change behaviour in both the public and freight sectors by allowing authorities to spread movement across the network and maximize carrying capacity, while encouraging intermodal behavioural changes.
London is an example of city where many Complete Mobility solutions have already been applied. For example, London has 1,200 trains to optimize the connection between the suburbs and the city, airport rail links, a congestion charging system, enforcement of a low-emission zone and the installation of hybrid bus technology.
These measures amount to a reduction of 150,000 tons of CO
2 emissions, a 37 per
cent increase in traffic speed, a 20 per cent reduction in inner city road traffic and a re-duction of 17 per cent in commuter times.
6.0 Delivery concerns for Calgary6.7 Delivering Complete Mobility
6.7 Delivering Complete Mobility Calgary suffers from a fragmentation of agencies and authorities responsible for the delivery of infrastructure and transport ser-vices. For example, the province is respon-sible for principal roads and regional transit and the municipalities are responsible for other roads and local transit. The prioritiza-tion process described earlier would help solve this problem by creating a joint in-vestment plan to implement it and manage transportation services across the region.
We have previously shown how Calgary can move into the “Best in Class” group of cities on the Mobility Index. For this to happen, integration of all mobility systems and uni-fied implementation become increasingly important. ImagineCALGARY already lists many innovations that help Calgary towards a leading position in Canada. We suggest there is also the potential for it to become a leader in developing Complete Mobility.
To facilitate this, we propose a new deliv-ery mechanism. The Calgary region should consider hiring a Mobility Manager to link transport and transit services across the whole travel-to-work region. The Mobility Manager would: • Manage mobility across the Calgary re-
gion, including the attainment of modal share or other regional targets set by the Calgary Regional Partnership;
Crowchild Trail at Memorial Drive, Calgary

63 Complete Mobility in Calgary
• Develop excellent links with existing tran-sit operators, parking operators, airports, taxis and other transport-related agencies;
• Develop excellent links with commercial partners and businesses, including such traffic generators as employers, shopping and leisure centres, and universities;
• Collect data on resident and visitor usage patterns and use this data to develop incentives to encourage people through choice to change their behaviour where necessary (e.g., not driving in congested areas at peak times);
• Encourage transit and other transport and parking providers to refine their products to meet identified requirements (e.g., to
provide updated and real time pre-trip information to selected groups who need this to decide whether to drive or take transit); and
• Where possible, work to generate rev-enue streams by creating value added offers to segmented populations based on knowledge about habits and aspira-tions (e.g., combinations of discounted parking and leisure entry tickets at non-peak times).
The level of responsibility to be taken by the Mobility Manager needs further refine-ment, but the organizational structure could be as depicted in Figure 14.
Figure 14 – Suggested organizational structure for a Calgary Mobility Manager
Calgary Regional Partnership (strategy and prioritized investment)
Mobility Manager(performance contract)
Private sector partners (payments, offers and incentives)
Transit, parking and other operators
Transport user groups(feedback)
Management of transport networks
6.8 Summary
None of the examples discussed in this chapter provide a complete answer by them-selves, but are all part of a pathway to Com-plete Mobility. Our recommendations are:
• Undertake a separate exercise looking at innovative funding options;
• Carry out a joint policy prioritization exer-cise with relevant stakeholders includ-ing the City of Calgary, neighbouring municipalities, the Province of Alberta, businesses and universities;
• Consider how Complete Mobility fits into existing arrangements, plans and poli-cies, and how it might be put into prac-tice and managed by a Mobility Manager.
6.0 Delivery concerns for Calgary6.8 Summary

64
Conclusions
7.0
Complete Mobility in Calgary
7.0 Conclusions
Calgary is in the fortunate position of be-ing a wealthy and growing city. It possesses a long term and inclusive vision, engaged residents and businesses, and innovative, ambitious plans for improvement. But turning these plans and policies into reality has not always been so successful. Indeed, many of the factors that will threaten Cal-gary’s economic growth are still present. If this continues, the ImagineCALGARY vision will not be fulfilled. This report seeks to place Calgary in a global context and show what it must do to maintain and improve its competitive position.
Although the current plans demonstrate the need for a high degree of land use and transport integration in policy terms, with the goal of a compact, transit oriented city, the city’s growth continues to sprawl with new car-dependent developments hav-ing only limited access to transit. The car continues to be dominant, which hinders plans for an economically diverse, green and livable city.
This inertia in converting policy into ac-tion is reflected in Calgary’s score of 3.75 out of a maximum possible score of 6 on the Mobility Index. Based on this Mobility Score and Calgary’s level of GDP per cap-ita, the Calgary CMA has been identified as falling on the boundary between the “At Risk” and “Best in Class” categories. This will deteriorate in the future given the projected growth.
It should also be remembered that the Index is a snapshot in time. Other cities on the Index that share the same aspirations may be more successful in moving towards Complete Mobility. Future cities will need a strategy based on the concept of Complete Mobility. Calgary needs to embrace this, as the city cannot afford to stand still.
In this report, we have investigated ways forward in the form of one scenario based on planned and committed transporta-tion projects and initiatives and another based on Complete Mobility, for which we have provided some potential packages.

65
Skyline, Calgary
Complete Mobility in Calgary
GD
P p
er c
apit
a (U
SD)
Complete Mobility Index
Mobility Score0 1 2 3 4 5 6
0
10
20
30
40
50
60
70
80
90
Group 1 – “Struggling to Cope”
Group 2 – “At Risk”
DhakaLagos
JakartaCairo Karachi
Tehran
Mumbai Delhi
Metro ManilaJohannesburg & East Rand
IstanbulBueno Aires
AthensMoscow
Mexico City
Seoul
ShanghaiBeijing
Ruhr
ZurichBerlin
Paris
BarcelonaVienna
SingaporeLondon
Amsterdam
Tokyo
Munich
Copenhagen
New York
Los Angeles
Chicago
Prague
Melbourne
Dubai
Group 3 – “Best in Class”
KolkataHo Chi Minh City
Bangkok Rio de JaneiroSt Petersburg Sao Paulo
PhoenixSydney
RomeCalgary
Edmonton
MontrealOttawa
Vancouver
GTHA
Figure 15 – Indicative impact of the Currently Committed scenario and the Complete Mobility scenario

66
Bridgeland Memorial LRT Station, Calgary
Complete Mobility in Calgary
The Currently Committed scenario will cer-tainly improve Mobility Scores, but will not deliver Complete Mobility. There are two basic reasons for this:
1. The planned projects are generally ex-cellent, but do not demonstrate the re-quired level of integration of transport modes or the user focus necessary to create One System, nor are they likely to match the level of growth anticipated. To attain the upper level of “Best in Class” cities requires greater focus on the seam-less integration of all modes and the delivery of mobility systems tailored to each user is required. With this end in mind, new forms of governance, priori-tization, funding and delivery, as well as a smart ICT framework will be necessary.
2. Despite the comprehensive and inclusive planning policy background, there are barriers to implementation in the form of fragmented governance and deliv-ery arrangements, limited joint working and setting of priorities, limited funding sources and potential neglect of new op-portunities. These are the main reasons for the failure to translate plans into ac-tion. This must be addressed.
To demonstrate this visually, Figure 15 indicates Calgary’s potential progress in becoming a “Best in Class” city. If Calgary follows the Currently Committed scenario where future plans consist primarily of more projects without integration and user focus, then progress will be limited. These plans will only go so far before the bar-riers to progress kick in. This would result in them attaining a position within the yel-low section. Only the full implementation of Complete Mobility will drive the Calgary CMA into the green segment on the Index, which represents the higher reaches of the “Best in Class” grouping. Without this em-phasis on Complete Mobility, there is a dan-ger that economic growth will be affected and Calgary’s relative position will worsen compared with other cities. It may even move backwards into the “At Risk” group.
Calgary is well placed for the future and can build on its strengths. It has good
foundations in terms of infrastructure and new technology. It also possesses the will to succeed. The key to ensuring Calgary becomes a world class city of the future is the concept of Complete Mobility - One System that presents a seamless choice of mobility options for residents, businesses and visitors oriented to their needs. Con-tinued management of the system will lead to further refinements and improve-ments that will offer value to users and at-tainment of the city’s strategic objectives.
In this report, we have presented a vision of Complete Mobility and some practical pack-ages for Calgary to take the first steps to achieving it. In addition, we have also made some tentative suggestions on how to go about removing the identified barriers to im-plementation. By considering our proposals Calgary can ensure it will become a modern, sustainable world class city which is econom-ically competitive and a great place to live.
7.0 Conclusions

It is 7:00 am and Nancy is getting ready for another busy workday. She needs the city’s mobility system to help her day run smoothly, so the first thing she does is check to see if her Mobility Manager (MM) has sent any messages regarding transportation delays. How? She angles her wrist and projects her messages onto the wall via her watch. One message informs her that all transportation systems are working well. Among her other messages are offers to redeem the carbon credits she accumulated by using public transport and cycle clubs. She decides to look at these later.
After breakfast she heads off to the rail station to catch the 8:00am train. On her way she checks the travel schedule on her watch and confirms that the train is on time. When she gets to the station, the ticket machine gets a signal from her watch, notes her presence, and registers her on the public transit system. Once again she receives an option to use her carbon credits to pay for the upcoming trip or to receive a discount at one of the many shops in the station building.
As she boards the train her watch informs the transit system. On the train her MM notifies her of an upcoming delay because of a line problem before her destination station, then advises her to get off at the station before. Nancy uses the MM on her watch to check the interchange options to ensure she gets to work on time. The MM provides her with lots of information, including when the next bus arrives, as well as the option to call a taxi, book a shared car or reserve a bicycle. She calls a cab since the MM says it’s the fastest option.
As Nancy leaves the train, the transit system charges her for the train fare and adds carbon credits to her account. Since she’s given the retail system permission to view her profile, via her MM, she is sent offers that she might find attractive. Because she’s running late, she ignores the offers for now and gets in the taxi. She arrives at work on time and the taxi fare is paid automatically through her MM.
At lunchtime Nancy looks at the offers her MM sent her that morning. One of them tells her that, if she uses public transit three more times this week, she’ll qualify for a 50 per cent discount on a hotel in Banff and free international rail travel for her and a friend. She makes a mental note of that.
After lunch she needs to use one of the company’s car share vehicles. She books this through her MM. When she gets to the car later on, a connection is made between her MM and the car’s GPS, and her destination information is uploaded. While driving she receives an audio message saying the parking lot she normally uses is getting full. She reserves an available spot in the lot for a fee of $1.00 in addition to the parking fee. When she enters the parking lot, the parking system registers her for payment purposes. She also receives an offer for a discount on her parking fee if she leaves the parking lot off peak hours (before 4:00pm).
At the end of the working day she returns the car and goes to the health club for a work out and to relax. Because she is a member of the MM system, she’s provided with free health insurance and a discounted membership fee at the club.
Tomorrow is Saturday and Nancy is going out on her new bicycle for the first time. She used her carbon credits to buy it and received a discount because she is a Gold Member of the MM club. Nancy thinks to herself: “How did I ever survive in the past without Complete Mobility systems and my personal Mobility Manager?”
Note: The 2030 Mobility Manager is capable of managing all transportation needs in a multi-modal environment. The functionality consists of payment methods, traffic information, authorization, authentication, profile management, etc. and will be presented to the end-user via devices like watches, sunglasses, wall projections, etc.
Complete Mobility in 2030
67
Cityview Travel planner
Complete Mobility in Calgary

www.siemens.ca
Publisher: Siemens Canada LimitedIndustry SectorMobility Division1550 Appleby LineBurlington, Ontario, L7L 6XLCanada Research: MRC McLean Hazel, Edinburgh, Scotland and MRC, Mississauga, Ontario, Canada Design/Production: CCL Graphic DesignMississauga, Ontario, Canada
The copyright of all other images is held by Siemens Canada Limited Acknowledgements: We would like to thank everyone who has supported and contributed to this report. The people who participated in the stakeholder interviews and workshops, the colleagues from MRC (both the Edinburgh as well as the Mississauga office), the colleagues from CCL Graphic Design and B. Dupuis photographer and the Siemens colleagues from the Canadian and German headquarters. Printed in Canada. Reproduction of the articles in whole or in part requires the permission of the publisher. This also applies to storage in electronic databases, on the internet and reproduction on CD-ROM/DVD. Whilst every effort has been taken to verify the accuracy of this information, neither Siemens Canada Limited nor their affiliates can accept any responsibility or liability for reliance by any person on this information. © Siemens Canada Limited. 2011. Sponsored by Siemens Canada Limited