Embed Size (px)
Citation preview
Share Repurchases and Employee Stock Options and their
Implications for S&P 500 Share Retirements and Expected Returns
J. Nellie Liang Steven A. Sharpe
(202)452-2918 (202)[email protected] [email protected]
Division of Research and StatisticsFederal Reserve Board
Washington, D.C. 20551
November 1999
We estimate the effects of share repurchases and employee stock option exercises onnet share retirements for large S&P 500 companies. We find that, over the past fiveyears, gross repurchases have reduced shares outstanding 2 percent annually; but,owing to the exercise of employee stock options, only about half of those shares wereactually retired. Given the recent pace of employee stock option grants, andassuming that equities continue to be priced at about 30 times earnings, our analysissuggests that the pace of net share retirements will fall well below the pace of the lastfew years, unless corporations use nearly all their earnings to fund shareholderpayouts. Moreover, over the long haul, assuming corporations need to retain 40 to50 percent of their earnings to invest and grow at historical rates, the long-runaverage pace of net share retirements is likely to fall to 1/2 percent or less.
The views expressed herein are the authors’ and do not necessarily reflect the opinions of theBoard of Governors of the Federal Reserve System or its staff. The authors thank George Fenn,Jean Helwege, Steve Oliner, and Garrett TeSelle for helpful comments, and Jennifer Hohlman,Lizy Mathai, Dimitrios Paliouras and Melissa Post for excellent research assistance.
Cole, Helwege, and Laster (1996) use net share repurchases--repurchases less funds1
raised through issuance--to construct a repurchase yield. They document that, in the early 1990s,firms issued more shares than they repurchased, but that net repurchases turned positive againbeginning in 1994. Their study does not distinguish between issuance related to stock options,which involves a wealth transfer to employees, and other issuance which does not. We focus onemployee stock option-related issuance (as opposed to other sources of issuance) both because ofthat wealth transfer, and because the recent pattern of option grants creates a predictable sourceof future issuance. In particular, given the amount of employee options outstanding, as well asthe flow of new option grants, one can make projections of the pace of future issuance.
1
1. Introduction and Summary
Share repurchases by S&P 500 companies have risen sharply in recent years; in 1997 and
1998 they actually exceeded dividend payments to common stockholders of large public
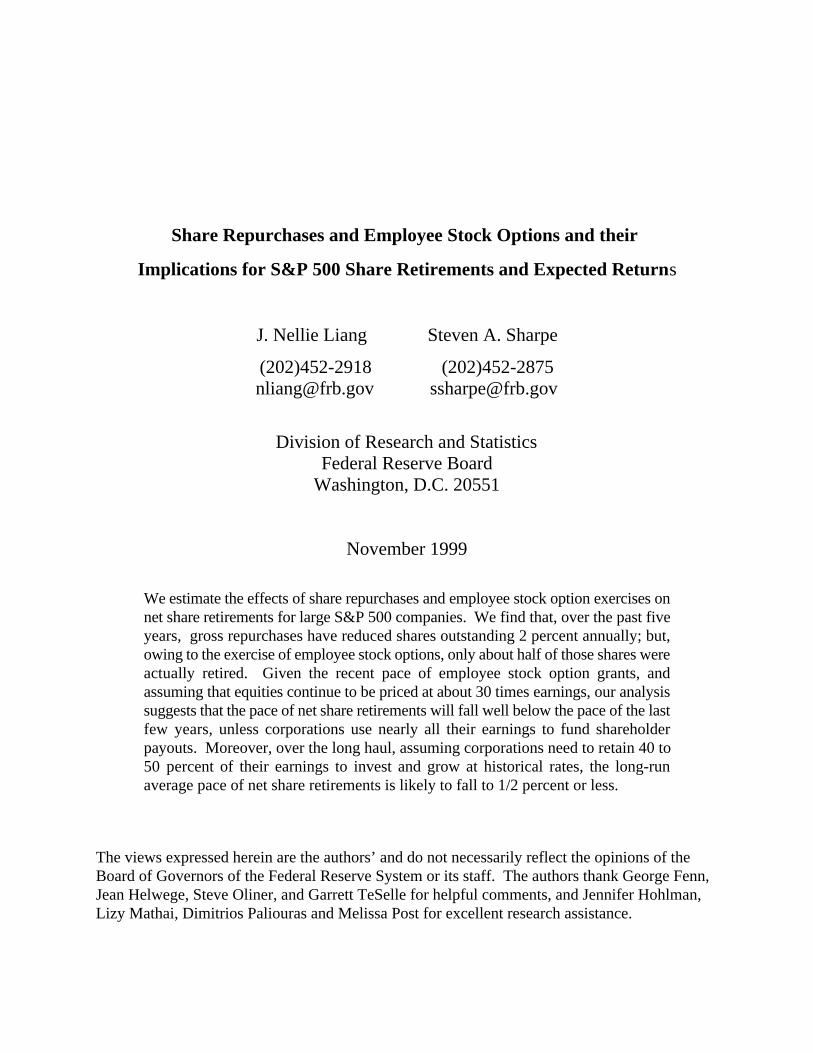
corporations. In fact, as shown in figure 1, share repurchases by nonbank S&P 500 firms more
than tripled between 1994 and 1998, reaching nearly $150 billion. Over the same period, their
dividend payments rose a much more modest 35 percent, to about $115 billion.
Given this dramatic growth in stock repurchases and the apparently shrinking dividend
payout rates, the dividend yield clearly has lost some appeal as an equity valuation tool. To the
extent that stock repurchases have replaced dividends as a method of paying out cash not needed
for investment, they must somehow be explicitly accounted for in any measure of shareholder
payouts. At first blush, a reasonable adjustment would be to add to the dividend yield something
like a Ashare repurchase yield,@ equal to share repurchases as a fraction of firm equity value.
Share repurchases, however, are not as regular as dividend payments and, as emphasized
in our analysis, many corporations that repurchase shares also issue new shares, primarily to
satisfy employee exercises of stock options. The shares issued to satisfy option exercises are
sold at a Adiscount@ from their market value, resulting in a wealth transfer from shareholders to
employees, which will be especially large following periods of unusual stock market gains.
Given the growing and related importance of employee stock options, incorporating information
on share repurchases into valuation models becomes more complicated. At the same time,1
because the cost of employee stock option grants generally is not accounted for in companies’

Plausible estimates of the value of options granted by large firms in 1998--and the2
resultant distortion to reported earnings--range from 10 percent [Bernstein Research (1999)] to19 percent [Murray (1999)] of reported earnings. Estimates for our sample of companies suggestthat the value of option grants in 1998 amounted to about 10-1/2 percent of earnings, risingsteadily from an estimated 4 percent of earnings in 1994. This suggests that excluding the valueof option grants from expenses has boosted annual earnings growth, on average, by 1-1/2percentage points over this period.
2
income statements, their growing importance has also created distortions in earnings-based
valuation measures such as price-earnings ratios. 2
In this study, we offer a fairly straightforward framework for gauging recent and likely
future share repurchases and their implications for stock market valuations. This framework
focuses on share repurchases’ effect on the growth in per share earnings and dividends resulting
from their effect on the denominator--the number of shares outstanding. In the simplest case,
when some of a firm's dividends are replaced by share repurchases, the result is a reduction in
shares outstanding and an associated boost to per share earnings and dividend growth. We then
incorporate the offsetting effect of share issuance associated with employee stock options.
Using this framework, we estimate the effects of share repurchases and stock option
exercises on net share retirements for a large sample of S&P 500 companies over the past five
years. While our calculations show that share retirements from repurchases have risen
substantially in recent years, we find that the growth in share issuance from exercises of
employee stock options offsets a good deal of this effect. Specifically, repurchases have reduced
shares outstanding of large S&P 500 companies at about a 2 percent annual pace; but, owing to
the exercise of employee stock options, only about half of those shares were actually retired.
Looking ahead, we argue that, if current high valuations are maintained, net share
retirements from repurchases and stock options are likely to drop below their hefty pace in recent
years. Our expectation for this slowdown is based in part on our projection that the pace of
issuance from option exercises will rise somewhat further owing to the increase in option grants
in recent years. At the same time, with equity prices around 30 times earnings for the S&P 500,
retirements from repurchases are not likely to keep pace unless companies devote an even greater
fraction of their cash flow to fund repurchases than the high level of recent years. But, in 1997

3
and 1998, between investment outlays and payouts to shareholders, many companies already had
outspent their cash flow by a substantial margin.
Over the long haul, assuming corporations need to retain 40 to 50 percent of their
earnings to invest and grow at historical rates, the cash outflow from repurchases (net of
proceeds from stock option exercises) could fall back to less than half its current level. If so, the
long-run average pace of net share retirements would fall to only 1/4 to 1/2 percent per annum.
If not already anticipated, such a drop in the pace of share retirements could have a negative
effect on equity valuations.
2. The Analytical Framework
2.1 Stock Repurchases.
Repurchases can be incorporated into the analysis of stock valuations by either
classifying the repurchase-related cash outflow as dividends, or incorporating the effect of
repurchases into growth in per share earnings and dividends. A firm with N shares outstanding
that spends Z dollars to repurchase its own shares at market price P will reduce shares
outstanding by z=Z/NP percent. Holding all else constant, this boosts per share earnings growth
by z percentage points. If the cash used to repurchase shares would otherwise have been paid out
as dividends, then a firm’s new policy of repurchasing z percent of its shares is associated with a
z percentage point cut in its current annual dividend yield from, say, d+z percent to d percent.
After such a change in policy, the firm’s share price would be expected to appreciate an
extra z percent per annum; that is, its share price would fall only d percent on ex-dividend day
rather than d+z percent. Thus, the effects of repurchases on share price and number of shares
outstanding are offsetting, leaving the firm’s total market value unaffected. So long as
substituting share repurchases for dividends has no effect on the firm’s investment policy or on
the return shareholders require, repurchases merely result in the replacement of dividend yield
with capital gains of a like amount.
Of course, this simple example abstracts from some important characteristics of
repurchases that distinguish them from dividend payments, perhaps the most important being
their greater flexibility. Changes in a firm’s dividends traditionally are viewed as containing
Jagannathan, Stephens and Weisbach (1998) find that repurchases are associated more3
with temporary increases in cash flow, while dividends are more tightly related to permanentincreases. Fenn and Liang (1999) find that over a several-year horizon, repurchases are preferredto dividends by firms with higher market-to-book ratios, consistent with the hypothesis that firmswith larger numbers of investment options require greater financial flexibility.
Thus, an additional consequence for real-world valuation practices may be that it4
becomes more difficult to discern underlying growth trends from historical financial data (forexample, on per share earnings and payouts), making extrapolation more problematic.
Lambert, Lanen, and Larcker (1989) find that dividends are reduced following the5
adoption of executive stock option plans. Other studies have documented that dividends arenegatively associated with employee stock options, while share repurchases are positivelyassociated with employee stock options [Jolls (1998), Fenn and Liang (1999), and Weisbenner(1999)].
4
some signal of the path of net cash flows the firm expects to pay out to shareholders over the
longer term. Thus, companies rarely increase dividends temporarily and are penalized when they
decrease dividends. Repurchases, by contrast, are more sensitive to current cash flow or
temporary cash surpluses, and carry little obligation to be maintained at current rates. Thus,3
even if average growth in earnings per share were shifted up z percentage points from a policy
change like that in the example, the effect on growth would vary greatly on a year-by-year basis. 4
Another factor possibly behind the rise in managements’ propensity to use repurchases in
place of dividends is the increased use of employee stock options as compensation, because the
value of management’s options, which are not dividend-protected, is reduced when dividends are
paid. Additionally, management may use stock repurchases to smooth growth in earnings per5
share if this is seen as helpful for boosting stock prices.
2.2 Employee Stock Options.
The rise in share price associated with share repurchases in the example above is justified
because the repurchases were funded with foregone dividend payments and the repurchased
shares were retired. But, in recent years, the effect of repurchases on shares outstanding to a

Of course, options may reduce other compensation expenses or boost profits, factors not6
incorporated in this analytical framework. These factors will be discussed in Section 4.
Firms with accumulated excess cash flow or low leverage can for some time boost their7
payout rates above the level of the excess between their cash flow and investment; but, ultimatelythis will cause leverage to reach undesirable levels. Moreover, even before this occurs, reducingshare count will not necessarily boost earnings per share. In particular, it will not boost earningsper share unless the interest rate paid on the added debt, or the foregone cash assets, is less thanthe ratio of the firm’s current earnings to its stock price.
5
significant extent has been counterbalanced by the issuance of shares in satisfaction of employee
stock option exercises.
To incorporate employee stock options into the analysis, consider a firm that has granted
employees stock options with strike price S amounting to x percent of its outstanding shares.
When the options are exercised, shares outstanding will increase by x percent, and the firm
receives cash proceeds from the associated sale of shares to employees amounting to xS /P
percent of its total market value. If the firm uses the proceeds from option-related issuance to
repurchase shares, it can buy back xS/P percent of its shares, and the exercise of these stock
options would have no net effect on its resources. In this circumstance, these exercises and6
repurchases would result in a net increase in shares outstanding of x(1-S/P) percent, reflecting a
wealth transfer to employees (option holders) equal to x(1!S/P) percent of the firm’s value. The
higher is the market price relative to the strike price, the fewer shares the firm can repurchase
with the proceeds from employee option exercises and, thus, the greater is the resulting dilution
or wealth transfer to employees.
Suppose, instead, that the firm buys enough shares to fully offset the exercise-related
increase in shares. This will result in a net cash cost to the firm equal to gross repurchases less
proceeds from option exercises (z-xS/P). Of course, this does not undo the wealth transfer
resulting from those option exercises, but changes how option exercises affect the firm’s
financials. Rather than causing an increase in shares, a dilution effect, the option exercises
together with the repurchases results in a larger cash outflow. If dividends are not cut enough to
offset the resultant drain on resources, then the net cost of reducing shares is reflected in the
firm’s balance sheet, as a reduction in equity and assets. Either way, employee stock options7

6
create a wedge between the rate of net share retirements and the net cash outflows from
repurchases; we thus gauge the joint effects of stock options and stock repurchases through their
effects on both share count and net cash outflows.
2.3 Sustainability of payout rate
Gauging the recent level of shareholder payouts associated with repurchase and stock
option programs is informative, but doing so begs the more speculative task of determining their
sustainability. To anchor such an analysis, let us hold firms’ future investment requirements
fixed by assuming they replicate past rates of investment. Then a judgment on the sustainability
of any given payout rate amounts to a judgment on the level of future profitability, or return on
investment.
One simplistic approach to determining a sustainable pace for future payout rates would
be to fix the total shareholder payout rate to its historical average level; this amounts to assuming
that, in the long run, profitability will also replicate historical experience. But that approach
could be too pessimistic if using stock options for employee compensation enables firms to
reduce other more traditional compensation expenses, thereby boosting measured income, cash
flow and return on equity. That extra income could thus fund the extra repurchases (and payout)
needed to offset the dilutive effect of these stock options. Note that this would not necessarily
mean that firms are more profitable in an economic sense, because they are essentially replacing
expenses that enter through the income statement with expenses--the value of option grants--that
do not show up directly on the income statement. Of course, employee stock options could have
a positive effect on economic profitability if, by better aligning incentives between shareholders
and management, they resulted in a more efficient use of resources.
3. Recent Stock Repurchases, Option Exercises, and Share Retirements
For all firms except commercial banks, data on stock repurchases and most financial
statement items are available on Compustat. However, data on issuance related to employee
stock options had to be hand-collected from the footnotes in firms’ 10-K filings that describe
employee stock option plans. Because these data require relatively intensive collection efforts,
our sample is limited to about 150 of the largest domestic S&P 500 firms during 1994-97 for

The gross repurchase yield for this group of firms is quite close to that for the universe of8
S&P 500 firms (excluding banks).
7
which data on stock options are available. We end up with 144 firms with at least partial data;
the dataset was then extended through 1998 for the 138 surviving firms. This subset of firms
accounts for about three-quarters of total share repurchases and dividend payments by the
companies in the S&P 500 during this period.
3.1 Net share retirements
Table 1 summarizes the results of our tabulations of stock repurchases and stock option
exercises for our sample firms--the key statistics used to estimate annual net share retirements.
The first row shows the Agross repurchase yield,@ equal to the dollar value of these firms’ share
repurchases as a percent of their total market value, where market value is measured by the
average of beginning and end-of-year equity prices. These figures represent estimates of the8
percent of outstanding shares repurchased in each year under the assumption that the average
price paid to repurchase shares was equal to the average market price. As shown, the fraction of
shares repurchased rose from 1-1/2 percent in 1994 to nearly 2-1/2 percent in 1997; in 1998
repurchases fell back to just under 2 percent of outstanding shares. On average over the 5 years,
gross repurchases reduced the number of outstanding shares about 2 percent per annum.
The second row shows annual estimates of the total market value of new shares issued by
these firms to satisfy exercises of employee stock options (number of options exercised
multiplied by a firm’s average market price), expressed as a percent of the total average market
value of these firms. As shown, issuance from option exercises has risen quite steadily, from 0.5
percent of outstandings in 1994 to 1.1 percent in 1998. This rise is due to both the increased rate
of option grants over the last decade and to rising stock prices, which tend to boost the pace of
exercises.
The difference between the gross repurchases yield, row (1), and percent of outstanding
shares issued through exercises, row (2), represents our estimate of annual net share retirements
(as a percent of outstandings) attributable to these two programs. As shown in row (3), our
estimates of net retirements show no clear trend over this period, averaging about 1 percent of
outstanding shares and bouncing from a high of nearly 1-1/2 percent in 1997 to a low of 3/4 of

In recent years, equity issuance other than that associated with our estimates of option9
exercises has been low. Accounting for this other issuance, would reduce estimated retirementsby less than 0.1 percent in 1997. In 1995 and 1996, other equity issuance is estimated to havereduced net retirements by about 0.2 percentage points.
8
percent in 1998. Thus, on average, the net effect of stock buybacks and employee stock options9
over the five-year period has been about a 1 percent annual reduction in shares outstanding. If
repurchases were merely a replacement for dividends, and there were no side-effects on earnings,
this share reduction translates into a 1 percentage point boost to earnings per share growth. More
realistically, this might be considered a high-end estimate of the effect on earnings per share, as
some of those repurchases resulted in drawdowns of corporate cash and, thus, a reduction in
interest earnings.
3.2 The Financing Burden
This brings us to the second half of the story--the financing of these retirements. Net
share retirements of close to 1 percent from repurchase and option programs require a net cash
outflow that exceeds 1 percent of market value, because firms receive less than the market price
for option-related issuance. We estimate the proceeds firms received from option exercises by
multiplying the number of exercised options by the average exercise price, as reported on the
firm’s 10-K; the result is then summed up over our sample firms. As shown in row (4), our
tabulations indicate that annual proceeds from option-related issuance have held steady at around
0.4 percent of market value since 1995. Thus, while the proportion of outstanding shares issued
to satisfy options more than doubled between 1994 and 1998, annual proceeds from this
issuance, as a fraction of total market value outstanding, has risen much less.
Given exercise proceeds, we can estimate the net cash outflow associated with
repurchases and option-related issuance, as the difference between row (1) and row (4).
Expressed as a fraction of market value, this figure is analogous to the dividend yield. As shown
in row (6), these net cash outflows had risen to nearly 2 percent of market value in 1997, before
dropping back to 1-1/2 percent in 1998. In comparison, the dividend yield, shown in row (7), has
steadily declined from 2.8 in 1994 to 1.4 in 1998.
net cash outflow
earnings'
net cash outflow
market value×
market value
earnings
9
Finally, we calculate the annual ex post wealth transfer from shareholders to employees
associated with the exercise of employee stock options as the difference between issuance from
option exercises (2) and exercise proceeds (4). Shown in row (5), this cost has tripled as a
fraction of firm value, from 0.25 percent of market value in 1994 to 0.74 percent in 1998. As
pointed out earlier, this cost does not flow through the income statement--neither when granted
nor when exercised--but shows up as an increase in shares outstanding, or the wedge between net
cash outflow and net share retirements.
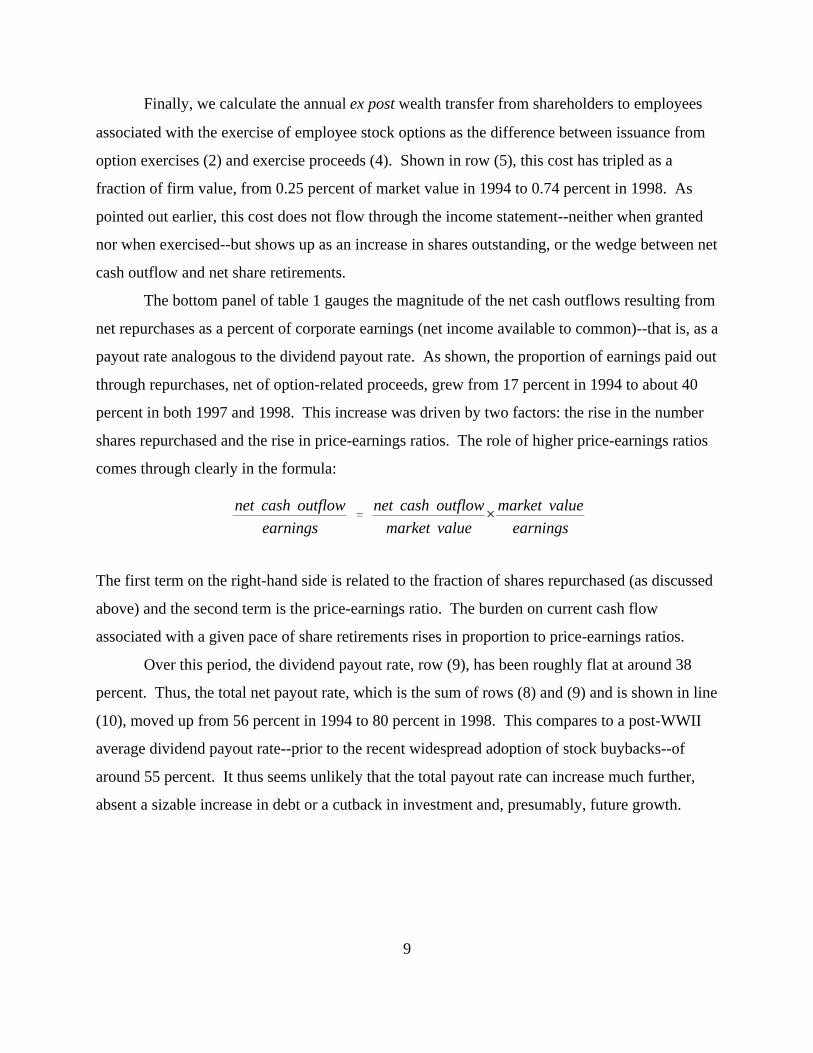
The bottom panel of table 1 gauges the magnitude of the net cash outflows resulting from
net repurchases as a percent of corporate earnings (net income available to common)--that is, as a
payout rate analogous to the dividend payout rate. As shown, the proportion of earnings paid out
through repurchases, net of option-related proceeds, grew from 17 percent in 1994 to about 40
percent in both 1997 and 1998. This increase was driven by two factors: the rise in the number
shares repurchased and the rise in price-earnings ratios. The role of higher price-earnings ratios
comes through clearly in the formula:
The first term on the right-hand side is related to the fraction of shares repurchased (as discussed
above) and the second term is the price-earnings ratio. The burden on current cash flow
associated with a given pace of share retirements rises in proportion to price-earnings ratios.
Over this period, the dividend payout rate, row (9), has been roughly flat at around 38
percent. Thus, the total net payout rate, which is the sum of rows (8) and (9) and is shown in line
(10), moved up from 56 percent in 1994 to 80 percent in 1998. This compares to a post-WWII
average dividend payout rate--prior to the recent widespread adoption of stock buybacks--of
around 55 percent. It thus seems unlikely that the total payout rate can increase much further,
absent a sizable increase in debt or a cutback in investment and, presumably, future growth.
The aggregate grant rate is calculated by multiplying the number of shares represented10
in a firm’s annual grants by its average market price, summing across firms and dividing by thetotal market value of outstanding shares.
10
4. Implications for Future Share Retirements
In light of the recent high net payout rate, it seems reasonable to question whether even
the recent 1 percent pace of share retirements is sustainable. Of course, a key ingredient to future
share retirements is the likely pace of employee option exercises and the ongoing cost of option
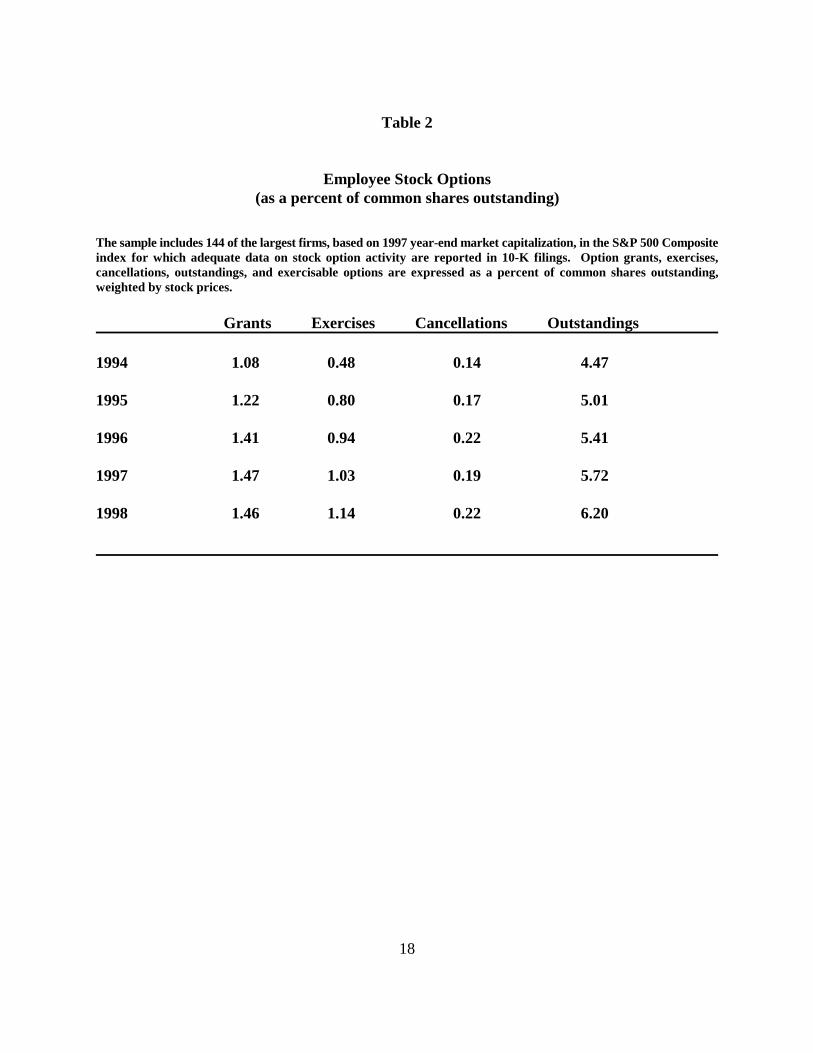
programs. Table 2 shows our tabulations of the annual flow of new grants of employee stock
options as a percent of common shares outstanding. These figures show that grants have10
trended up since 1994, but have hovered at about 1.45 percent of outstanding shares in the past
three years. With a 15 percent cancellation rate over the life of the average option, in line with
the experience of last few years, this would imply a 1.25 percent steady-state pace of issuance
from option exercises going forward, slightly above the pace in 1998 (shown in row (2), table 1).
4.1 Near-term considerations
If option exercises level out at an average annual rate of 1-1/4 percent of outstanding
shares in the near-term, then maintaining annual net share retirements at 1 percent would require
repurchasing 2-1/4 percent of outstanding shares each year. These repurchases would be partly
funded with proceeds from exercise-induced issuance; but, given the large inventory of
outstanding options issued prior to the run-up in equity prices over the last several years, those
proceeds will remain relatively low (as a fraction of market value) over the next few years.
Assuming proceeds continue to run at around 40 percent of the market value of exercise-related
issuance, option exercises of 1-1/4 percent of outstandings would bring in cash equal to 1/2
percent of market value; thus, a 1 percent rate for net share retirements would require an annual
net cash outflow of 1-3/4 percent of market value (2-1/4 less 1/2).
As discussed above, gauging the burden of this outflow on firms’ resources requires an
assumption on price-earnings ratios. Perhaps the most relevant perspective assumes recently
prevailing valuations, approximated by a S&P 500 price-earnings ratio of around 30. In that
case, maintaining the 1 percent retirement rate would require spending about 52 percent of

45&2045
11
earnings (1.75×30) on net repurchases. Assuming the dividend payout rate is maintained at 38
percent, then, in the near term, firms would be paying out nearly 90 percent of their earnings.
If the corporate sector is to sustain or better its average historical earnings growth rate
through reinvestment, then the high cash payout currently needed to ensure a 1 percent rate of net
retirements will require either a significant cut in dividends or increased debt. Indeed, in 1997
and 1998, the 144 firms in our sample spent nearly 125 percent of their earnings on net
investment outlays and stockholder payouts, suggesting that large corporations already have been
borrowing or running down financial assets to finance stock repurchases. Moreover, the recent
pace of debt growth, if sustained, implies a substantial increase in debt-to-asset ratios. With
average debt ratios at around 30 percent, firms could finance roughly 30 percent of their net
investment with debt and not drive up leverage. However, our figures (recent net investment
running at 45 percent of earnings and 20 percent of earnings being retained for investment) imply
that firms have been financing about 55 (or ) percent of their investment with debt, almost
double the rate consistent with current debt ratios.
Still, these firms probably can continue to finance this net investment pace and 2 percent
annual repurchases for some time; however, at current equity valuations, doing so will provide
little boost to their per share earnings. In particular, when the ratio of current earnings to share
price is lower than the after-tax interest rate--as it is now for many of these firms--then the
negative effect on earnings from higher interest expense (or forgone interest income) will
outweigh the positive effect from reducing share count.
4.2 The long run
The higher-than-normal profit growth in recent years has allowed companies to buy back
shares at a record pace. Assuming that, over the longer run, corporate returns on equity recede
toward their average historical levels, net share repurchases should also decline. At the same
time, a more normal pace of stock price gains going forward would eventually trim the pace of
dilution from stock option exercises, which would partially offset the negative effect on
retirements of lower repurchases.
For example, using conventional option pricing formulas, we calculate that the expected
value of the average option is about 30 percent of the market price of equity, about half the
This estimate assumes that employees exercise options about 5 to 6 years after grant,11
consistent with firms’ 10-K reports, and with documented exercise patterns (Huddart and Lang,1996, Carpenter, 1997).
Given our estimate of the expected annual cost of net option grants equal to .003712
percent of firm market value, and a PE ratio of 30, we estimate reported earnings--which do notaccount for the cost of grants--as overstating true earnings by about 11 percent ( .0037 x 30).
12
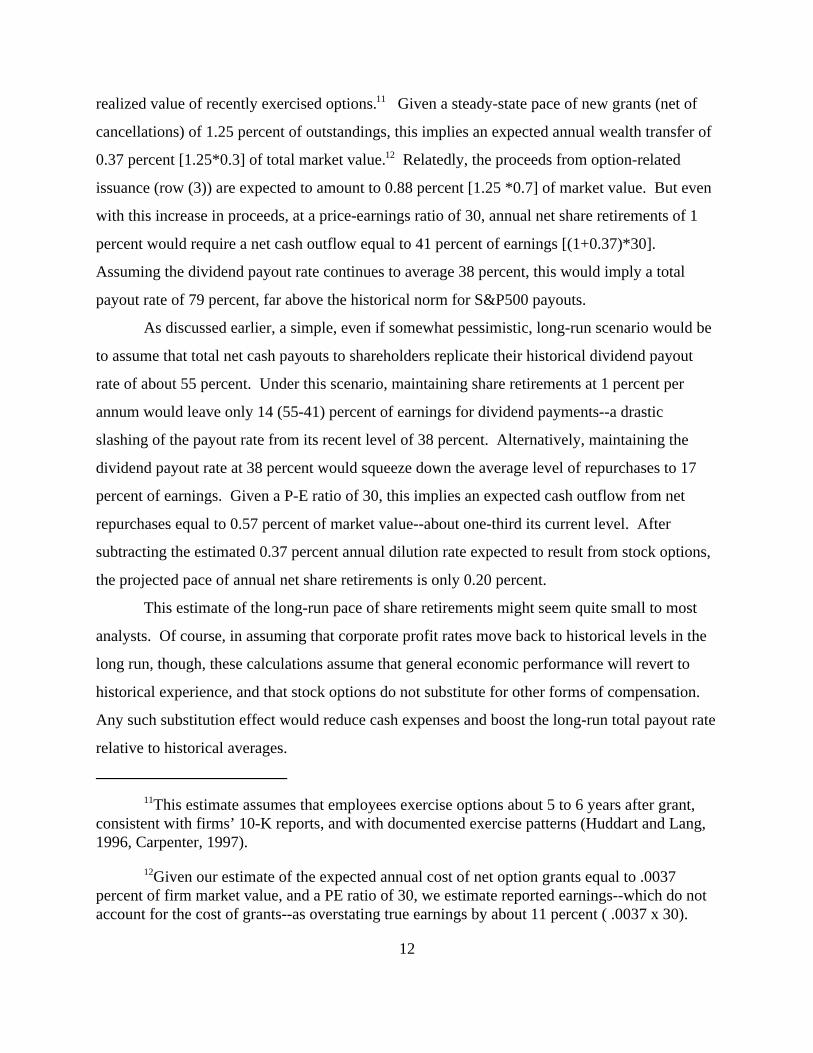
realized value of recently exercised options. Given a steady-state pace of new grants (net of11
cancellations) of 1.25 percent of outstandings, this implies an expected annual wealth transfer of
0.37 percent [1.25*0.3] of total market value. Relatedly, the proceeds from option-related12
issuance (row (3)) are expected to amount to 0.88 percent [1.25 *0.7] of market value. But even
with this increase in proceeds, at a price-earnings ratio of 30, annual net share retirements of 1
percent would require a net cash outflow equal to 41 percent of earnings [(1+0.37)*30].
Assuming the dividend payout rate continues to average 38 percent, this would imply a total
payout rate of 79 percent, far above the historical norm for S&P500 payouts.
As discussed earlier, a simple, even if somewhat pessimistic, long-run scenario would be
to assume that total net cash payouts to shareholders replicate their historical dividend payout
rate of about 55 percent. Under this scenario, maintaining share retirements at 1 percent per
annum would leave only 14 (55-41) percent of earnings for dividend payments--a drastic
slashing of the payout rate from its recent level of 38 percent. Alternatively, maintaining the
dividend payout rate at 38 percent would squeeze down the average level of repurchases to 17
percent of earnings. Given a P-E ratio of 30, this implies an expected cash outflow from net
repurchases equal to 0.57 percent of market value--about one-third its current level. After
subtracting the estimated 0.37 percent annual dilution rate expected to result from stock options,
the projected pace of annual net share retirements is only 0.20 percent.
This estimate of the long-run pace of share retirements might seem quite small to most
analysts. Of course, in assuming that corporate profit rates move back to historical levels in the
long run, though, these calculations assume that general economic performance will revert to
historical experience, and that stock options do not substitute for other forms of compensation.
Any such substitution effect would reduce cash expenses and boost the long-run total payout rate
relative to historical averages.

55%11100%11
Of course, because employees are likely to be risk averse, then in expectation, savings13
in current salaries could well be smaller than the expected cost of the stock options.
On the other hand, they do find that managerial share ownership has encouraged higher14
payouts by those firms with potentially the greatest agency problems. Similarly, Mehran (1995)finds evidence that firm profits are boosted by the managerial share ownership and stock-basedcompensation, expanding findings by Morck, Shleifer and Vishny (1988) that greatermanagement share ownership leads to higher firm value.
13
On the contrary, if granting stock options enables firms to reduce annual cash
compensation by an amount equal to the value of the grants, then those savings in cash expenses
could fund enough of a boost to share repurchases to eliminate the dilutive effect of stock
options. In the case at hand, we estimated the expected value of annual option grants to be 0.3713
percent of market value, which--given a PE ratio of 30--amounts to 11 percent of accounting
earnings. If this extra cost were completely offset by reduced cash compensation, firms would be
able to bump up their payout rate enough to offset the expected dilution from stock options. In
particular, the long-run payout rate could then be boosted from 55 to roughly 60 percent of
earnings ( = 59.5) while maintaining historical reinvestment rates; this would raise net
share retirements from .20 to .57 percent.
We have also abstracted from a possible net benefit of stock options--the better alignment
of manager and shareholder incentives and the retention of key employees. Such a benefit might
further boost the long-run return on equity, and, thus, the amount of cash flow available for
funding stock repurchases. Yet, abstracting from these factors is probably not an unreasonable
first-pass approach, given the available empirical evidence on the effect of employee stock
options on payouts and firm value. Fenn and Liang (1999)--the only study to date that has
directly tackled this question--does not find that options have led to greater total long-run
payouts; rather, the results suggest that options have led to a reduction in dividends that is only
offset by increased share repurchases.14
5. Calibrating the effect of expected retirements on equilibrium valuation
Our estimate of future annual share retirements between 0.20 and 0.57 percent is
considerably smaller than the 1 percent average share retirement rate we estimate for the past few
DP
% ( .55×EP
&DP
) & wealth transfer % g ' r
.55×EP
&DP
Note that the expected dividend yield of 1.25 percent is consistent with a steady-state15
PE ratio of 30.5 if the dividend payout rate is expected to remain at 38 percent (1.25*30=38).
14
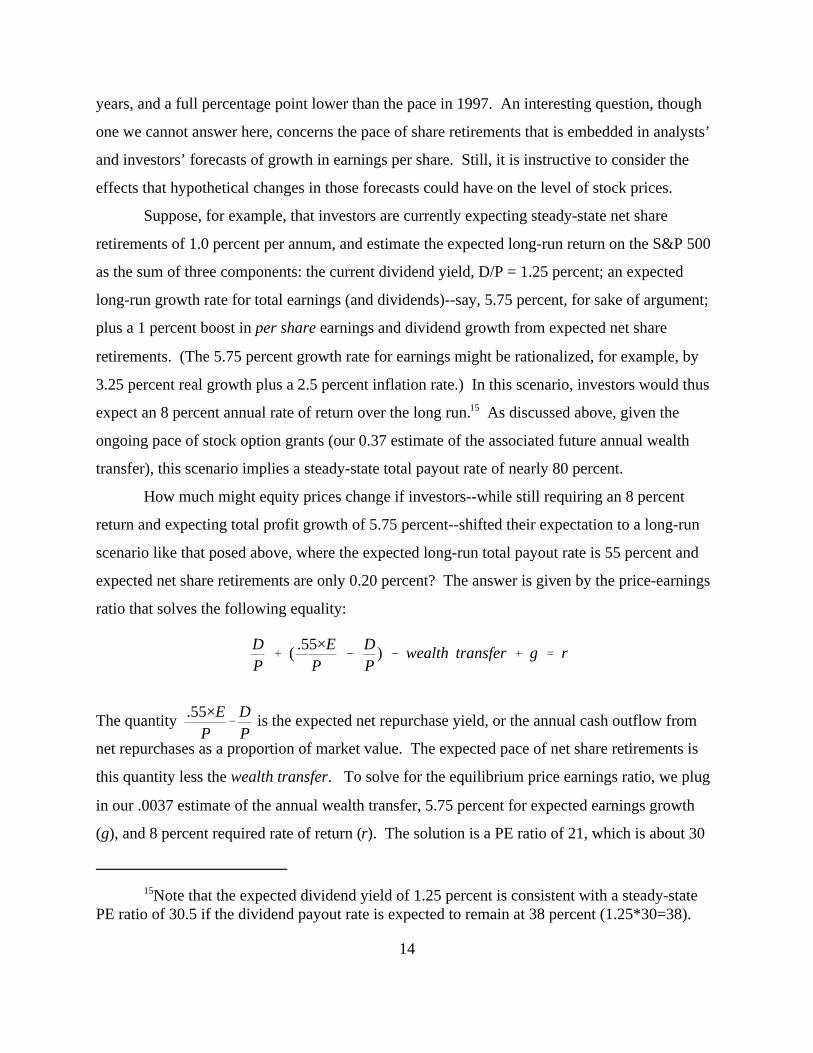
years, and a full percentage point lower than the pace in 1997. An interesting question, though
one we cannot answer here, concerns the pace of share retirements that is embedded in analysts’
and investors’ forecasts of growth in earnings per share. Still, it is instructive to consider the
effects that hypothetical changes in those forecasts could have on the level of stock prices.
Suppose, for example, that investors are currently expecting steady-state net share
retirements of 1.0 percent per annum, and estimate the expected long-run return on the S&P 500
as the sum of three components: the current dividend yield, D/P = 1.25 percent; an expected
long-run growth rate for total earnings (and dividends)--say, 5.75 percent, for sake of argument;
plus a 1 percent boost in per share earnings and dividend growth from expected net share
retirements. (The 5.75 percent growth rate for earnings might be rationalized, for example, by
3.25 percent real growth plus a 2.5 percent inflation rate.) In this scenario, investors would thus
expect an 8 percent annual rate of return over the long run. As discussed above, given the15
ongoing pace of stock option grants (our 0.37 estimate of the associated future annual wealth
transfer), this scenario implies a steady-state total payout rate of nearly 80 percent.
How much might equity prices change if investors--while still requiring an 8 percent
return and expecting total profit growth of 5.75 percent--shifted their expectation to a long-run
scenario like that posed above, where the expected long-run total payout rate is 55 percent and
expected net share retirements are only 0.20 percent? The answer is given by the price-earnings
ratio that solves the following equality:
The quantity is the expected net repurchase yield, or the annual cash outflow from
net repurchases as a proportion of market value. The expected pace of net share retirements is
this quantity less the wealth transfer. To solve for the equilibrium price earnings ratio, we plug
in our .0037 estimate of the annual wealth transfer, 5.75 percent for expected earnings growth
(g), and 8 percent required rate of return (r). The solution is a PE ratio of 21, which is about 30

.0125 % ( .60×EP
& .0125) & .0037 % .0575 ' .08
15
percent below the current PE ratio of roughly 30. Thus, a decline in the expected annual rate of
net share retirements from 1 percent to 0.20 percent rate would cause stock prices to drop by 30
percent. By boosting both the dividend yield and the net repurchase yield (and, thus, pace of net
retirements), this decline in valuations would restore the expected future return of 8 percent.
Consider instead the somewhat less pessimistic scenario which differs only in that firms’
savings in cash compensation are expected to offset the expected cost of option grants. As
argued earlier, long-term payout rates could then be boosted to about 60 percent of earnings,
which, at current valuations, would support annual net retirements of a little over ½ percent
annually. The equilibrium price-earnings ratio would thus be that which solves:
In this case, the solution is a PE ratio of 23, which is nearly 24 percent below the current PE
ratio, thereby implying a 24 percent drop in the market-clearing price of equities.
Of course, under either scenario, the effect of such revisions to expectations might be
exaggerated, as they assume that investors revise expectations for the infinite horizon. If,
instead, such a shift in expectations covered a horizon of, say, 20 years, then the effect on share
prices in either case would be more than halved, to about 15 or 20 percent. Still, these
hypotheticals--under which the return on equity and net cash payments to shareholders move
back to historical levels--demonstrate that a seemingly modest decline in the expected pace of
share retirements can have a large effect on stock prices.

16
References
Bernstein Research (1999). Mimeo. Sanford C. Bernstein & Co., August.
Carpenter, Jennifer (1997). "The Exercise and Valuation of Executive Stock Options," NYUStern School of Business, mimeo.
Cole, Kevin, Jean Helwege, and David Laster (1996), AStock Market Valuation Indicators: IsThis Time Different?@ Financial Analysts Journal, May/June, pp. 56-64.
Fenn, George and Nellie Liang (1999), "Corporate Payout Policy and Managerial StockIncentives, FEDS working paper 1999-23, Federal Reserve Board, March.
Huddart, Steven and Mark Lang (1996). "Employee Stock Option Exercises: An EmpiricalAnalysis," Journal of Accounting and Economics 21, 5-43.
Jagannathan, Murali, Clifford Stephens and Michael Weisbach (1998). "Financial Flexibility andthe Choice between Dividends and Stock Repurchases,@ University of Arizona, working paper,September.
Jolls, Christine, 1998, “The Role of Incentive Compensation in Explaining the Stock RepurchasePuzzle,” mimeo, Harvard Law School.
Lambert, Richard A., W. Lanen, and D. Larcker, 1989, “Executive Stock Option Plans andCorporate Dividend Policy,” Journal of Financial and Quantitative Analysis, 24, 409-425.
Mehran, Hamid (1995), AExecutive Compensation Structure, Ownership, and FirmPerformance,@ Journal of Financial Economics 38, 163-184.
Morck, Randall, Andrei Schleifer, and Robert Vishny (1988), AManagement Ownership andMarket Valuation: An Empirical Analysis,@ Journal of Financial Economics 20, 293-315.
Murray, Daniel (1999), AEmployee Stock Options Revisited,@ Report No. 131, Smithers & Co.Ltd., London.
Weisbenner, Scott J., 1999, “Corporate Share Repurchases in the mid-1990s: What Role doStock Options Play,” mimeo, MIT.

17
Table 1
Share Repurchase and Share Issuance via Employee Stock Options
The sample includes the largest 144 firms, based on market capitalization, in the S&P 500 Composite index for whichadequate data on stock option activity are reported in 10-K filings. Repurchases are measured by funds used to retirecommon stock. Issuance from option exercises is the market price times the number of shares issued to satisfy optionexercises. Market price is measured as the average of the prior year-end and current-year end market price. Exerciseproceeds is the average exercise price for all options exercised in that year times number of shares issued to satisfyoption exercises. Average market value is the average of the prior year-end and current year-end market value ofoutstanding common stock.
1994 1995* 1996 1997 1998 Long-Term ---------as a percent of average market value---------
(1) Repurchases 1.46 1.77 2.00 2.42 1.89 1.45
(2) Issuance from Option Exercises 0.52 0.80 0.94 1.03 1.14 1.25
(3) Net Retirements (1) - (2) 0.94 0.97 1.06 1.39 0.75 0.20
(4) Exercise Proceeds 0.27 0.43 0.44 0.44 0.40 0.88
(5) Realized Wealth Transfer (2) - (4) 0.25 0.37 0.50 0.59 0.74 0.37
(6) Net Cash Outflow from Repurchases 1.19 1.34 1.56 1.98 1.49 0.57 (1) - (4) or (3) + (5)
(7) Dividend yield 2.76 2.41 2.06 1.73 1.41 1.25
---------------------------------------------------------------------------------------------------------------------- ---------------as a percent of income---------------
(8) Net Repurchase Payout 17 21 26 40 41 17
(9) Dividend Payout 39 38 35 35 39 38
(10) Total Net Payout 56 59 61 75 80 55
* Excludes a $8.5 billion share repurchase by DuPont from a single shareholder.
18
Table 2
Employee Stock Options(as a percent of common shares outstanding)
The sample includes 144 of the largest firms, based on 1997 year-end market capitalization, in the S&P 500 Compositeindex for which adequate data on stock option activity are reported in 10-K filings. Option grants, exercises,cancellations, outstandings, and exercisable options are expressed as a percent of common shares outstanding,weighted by stock prices.
Grants Exercises Cancellations Outstandings
1994 1.08 0.48 0.14 4.47
1995 1.22 0.80 0.17 5.01
1996 1.41 0.94 0.22 5.41
1997 1.47 1.03 0.19 5.72
1998 1.46 1.14 0.22 6.20

Share repurchases
Dividends
1982 1984 1986 1988 1990 1992 1994 1996 19980
30
60
90
120
150
180
Figure 1
S&P 500 Shareholder Payouts*Billions of dollars
*Excludes commercial banks.Source. Compustat.