Embed Size (px)
DESCRIPTION
URBAN GROWTH MODELING USING MULTI-TEMPORAL IMAGES AND CELLULAR AUTOMATA – A CASE STUDY OF INDIANAPOLIS. SHARAF ALKHEDER & JIE SHAN GEOMATICS ENGINEERING AREA SCHOOL OF CIVIL ENGINEERING PURDUE UNIVERSITY. OUTLINE. Introduction. Statement of the problem. Focus of our work. - PowerPoint PPT Presentation
Citation preview

Indiana GIS Conference, MarchIndiana GIS Conference, March 7-8, 2006 7-8, 2006
1
URBAN GROWTH MODELING USING URBAN GROWTH MODELING USING MULTI-TEMPORAL IMAGES AND CELLULAR MULTI-TEMPORAL IMAGES AND CELLULAR
AUTOMATA – A CASE STUDY OF AUTOMATA – A CASE STUDY OF INDIANAPOLISINDIANAPOLIS
SHARAF ALKHEDER & JIE SHANSHARAF ALKHEDER & JIE SHAN
GEOMATICS ENGINEERING AREAGEOMATICS ENGINEERING AREA
SCHOOL OF CIVIL ENGINEERINGSCHOOL OF CIVIL ENGINEERING
PURDUE UNIVERSITYPURDUE UNIVERSITY

Indiana GIS Conference, MarchIndiana GIS Conference, March 7-8, 2006 7-8, 2006
2
OUTLINEOUTLINE
Introduction.Introduction.
Statement of the problem.Statement of the problem.
Focus of our work.Focus of our work.
Cellular Automata (CA) urban growth Cellular Automata (CA) urban growth modeling:modeling:
Artificial city modeling (synthetic data).Artificial city modeling (synthetic data). Real city modeling (Indianapolis).Real city modeling (Indianapolis).
Conclusions.Conclusions.
Work in progress.Work in progress.

Indiana GIS Conference, MarchIndiana GIS Conference, March 7-8, 2006 7-8, 2006
3
INTRODUCTIONINTRODUCTION
Urban growth process is complex in its Urban growth process is complex in its nature.nature.
Urban growth modeling is a necessity for Urban growth modeling is a necessity for each municipality.each municipality.
Simulation & prediction of urbanization Simulation & prediction of urbanization process help infrastructure planning.process help infrastructure planning.
Cellular Automata (CA) is promising due to Cellular Automata (CA) is promising due to its ability to learn and simulate complex its ability to learn and simulate complex processes that not possible with processes that not possible with mathematical models. mathematical models.
Cellular Automata (CA) for 2D spatial Cellular Automata (CA) for 2D spatial modelling.modelling.

Indiana GIS Conference, MarchIndiana GIS Conference, March 7-8, 2006 7-8, 2006
4
STATEMENT OF THE PROBLEMSTATEMENT OF THE PROBLEM
Urban areas undergo accelerated urban Urban areas undergo accelerated urban growth rates. growth rates.
Multi-temporary images are useful Multi-temporary images are useful resource.resource.
The objective is to use CA with satellite The objective is to use CA with satellite images to model the spatial & temporal images to model the spatial & temporal growth of Indianapolis.growth of Indianapolis.
CA for complex processes modeling in a CA for complex processes modeling in a grid space.grid space.
19731973 19871987 20032003

Indiana GIS Conference, MarchIndiana GIS Conference, March 7-8, 2006 7-8, 2006
5
FOCUS OF OUR WORKFOCUS OF OUR WORK
Development and calibration of CA model.Development and calibration of CA model.
Spatial & temporal calibration algorithm Spatial & temporal calibration algorithm design.design.
CA rules calibration:CA rules calibration: Using Multi-temporal data.Using Multi-temporal data. Based on neighborhood structure and input data.Based on neighborhood structure and input data. Based on modeling error feedback (over/under Based on modeling error feedback (over/under
estimate).estimate).
Township based evaluation.Township based evaluation.
Integrate with commercial GIS (ArcGIS, VBA).Integrate with commercial GIS (ArcGIS, VBA).

Indiana GIS Conference, MarchIndiana GIS Conference, March 7-8, 2006 7-8, 2006
6
CELLULAR AUTOMATA (CA) CELLULAR AUTOMATA (CA) THEORYTHEORY CA introduced by Ulam and von Neumann in 1940s to CA introduced by Ulam and von Neumann in 1940s to
study the behaviour of complex systems.study the behaviour of complex systems. CA: An iterative dynamical discrete system in space CA: An iterative dynamical discrete system in space
and time that operates on a uniform grid under and time that operates on a uniform grid under certain rules.certain rules.
Four components of CA:Four components of CA: Cells/pixels, States, Cells/pixels, States, Neighborhood & Transition rules.Neighborhood & Transition rules.
Let Let II represents integers set. For a cellular space represents integers set. For a cellular space over the set over the set IIxxII ; the neighborhood function for cell ; the neighborhood function for cell αα is is defined as:defined as:
Where; Where; δδii(i = 1…n) is index of the neighborhood pixels.(i = 1…n) is index of the neighborhood pixels.
The CA system in a symbolic notation is defined as:The CA system in a symbolic notation is defined as:
Where; is distinct element of cellular states V & is the local Where; is distinct element of cellular states V & is the local
transition function. (rules on neighborhood).transition function. (rules on neighborhood).

Indiana GIS Conference, MarchIndiana GIS Conference, March 7-8, 2006 7-8, 2006
7
CELLULAR AUTOMATA (CA) CELLULAR AUTOMATA (CA) THEORYTHEORY The neighborhood function The neighborhood function is is
defined as:defined as:
Where; are the current Where; are the current states of tested pixel and its neighborhood.states of tested pixel and its neighborhood.
Relation between the state of cell Relation between the state of cell αα at time (t+1) at time (t+1) and its neighborhood states at time t is expressed and its neighborhood states at time t is expressed as:as:
represents the CA transition rules defined on represents the CA transition rules defined on αα and neighborhood states to drive the modelling process. and neighborhood states to drive the modelling process.
The neighborhood (e.g. square) over the The neighborhood (e.g. square) over the IIxxII space space presented as a city-block metric :presented as a city-block metric :

Indiana GIS Conference, MarchIndiana GIS Conference, March 7-8, 2006 7-8, 2006
8
CA FOR URBAN GROWTH CA FOR URBAN GROWTH MODELLINGMODELLING
CA mechanism: CA mechanism: complex complex
phenomenon can phenomenon can be modeled by a # be modeled by a # of simpler ones. of simpler ones.
CA composed of CA composed of cellcell, state, , state, neighborhood and neighborhood and transition rules.transition rules.
The future state of The future state of a cell depends on:a cell depends on:
- Its current - Its current state.state.
- Neighborhood - Neighborhood states.states. - T- Transition ransition
rulesrules..

Indiana GIS Conference, MarchIndiana GIS Conference, March 7-8, 2006 7-8, 2006
9
ARTIFICIAL CITY CA URBAN ARTIFICIAL CITY CA URBAN GROWTHGROWTH
OBJECTIVES:OBJECTIVES:
MMimic the reality by introducing complex imic the reality by introducing complex structures for an urban system.structures for an urban system.
To test the effect of a number of factors To test the effect of a number of factors and constraints on urban growth.and constraints on urban growth.
To design the CA system transition rules To design the CA system transition rules as a function of neighborhood structure.as a function of neighborhood structure.
CA CA design is based on the effect of each design is based on the effect of each land use. E.g., roads encourage and drive land use. E.g., roads encourage and drive the urban development.the urban development.

Indiana GIS Conference, MarchIndiana GIS Conference, March 7-8, 2006 7-8, 2006
10
ARTIFICIAL CITY CA URBAN GROWTHARTIFICIAL CITY CA URBAN GROWTH 200x200 pixels image input to the CA algorithm.200x200 pixels image input to the CA algorithm. The CA rules are defined with the The CA rules are defined with the motivation that they represent eachmotivation that they represent each land use effect on the growth process.land use effect on the growth process. Growth constraints are take into Growth constraints are take into consideration in rules definition.consideration in rules definition. CA rules:CA rules: for tested pixel for tested pixel
IF it is river, road, lake, urban IF it is river, road, lake, urban or pollution source, THEN no growth.or pollution source, THEN no growth. IF it is non-urban IF it is non-urban ANDAND 1 or more 1 or more
of neighborhood are pollution, of neighborhood are pollution, THEN keep non-urban.THEN keep non-urban.
IF it is non-urban AND the # urban pixels in the IF it is non-urban AND the # urban pixels in the neighborhood is >= than 3 AND there is no pollution neighborhood is >= than 3 AND there is no pollution pixel THEN change it to urban.pixel THEN change it to urban.
IF non-urban AND IF non-urban AND 1 or more of the neighborhood 1 or more of the neighborhood road AND 1 or more urban AND no pollution pixel, road AND 1 or more urban AND no pollution pixel, THEN change to urban.THEN change to urban.
Indiana GIS Conference, MarchIndiana GIS Conference, March 7-8, 2006 7-8, 2006
11
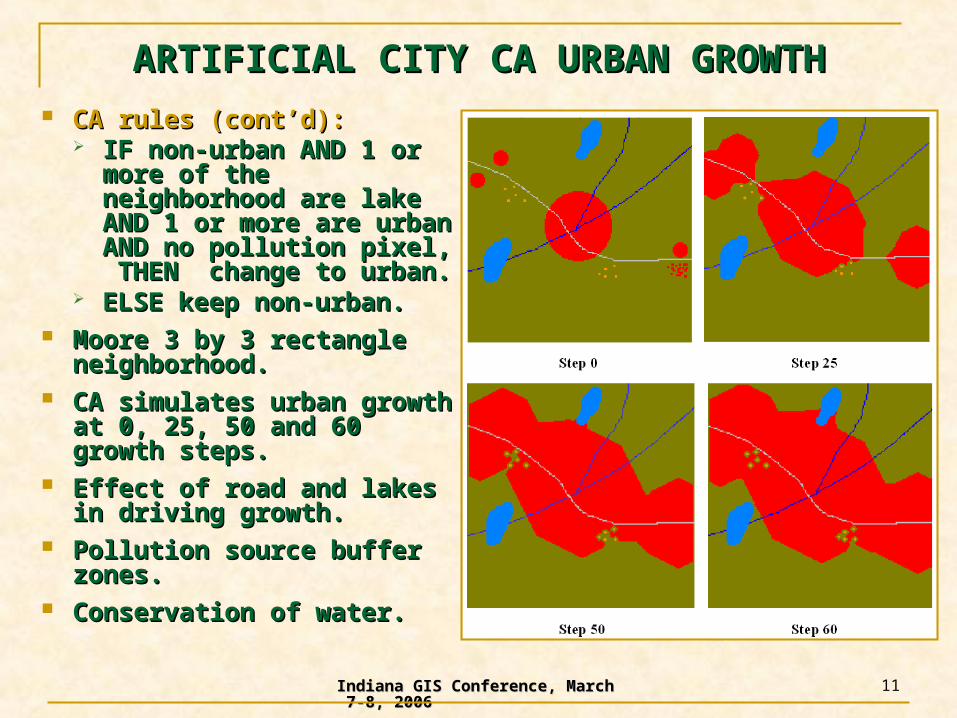
ARTIFICIAL CITY CA URBAN GROWTHARTIFICIAL CITY CA URBAN GROWTH CA rules (cont’d):CA rules (cont’d):
IF IF non-urban AND 1 or non-urban AND 1 or more of the more of the neighborhood are lake neighborhood are lake AND 1 or more are AND 1 or more are urban AND no pollution urban AND no pollution pixel, THEN change to pixel, THEN change to urban.urban.
ELSE keep non-urban.ELSE keep non-urban. Moore 3 by 3 rectangle Moore 3 by 3 rectangle
neighborhood.neighborhood. CA CA simulates urban simulates urban
growth at 0, 25, 50 and 60 growth at 0, 25, 50 and 60 growth steps.growth steps.
Effect of road and lakes in Effect of road and lakes in driving growth.driving growth.
Pollution source buffer Pollution source buffer zones.zones.
Conservation of water.Conservation of water.

Indiana GIS Conference, MarchIndiana GIS Conference, March 7-8, 2006 7-8, 2006
12
REAL CITY (INDIANAPOLIS) CA REAL CITY (INDIANAPOLIS) CA GROWTHGROWTH
Extending the artificial city CA model for real Extending the artificial city CA model for real city.city.
Complex structure and interaction of Complex structure and interaction of development factors result in growth pattern.development factors result in growth pattern.
Careful design of CA transition rules.Careful design of CA transition rules. Model calibration and evaluation is needed.Model calibration and evaluation is needed.
Indianapolis is located in Marion County at Indianapolis is located in Marion County at latitude 39°44'N and longitude of 86°17'W.latitude 39°44'N and longitude of 86°17'W.
Grown from part of Marion in 70’s to the Grown from part of Marion in 70’s to the whole County and parts of the neighboring in whole County and parts of the neighboring in 2003.2003.

Indiana GIS Conference, MarchIndiana GIS Conference, March 7-8, 2006 7-8, 2006
13
INDIANAPOLIS CA GROWTH - INDIANAPOLIS CA GROWTH - INPUT INPUT DATADATA
1. 1. Multitemporal Satellite Imagery:Multitemporal Satellite Imagery: 5 historical MSS/TM satellite images : 5 historical MSS/TM satellite images :
(1973, 1982, 1987, 1992 and 2003).(1973, 1982, 1987, 1992 and 2003). Images are projected to UTM NAD1983 Images are projected to UTM NAD1983
zone 16N & registered.zone 16N & registered. Ground reference data are used to Ground reference data are used to
classify the images.classify the images. 7 classes are defined: water, road, 7 classes are defined: water, road,
commercial, forest, residential, pasture commercial, forest, residential, pasture and row crops.and row crops.
High classification accuracy (>92%).High classification accuracy (>92%). Commercial and residential classes Commercial and residential classes
represent urban class.represent urban class.

Indiana GIS Conference, MarchIndiana GIS Conference, March 7-8, 2006 7-8, 2006
14
INDIANAPOLIS CA GROWTH - INDIANAPOLIS CA GROWTH - INPUT INPUT DATADATA
2. 2. Population Density Maps:Population Density Maps: Another input to CA model.Another input to CA model. A population density model for each A population density model for each
growth year is prepared.growth year is prepared. 2000 Census tract map is used.2000 Census tract map is used. Area for each census tractArea for each census tract is calculated.is calculated. Population density is Population density is
computed per census tract.computed per census tract.
(Source, IGS)(Source, IGS)

Indiana GIS Conference, MarchIndiana GIS Conference, March 7-8, 2006 7-8, 2006
15
INDIANAPOLIS CA GROWTH - INDIANAPOLIS CA GROWTH - INPUT INPUT DATADATA
2. 2. Population Density Maps:Population Density Maps: An exponential model is fitted between An exponential model is fitted between
density and distance from city center.density and distance from city center.
The model is used to calculate population The model is used to calculate population density per pixel for entire image for each density per pixel for entire image for each growth year.growth year.
Model parameters are updated yearly based Model parameters are updated yearly based on population growth rate.on population growth rate.
Population density is used as another CA Population density is used as another CA input.input.

Indiana GIS Conference, MarchIndiana GIS Conference, March 7-8, 2006 7-8, 2006
16
CA TRANSITION RULESCA TRANSITION RULES
CA rules based on:CA rules based on: Land use effectLand use effect: :
growth growth constraints.constraints.
Closeness to cityCloseness to city: : positive effect.positive effect. Population Population
density.density. 3 by 3 Moore 3 by 3 Moore
neighborhood.neighborhood. CA calibration CA calibration
involves two involves two aspects: Spatial aspects: Spatial and Temporal and Temporal calibration.calibration.
Future

Indiana GIS Conference, MarchIndiana GIS Conference, March 7-8, 2006 7-8, 2006
17
CA ALGORITHM DESIGNCA ALGORITHM DESIGN CA Modelling in ArcGIS through VBA.CA Modelling in ArcGIS through VBA. CA transition rules are defined as a CA transition rules are defined as a
function of neighborhood structure and function of neighborhood structure and population density.population density.
Two set of multitemporal imagery:Two set of multitemporal imagery:
- Training images 1982 & 1987 to - Training images 1982 & 1987 to calibrate the CA rules.calibrate the CA rules.
- Testing images of 1992 and 2003 for - Testing images of 1992 and 2003 for validation purposes only. validation purposes only.
CA rules are initialized to run the CA rules are initialized to run the simulation from 1973 till 1982simulation from 1973 till 1982..

Indiana GIS Conference, MarchIndiana GIS Conference, March 7-8, 2006 7-8, 2006
18
CA ALGORITHM DESIGNCA ALGORITHM DESIGN Spatial calibration at 1982 Spatial calibration at 1982 on a township basis.on a township basis. Rules are calibrated based Rules are calibrated based on township site specific on township site specific features. features. Evaluate urban class per Evaluate urban class per region for simulated and region for simulated and real images at 1982.real images at 1982. Calculate region & Calculate region & average accuracy as a ratio average accuracy as a ratio between simulated and between simulated and real urban amount.real urban amount.

Indiana GIS Conference, MarchIndiana GIS Conference, March 7-8, 2006 7-8, 2006
19
CA ALGORITHM DESIGNCA ALGORITHM DESIGN
IF over/under estimate increase/decrease IF over/under estimate increase/decrease urban growth rate through modifying the rules, urban growth rate through modifying the rules, respectively. respectively.
Run the simulation again from 1973 to 1982 Run the simulation again from 1973 to 1982 and evaluate.and evaluate.
Run till simulated results closely estimate real Run till simulated results closely estimate real growth.growth.
For temporal calibration, Recalibrate again For temporal calibration, Recalibrate again spatially at 1987 to adapt growth pattern over spatially at 1987 to adapt growth pattern over time. time.
Predict urban growth at 1992 (from 1987) for 5 Predict urban growth at 1992 (from 1987) for 5 years interval and 2003 for 11 years interval years interval and 2003 for 11 years interval (from 1992).(from 1992).

Indiana GIS Conference, MarchIndiana GIS Conference, March 7-8, 2006 7-8, 2006
20
ARCGIS-CA TOOL ARCGIS-CA TOOL DEVELOPMENTDEVELOPMENT

Indiana GIS Conference, MarchIndiana GIS Conference, March 7-8, 2006 7-8, 2006
21
CA MODELING RESULTS - CA MODELING RESULTS - CALIRATIONCALIRATION
CloseClose
matchmatch Spatial Spatial
calibration calibration
effect.effect.

Indiana GIS Conference, MarchIndiana GIS Conference, March 7-8, 2006 7-8, 2006
22
CA MODELING RESULTS - CA MODELING RESULTS - CALIRATIONCALIRATION
Temporal Temporal
calibration calibration
Effect.Effect.

Indiana GIS Conference, MarchIndiana GIS Conference, March 7-8, 2006 7-8, 2006
23
CA MODELING RESULTS – CA MODELING RESULTS – PREDICTION (1992)PREDICTION (1992) Short term prediction (5 years).Short term prediction (5 years).
Good Good
accuracyaccuracy

Indiana GIS Conference, MarchIndiana GIS Conference, March 7-8, 2006 7-8, 2006
24
CA MODELING RESULTS – CA MODELING RESULTS – PREDICTION (2003)PREDICTION (2003)
Good Good
accuracyaccuracy
PatternPattern
matchmatch

Indiana GIS Conference, MarchIndiana GIS Conference, March 7-8, 2006 7-8, 2006
25
CA CA PREDICTIONPREDICTION RESULTS ACCURACY RESULTS ACCURACY
HigherHigher
accuracy for accuracy for
short term.short term.
Township effectTownship effect
on improving on improving
accuracy.accuracy.
Low variability.Low variability.

Indiana GIS Conference, MarchIndiana GIS Conference, March 7-8, 2006 7-8, 2006
26
CONCLUSIONSCONCLUSIONS Multitemporal imagery is a rich source Multitemporal imagery is a rich source
for urban growth modeling.for urban growth modeling. CA show great potential to model the 2D CA show great potential to model the 2D
growth process.growth process. Error model of comparing the real and Error model of comparing the real and
simulated images on a township basis is simulated images on a township basis is the basis of calibration process.the basis of calibration process.
Importance of spatial calibration on Importance of spatial calibration on township basis to improve the spatial township basis to improve the spatial prediction accuracy.prediction accuracy.
Temporal calibration to adapt the Temporal calibration to adapt the growth pattern over time.growth pattern over time.

Indiana GIS Conference, MarchIndiana GIS Conference, March 7-8, 2006 7-8, 2006
27
WORK IN PROGRESS….WORK IN PROGRESS….
Fuzzy CA modeling to preserve the Fuzzy CA modeling to preserve the continuous nature of the growth continuous nature of the growth process.process.
Genetics algorithms for efficient and Genetics algorithms for efficient and automatic CA transition rules automatic CA transition rules calibration.calibration.

Indiana GIS Conference, MarchIndiana GIS Conference, March 7-8, 2006 7-8, 2006
28
Thanks For Listening. Questions!!Thanks For Listening. Questions!!
SHARAF ALKHEDER & JIE SHANSHARAF ALKHEDER & JIE SHANGEOMATICS ENGINEERING AREAGEOMATICS ENGINEERING AREASCHOOL OF CIVIL ENGINEERINGSCHOOL OF CIVIL ENGINEERING(salkhede,jshan )@ecn.purdue.edu(salkhede,jshan )@ecn.purdue.eduPURDUE UNIVERSITYPURDUE UNIVERSITY