Embed Size (px)
Citation preview

8/11/2019 Shafiq Paper Solar Energy
http://slidepdf.com/reader/full/shafiq-paper-solar-energy 1/6

8/11/2019 Shafiq Paper Solar Energy
http://slidepdf.com/reader/full/shafiq-paper-solar-energy 2/6
1972 M.S. Siraj / Renewable and Sustainable Energy Reviews 16 (2012) 1971–1976
Nomenclature
SDES sun-dependent energy sourcesSIES sun-independent energy sourcesEJ exa-jouleGJ giga-joule
available almost forever. On the other hand, it is only available indenite quantities andwill eventually be lost mostlyto outer spacein the form of infrared radiation – an inevitable fate [1] . The sun,which is normally considered an innite source of energy, is, onthe contrary, a typical example of a continuously depleting source.Consequently, all the resources on earth which are directly depen-dent on the sun hence are not renewable, in contrast to what isgenerally perceived as renewable resources. Therefore, a new clas-sication of energy sources is given as the sun-dependent energysources (SDES) and sun-independent energy sources (SIES).
1.2. Energy denition
A broader picture can be perceived more easily with a precise
denition of energy. However, even some advanced texts do notdene energyand simplygo deeperinto thediscussion [2–7] . Somedene energyas: theability/capacityof a body orsystem todo work[8] . The authorpresentsa modied new denitionto energyas “theultimate capacity of anything to do work”.
1.3. Energy requirement estimates
Energy requirements depend on a number of factors: primar-ily, the prosperity of a nation; secondly, climatic conditions; andthirdly, efcient use of energy. The efcient use of energy dependson specic national policy of a country, mostly driven by the factorof self sufciency of a country in energy resources.
Fig. 1 shows the historical world population gures since 1950
and projection till the year 2300 according to latest UN gures [9] .It shows three possible scenarios after year 2010: low, medium,and high. We will only consider the medium level increase sce-nario for our calculations involving world population. Previous UNstudies [10] alsosuggesteda similar trend forstabilization of worldpopulation at around 10 billion from around year 2200 onward.
As discussed,the primary energyconsumption/requirementperperson in the world depends on several factors e.g., prosperity of anation, energy dependence on foreign resources, national policy,
Fig. 1. World population – history and projection.
Fig. 2. Energy use perperson – USA, Germany, China, India,and theWorld.
use of energy-efcient technology, average winter and summertemperatures,etc. Therefore,differentcountries havedifferentcon-sumption values of energy use per person.
Fig. 2 shows energy use per person per year during a ten yearperiod (from 1999 to 2008) for The United States, Germany, China,India, and the World [11–17] . The United States consumes moreenergy per person than any other country in the world [18] . USAandGermany, however,show a slightdecrease inthe energyuse perpersonnearthe end of these ten years.On the other hand, India andChina, which are typical examples of rapidly growing economiesfrom the developing world, show an increase in the energy useper person during this period. The World, as whole, also showsan increase over this period due to sharper increase in energy useby some rapidly growing economies like Brazil, Russia, India andChina (also known as BRIC) in the developing world. For our cal-culations of the energy consumptions in the future, i.e., from year2100 onward, we will assume a value of 250 GJ energy use per per-
son in the world which is approximate average for energy use perperson in the USA and Germany during this time period, i.e., from1999 to 2008.
USA and Germany both fall in the world’s richest countries’ cat-egory. However, the energy use per person in the USA is almostdouble than in Germany. The general reasons for this are dis-cussed above. Specically in case of Germany, for example, thereis more energy dependence on foreign resources, leading to aculture of economic energy-use policy, compact and better insu-lated housing-units compared to USA, and (to some extent) due toless-severe average winter-and-summer temperatures comparedto USA.
Table 1 shows world’s primary energy consumption from year2004 to 2009 [12–17] . It shows an average annual increase of 1.6%
in these years. As will be discussed later that this average annualincrease of ∼ 1.6% of the world from 2004 to 2009 is almost equalto the average annual increase of 1.75% from year 2009 to 2100(calculated next).
Table 1World primary energy consumption (EJ) in theyears from 2004 to 2009 [12–17] .
Year Oil Natural gas Coal Nuclear Hydro Total % increase
2004 159.0 101.5 117.2 26.2 26.9 430.92005 161.7 105.2 123.8 26.3 27.9 444.8 3.12006 163.7 107.1 127.3 26.6 29.2 454.0 2.02007 164.9 111.0 133.7 26.1 29.1 464.9 2.42008 165.8 113.8 137.6 26.0 30.6 473.7 1.92009 162.5 111.1 137.3 25.6 31.0 467.4 − 1.4
Average increase from 2004 to 2009 =1.6%.
8/11/2019 Shafiq Paper Solar Energy
http://slidepdf.com/reader/full/shafiq-paper-solar-energy 3/6
M.S. Siraj / Renewable and Sustainable Energy Reviews 16 (2012) 1971–1976 1973
Fig. 3. World primary energyconsumptionduring thepast ve years from 2004 to2009.
Fig. 3 is plotted using the data in Table 1 and shows the world’sprimary energyconsumptionin the past veyears, i.e., 2004–2009.Themajorshare in theenergy market, as shown in thegure, comesfrom oil, followed by coal and natural gas. Thus fossils at this stagecontribute more than 80% in the total energy requirements of theworld.
2. Major energy sources
2.1. Sun-dependent energy sources (SDES)
Major sun-dependent energy sources (SDES) are solar, hydro,biomass, wind, tidal, wave, ocean thermal energy conversion, etc.
2.2. Sun-independent energy sources (SIES)
Majorsun-independent energysources are geothermal, nuclearssion and nuclear fusion.
3. Current/future energy use options
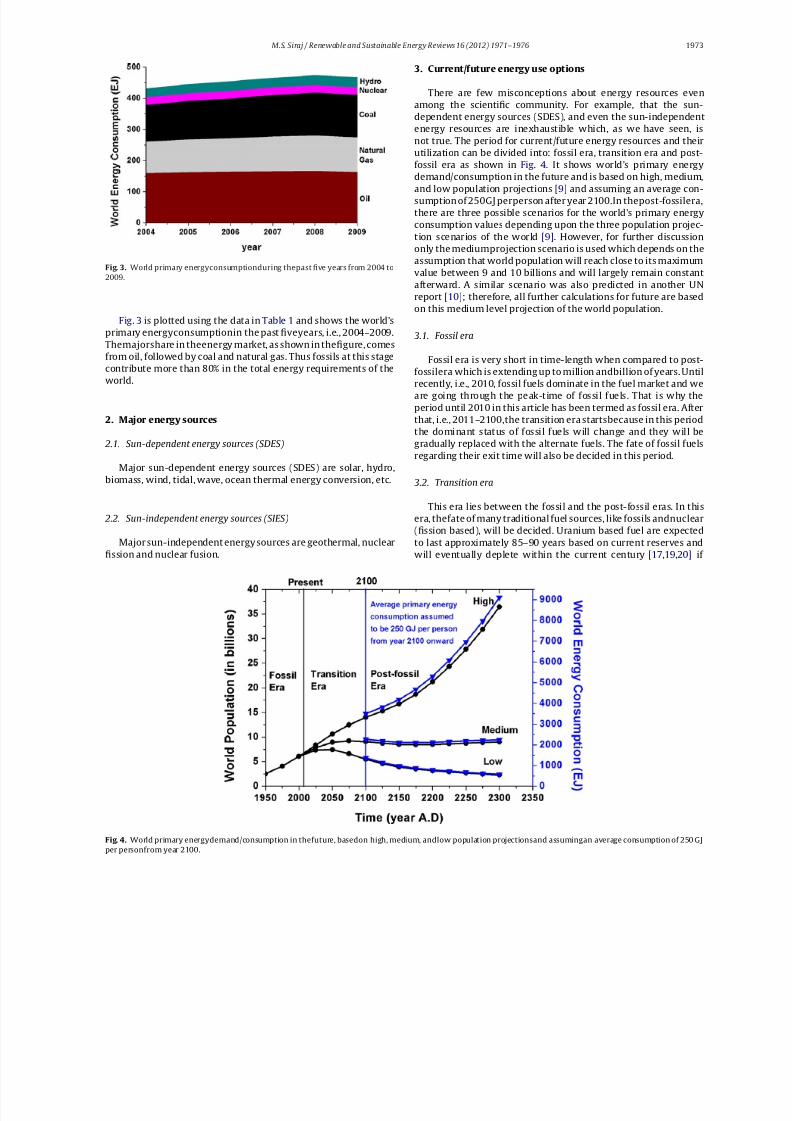
There are few misconceptions about energy resources evenamong the scientic community. For example, that the sun-dependent energy sources (SDES), and even the sun-independentenergy resources are inexhaustible which, as we have seen, isnot true. The period for current/future energy resources and theirutilization can be divided into: fossil era, transition era and post-fossil era as shown in Fig. 4 . It shows world’s primary energydemand/consumption in the future and is based on high, medium,and low population projections [9] and assuming an average con-sumption of 250GJ perperson after year 2100.In thepost-fossilera,there are three possible scenarios for the world’s primary energyconsumption values depending upon the three population projec-tion scenarios of the world [9] . However, for further discussiononly the mediumprojection scenario is used which depends on theassumption that world population will reach close to its maximumvalue between 9 and 10 billions and will largely remain constantafterward. A similar scenario was also predicted in another UNreport [10] ; therefore, all further calculations for future are basedon this medium level projection of the world population.
3.1. Fossil era
Fossil era is very short in time-length when compared to post-fossilera which is extending up to million andbillion of years. Untilrecently, i.e., 2010, fossil fuels dominate in the fuel market and weare going through the peak-time of fossil fuels. That is why theperiod until 2010 in this article has been termed as fossil era. Afterthat, i.e., 2011–2100,the transition era startsbecause in this periodthe dominant status of fossil fuels will change and they will begradually replaced with the alternate fuels. The fate of fossil fuelsregarding their exit time will also be decided in this period.
3.2. Transition era
This era lies between the fossil and the post-fossil eras. In thisera, thefate of many traditional fuel sources, like fossils andnuclear(ssion based), will be decided. Uranium based fuel are expectedto last approximately 85–90 years based on current reserves andwill eventually deplete within the current century [17,19,20] if
Fig. 4. World primary energydemand/consumption in thefuture, basedon high, medium, andlow population projectionsand assumingan average consumption of 250 GJ
per
personfrom year 2100.

8/11/2019 Shafiq Paper Solar Energy
http://slidepdf.com/reader/full/shafiq-paper-solar-energy 4/6
1974 M.S. Siraj / Renewable and Sustainable Energy Reviews 16 (2012) 1971–1976
Fig. 5. World population and total energy use in the current century – transitionperiod.
fast breeder reactors do not replace the existing nuclear powerplants. Public acceptability, especially after some severe nuclearaccidents in the recent past, is a big question even if the ssionbased fast-reactor technology is ready to replace the current tech-
nology. Therefore, ssion based nuclear reactors are less likelyto continue in the 22nd century. Similarly, the next few decadeswithin the current century will also decide the feasibility and start-ing point (for commercial availability) of fusion energy. Althoughfusion energy (as will be discussed later) is almost certain to playa major role in the future energy supplies, the only uncertaintyis the starting point for its commercial availability and the futureenergy-use policy.
There area numberof scenariosand projections forfossils beingwiped-out from the planet making it hard to speculate a date orexact year for their phase-out. However, in the long time-scale of energy-use,we cansafelydeduce the expectedcentury fordifferentfossil fuels’exit, for example, 22nd century for oiland gas, and23rdor 24th century for coal. Fossil fuels will have their peak in the
current (21st) century but within the same century their share willreduce from dominant to meager.Fig. 5 shows variation of world population (assuming a medium
level increase according to UN estimates [9] ) and total energy-useby the world. The total energy use during this transition periodwas calculated by assuming an average annual increase of 1.75% inenergy consumption by the world. This annual increase was calcu-lated by using the total primary energy consumption value in 2009[12] and 2100. The annual energy consumption in 2100 was cal-culated from our energy-use per person value of 250GJ (averageof current energy use per person by two advanced countries. i.e.,USA and Germany) and the world population value of 9.064 billionaccordingto medium-level-increase projectionof UN estimates [9] .This average annual increase of 1.75% (from year 2009 to 2100) in
world’s primary energy consumption is almost equal to the aver-age increase of ∼ 1.6% in the past ve years, i.e., from 2004 to 2009[12–17] .
3.3. Post-fossil era
Post fossil era can be further divided into the sun-dependentenergy sources era and sun-independent energy sources era.
3.3.1. Sun-dependent energy sources eraThe sun-dependent energy sources era will last another 5–10
billion years from now. Table 2 summarizes the theoretical andtechnical potential and availability time for sun-dependent energysources. It is to be noted that only theoretical and technical poten-
tials areconsideredin Tables2and3 and notthe economic potential
assuming thatafter technological advancement fromyear 2100, theeconomic potential might not be a constraint in the extraction of energy from different sources.
Among these sun-dependent energy sources, the biggest sourceis directly the sun itself, i.e., the solar energy. The technical poten-tial forsolarenergy is greater than 1575 EJ peryear [19] andit alonecan meet around 70% of the world’s total energy requirements of ∼ 2300 EJ/year after year 2100. The availability time for direct solarenergy is as long as the life of the sun itself, i.e., 8–10 billion years.Thesecond biggest sourceis wind energyand hasa technicalpoten-tial of around 640 EJ/year [19] . The availability time for this sourceis around 5–7 billion years. The technical potential of biomassis around 276EJ/year and its availability time is around 5 billionyears. Technical potential of hydro power is around 50EJ/year withavailability time of around 5 billion years. Similarly, the technicalpotential of the ocean energy is around 74EJ/years [19] (assuminga conservative 1% of theoretical potential of 7400EJ/year) and itsavailability time is also around 5 billion years.
3.3.2. Sun-independent energy sources eraThe sun-independent energy sources include geothermal and
nuclear (both ssion and fusion). Among these sources, uraniumwill deplete rst based on current reserve estimates [17,19,20] .Uranium reserves will exhaust approximately in the same time-period in which fossil fuels, especially oil and gas, will be depleted.
Uranium based fuels, as discussed previously, might be wipedout even earlier in the wake of some serious accidents, e.g., at reac-tor 4 of Chernobyl nuclear power plant [21] and reactors 1–4 of Fukushima-Daiichi nuclear power plant in Japan [22] . However,unit 4 at Fukushima did not involve any reactor core or spent fuelstorage accident but only the reactor building was damaged [22] .Therefore, a major disadvantage of the nuclear accident is that theother reactor units, though completely intact, like units 5 and 6at Fukushima, become inoperable, in addition to making a vastsurrounding area uninhabitable around the plant [23] .
These accidents, therefore, could consequently speed-up earlyexit of nuclear (ssion) power plants if the public unacceptabilityincreases especially after Japan which is a developed country anduses relatively modern and safer nuclear power plant technologycompared to that used at Chernobyl [21] .
Even if uranium based fuels are continued to be used, they arenot in sufcient quantities to last more than 100 years [17,19,20] .Therefore, the most important sun-independent energy source isfusion. Table 3 summarizes the theoretical and technical poten-tial,and availability timeof two importantsun-independentenergysources, i.e., geothermal and fusion. Again, the economic potentialis not considered as a limiting factor at this stage assuming thatafter the technological advancement from year 2100,the economicpotentialmay no longerbe a constraint in extraction of energyfromgeothermal and fusion sources.
USA is estimated to have a geothermal energy of 14 × 10 6 EJ
from a depth of 3–10km [24] . Upper limit is 40% recovery but if amidrange of 20% recovery is considered, the total energy amountsto 2.8 × 10 6 EJ. The results for the world are extrapolated fromthe USA estimates. A rough estimate for the world (as USA has∼ 5–10% of the world’s geothermal energy) would give a value of ∼ 2.8 × 10 7 EJ recoverable geothermal energy and a total potentialof 1.4 × 10 8 EJ for a depth of 3–10km.
The availability time for geothermal energy is approximately12,000 years assuming 100% share of the total energy requirement(2300 EJ/year) is met from geothermal energy. In case of fusion,however, the availability period is extended from million up tobillion years depending upon the assumptions involved. The totaltheoretical potential for fusion energy is 1.564 × 10 13 EJ. If totalenergy demand of 2300EJ/year is met from fusion, the availability
time for fusion energy is approximately 68 million years, assuming

8/11/2019 Shafiq Paper Solar Energy
http://slidepdf.com/reader/full/shafiq-paper-solar-energy 5/6
M.S. Siraj / Renewable and Sustainable Energy Reviews 16 (2012) 1971–1976 1975
Table 2SDES – theoretical and technical potential, and availability [19] .
Energy resource Theoretical potential (EJ/year) Technical potential (EJ/year) Availability (billion years)
Hydro 146 50 5Solar 3.9 × 10 6 1575 8–10Wind 6000 640 5–7Biomass 2900 276 5Ocean 7400 74 (conservative 1% of theoretical potential) 5
Total 3.92 × 10 6 2615 5–10
Table 3SIES – theoretical and technical potential, and availability [24,25] .
Energy resource Theoretical potential (EJ) Technical potential ( EJ) Availability (years)
Geothermal 1.4 × 10 8 (f rom a depthofupto 3–10km) 2.8 × 10 7∼ 12,000 years (with 100% share of totalrequirement of 2300EJ/year)
Fusion 1.564
× 10 13 1.564 × 10 11 (conservative 1%of theoretical potential)
∼ 68 million years (with 100% shareof totalrequirement of 2300EJ/year)
1.564 × 10 12 (10% of theoreticalpotential)
∼ 680 million years(with 100% shareof totalrequirement of 2300EJ/year)
7.82 × 10 12 (50% of theoreticalpotential)
∼ 3.4 billion years (with 100% share of totalrequirement of 2300EJ/year)
a technical potential of 1.0% of the theoretical potential. The avail-ability timeis increasedto ∼ 680millionyearsand ∼ 3.4billion yearsif we consider a technicalpotential of 10% and50%of thetheoreticalpotential, respectively. Based on these assumptions, it is recom-mended that an ultimate energy-use policy should be evolved andadopted on global level rather on local or country level, especiallyafter the year 2100.
Fig. 6 shows a possible and recommended energy use scenarioafter year 2100. In this scenario the stress is laid on the sun-dependent energy sources as they are constantly available andeventually ‘lost’ if not utilized unlike the sun-independent energysources which offer long-term energy storage solution. Fusionmaterials arethe best example forthat as they arestable nucleiandhence offer the best long-term solution of energy storage. There-
fore, their use is only recommendedup to 1% in this SDES dominantscenario in order to gain the necessary experience in the use of fusion technology.
The SIES’ best possible use starts after the share of sun-dependentsources startsto decline largely because of thesun itself,when it eventually starts running out of its fusion fuels.
The secondmost importantmediumto longtermenergy storagesolution is thegeothermal source, butunlike fusionit only offers aninterim storage solution. Therefore, it can be used during the SDESera, i.e., in periods where we need extra energy and the demand
Fig. 6. Long-term energy supply after year 2100 – recommended share.
for which cannot be met
from the sun-dependent energy sources.As a result, their use is not predicted precisely in this scenario andcan be used intermittently in periods where the need for their usearises.
4. Conclusion
As discussed earlier, there arefew misconceptions about energyresources that the sun-dependent energy sources (SDES) and thesun-independent energy resources are inexhaustible. Broadly, theperiod for future energy resources and their utilization can bedivided into: fossil, transition, and post-fossil eras. Fossil and tran-sition eras are very short in time-scale compared to post-fossil erawhich is extending up to billion of years. Post fossil era can be fur-
ther divided into sun-dependent energy sources (dominant) era,a second transition period (from SDES to SIES), and lastly sun-independent energy sources (dominant) era. The sun-dependentenergy sources era will last for 5–10 billion years while sun-independent energy sources era will last for up to few billionyears depending upon the policy. For example, if we consume allof the fusion materials in the same period where we have abun-dant supply of sun-dependent sources then we may not have asun-independent energy sources era. Therefore, the future is in ourhands now and we can decide how long and how efciently wewill use different energy sources. The same has been discussed andhighlighted in this paper.
It is therefore recommended that in this current transitionperiod, more focus is given to the development of new technolo-gies for efcient use of SDES before fossils and uranium fuels arephased-out. The research on the most important SIES, i.e., fusionshould be limited only to make it feasible for commercial availabil-ity and to gain necessary technical experience. But its share shouldnotbe increasedby more than 1%of thetotal energyrequirementof the world as they offer the best long-term energy storage solutionand should not be used when SDES are available in abundance.
References
[1] Siraj MS.Proceedingsof AIChE annual meeting. 2009, 350d.[2] Capehart BL. Encyclopedia of energy engineering and technology. CRC Press;
2007.[3] Serway RA, Moses CJ, Moyer CA. Modern physics. 3rd ed. Thomson Learning
Inc.; 2005.[4] Zumerchik J. Macmillian encyclopedia of energy, vol. 1. USA: Macmillian Ref-
erence; 2001.

8/11/2019 Shafiq Paper Solar Energy
http://slidepdf.com/reader/full/shafiq-paper-solar-energy 6/6
1976 M.S. Siraj / Renewable and Sustainable Energy Reviews 16 (2012) 1971–1976
[5] Meyers RA. Encyclopedia of physical science and technology—energy. 3rd ed.Elsevier Science Ltd.; 2001.
[6] Okun LB. Energyand mass in relativity theory. World Scientic Publishing Co.Pte. Ltd.; 2009.
[7] Perkins DH.Introduction to high energyphysics. 3rded. Cambridge UniversityPress; 2000.
[8] Halliday D, Resnick R, Walker J. Fundamentals of physics. 8th ed.John Wiley &Sons, Inc.; 2007.
[9] World population to 2300. United Nations, New York: Population Division;2004. ST/ESA/SER.A/236.
[10] TheWorld at Six Billion, ESA/P/WP.154, UN Population Division,October1999.
[11] US Census Bureau, International Data Base (IDB) < http://www.census.gov/ipc/www/idb/country.php >; 2011. Online (03.01.2011).
[12] BP statistical review of world energy, June 2010. British Petroleum; 2010.[13] BP statistical review of world energy, June 2009. British Petroleum; 2009.[14] BP statistical review of world energy, June 2008. British Petroleum; 2008.[15] BP statistical review of world energy, June 2007. British Petroleum; 2007.[16] Quantifying energy, BP statistical review of world energy, June 2006. British
Petroleum; 2006.
[17] Survey of Energy Resources, World Energy Council, 2010.[18] Annual Energy Review 2009, DOE/EIA-0384(2009) < http://www.eia.gov/
totalenergy/data/annual/pdf/aer.pdf >; August 2010. Online (28.04.2011).[19] World Energy Assessment , Energy and the Chal lenge of Sustainabi l-
ity, United Nations Development Programme < http://www.undp.org/energy/activities/wea/drafts-frame.html >; 2000. Online (28.04.2011).
[20] < http://www.iaea.org/newscenter/news/2006/uranium resources.htm l>;2011. Online (28.04.2011).
[21] INSAG-7,The Chernobyl accident:updating of INSAG-1, IAEA Safety Series No.75-INSAG-7, International Atomic Energy Agency, Vienna, 1992.
[22] <http://www.slideshare.net/iaea/table-summary-of-reactor-unit-status-at-
27april0700-ut c>; 2011. Online (28.04.2011).[23] < http://www.iaea.org/newscenter/news/tsunamiupdate01.html >; 2011.
Online (28.04.2011).[24] MIT Report, The Future of Geothermal Energy, < http://geothermal.inel.gov/
publications/future of geothermal energy.pdf >; 2006. Online (28.04.2011).[25] Hamacher T, Bradshaw AM. Fusion as a future power source: recent achieve-
ments and prospects. In:18th world energycongress. 2001.