Embed Size (px)
Citation preview

Setting Weights for Aggregate Indices: An Application to the Commitment to Development Index and Human Development Index
Shyamal Chowdhury and Lyn Squire1 Global Development Network
Abstract: Aggregate indices like UNDP’s Human Development Index or the Center for Global Development and Foreign Policy’s Commitment to Development Index (CDI) are subject to multiple criticisms including questions regarding the system of equal weights used to construct them. This paper addresses two concerns linked to the weights used in the HDI and the CDI and develops alternative weighting schemes. It first relies on an opinion survey conducted electronically among researchers from 60 countries to construct a new, non-equal set of weights. It then addresses an issue of scaling of relevance only to the CDI. Results of the opinion survey suggest that a simple scheme based on equal weights is not only convenient but also consistent with the views of experts. However, for the CDI, a weighting system that takes scale into account makes an important difference and merits further consideration. JEL C43, C80, O20
Contents
1. Introduction
2. Indices, Existing and Proposed Weighting Systems
2.1 Existing Weighting System
2.2 New Weighting System I
2.3 New Weighting System II
3. Data Collection and Survey Methods
4. CDI and HDI under New Weighting System I
5. CDI under New Weighting System II
6. Which Policy Areas and by Whom?
7. Conclusions and Implications for Future Research
References
1 Correspondence: 2600 Virginia Ave, NW; Suite 1112, Washington, DC 20037; Email: [email protected]

Setting Weights for Aggregate Indices: An Application to the CDI and HDI 1
1. Introduction Aggregate indices like UNDP's Human Development Index (HDI) or the Center for Global Development (CGD) and Foreign Policy (FP)'s Commitment to Development Index (CDI) are becoming commonplace. This reflects the usefulness of simple numerical measures of performance for advocacy, for analysis, and for straightforward, non-technical comparisons. At the same time, these indices are open to many criticisms ranging from concerns with the underlying data to questions regarding the weights used to construct the aggregate indices from their constituent components. This paper addresses two concerns linked to the weights used to construct these two indices and develops alternative weighting schemes. Both the HDI and the CDI apply a very simple weighting scheme: equal weights for each component. This is obviously convenient but also universally considered to be wrong. The ideal approach would presumably involve using as weights the impact of each component on the ultimate objective. For the HDI, this means that each of the components should receive weights according to its contribution to human development, and for the CDI, it means that each of the components should receive weights according to its contribution to the development of developing countries. This is theoretically correct but obviously infeasible given the present state of knowledge. The first question addressed in this paper, therefore, is whether there is an intermediate solution. In this context, intermediate means a solution that lies somewhere between equal weights and the ideal; and somewhere between convenient and infeasible. The approach followed here is to rely on the opinions of informed persons. To the extent that informed persons have a good knowledge of the relationship between each component and the ultimate objective then this approach approximates the ideal. Of course, no individual, no matter how knowledgeable, can know equally well the links for all components. Hence there is a need to average across "experts". Specifically, we have undertaken an electronic survey of development researchers throughout the world to determine how they weight the different components of the two indices. The average weights emerging from this process have then been used to reconstruct the indices and to see how the new versions change country rankings. We have also explored various subgroups such as researchers from OECD countries versus researchers from non-OECD countries. The second question addresses an issue of concern only to the CDI. As its name implies, the CDI attempts to measure commitment. But commitment is only an intermediate measure, with the ultimate goal being to measure the impact of policy effort by the OECD countries on development. Thus, the weighting system underlying the CDI measures effort with no reference to scale and therefore no reference to likely impact on developing countries. The alternative weighting system examined in this paper allows for scale and therefore is a better measure of likely impact and of the importance of changing a particular policy. (This concern does not apply to the HDI because it already measures the ultimate objective – human development.)

Setting Weights for Aggregate Indices: An Application to the CDI and HDI 2
The rest of the paper is organized in the following manner: in section 2, we describe the two indices in brief. We then formalize the weighting system used to construct these two indices and present the proposed alternatives. In sections 3 and 4, we address the first question of the paper: Is there an alternative based on informed opinion to the system of equal weights used in both the HDI and the CDI? In section 3, we describe the population from which we have drawn our sample, the sampling methods and data collection procedures, and the basic characteristics of our respondents. In section 4, we estimate the weights based on the survey responses and apply the new weighting system to both the CDI and HDI. In section 5, we turn to the second question: Is there a method of measuring impact more closely by accounting for scale rather than simply measuring effort as in the CDI? Based on the system described in the preceding section, we identify in section 6 policy/country combinations where an improvement in effort would have the greatest impact. We conclude the paper in section 7 with implications for future research.
2. Indices, Existing and Proposed Weighting Systems According to the UNDP, the Human Development Index (HDI) is a summary measure of human development based on three dimensions: life expectancy at birth; knowledge; and standard of living. Life expectancy at birth measures the relative achievement of each country in prolonging life. The knowledge component is a combination of two indices: adult literacy rate and combined (primary, secondary and tertiary) enrolment rate. It measures a country’s relative achievement. The index for literacy and the index for enrolment are combined with adult literacy receiving a two-thirds weight and enrollment a one-third weight. The standard of living is calculated using the logarithm of adjusted GDP per capita (PPP US$). Performance in each dimension is expressed as a value between 0 and 1 by applying the following formula:
actual value – minimum value Dimension Index = maximum value – minimum value
The HDI is then calculated as a simple average of the dimension indices. The maximum and minimum values for each of the dimensions have been established by the UNDP as follows: 85 years and 25 years for life expectancy at birth, 100% and 0% for the adult literacy rate and the combined gross enrollment ratio, and US$40,000 and US$100 for per capita income (UNDP, 2002, pp. 252-53.) The Commitment to Development Index (CDI) constructed by the CGD and FP measures the extent to which the policy stance of the world’s richest countries reflects their stated goals of advancing the development of the world’s poorest countries. According to the CGD/FP (Foreign Policy 2003), CDI ranks 21 OECD countries (Luxemburg being the exception) in six policy areas: aid, trade, environment, investment, migration, and peacekeeping. The CGD/FP has estimated one index for each of the policy areas which it has later combined into an equally weighted single index called CDI.

Setting Weights for Aggregate Indices: An Application to the CDI and HDI 3
Very briefly, aid is the quality adjusted overseas development assistance (ODA); environment measures how rich countries’ actions and policies contribute to the degradation/improvement of the environment; investment includes long term capital flows to developing countries corrected by a bribe payers’ index that measures the propensity of corporations from rich nations to pay bribes in developing countries; migration is a combination of the number of total legal immigrants accepted per year and aid to refugees; peacekeeping includes measures to ensure security through contributions to UN peacekeeping efforts; and trade measures revealed openness, and tariffs and non-tariff barriers that hinder developing countries’ access to rich countries’ markets.2 After the publication of the HDI for the first time in 1990, many researchers criticized its components and construction methods. As Srinavasan (1994) points out: “whether the HDI is an internationally comparable “measure…” is arguable” [emphasis in original, p. 240]. About the components, he argues that “their relative values need not be the same across individuals, countries, and socioeconomic groups” [emphasis in original]. He goes on to add that “In sum, the HDI is conceptually weak and empirically unsound, involving serious problems of noncomparability over time and space, measurement errors, and biases” (p.241). Perhaps similar criticisms can be put forward in the case of CDI too. 2.1 Existing Weighting System The weighting system underlying the two indices can be expressed as follows:
∑= ijij wpiI )( where is the measure of policy effort or human development of the ith country, is the policy effort or human achievement of the ith country as currently calculated by CGD/FP and UNDP for the jth category (aid, trade, etc for CGD/FP and income, life expectancy, etc for the UNDP), and is the weight attached to the jth category in the ith country. Currently, the weight is the same for all categories in all countries. That is:
)(iI ijp
ijw
wwij = for all i and j.
2.2 New Weighting System I An alternative allows for the weights to vary by the importance of the category:
jij ww = for all i. According to this new weighting system, if a country is performing very badly with respect to an unimportant category, it’s overall policy effort or human development achievement will not be affected as much as if it is performing very badly with respect to
2 See Birdsall and Roodman (2003) for a detailed account of the construction of CDI and references there.

Setting Weights for Aggregate Indices: An Application to the CDI and HDI 4
an important category. This alternative weighting system will be applied to both the HDI and the CDI. 2.3 New Weighting System II Weighting system I allows the weight to vary by category. For the CDI, it may also be important to let the weight vary by country as well in order to capture the country’s importance (scale) in the OECD total for that category. We can express this idea as follows:
jijij wsw = where is the share of the ith country in the OECD total for the jth category. Thus, if country i only contributes a very small share to, say, total OECD trade with developing countries, then even if its policy effort for trade is very weak, its impact on developing countries is not likely to be great.
ijs
In sum, weighting system I measures effort with no reference to scale and therefore no reference to likely impact on developing countries. Weighting system II allows for scale and therefore is a better measure of likely impact. As a result, it can be used to measure the importance of changing a particular policy, thereby allowing us to identify key policies in need of change. This may be immediately valuable for advocacy purposes. It may also be important for designing future research. For instance, we may want to identify a few policies for much more detailed research is required in order to have a better understanding of impact. With limited resources, choices will have to be made among a large number of possibilities. Weighting system II offers a way of doing this by ranking country/category combinations. That is, we calculate for all i and all j and rank by importance.
jijij wsp
One important caveat needs to be kept in mind. At best, we are saying something about the average impact of a particular policy of a particular country on average development outcomes. However, for the development impact evaluation of a particular policy what we need to measure is its marginal impact on development outcomes. For instance, we want to know how a one unit change in tariff barriers from their present level is going to developing countries. However, none of the weighting systems, be it equal, weighted or scaled, currently presents a marginal analysis. 3. Data Collection and Survey Methods To collect expert opinions and to apply the two weighting systems, we have relied on an electronic survey conducted between May and June 2003. Social scientists have a relatively long history of using mail surveys as a method of collecting data.3 The cost of mail surveys is usually low compared to other methods and the use of e-mail can bring
3 For a detailed account of mail surveys, see Scott 1961.

Setting Weights for Aggregate Indices: An Application to the CDI and HDI 5
the cost down further. Therefore, if the same information can be obtained by e-mail, there is a clear cost-advantage to the electronic survey over other traditional methods. We followed a stratified random sampling procedure in selecting the respondents. We emailed a structured questionnaire to the selected respondents and made an online version of the questionnaire available to them. The questionnaire provided a brief explanation of HDI and CDI. Researchers were then asked to weight each of the items of each index on a scale from zero to 10. In addition, the questionnaire contained questions on researchers’ education, research and demographic backgrounds. Respondents were asked to fill in the questionnaire and return it by email. Alternatively, they could fill in the online version and submit it directly. Our population consisted of 1,547 researchers coming from 125 countries covering all seven geographic regions (the World Bank classification) and all five income groups (again the World Bank classification). Table 1 shows the distribution of the population according to income and geographic groups. There are two columns under each income group: the first column shows the number of countries (labeled as C) that belong to this category and the second column (in italics) shows the number of researchers (labeled as N) that belong to those countries. For instance, the first cell (the first row and the first column) shows that there are 4 low-income countries in our population that come from the East Asia and Pacific region. The number next to it in italics shows that there are 31 researchers in our population belonging to these four countries. The bottom two rows show the total number of countries that belong to each income group and the total number of researchers that belong to those countries. Similarly the last four columns show the geographic distribution of countries and the researchers. Table 1: Distribution of Population
Total Low Income
Lower Middle Income
Upper Middle Income
High Income OECD
High Income Non OECD Country Researcher
Region:
C N C N C N C N C N C % N % EAP 4 31 5 66 2 28 3 26 4 24 18 14% 175 11% ECA 7 50 12 162 7 77 16 307 1 5 43 34% 601 39% LAC 0 0 10 75 7 42 0 0 1 1 18 14% 118 8% MENA 1 1 9 74 3 16 0 0 3 24 16 13% 115 7% NA 0 0 0 0 0 0 2 197 0 0 2 2% 197 13% SA 4 178 1 13 0 0 0 0 0 0 5 4% 191 12% SSA 19 126 1 1 3 23 0 0 0 0 23 18% 150 10% Total 35 386 38 391 22 186 21 530 9 54 125 100% 1547 100% As a % 28% 25% 30% 25% 18% 12% 17% 34% 7% 3% 100% 100% EAP: East Asia and Pacific; ECA: Europe and Central Asia; LAC: Latin America and the Caribbean; MENA: Middle East and North Africa; NA: North America; SA: South Asia; SSA: Sub Saharan Africa. C: Number of Countries; N: Number of Researchers. We had chosen 200 as a preliminary sample size which was assumed to serve our purpose of a preliminary investigation. Once the sample size was determined, we distributed the sample among the income groups such that each group received a number of respondents based on its contribution to the population. Table A1 in the appendix shows the distribution of the sample according to income groups. Though one might argue that for the CDI, one partial sample that included respondents only from rich countries (e.g., high-income OECD) and another that included respondents only from poor countries (e.g., low-income countries) would be more appropriate, since we wanted to come up with a weighting scheme for two different indices, we selected the sample

Setting Weights for Aggregate Indices: An Application to the CDI and HDI 6
from the whole population and kept its distribution similar to the distribution of the population. Once we knew the distribution of the sample based on income level, the next step was to distribute the respondents among the regional groups. For this, each region received a sample based on its weight in each income group. Table A2 in the appendix shows the resulting sample distribution based on region. To determine how many respondents should come from which country within a region for a particular income group, we used each country’s relative weight in the subpopulation. For example, as can be seen in Table A2, the total number of respondents that should come from the South Asia region is 25 out of which 23 should come from low-income countries and the remaining two from lower-middle income countries. Accordingly, we have distributed 23 respondents among four low-income countries of South Asia depending on the relative weight of each of the countries in the group. As a result, India received 12 respondents while Bangladesh received 3 respondents. As regards the final step, the selection of respondents from each of the country, we selected respondents through a simple random sampling procedure. For each of the countries, researchers were arranged in ascending order according to their last names and were assigned a number. Then the respondents were selected from each of the country separately using a random number generator. Out of 200 questionnaires, we have received 105 responses from 60 countries. Table A3 in the appendix shows the names of the countries along with the number of responses. Table 2 shows the distribution of respondents based on income and region. A comparison between Table 1 and Table 2 reveals that there is a difference between the composition of the population and the respondents. We have received more responses from researchers from the low-income and lower-middle income countries, proportionately about the right number of responses from the upper-middle and high-income Non-OECD countries, and fewer responses from the high-income OECD countries. From the response pattern, it is evident that access to email and Internet did not determine response. Table 2: Distribution of Respondents based on Income and Region
Region Low Income
Lower Middle Income
Upper Middle Income
High Income OECD
High Income Non-OECD
Total As a %
EAP 3 10 1 2 2 18 17% ECA 4 13 8 15 1 41 39% LAC 0 7 1 0 0 8 8% MENA 0 8 2 0 1 11 10% NA 0 0 0 3 0 3 3% SA 15 0 0 0 0 15 14% SSA 9 0 0 0 0 9 9% Total 31 38 12 20 4 105 100% As a % 30% 36% 11% 19% 4% 100%
EAP: East Asia and Pacific; ECA: Europe and Central Asia; LAC: Latin America and the Caribbean; MENA: Middle East and North Africa; NA: North America; SA: South Asia; SSA: Sub Saharan Africa. Countries are classified according to the World Bank’s classification. See WDI 2002 for details. In terms of respondents’ characteristics, the average age is 41 years with a standard deviation of 11.43 and the average experience in the area of development research is 13

Setting Weights for Aggregate Indices: An Application to the CDI and HDI 7
years with a standard deviation of 10.11. Among the respondents 29 percent of them are female and 71 percent male; 74.28 percent of the respondents have a PhD; 47.42 percent work for universities and 40.21 percent work for research institutes/organizations; 72.38 percent are from economics; and 60.58 of them publish their research in English. Two sources of possible bias in our survey are: non-response bias and sampling bias. There could be two types of non-response bias: first, unit non-response and second, item non-response. When a selected respondent does not respond to any of the survey questions, thereby exhibiting unit non-response, and when he/she does not respond to some of the items of the survey, thereby exhibiting item non-response, then estimated indices suffer from non-response bias. There are two ways to tackle item non-response bias: the first is to reduce the levels of non-response; the second is to make adjustments at the analysis stage (Lynn and Jowell 96, pp. 25). In our survey, there was no item non-response. Respondents, participating in the survey answered all the questions asked in the survey. However, we did have unit non-response. To overcome this, we have used a weighted sample. In the case of sampling bias, one potential source of bias is due to the limitation of the population from which the sample is drawn. Since the population is not all inclusive, and we have drawn from a list where researchers registered themselves (though not for the current survey purpose), there could be a possible problem of self-selection bias. 4. CDI and HDI under New Weighting System I Table 3 shows the weights for the six different components of the CDI that we have derived based on the responses of our survey. The first two rows show the survey results based on responses from the OECD country citizens and non-OECD country citizens, respectively. The last row includes all respondents. Since the composition of actual responses in respect of OECD and non-OECD varies from the sample, we have weighted the responses based on OECD and non-OECD’s share in the population. Table 3: Weights for the CDI Components Based on the Survey Source: Weights on: Aid Trade Investment Migration Peacekeeping Environment OECD only 0.142 0.224 0.188 0.134 0.163 0.149 (0.063) (0.045) (0.059) (0.062) (0.062) (0.056) Non OECD 0.142 0.200 0.194 0.138 0.156 0.171 (0.057) (0.049) (0.050) (0.054) (0.057) (0.047) All Respondents 0.142 0.208 0.192 0.136 0.158 0.163 Source: Based on GDN’s primary survey 2003. Numbers in the parentheses are the standard errors. The first observation to be made is that the weights that we have derived from the survey are not very different from equal weights. This remains valid for all the respondents and also for the two groups. Second, within the limited variation, trade receives the highest importance followed by investment while migration receives the lowest importance preceded by aid. Third, the relatively low standard deviations of the weights confirm that the results are not driven by outliers. Fourth, given the fact that none of the components has received a weight significantly lower than the equal weight (for the sake of

Setting Weights for Aggregate Indices: An Application to the CDI and HDI 8
comparison, in the case of equal weights, each component receives a weight of 0.167), all the components that are included here are considered to be important based on the survey findings. Though there may be areas that are not included in the CDI, the six components included here are valid components. To see the impact of academic and demographic characteristics of our surveyed respondents on weights of different components of CDI, we have regressed the weight of each component that each respondent has assigned on his/her gender, years of schooling, discipline and experience in development research.4 Some interesting observations to note are: higher schooling slightly reduces the relative weight on trade (1.14%) and investment (1.26%) and increases the weight on migration (1.53%). In contrast to male respondents, the female respondents put more weight (2.2%) on environment than their male counterpart. In fact the effect of gender on environment is quite robust; it remains significant even when we control for income and regional characteristics. In comparison to respondents from other regions, respondents from South Asia put more weight (4.04%) on aid. Table 4 shows the scores and ranking of countries based on equal weights and based on the weights that we have derived from our survey. To facilitate comparison, we put the CGD/FP’s score and rank of the countries based on equal weight. As can be seen from the table, weighting system I has not made any dramatic changes in scores and rankings of the countries: in all cases, the Netherlands ranks top and Japan on the bottom of the league. The correlation coefficient between rank derived from equal weight and rank derived from weighting system I (all respondents) is 0.992. Given the low variations of the weights for the different components of the index, this is not a surprising outcome. The score and the ranking remain similar even when we restrict the analysis to OECD and non-OECD sub samples. Table 4: CDI under Equal Weight and Weighting System I Country Equal Weight Weighting System I All Res. OECD Non OECD Score Rank Score Rank Score Rank Score Rank Netherlands 5.615 1 5.706 1 5.717 1 5.700 1 Denmark 5.548 2 5.423 3 5.479 3 5.393 3 Portugal 5.178 3 5.534 2 5.564 2 5.518 2 New Zealand 5.086 4 5.059 4 5.126 4 5.024 5 Switzerland 4.977 5 4.921 6 4.832 6 4.967 6 Germany 4.702 6 4.669 7 4.683 7 4.662 7 Spain 4.698 7 5.032 5 5.029 5 5.034 4 Sweden 4.508 8 4.518 8 4.528 8 4.512 8 Austria 4.437 9 4.477 9 4.492 9 4.469 9 Norway 4.325 10 4.081 11 4.070 12 4.087 11 United Kingdom 4.171 11 4.326 10 4.359 10 4.309 10 Belgium 4.023 12 4.072 12 4.112 11 4.050 12 Greece 3.877 13 3.981 13 4.061 13 3.939 13 France 3.764 14 3.929 14 3.982 14 3.901 14 Italy 3.584 15 3.783 15 3.832 15 3.757 15
4 We have estimated OLS regression for each of the components of HDI and CDI. The full results have not
been reported but available upon request.
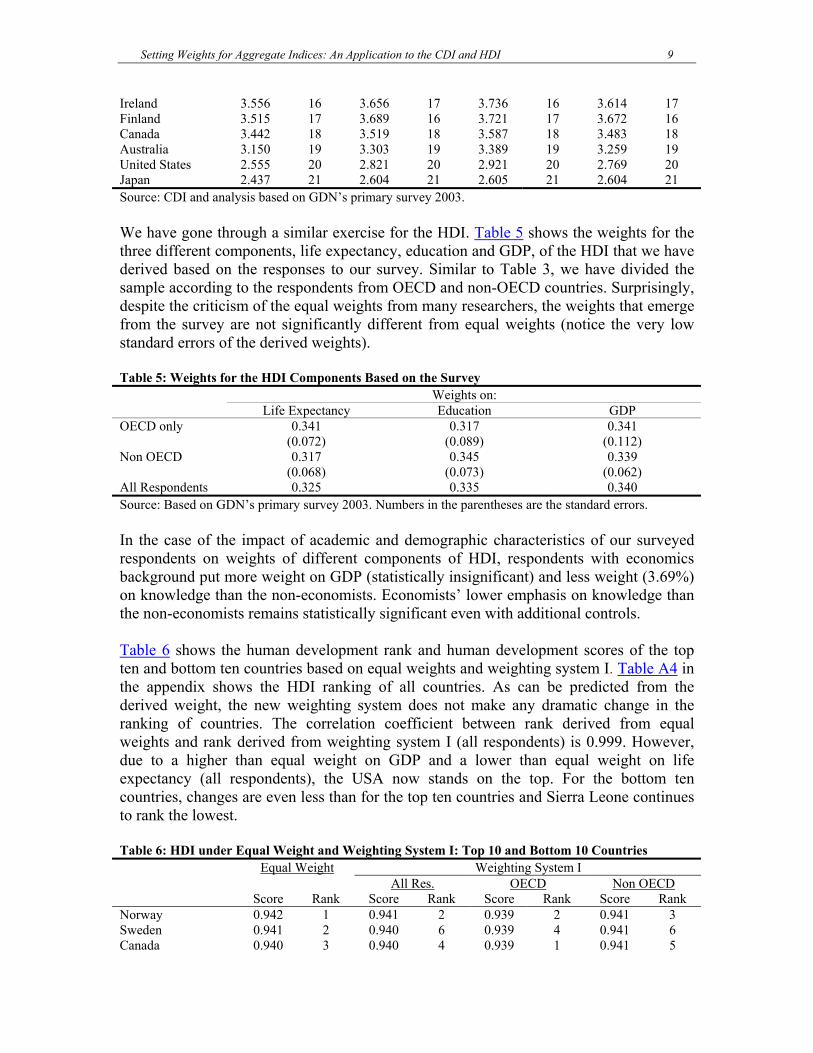
Setting Weights for Aggregate Indices: An Application to the CDI and HDI 9
Ireland 3.556 16 3.656 17 3.736 16 3.614 17 Finland 3.515 17 3.689 16 3.721 17 3.672 16 Canada 3.442 18 3.519 18 3.587 18 3.483 18 Australia 3.150 19 3.303 19 3.389 19 3.259 19 United States 2.555 20 2.821 20 2.921 20 2.769 20 Japan 2.437 21 2.604 21 2.605 21 2.604 21 Source: CDI and analysis based on GDN’s primary survey 2003. We have gone through a similar exercise for the HDI. Table 5 shows the weights for the three different components, life expectancy, education and GDP, of the HDI that we have derived based on the responses to our survey. Similar to Table 3, we have divided the sample according to the respondents from OECD and non-OECD countries. Surprisingly, despite the criticism of the equal weights from many researchers, the weights that emerge from the survey are not significantly different from equal weights (notice the very low standard errors of the derived weights). Table 5: Weights for the HDI Components Based on the Survey
Weights on: Life Expectancy Education GDP
OECD only 0.341 0.317 0.341 (0.072) (0.089) (0.112) Non OECD 0.317 0.345 0.339
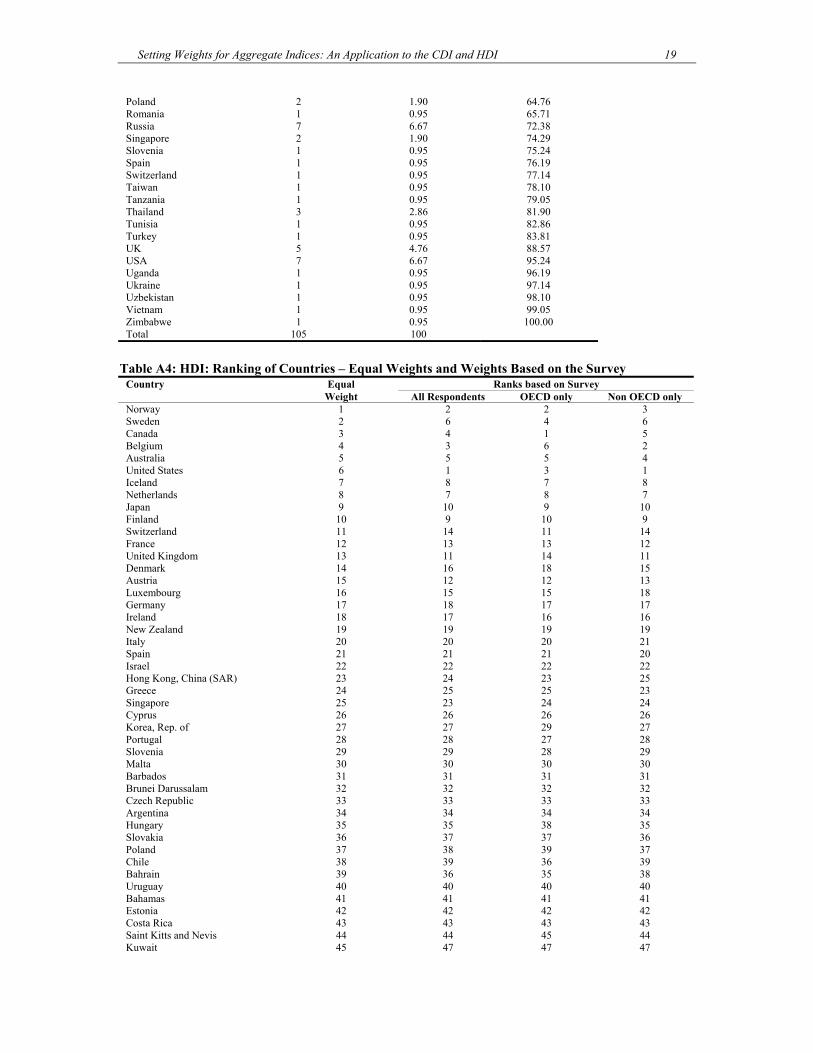
(0.068) (0.073) (0.062) All Respondents 0.325 0.335 0.340 Source: Based on GDN’s primary survey 2003. Numbers in the parentheses are the standard errors. In the case of the impact of academic and demographic characteristics of our surveyed respondents on weights of different components of HDI, respondents with economics background put more weight on GDP (statistically insignificant) and less weight (3.69%) on knowledge than the non-economists. Economists’ lower emphasis on knowledge than the non-economists remains statistically significant even with additional controls. Table 6 shows the human development rank and human development scores of the top ten and bottom ten countries based on equal weights and weighting system I. Table A4 in the appendix shows the HDI ranking of all countries. As can be predicted from the derived weight, the new weighting system does not make any dramatic change in the ranking of countries. The correlation coefficient between rank derived from equal weights and rank derived from weighting system I (all respondents) is 0.999. However, due to a higher than equal weight on GDP and a lower than equal weight on life expectancy (all respondents), the USA now stands on the top. For the bottom ten countries, changes are even less than for the top ten countries and Sierra Leone continues to rank the lowest. Table 6: HDI under Equal Weight and Weighting System I: Top 10 and Bottom 10 Countries Equal Weight Weighting System I All Res. OECD Non OECD Score Rank Score Rank Score Rank Score Rank Norway 0.942 1 0.941 2 0.939 2 0.941 3 Sweden 0.941 2 0.940 6 0.939 4 0.941 6 Canada 0.940 3 0.940 4 0.939 1 0.941 5

Setting Weights for Aggregate Indices: An Application to the CDI and HDI 10
Belgium 0.939 4 0.941 3 0.939 6 0.941 2 Australia 0.939 5 0.940 5 0.939 5 0.941 4 United States 0.939 6 0.941 1 0.939 3 0.942 1 Iceland 0.936 7 0.937 8 0.936 7 0.938 8 Netherlands 0.935 8 0.937 7 0.935 8 0.938 7 Japan 0.933 9 0.930 10 0.930 9 0.930 10 Finland 0.930 10 0.930 9 0.929 10 0.931 9 Mali 0.386 164 0.386 164 0.387 164 0.385 164 Central African Rep. 0.375 165 0.374 165 0.373 165 0.375 165 Chad 0.365 166 0.367 166 0.366 166 0.367 166 Guinea-Bissau 0.349 167 0.350 167 0.349 167 0.351 167 Ethiopia 0.327 168 0.327 168 0.326 168 0.327 168 Burkina Faso 0.325 169 0.323 170 0.326 169 0.322 170 Mozambique 0.322 170 0.324 169 0.322 170 0.325 169 Burundi 0.313 171 0.314 171 0.312 171 0.315 171 Niger 0.277 172 0.280 172 0.283 172 0.278 173 Sierra Leone 0.275 173 0.277 173 0.275 173 0.278 172 The weights that we have derived from the survey and applied to recalculate the HDI and CDI carry some important implications. First, the different components that have been combined to construct CDI and HDI are valid components since none of them have received a low or zero weight. All the components currently used in the HDI and the CDI should be retained. Second, an unweighted (equal weights) index is not necessarily misleading. It is at least consistent with expert opinion. And third, the fact that the standard deviations are small in all cases suggests that a broadly similar view regarding the relative importance of each component is widely held. That said, the weight on a particular component can be influenced by the respondent’s academic, demographic and geographic characteristics among others suggesting that care should be taken in drawing conclusions on weights from small, non-representative samples. 5. CDI under New Weighting System II Weighting System II is specific to the CDI. Since it takes scale – the share of the ith country in the OECD total for the jth category – into account, we have calculated the OECD total for each of the six categories included in CDI. For three categories – aid, migration and peacekeeping – we have taken all the subcomponents that CGD/FP has considered in constructing these categories and we have allocated the same weights as CGD/FP to each of the subcomponents of these three categories. For the remaining three categories – investment, trade and environment – we could not include all the subcomponents that constituted CDI. Exclusion is primarily due to technical reasons and is not biased towards any particular area. The implications of excluding some of the components of investment, trade and environment are discussed later. Once we had calculated the OECD total for each of the six categories, we derived each country’s relative contribution to the OECD total in each of the categories. For aid, CGD/FP have used official development assistance to developing countries adjusted for debt payments, type of recipients (richer versus poorer developing

Setting Weights for Aggregate Indices: An Application to the CDI and HDI 11
countries), conditionalities of donor countries, and policies of recipient countries.5 The adjusted measure of aid is named “quality adjusted aid” in CDI. We have aggregated this adjusted measure and derived the relative share of each country in the total of quality adjusted aid. Among the two components that CGD/FP have used to calculate the scores in investment – FDI flows to developing countries corrected with the Transparency International’s Bribe Payer Index (67% weight) and rich countries restrictions on pension funds for investment in developing countries (33% weight) – we have taken the first one only. Since it was not possible to aggregate a policy area, we excluded it. Note that this exclusion makes some changes to countries’ scores in the investment component. Though the two scores, with and without the inclusion of policy on pension funds, result in some changes in country rankings, they remain correlated (correlation coefficient is 0.634). For migration, CGD/FP have used two subcomponents, legal migrant inflows and refuge burden sharing, and weighted them at 90% and 10%, respectively. We have considered both subcomponents in our scaling and assigned weights similar to those used by CGD/FP. For peacekeeping, we have considered both subcomponents of the CDI -- monetary contributions to UN peacekeeping and personnel contributions valued in monetary terms -- aggregated them, and derived the relative contribution of each country in peacekeeping. There are four components that constitute the measure of environment in CDI: 1) depletion of shared commons through greenhouse gas emissions (67% weight), ozone depleting substance consumption (16.5% weight), and fishing subsidies (16.5% weight); 2) financial contribution to the Global Environment Facility (50% weight), and the Montreal Protocol (50% weight); 3) treaty ratifications; and 4) advancement of the environment friendly technology through wind capacity addition (50% weight) and government funding for R&D on conservation and renewable energies (50% weight). In the CDI, the weights for the above four components, depletion of shared commons, financial contribution, treaty ratifications, and advancement of the environment friendly technology, are 67%, 8.25%, 8.25%, and 16.5%, respectively. In our relative measure, we have included 1), 2), and 4) with weights of 67%, 16.5%, and 16.5%, respectively. We have excluded the treaty ratifications since it was not possible to make any relative ranking. Note that this exclusion does not make any notable difference to scores: the correlation coefficient between the two scores -- with treaty and without treaty -- is 0.992. CGD/FP’s trade measure consists of two major components: first, an aggregate measure of protection comprising tariffs and non-tariff barriers and domestic production subsidies; and second, revealed openness consisting of measures of total imports from developing countries. For our scaling purpose, we have taken the “revealed openness” of each country and expressed it as a share. However, dropping trade protection makes a major 5 For details, see FP (2003) and Roodman (2003)

Setting Weights for Aggregate Indices: An Application to the CDI and HDI 12
change in the score. Though the two scores -- with aggregate protection measures and without aggregate protection measures -- are positively correlated (the correlation coefficient is 0.574), scaling related to trade needs to be interpreted with cautions. To isolate the impact of scaling, we have recalculated the CDI incorporating the preceding modifications. Table A5 in the appendix shows the modified CDI. It shows the score of each country in each of the six areas and the rank of the countries based on the average score consisting of all six areas. As discussed above, out of six possible areas, we have excluded some of the components of three areas namely, trade, investment and environment. However, these exclusions have not made substantial changes in ranking. Using equal weights, the correlation coefficient between the original ranks (shown in the last column of Table A5) and the ranks based on the modified scores is 0.899. Table A6 in the appendix shows the share of each country in the corresponding OECD total. Except for migration, the US has the largest share in all of the six categories. Australia has a negative share in investment (-1.4%) due to the net outflow of investment from developing countries to Australia for the period concerned. Japan has the lowest share in peacekeeping (0.069%) perhaps due to historical reasons. It also has a relatively low share in investment (6.1%) and migration (7.7%) given that it is the second largest economy. Taking all six categories into account, the US has the largest share on average (28.7%) followed by Germany (13.1%), and Ireland has the lowest share (0.512%) on an average preceded by Finland (0.63%). Table A6 in the appendix gives us the for weighting system II. Since we have already derived w for all i (
ijs
j Table 3), and we will take from the modified CDI (ijp Table A5), we are now ready to apply weighting system II. However, before doing so, we make a final adjustment in – we modify the score of the ith country in the jth area by subtracting the respective mean of the jth category from the ith country’s score in the jth category.
ijp6
This will reveal more clearly each country’s policy stance in each area compared to the average policy stance of all OECD countries in that area. Note that this adjustment in scores does not change the ranking of countries by the modified CDI (Table A5 in appendix). Table 7 shows the scores and ranks of countries based on a weighting system that takes into account both scale and weight. Due to the importance of scale and due to the low variation among the three sources of weights (all respondents, OECD sub sample, and non OECD sub sample), weighting system II yields a similar rank for all three samples. To facilitate comparison, we have included scores and ranks of the countries based on weighting system I. Since we have modified the CDI as noted above, the scores and ranks presented here under weighting system I are not directly comparable with the scores and ranks presented in Table 4. Table 7: CDI under Weighting System I and II Country Weighting System I Weighting System II
6 A detailed analysis of scales, weights and scores can be obtained from the authors upon request.

Setting Weights for Aggregate Indices: An Application to the CDI and HDI 13
All Res. All Res. OECD Non OECD Score Rank Score Rank Score Rank Score Rank Spain 2.36 2 38.71 1 37.89 1 39.13 1 Switzerland 2.68 1 22.91 2 22.37 2 23.19 2 Germany 0.55 8 14.50 3 14.29 3 14.61 3 Netherlands 2.16 3 11.77 4 11.57 4 11.87 4 Portugal 2.10 4 5.22 5 5.16 5 5.24 5 Denmark 1.53 5 4.45 6 4.51 6 4.42 6 Sweden 0.81 7 2.62 7 2.61 7 2.62 7 Norway -0.06 10 2.20 8 2.24 8 2.18 8 Austria 1.08 6 2.09 9 2.05 10 2.11 9 Italy -0.88 16 1.98 10 2.14 9 1.89 10 Greece -0.45 14 1.90 11 1.98 12 1.86 11 France -0.18 11 1.76 12 2.02 11 1.63 12 New Zealand -0.70 15 0.31 13 0.25 13 0.34 13 Belgium 0.19 9 0.17 14 0.19 14 0.16 14 Finland -0.40 13 -0.15 15 -0.15 16 -0.16 15 Australia -2.52 21 -0.16 16 -0.16 17 -0.16 16 Ireland -1.23 17 -0.17 17 -0.14 15 -0.18 17 United Kingdom -0.31 12 -2.32 18 -2.14 18 -2.40 18 Canada -2.01 18 -4.95 19 -4.92 19 -4.97 19 Japan -2.39 20 -19.24 20 -19.42 20 -19.14 20 United States -2.34 19 -67.14 21 -65.87 21 -67.81 21 Source: CDI and analysis based on GDN’s primary survey 2003. As can be seen from Table 7, weighting system II has made substantial changes in scores of the countries. The correlation coefficient between the scores derived from weighting system I (all respondents) and the scores derived from weighting system II (all respondents) is 0.667. There is also a substantial change in ranking. Now, Spain stands at the top of the league followed by Switzerland and Germany, and the USA stands at the bottom of the league preceded by Japan. In the case of Spain, its policy stance is above average in three areas and below average in the remaining three areas. This is similar to Norway. However, unlike Norway which is well below the average in trade, Spain’s policy stance is not very far from the average and as a result, and due to the scale effect, the country stands on top of the league. The correlation coefficient between the rank derived from weighting system I (all respondents) and the rank derived from weighting system II (all respondents) is 0.874. Though US has the highest share in all of the policy areas with the exception of migration (Table A6 in the appendix), it has a below average policy stance in all six areas. Compared to the USA, Japan has a policy stance below the OECD average in all six areas and below the USA on average. However, due to the adjustment of scales that we take into account, it ranks above the USA. This implies that a below average policy of Japan has a lower development impact than the same policy stance when pursued by the USA. Similarly the Netherlands has an above average policy stance in five areas (Table A5 in the appendix). However, its average share in six categories is 3.5% of the OECD total. Therefore, when we consider both, policy stance and development impact in the weighting system II, the Netherlands ranks 4th on the overall ranking among the OECD countries despite its second best policy stance.

Setting Weights for Aggregate Indices: An Application to the CDI and HDI 14
6. Which Policy Areas and by Whom? Based on the results derived from weighting system II, it is now possible to identify policy-country combinations where more effort will translate into the biggest policy impact. To identify these, we have calculated for all i and all j and reported the results in Table 8. In deriving these scores, we have used weights from all respondents (the bottom row of
jijij wsp
Table 3) since there would not be any significant difference if we restrict the respondents to the various subgroups (OECD respondents versus non-OECD respondents). Table 8: Score in Each Category under Weighting System II (All Respondents) Score in: Country Aid Trade Investment Migration Peacekeeping Environment Total Australia -0.334 -0.459 1.981 -0.095 -0.359 -0.896 -0.161 Austria -0.073 0.244 1.287 0.720 -0.202 0.110 2.087 Belgium 0.079 0.292 -0.266 0.129 -0.118 0.053 0.170 Canada -0.615 -2.060 -1.208 2.114 -0.725 -2.457 -4.951 Denmark 2.989 0.209 -0.245 0.063 1.318 0.118 4.452 Finland -0.033 0.157 -0.190 -0.096 -0.110 0.117 -0.155 France -0.116 1.668 -2.076 -0.830 2.911 0.203 1.761 Germany -1.542 2.413 -3.371 15.104 -0.268 2.166 14.502 Greece -0.105 0.145 0.000 -0.207 2.057 0.007 1.897 Ireland -0.059 0.121 0.000 0.043 -0.027 -0.244 -0.166 Italy -0.977 1.384 -0.754 -0.956 2.709 0.570 1.975 Japan -3.633 -6.385 -4.831 -2.527 -0.038 -1.822 -19.235 Netherlands 3.404 0.051 7.893 0.187 -0.187 0.423 11.771 New Zealand -0.044 -0.842 0.000 0.908 0.359 -0.074 0.306 Norway 1.308 -0.435 -0.085 0.075 1.557 -0.220 2.200 Portugal -0.086 0.135 4.418 -0.159 0.836 0.071 5.215 Spain -0.407 0.720 38.889 -0.817 -0.599 0.923 38.708 Sweden 1.943 0.293 0.226 -0.004 -0.103 0.264 2.619 Switzerland 0.028 -0.591 21.342 1.766 -0.042 0.404 22.907 United Kingdom -0.261 1.823 -2.672 -0.843 -0.537 0.175 -2.315 United States -6.974 -9.217 -16.538 -5.779 -8.578 -20.057 -67.144 Category Total -5.508 -10.335 43.801 8.796 -0.146 -20.165 Source: Analysis based on data from CGD/FP and GDN primary survey 2003. The bottom row of Table 8 shows the average score for each category. Remember that without taking scale into account, the average for each category would be zero. However, when allowance is made for scale, we can arrive at a non-zero measure of impact. On this basis, the three areas that seem obvious candidates for improved policy effort are environment, trade and aid in that order. Remember, however, that our trade score should be read with caution for reasons noted earlier. Similarly, the last column of Table 8 gives the country total. This column allows us to identify countries that need to improve their policy most according to their expected impact on developing countries. In order of impact, these countries are the United States, Japan, New Zealand, Canada, United Kingdom, Ireland, Australia and Finland. The most interesting aspect of Table 8, however, is the individual cells. From these we can determine which policy-country combination has the potential to generate the biggest benefit for developing countries. For example, while there are 15 countries that score below the OECD average in aid (Table A5 in the appendix), the total impact of aid could

Setting Weights for Aggregate Indices: An Application to the CDI and HDI 15
be positive if only the USA improves its policy to the OECD average. This scale effect is even more pronounced in the case of environment. There are 14 countries that have an above average policy effort (Table A5 in the appendix). However, due to the USA’s below average policy, the overall impact is negative. Even if the other six countries with below average performance improve their policy to the OECD average, the overall impact in environment will still remain negative unless the US changes its policy. These examples illustrate the overwhelming role played by scale. To provide one further illustration, consider the eight policy-country combinations where a change in policy would have the greatest impact on developing countries. In order of importance, they are: USA-environment; USA-investment; USA-trade; USA-peacekeeping, USA-aid, Japan-trade, USA-migration and Japan-investment. This evidence suggests that differences in country or economic size are a much more important factor in determining impact than differences in policy effort. 7. Conclusions and Implications for Future Research In this paper we have drawn on the opinions of researchers to re-weight the CDI and HDI in an attempt to move away from the simplistic reliance on equal weights. And we have proposed and applied an additional modification to the CDI to take scale into account so that we move closer to a measure of impact on developing countries. These two efforts lead to three conclusions for future research. Despite the widespread criticism of equal weights, the weights derived from researchers do not vary substantially from equal weights. Therefore, a weighting scheme that keeps equal weight for all its components is not only simple and convenient but it also reflects well the opinion of experts. Our first conclusion, therefore, is that to test this preliminary conclusion further, future research along these lines should either survey a very different sample, say, policy-makers for example, or employ very different methods such as carefully structured interviews. Turning to the issue of scale, it is clear that if a country has a high (low) share in a particular area and the policy of the country is above (below) average, a weighting system incorporating scale magnifies (shrinks) the impact on overall ranking. The significance of the current research is that it lends some quantification to this proposition. Indeed the evidence suggests that the application of a system that accommodates scale to CDI leads to a substantial change in country rankings. The evidence suggests that scale is a much more important factor than policy effort in determining impact on developing countries. This does not mean that policy effort is uninteresting. It is of great interest. But it does mean, and this is our second conclusion for future research, that scale should be a factor high on the research agenda as efforts are made to move CDI from a focus on effort to a concern with impact. Finally, as efforts get under way to conduct detailed impact studies, the quantitative impact of different policy-country combinations as revealed by Table 8 could be used to direct attention to the most important areas for future research. This, our third
Setting Weights for Aggregate Indices: An Application to the CDI and HDI 16
conclusion, suggests, for example, that the same research effort could have a much higher pay-off for developing countries if it were directed towards environmental policy in the USA than if it were directed towards aid policy in Finland. That said, it is worth recalling that all the measures discussed in this paper focus on average measures rather than marginal ones. Hopefully, the detailed impact studies now being organized will be able to deal with this point at least to some degree and, hopefully, the guidance provided by averages in selecting case studies will prove useful for marginal analysis.

Setting Weights for Aggregate Indices: An Application to the CDI and HDI 17
References Birdsall, Nancy and Roodman, David. 2003. The Commitment to Development Index: A Scorecard of Rich-Country Policies. Center for Global Development: Washington, DC. Foreign Policy, May-June 2003. http://www.foreignpolicy.com/story/story.php?storyID=13656 Lynn, P., and Jowell, R. 1996. How Might Opinion Polls be Improved?: The Case for Probability Sampling, Journal of the Royal Statistical Society. Series A (Statistics in Society), 159 (1): 21-28. Roodman, D. 2003. An Index of Donor Aid Performance. Center for Global Development: Washington, DC. Scott, Christopher. 1961. Research on Mail Surveys, Journal of the Royal Statistical Society. Series A (General), 124 (2): 143-205. Srinivasan, T.N. 1994. Human Development: A New Paradigm or Reinvention of the Wheel?, AEA Papers and Proceedings, 84 (2): 238-243. UNDP. 2002. Human Development Report 2002. New York, Oxford University Press.

Setting Weights for Aggregate Indices: An Application to the CDI and HDI 18
Appendix Table A1: Sample distribution based on Income
Income group # of Researchers As a % # of Respondents Low Income 386 25.0 50 Lower Middle Income 391 25.3 51 Upper Middle Income 186 12.0 24 High Income OECD 530 34.3 69 High Income Non OECD 54 3.5 7 Total 1547 100.0 200
Countries are classified according to the World Bank’s classification. See WDI 2002 for details. Table A2: Sample distribution based on Region
Low Income
Lower Middle Income
Upper Middle Income
High Income OECD
High Income non-OECD
Total
EAP 4 9 4 3 3 23 ECA 6 21 10 40 1 78 LAC 0 10 5 0 0 15 MENA 0 10 2 0 3 15 NA 0 0 0 25 0 25 SA 23 2 0 0 0 25 SSA 16 0 3 0 0 19 Total 50 51 24 69 7 200
Countries are classified according to the World Bank’s classification. See WDI 2002 for details. Table A3: Distribution of Sample According to Country
Country Number of Respondent As a % Cumulative % Algeria 1 0.95 0.95 Argentina 2 1.90 2.86 Armenia 1 0.95 3.81 Australia 1 0.95 4.76 Bangladesh 2 1.90 6.67 Belarus 1 0.95 7.62 Belgium 1 0.95 8.57 Bolivia 1 0.95 9.52 Brazil 1 0.95 10.48 Bulgaria 2 1.90 12.38 Cameroon 1 0.95 13.33 China 2 1.90 15.24 Croatia 1 0.95 16.19 Czech Republic 1 0.95 17.14 Egypt 2 1.90 19.05 England 1 0.95 20.00 France 2 1.90 21.90 Georgia 1 0.95 22.86 Germany 1 0.95 23.81 Greece 1 0.95 24.76 Guatemala 1 0.95 25.71 Hungary 2 1.90 27.62 India 7 6.67 34.29 Indonesia 2 1.90 36.19 Iran 1 0.95 37.14 Israel 1 0.95 38.10 Italy 2 1.90 40.00 Japan 2 1.90 41.90 Jordan 1 0.95 42.86 Kazakhstan 1 0.95 43.81 Kenya 2 1.90 45.71 Korea 1 0.95 46.67 Lebanon 1 0.95 47.62 Morocco 1 0.95 48.57 Netherlands 2 1.90 50.48 Nigeria 3 2.86 53.33 Norway 1 0.95 54.29 Pakistan 4 3.81 58.10 Peru 2 1.90 60.00 Philippines 3 2.86 62.86
Setting Weights for Aggregate Indices: An Application to the CDI and HDI 19
Poland 2 1.90 64.76 Romania 1 0.95 65.71 Russia 7 6.67 72.38 Singapore 2 1.90 74.29 Slovenia 1 0.95 75.24 Spain 1 0.95 76.19 Switzerland 1 0.95 77.14 Taiwan 1 0.95 78.10 Tanzania 1 0.95 79.05 Thailand 3 2.86 81.90 Tunisia 1 0.95 82.86 Turkey 1 0.95 83.81 UK 5 4.76 88.57 USA 7 6.67 95.24 Uganda 1 0.95 96.19 Ukraine 1 0.95 97.14 Uzbekistan 1 0.95 98.10 Vietnam 1 0.95 99.05 Zimbabwe 1 0.95 100.00 Total 105 100
Table A4: HDI: Ranking of Countries – Equal Weights and Weights Based on the Survey
Country Equal Ranks based on Survey Weight All Respondents OECD only Non OECD only Norway 1 2 2 3 Sweden 2 6 4 6 Canada 3 4 1 5 Belgium 4 3 6 2 Australia 5 5 5 4 United States 6 1 3 1 Iceland 7 8 7 8 Netherlands 8 7 8 7 Japan 9 10 9 10 Finland 10 9 10 9 Switzerland 11 14 11 14 France 12 13 13 12 United Kingdom 13 11 14 11 Denmark 14 16 18 15 Austria 15 12 12 13 Luxembourg 16 15 15 18 Germany 17 18 17 17 Ireland 18 17 16 16 New Zealand 19 19 19 19 Italy 20 20 20 21 Spain 21 21 21 20 Israel 22 22 22 22 Hong Kong, China (SAR) 23 24 23 25 Greece 24 25 25 23 Singapore 25 23 24 24 Cyprus 26 26 26 26 Korea, Rep. of 27 27 29 27 Portugal 28 28 27 28 Slovenia 29 29 28 29 Malta 30 30 30 30 Barbados 31 31 31 31 Brunei Darussalam 32 32 32 32 Czech Republic 33 33 33 33 Argentina 34 34 34 34 Hungary 35 35 38 35 Slovakia 36 37 37 36 Poland 37 38 39 37 Chile 38 39 36 39 Bahrain 39 36 35 38 Uruguay 40 40 40 40 Bahamas 41 41 41 41 Estonia 42 42 42 42 Costa Rica 43 43 43 43 Saint Kitts and Nevis 44 44 45 44 Kuwait 45 47 47 47

Setting Weights for Aggregate Indices: An Application to the CDI and HDI 20
United Arab Emirates 46 46 44 46 Seychelles 47 45 46 45 Croatia 48 49 48 49 Lithuania 49 48 49 48 Trinidad and Tobago 50 51 51 50 Qatar 51 52 52 53 Antigua and Barbuda 52 50 50 51 Latvia 53 53 53 52 Mexico 54 55 55 55 Cuba 55 54 54 54 Belarus 56 56 56 56 Panama 57 57 57 57 Belize 58 58 58 59 Malaysia 59 61 59 62 Russian Federation 60 59 62 58 Dominica 61 62 60 61 Bulgaria 62 60 61 60 Romania 63 64 65 63 Libyan Arab Jamahiriya 64 63 63 64 Macedonia, TFYR 65 65 64 65 Saint Lucia 66 69 67 69 Mauritius 67 66 66 67 Colombia 68 67 69 66 Venezuela 69 68 68 68 Thailand 70 71 71 70 Saudi Arabia 71 70 70 71 Fiji 72 72 74 72 Brazil 73 74 76 74 Suriname 74 73 73 73 Lebanon 75 77 75 78 Armenia 76 78 78 76 Philippines 77 76 77 75 Oman 78 75 72 79 Kazakhstan 79 79 80 77 Ukraine 80 81 81 80 Georgia 81 83 83 83 Peru 82 80 79 81 Grenada 83 82 82 82 Maldives 84 86 88 86 Turkey 85 84 84 84 Jamaica 86 85 85 87 Turkmenistan 87 87 89 85 Azerbaijan 88 89 87 88 Sri Lanka 89 88 86 89 Paraguay 90 90 90 90 Saint Vincent and the Grenadines 91 91 91 92 Albania 92 93 93 93 Ecuador 93 92 92 91 Dominican Republic 94 94 94 94 Uzbekistan 95 96 98 95 China 96 95 95 96 Tunisia 97 98 96 98 Iran, Islamic Rep. of 98 97 97 97 Jordan 99 100 100 100 Cape Verde 100 99 99 99 Samoa (Western) 101 101 101 101 Kyrgyzstan 102 102 103 102 Guyana 103 104 104 103 El Salvador 104 103 102 104 Moldova, Rep. of 105 106 106 106 Algeria 106 107 105 107 South Africa 107 105 108 105 Syrian Arab Republic 108 108 107 108 Viet Nam 109 109 109 109 Indonesia 110 111 110 111 Equatorial Guinea 111 110 111 110 Tajikistan 112 112 112 112 Mongolia 113 113 113 113 Bolivia 114 114 114 114 Egypt 115 115 115 116

Setting Weights for Aggregate Indices: An Application to the CDI and HDI 21
Honduras 116 117 116 117 Gabon 117 116 117 115 Nicaragua 118 119 118 119 Sao Tome and Principe 119 118 119 118 Guatemala 120 120 120 120 Solomon Islands 121 121 121 121 Namibia 122 122 123 122 Morocco 123 123 122 123 India 124 125 124 125 Swaziland 125 124 125 124 Botswana 126 126 126 126 Myanmar 127 128 127 128 Zimbabwe 128 127 130 127 Ghana 129 129 128 129 Cambodia 130 130 131 130 Vanuatu 131 131 129 132 Lesotho 132 132 133 131 Papua New Guinea 133 133 132 133 Kenya 134 135 136 134 Cameroon 135 134 135 136 Congo 136 136 137 135 Comoros 137 137 134 137 Pakistan 138 140 139 140 Sudan 139 138 138 138 Bhutan 140 141 140 141 Togo 141 139 141 139 Nepal 142 142 142 142 Lao People's Dem. Rep. 143 143 143 143 Yemen 144 144 144 144 Bangladesh 145 145 145 145 Haiti 146 146 146 147 Madagascar 147 147 147 146 Nigeria 148 148 148 148 Djibouti 149 150 150 150 Uganda 150 149 149 149 Tanzania, U. Rep. of 151 151 152 151 Mauritania 152 152 151 152 Zambia 153 153 156 153 Senegal 154 155 153 156 Congo, Dem. Rep. of the 155 156 155 155 Côte d'Ivoire 156 154 154 154 Eritrea 157 157 158 157 Benin 158 158 157 158 Guinea 159 159 159 159 Gambia 160 161 161 162 Angola 161 160 160 161 Rwanda 162 162 162 163 Malawi 163 163 163 160 Mali 164 164 164 164 Central African Republic 165 165 165 165 Chad 166 166 166 166 Guinea-Bissau 167 167 167 167 Ethiopia 168 168 168 168 Burkina Faso 169 170 169 170 Mozambique 170 169 170 169 Burundi 171 171 171 171 Niger 172 172 172 173 Sierra Leone 173 173 173 172
Table A5: Modified Commitment to Development Index: Equal Weights Country Aid Trade Investment Migration Peacekeeping Environment Rank Average Original Rank Australia 1.74 4.20 -2.38 3.72 2.84 1.81 19 1.99 19 Austria 2.83 6.96 7.83 6.51 2.55 5.32 6 5.33 9 Belgium 3.50 6.96 4.09 4.49 3.46 4.52 10 4.50 12 Canada 1.70 1.00 2.91 6.10 2.39 1.24 18 2.56 18 Denmark 9.00 6.96 3.67 4.45 7.06 4.99 5 6.02 2 Finland 2.96 6.96 3.56 1.27 2.87 5.20 15 3.80 17 France 3.13 6.96 3.55 0.83 5.18 4.54 11 4.03 14 Germany 2.11 6.96 3.21 8.14 3.81 5.56 8 4.97 6

Setting Weights for Aggregate Indices: An Application to the CDI and HDI 22
Greece 1.46 6.96 0.00 1.56 9.00 4.23 14 3.87 13 Ireland 2.57 6.96 0.00 4.45 3.72 1.20 17 3.15 15 Italy 1.40 6.96 0.50 1.07 5.27 5.09 16 3.38 15 Japan 1.21 4.01 0.87 1.55 0.47 3.60 21 1.95 21 Netherlands 6.93 6.96 10.96 4.45 3.48 5.50 2 6.38 1 New Zealand 1.70 3.25 0.00 9.00 6.87 3.05 13 3.98 4 Norway 6.61 1.71 4.62 4.63 7.37 2.46 9 4.57 10 Portugal 2.18 6.96 14.37 1.01 6.82 4.93 4 6.05 3 Spain 2.37 6.96 17.64 1.77 2.93 5.62 3 6.22 6 Sweden 6.98 6.96 5.59 3.95 1.33 6.02 7 5.14 8 Switzerland 3.31 2.16 19.56 9.00 0.11 7.31 1 6.91 5 United Kingdom 3.04 6.96 2.72 3.12 3.60 4.44 12 3.98 11 United States 0.81 4.52 1.72 2.32 1.46 1.00 20 1.97 20 Table A6: Share of Each Country in OECD Total Country Share of each country in: Average Aid Trade Investment Migration Peacekeeping Environment Australia 1.6% 1.5% -1.4% 2.7% 2.1% 2.3% 1.5% Austria 1.3% 0.9% 2.4% 2.1% 0.9% 0.6% 1.4% Belgium 2.0% 1.1% 1.5% 1.8% 1.6% 0.9% 1.5% Canada 2.9% 2.1% 3.0% 7.3% 3.0% 5.1% 3.9% Denmark 3.6% 0.8% 1.0% 1.0% 2.7% 0.9% 1.6% Finland 0.9% 0.6% 0.7% 0.3% 0.7% 0.7% 0.6% France 10.1% 6.0% 7.4% 1.9% 14.7% 3.4% 7.3% Germany 9.8% 8.7% 9.8% 26.5% 14.0% 9.5% 13.1% Greece 0.4% 0.5% 0.0% 0.6% 2.6% 0.8% 0.8% Ireland 0.6% 0.4% 0.0% 0.7% 0.8% 0.5% 0.5% Italy 3.8% 5.0% 0.9% 2.4% 12.8% 3.8% 4.8% Japan 12.8% 18.8% 6.1% 7.7% 0.1% 19.5% 10.8% Netherlands 6.5% 0.2% 0.0% 2.8% 2.6% 2.0% 3.5% New Zealand 0.2% 1.7% 6.9% 1.3% 0.8% 0.4% 0.7% Norway 2.7% 0.5% 1.2% 0.8% 2.9% 0.8% 1.5% Portugal 0.6% 0.5% 2.5% 0.4% 1.8% 0.6% 1.1% Spain 3.4% 2.6% 16.0% 2.7% 3.8% 3.9% 5.4% Sweden 3.6% 1.1% 2.0% 1.4% 0.2% 0.9% 1.5% Switzerland 2.0% 0.8% 7.6% 2.6% 0.1% 0.8% 2.3% United Kingdom 10.6% 6.6% 6.1% 7.3% 10.2% 4.0% 7.5% United States 20.4% 39.6% 26.3% 25.6% 21.9% 38.7% 28.7%