Embed Size (px)
Citation preview

Improved Detection of Optically Thin Cirrus Clouds Using CrIS Double CO2 Bands
Lin Lin1,2 and Fuzhong Weng2
1 I. M. Systems Group, Inc.2 NOAA Center for Satellite Applications and Research pp
Presented at 14th JCSDA Technical Review Meeting & Science Workshop on Satellite Data Assimilation, Moss Landing, California, May 31 – June 2, 2016
Outline
1. Major Issues for CrIS Data Assimilation (DA)
- Issues related to simulations of shortwave channels- Misclassification of thin cirrus cloud in DA
2. Improve CrIS Quality Control
Cl d d t ti l ith i d bl CO2 b d- Cloud detection algorithms using double CO2 bands
- Cloud Scattering and Emission Index (CESI)
3. Summary and Conclusions
4 Future Work
2
4. Future Work

2012 NCEP t k i 934 HWRF
A Baseline HWRF System for Satellite Data Assimilation
• 2012 NCEP-trunk version 934 HWRF (three nested domains)
• System ModificationsModel Domains
- Higher model top (0.5 hPa, 61 levels)- Warm start- Asymmetric vortex initializationAsymmetric vortex initialization
• Advanced POES and GOES DA- POES sounding instruments:
AMSU ATMS C IS IASI AIRSInner
domain
Outerdomain
AMSU, ATMS, CrIS, IASI, AIRS- New quality control (QC) for MHS- GOES-13/15 imager radiance
Th t l i d l d i
Middledomain
- POES microwave imager radiance(AMSR2, GMI)
- Surface sensitive channels through
Three telescoping model domains:Outer domain: 27 km (fixed) Middle domain: 9 km (moving)I d i 3 k ( i )g
Community Surface Emissivity Model (CSEM)
Inner domain: 3 km (moving)
3

CrIS Weighting Function
— LWIR— SWIR
— MWIR
a)re
ssur
e (h
PaPr
WF (hPa-1) WF (hPa-1)
WFs of 399 CrIS channels selected for CrIS data assimilation in GSI:— 184 (713) LWIR channels— 87 (159) SWIR channels— 128 (433) MWIR channels 4

Impacts of CrIS and ATMS DA on Hurricane Forecasts
Control Run Control Run +ATMS Control Run +CrIS
• Unlike ATMS data assimilation of CrIS radiance observations in HWRF degraded• Unlike ATMS data, assimilation of CrIS radiance observations in HWRF degraded the forecasts of Superstorm Sandy tracks.
• Assimilation of CrIS and ATMS data results in 30% and 70% gains of ACC at 500 hPa for the five day global forecast using the NCEP global system respectively
5
Some fundamental issues related to QC of CrIS data are yet to be resolved!
hPa for the five day global forecast using the NCEP global system, respectively.
5

QC in Current GSI for CrIS
include: remove data with quality flags from b d d FOV5 d t l ti d
11 top-level QC checks
bad scan and FOV5; data locations and observation times must be within valid range; data must within analysis time window, etc.
Further QC checksrelated to:(1) QC for shortwave IR observations
during daytime(2) QC for observations within high
topography(3) QC for cloud contamination(4) QC for clear-sky observations that
fail to pass temperature/emissivity checks
(5) QC for observations with large radiance observation departures
6

Impact of Solar Reflection on Daytime CrIS Shortwave Measurements
• Currently, CrIS surface-sensitive shortwave channels whose wavenumbers being larger than 2400 cm-1 are all removed from assimilation.
• Not all CrIS pixels of these shortwave channels are affected by Sun glint.
Si l t d d b d l k C IS b i ht t tPercentage VIIRS pixels affected by
p y g• A Sun glint correction on CrIS observations is incorporated in the CRTM version
released in 2014 (Chen et al., 2013)
Simulated and observed clear-sky CrIS brightness temperature Percentage VIIRS pixels affected by Sun glint at collocated CrIS FOV
Channel 1293 (2520 cm-1)
7Chen, Y., Y. Han, P.-V. Delst, and F. Weng, 2013: Assessment of shortwave infrared sea surface reflection and NLTE effects in CRTM using IASI data. J. Atmos. Oceanic Tech., 30, 2152-2160.

Impact of NLTE on Daytime CrIS Shortwave Measurements
• Non-Local Thermaldynamic Equilibrium (NLTE) emission occurs in the upper t h ( b 40 k ) h th
CrIS O-B Biases w/o NLTE CorrectionAscending node, clear-sky data over ocean at 1800 UTC during 22-29 October, 2012
atmosphere (above 40 km), where the rates of creation and annihilation of photons due to solar pumping are greater than the rate of collisions.
• If the atmosphere is assumed to be in a local thermodynamic equilibrium (LTE), then the local kinetic temperature is defined as the Plank temperature of the radiation field, which is invalid in the IR short wavelengths for the upper atmosphere where NLTE emission occurs in the strong 4.3 m CO2
• NLTE effect leads to a significantly larger observed satellite radiance than that computed from an LTE approach
absorption band.
computed from an LTE approach.
Chen, Y., Y. Han, P.-V. Delst, and F. Weng, 2013: Assessment of shortwave infrared sea surface reflection and NLTE effects in CRTM using IASI data. J. Atmos. Oceanic Tech., 30, 2152-2160.
8

Issues with the CurrentGSI Cloud DetectionGSI Cloud Detection
• The IR semi-transparent thin cirrusclouds are poorly detected by thecurrent GSI QC scheme and thus thecloud-affected CrIS radiances couldbe treated as clear-sky radiances andbe treated as clear sky radiances andassimilated wrongly into GSI.
• Compared with VIIRS cloud products, both CrIS cloud fraction and cloud top pressure derived in the current GSI are significantly biased
• A new cloud detection algorithmneeds to be developed for betterdiscrimination of the optically thin
9
p ycirrus clouds within CrIS FOVs
9

CrIS Channels and SDR NSR Data Quality
BandSpectral Range
(cm-1)Number of
ChannelSpectral
Resolution (cm-1)
LWIR 650 to 1095 713 0.625
MWIR 1210 to 1750 433 1.25
i i (bl ) ifi i ( )
SWIR 2155 to 2550 159 2.5
BandNEdN
@287K BBRadiometric Uncertainty
FrequencyUncertainty
GeolocationUncertainty
SDR uncertainties (blue) vs. specifications (green)
a d @ 87mW/m2/sr/cm-1
U ce a y@287K BB (%)
U ce a y(ppm)
U ce a y(km)
LW 0.098 (0.14) 0.12 (0.45) 3 (10) 0.2 (1.5)
MW 0.036 (0.06) 0.15(0.58) 3 (10) 0.2 (1.5)
SW 0.003 (0.007) 0.2 (0.77) 3 (10) 0.2 (1.5)10

CRTM Model Simulation of CrIS Channels
)m
pera
ture
(K)
ghtn
ess T
em
Wavenumber (cm-1)
Bri
LWIR MWIR SWIR
Locations of 80ECMWF Profilesl US t d d
6354
26-31
plus a US standardprofile in green
63
54
2423
(29.8oN, 116.0oW)(28 7oN 149 8oE)54
138
(28.7oN, 149.8oE)(47.3oS, 116.5oW)
11

Four Input Profiles for CrIS Radiance Assimilationa)
Pres
sure
(hPa
T (K) q (g kg-1) O3 (ppmv) CO2 (ppmv)
hPa)
— US standard profile
Pres
sure
(h US standard profile———
ECMWF profilesN2O (ppmv) CO (ppmv) CH4 (ppmv)
12

CrIS Sensitivity to Ice Cloud Microphysics ) — Clear-sky
R 60 IWP 5 / 2 CRTM Simulation Scenarios:• Doubled and halved particle size
with fixed IWP• Doubled and halved IWP with fixedm
pera
ture
(K) y
— Re = 60 m, IWP = 5 g/m2
— Re = 30 m, IWP = 5 g/m2
— Re = 15 m, IWP = 5 g/m2
Doubled and halved IWP with fixed particle size
Layer top : 230 hPaghtn
ess T
em
y pLayer bottom : 280 hPaLayer thickness: 1.5 km
Bri
) — Clear-sky Re = 30 m IWP = 10 g/m2
Sensitivities • Simulated BT increases with
increased particle size• Si l t d BT d ithm
pera
ture
(K) — Re = 30 m, IWP = 10 g/m2
— Re = 30 m, IWP = 5 g/m2
— Re = 30 m, IWP = 2.5 g/m2
• Simulated BT decreases with increased IWP
• CRTM is sensitive to both ice particle size and ice water path gh
tnes
s Tem
13Wavenumber (cm-1)
Brig

Physical Basis for CrIS Double CO2 Cloud Detection Algorithmg
Simulated CrIS Brightness Temperatures
Clear sky
scattering of clouds
Cirrus cloud
Clear-sky
Emission & scattering of clouds
Paired channels
• The CrIS BTs at both LW (e.g., 670-750 cm-1) and SW (e.g., 2200-2400 cm-1) CO2( g , ) ( g , ) 2channels display different responses to the changes of cloud vertical structures.
• A new cloud detection algorithm will be developed using the two CrIS CO2 bands.14

Flow Chart Describing LWIR/SWIR Pairing Procedure
SW CO2 channels2200-2400 cm-1
LW CO2 channels670-750 cm-1
1) WF peak model level difference less than 22) WF peaking height within the height range [0, 12 km]
3) Determine the lowest cloud-sensitive levels 4) The lowest cloud-sensitive model level difference less than 2
5) The final pair is selected by choosing a single SWIR channel that has the smallest standard deviation of BTs from the “paired” LWIR channel from steps 1-4 over 80 ECMWF profiles.
15

Paired LWIR and LWIR
Ch80Ch81Ch83Ch85Ch87Ch88
Steps 1-2
SWIR Channels Whose Model Level
Difference of WF sure
(hPa
)
Ch88Ch89Ch93Ch95Ch96Ch99Ch101Difference of WF
Peak Is Less than 2 Pres
s Ch102Ch104Ch106Ch107Ch111Ch147
SWIR
Ch148
Ch1170WFs of 19 LWIR (upper
panel) and 13 SWIR
re (h
Pa)
Ch1170Ch1171Ch1172Ch1177Ch1178Ch1179Ch1180
panel) and 13 SWIR channels (lower panel) whose WF peaks are within 150 - 500 hPa
Pres
su
Ch1180Ch1181Ch1187Ch1189Ch1190Ch1239Ch1241
within 150 500 hPa.
WF (hPa-1)
Ch1241
16

Paired LWIR and LWIR
Ch116Ch120Ch123Ch124Ch125Ch126
Steps 1-2
SWIR Channels Whose Model Level
Difference of WF sure
(hPa
)
Ch130Ch132Ch133Ch136Ch137Ch138Ch142Difference of WF
Peak Is Less than 2 Pres
s Ch142Ch143Ch144Ch145Ch151Ch153 Ch165
SWIRWFs of 22 LWIR (upper panel) and 10 SWIR
Ch168Ch216Ch238
re (h
Pa)
panel) and 10 SWIR channels (lower panel) whose WF peaks are within 500 - 800 hPa
Ch1164Ch1165Ch1166
Pres
su
within 500 800 hPa. Ch1166Ch1167Ch1168Ch1169Ch1173Ch1174Ch1175
WF (hPa-1)
Ch1175Ch1242
17

Paired LWIR andLWIR
Steps 1-2
Paired LWIR and SWIR Channels
Whose Model Level Diff f WF su
re (h
Pa) Ch150
Ch154Ch157Ch158Ch159Ch160Difference of WF
Peak Is Less than 2 Pres
s Ch160Ch163Ch164Ch166Ch170
SWIRWFs of 10 LWIR (upper panel) and 10 SWIR
re (h
Pa)
panel) and 10 SWIR channels (lower panel) whose WF peaks are
within 900 - 1000 hPa
Ch155Ch161Ch162Ch171
Pres
su
within 900 1000 hPa. Ch173Ch175Ch208Ch228Ch236Ch667
WF (hPa-1) 18

Steps 3-4RLWIR
RcloudyLWIR Rclear
LWIR
RclearLWIR
Determining Cloud Sensitivity Height
RLWIR Rcloudy
LWIR RclearLWIR
RclearLWIR
RSWIR RSWIR
Sensitivity Measure:RSWIR
RcloudySWIR Rclear
SWIR
RclearLWIR
Thresholds:
RSWIR Rcloudy
SWIR RclearSWIR
RclearLWIRRLWIR
cloud sensitive heigh 0.01, RSWIR
cloud sensitive height 0.1
Pa)
Peak W
Pres
sure
(hP W
F
19A total of 14 LWIR (solid) and 12 SWIR (dashed) channels whose peak WF is above 500 hPa
RLWIR (solid) and RSWIR (dashed)

Selecting the SWIR Channel that has the S ll t Std f BT
Step 5
Smallest Std. of BTsne
ls (K
)
SWIR
SWIR
Cha
nnW
avenun
LWIR
& S um
ber (cm-1
MSD
bet
wee
n 1)
LWIR
RM
Channel Number
20
1 2 3 4 5 6 7 8 9 1011 12 13 14 15 16 17 18 19 19 Pairs:

19 LWIR/ SWIR Pairs and an Example Scatter Plot for a Pair
Pair 412
) BT
(K)
34567
ress
ure
(hPa
)
SWIR
B FOR1 or 303 or 285 or 267 or 249 or 22
89101112
Pr 9 or 2211 or 2013 or 1815 or 16
1314151617
Scatter plots of CRTM-simulated brightness temperature with input from 80 ECMWF
LWIR BT (K)1819
21
LWIR SWIR
temperature with input from 80 ECMWF profiles with six zenith angles (0 o, 36.87o,
48.19 o, 55.15 o, 60.0 o, and 63.61o).

A New Cloud Index for CrIS DA QC Using CrIS Double CO2 Bands
A linear regression is established between the paired CrIS SWIR and LWIR channels:
Tb,SWIRregression Tb,LWIR
obs
JJ
where the regression coefficients and are obtained by minimizing the following cost function
min J( i , i ) Tb,SWIRregression (i, j)Tb,SWIR
CRTM (i, j) 2
j1
JJ
(Clear pixels)
An empirical cloud emission and scattering index (CESI) is defined for cloud detection at various altitudes
22
obsb,SW
regb,SW TTCESI

Relationship between Double CO2 Channels in Clear Sky
229 hP 280 hP 321 hPa
T (K
)
229 hPa 280 hPa 321 hPa
SWIR
BT
469 hPa 790 hPa 972 hPa
T (K
)
469 hPa 790 hPa 972 hPa
FOR
SWIR
B 1 or 303 or 285 or 267 or 249 or 2211 or 20
23LWIR BT (K) LWIR BT (K) LWIR BT (K)
11 or 2013 or 1815 or 16

Regression Coefficients for 19 Pairs
Mean over 30 FORsMean over 30 FORs
g
Mean over 30 FORs
PairPair
CrIS FORCrIS FOR
0.9 1.0 1.1 1.2 1.3 1.4 -90 -75 -60 -45 -30 -15 0 15 30
24
The regression coefficients and for the 30 FORs of the 19 pairs show not only strong channel dependence but also weak scan angle dependence.

Brightness Temperatures for Paired LWIR/SWIR Ch l ( 310 hP )Channels (~310 hPa)
LWIR channel SWIR channel
215 220 225 230 (K) 220 225 230 235 240 245 (K)
The depression in brightness temperature seems to be more widespread in the
25
The depression in brightness temperature seems to be more widespread in the SWIR channel than in the LWIR channel.
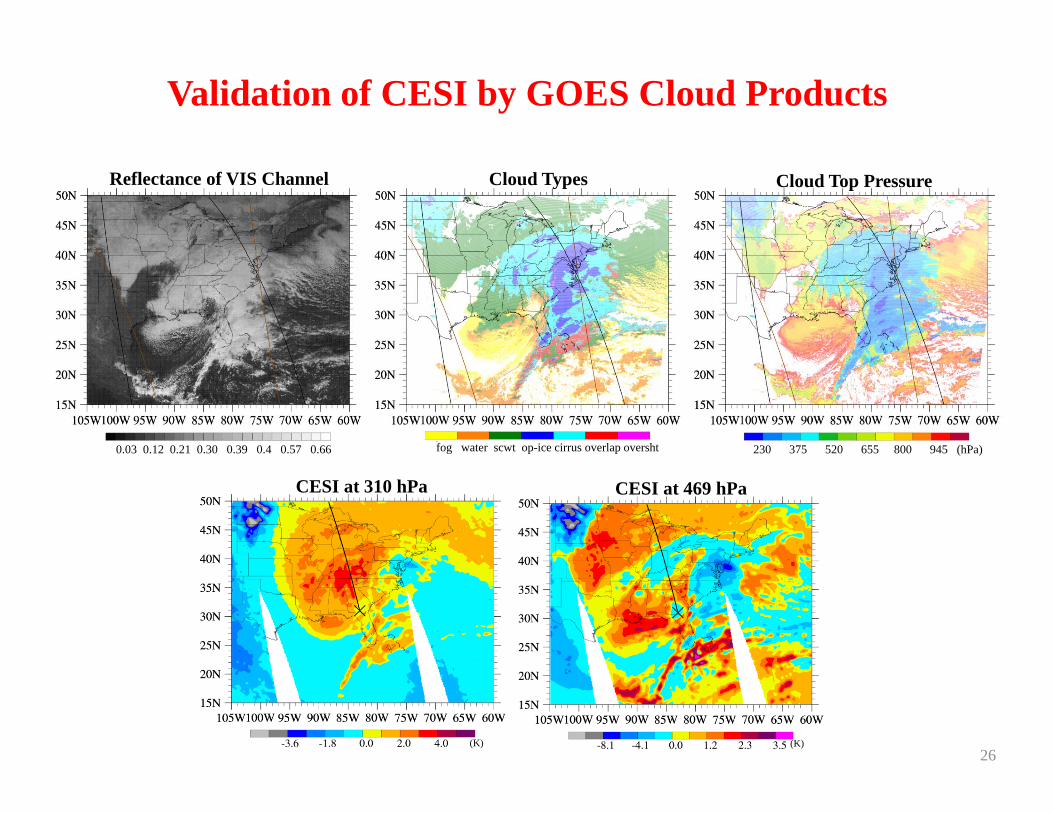
Validation of CESI by GOES Cloud Products
Reflectance of VIS Channel Cloud Types Cloud Top Pressure
(K) (K)
fog water scwt op-ice cirrus overlap oversht 230 375 520 655 800 945 (hPa)0.03 0.12 0.21 0.30 0.39 0.4 0.57 0.66
CESI at 310 hPa CESI at 469 hPa
(K) 26
(K)

Summary and Conclusions
• Assimilation of CrIS radiance in GSI requires improved quality control of thin cirrus clouds
• Some degradation may be associated with an inadequate quality• Some degradation may be associated with an inadequate quality control of thin cirrus clouds, resulting taking some cloudy radiance data affected by thin cirrus clouds as clear-sky radiances
• Cirrus cloud microphysical parameters have strong impacts on CrISspectral radiances. IWP and particle size are sensitive parameters in forward simulationsforward simulations
• A pairing of CrIS CO2 channels between LWIR and SWIR bands can resolve the cirrus clouds due to their differential responses
• A new CESI is developed to detect the vertical distribution of non-opaque clouds
• Spatial distribution of thin cirrus detected by CrIS CESI is• Spatial distribution of thin cirrus detected by CrIS CESI is consistent with GOES derived cloud products
27

Future Work• Collocate CrIS data with CALIPSO and VIIRS for validation of CESI and
understanding of the GSI QC performance of cloudy radiance• Extend the current work for the normal spectrum resolution (NSR) to the full p ( )
spectrum resolution (FSR) SDR data, which allow for more paired channels and higher vertical resolutions of detected clouds
• Assimilate CrIS NSR and/or FSR radiances in HWRF for improved CrISpdata assimilation and hurricane forecasts
SNPP CrIS Full vs. Normal Resolution SDRs
BandSpectral Range
(cm-1)Number of
ChannelSpectral
Resolution (cm-1)
LWIR 650 to 1095 713 0.625
MWIR 1210 to 1750 433 (865) 1.25 (0.625)
SWIR 2155 to 2550 159 (633) 2.5 (0.625)
28