Embed Size (px)
Citation preview

Department of Information Technology
Visual Information and Interaction
1
Department of Information Technology
Visual Information
and Interaction
SeSE/SNIC-UPPMAX: Scientific Visualisation Workshop 2014

Department of Information Technology
Visual Information and Interaction
Teachers
Anders Hast, Associate ProfessorComputer Graphics/Visualisation
Stefan Seipel, Professor Computer Graphics
Johan Nysjö, PhD student
Pontus Olsson, PhD Student
Fredrik Nysjö, PhD student
2
www.cb.uu.se/~aht [email protected]
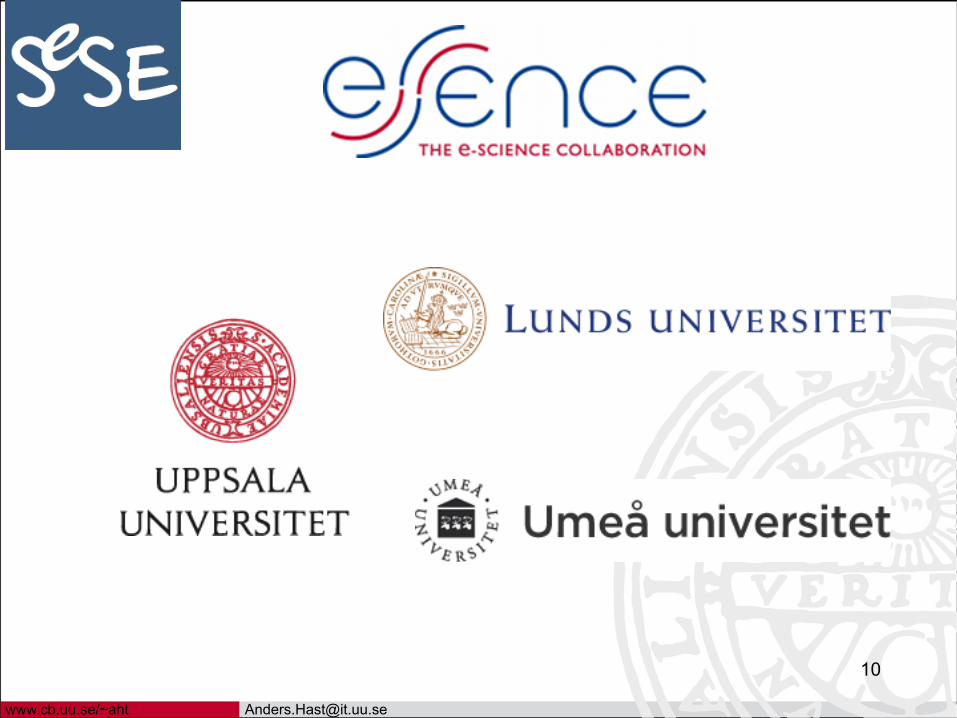
Schedule
3
Thursday 27 November09:15-09:30, Introduction to to SeSE and Visualisation, Anders09:30-10:15, Introduction to Python, Johan10:15-10:45, Coffee break and presentation of participants and stereo examples, Fredrik10:45-11:30, Introduction to VTK, Johan11:30-11:45, Introduction to the Tutorial.11:45-13:15, Lunch on your own13:15-16:00, Exercises Python and VTK, with coffee break at 14:30 Friday 28 November09:15-09:45, VTK and Paraview, Johan09:45-10:15, Visualisation Techniques, Anders10:15-11:00, Coffee break and live stereo presentations, Pontus11:00-11:45, Introduction to stereo, Stefan11:45-13:15, Lunch on your own13:15-16:00, Exercises VTK with coffee break at 14:30
Info
rmat
ions
tekn
olog
i
Institutionen för informationsteknologi | www.it.uu.se
! Uppsala Multidisciplinary Center for Advanced Computational Science
! Is Uppsala University's resource of " High-performance computers " Know-how of high-performance computing " Storage
! The center was founded in 2003 ! One of six centers of SNIC: Swedish
National Infrastructure for Computing
Info
rmat
ions
tekn
olog
i
Institutionen för informationsteknologi | www.it.uu.se
Experts! System Experts
" Hardware, Compilers etc ! Application Experts
" Algorithm and Code Development " Bioinformatics " Theoretical Material Physics " Scientific Visualisation
Info
rmat
ions
tekn
olog
i
Institutionen för informationsteknologi | www.it.uu.se
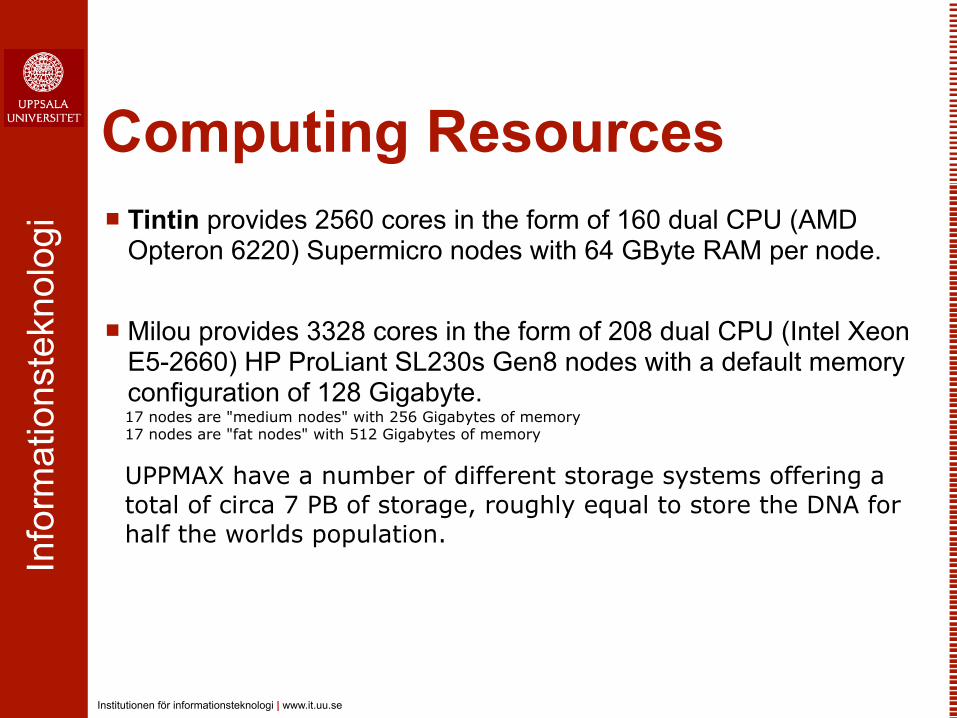
Computing Resources! Tintin provides 2560 cores in the form of 160 dual CPU (AMD
Opteron 6220) Supermicro nodes with 64 GByte RAM per node.
! Milou provides 3328 cores in the form of 208 dual CPU (Intel Xeon E5-2660) HP ProLiant SL230s Gen8 nodes with a default memory configuration of 128 Gigabyte. 17 nodes are "medium nodes" with 256 Gigabytes of memory 17 nodes are "fat nodes" with 512 Gigabytes of memory
UPPMAX have a number of different storage systems offering a total of circa 7 PB of storage, roughly equal to store the DNA for half the worlds population.
Info
rmat
ions
tekn
olog
i
Institutionen för informationsteknologi | www.it.uu.se
Visualization at UPPMAX! 3DIS4U
" Three Dimensional Image Studio For Uppsala " A visualization lab with a stereoscopic display
for true 3D visualizations
! Workshops " 19,20 March: Python and VTK for Visualization " Will also be held in the autumn " Python for HPC, to be held...
! Helping researchers in any area with their visualization problems
www.cb.uu.se/~aht [email protected]
12
PavlinMitev
AndersHast
Elias Jarlebring
Ingela Nyström
Michael HankeHans
KarlssonDan
Henningsson
People

www.cb.uu.se/~aht [email protected]
13
Identify areas where courses within e-Science
are needed
A meeting place for graduate students using
e-Science tools and techniques
To give basic training in fields where the use of e-Science is emerging
Mission
www.cb.uu.se/~aht [email protected]
14
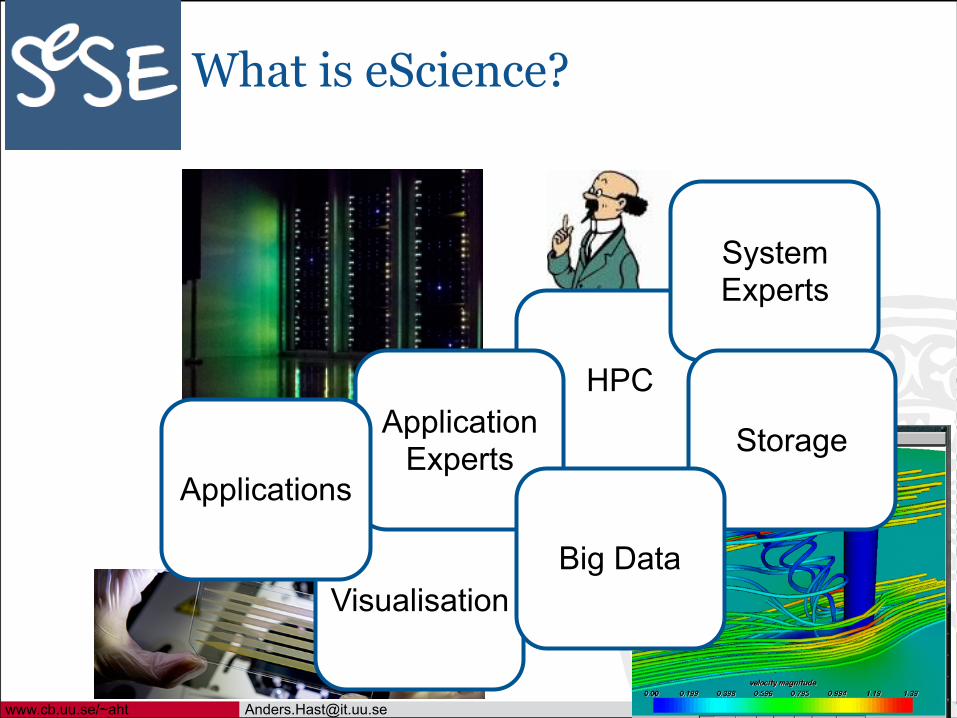
HPC
System Experts
Storage
Visualisation
Application Experts
Applications
Big Data
What is eScience?
www.cb.uu.se/~aht [email protected]
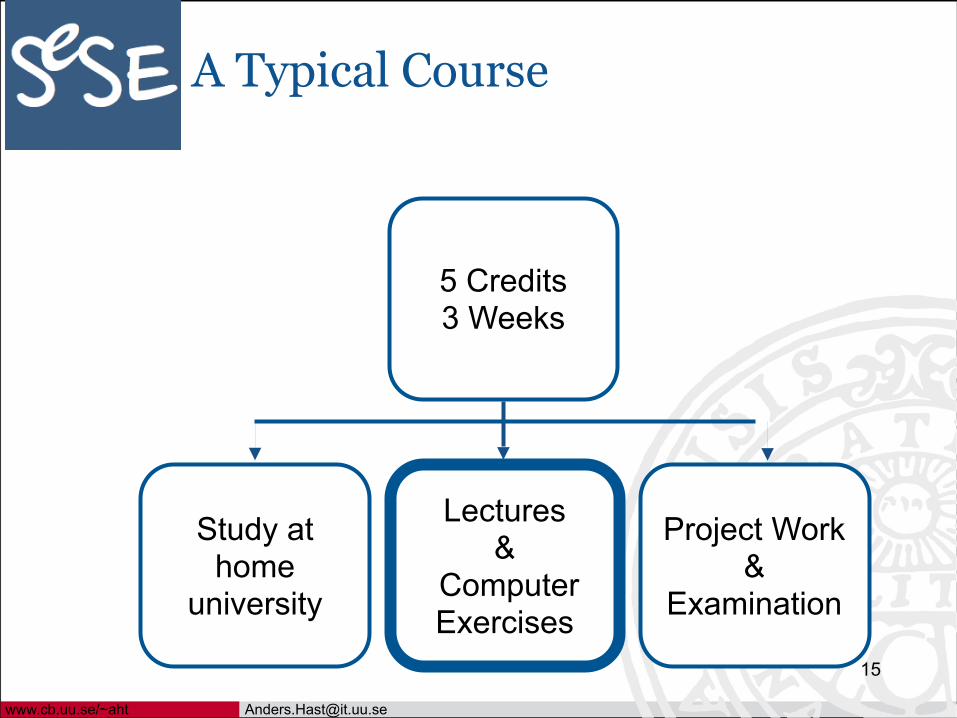
15
Study athome
university
Lectures&
Computer Exercises
Project Work &
Examination
5 Credits3 Weeks
A Typical Course
www.cb.uu.se/~aht [email protected]
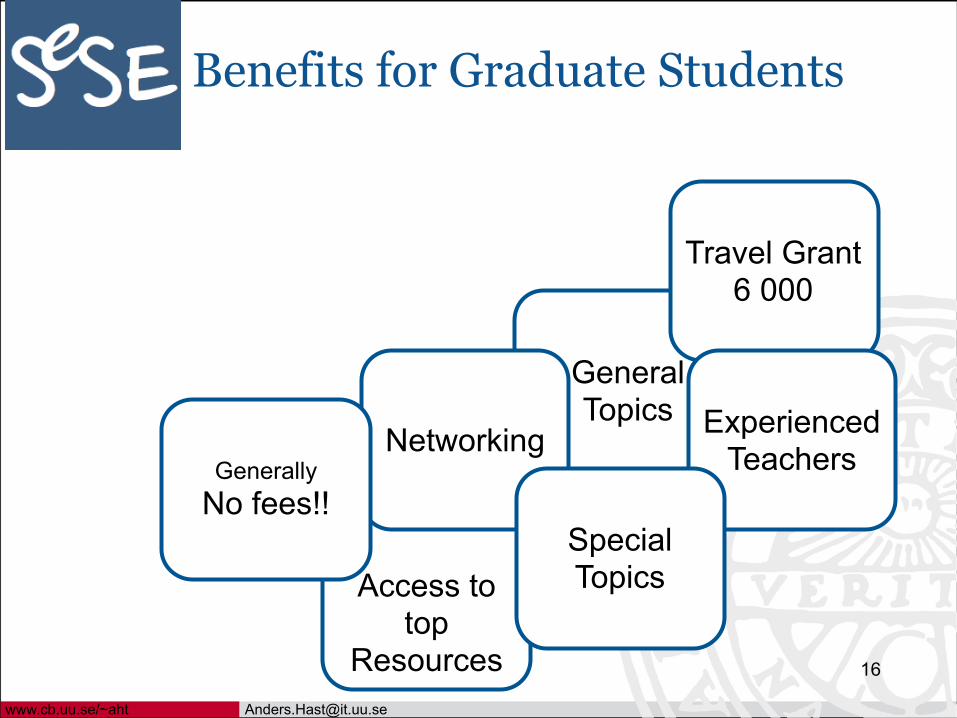
16
General Topics
Travel Grant 6 000
Experienced Teachers
Access to top
Resources
NetworkingGenerally
No fees!!Special Topics
Benefits for Graduate Students
www.cb.uu.se/~aht [email protected]
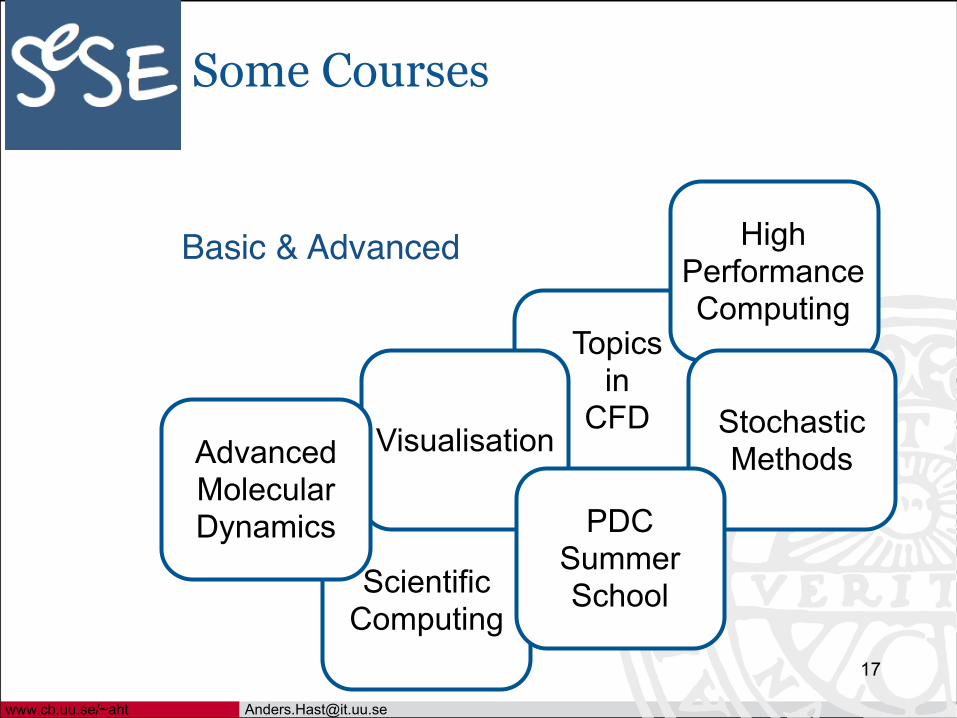
17
Topics in
CFD
High Performance Computing
Stochastic Methods
Scientific Computing
VisualisationAdvanced Molecular Dynamics PDC
Summer School
Basic & Advanced
Some Courses
Department of Information Technology
Visual Information and Interaction
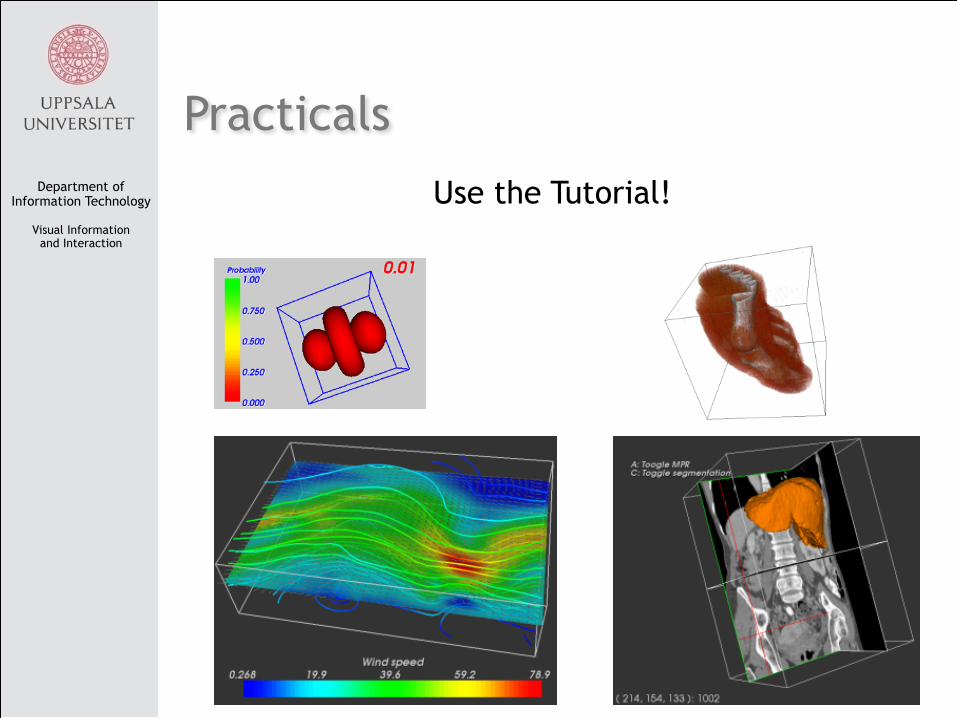
Practicals
18
Use the Tutorial!

Department of Information Technology
Visual Information and Interaction
19
“A picture is worth a thousand words”
When large and complex data sets are resulting from experiments and computations, visualisation is a way to give deeper insight and knowledge.
A focus will be on using script programming: Python in combination with VTK (the Visualisation Toolkit).
Department of Information Technology
Visual Information
and Interaction

Department of Information Technology
Visual Information and Interaction
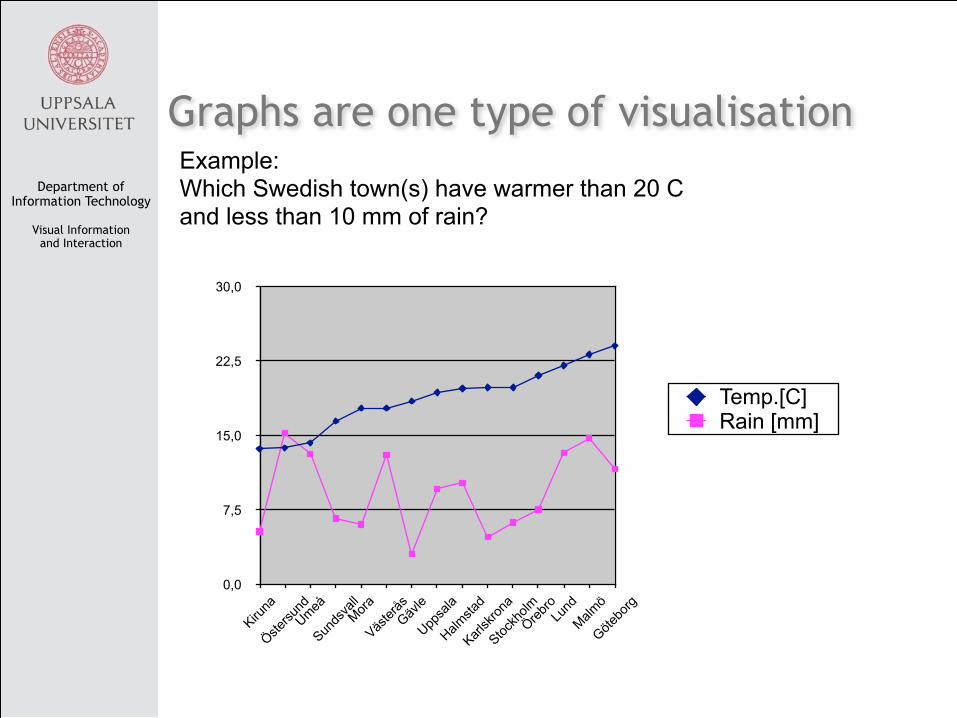
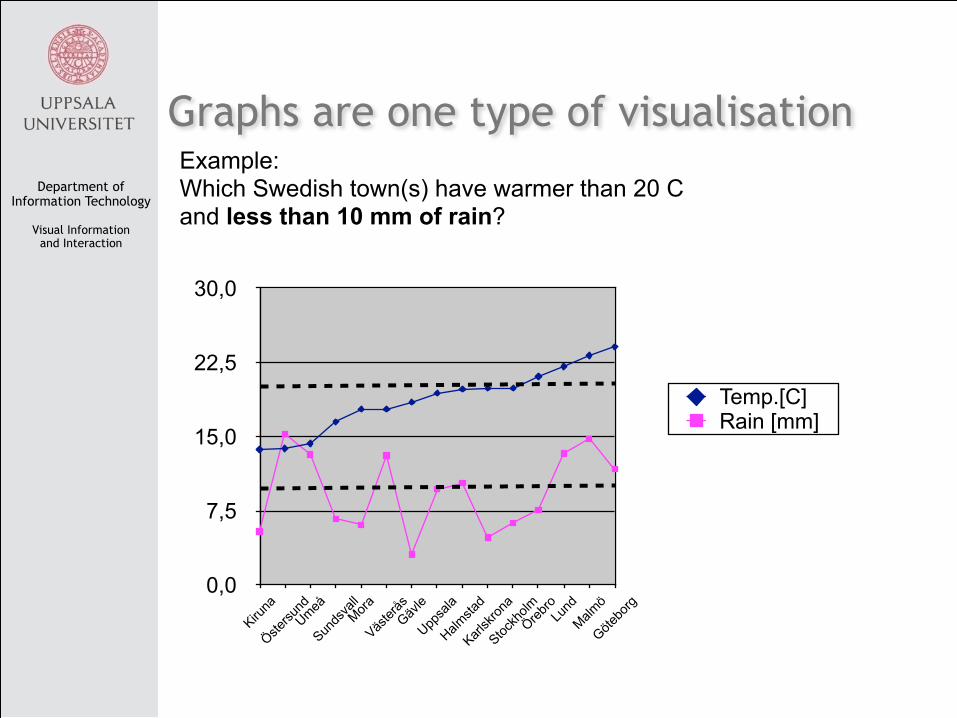
Graphs are one type of visualisation
Example: Which Swedish town(s) have warmer than 20 C and less than 10 mm of rain?
Department of Information Technology
Visual Information and Interaction
Graphs are one type of visualisation
0,0
7,5
15,0
22,5
30,0
Kiruna
Östersu
ndUmeå
Sunds
vallMora
Väster
åsGäv
le
Uppsa
la
Halmsta
d
Karlsk
rona
Stockh
olmÖreb
roLu
nd
Malmö
Götebo
rg
Temp.[C]Rain [mm]
Example: Which Swedish town(s) have warmer than 20 C and less than 10 mm of rain?
Department of Information Technology
Visual Information and Interaction
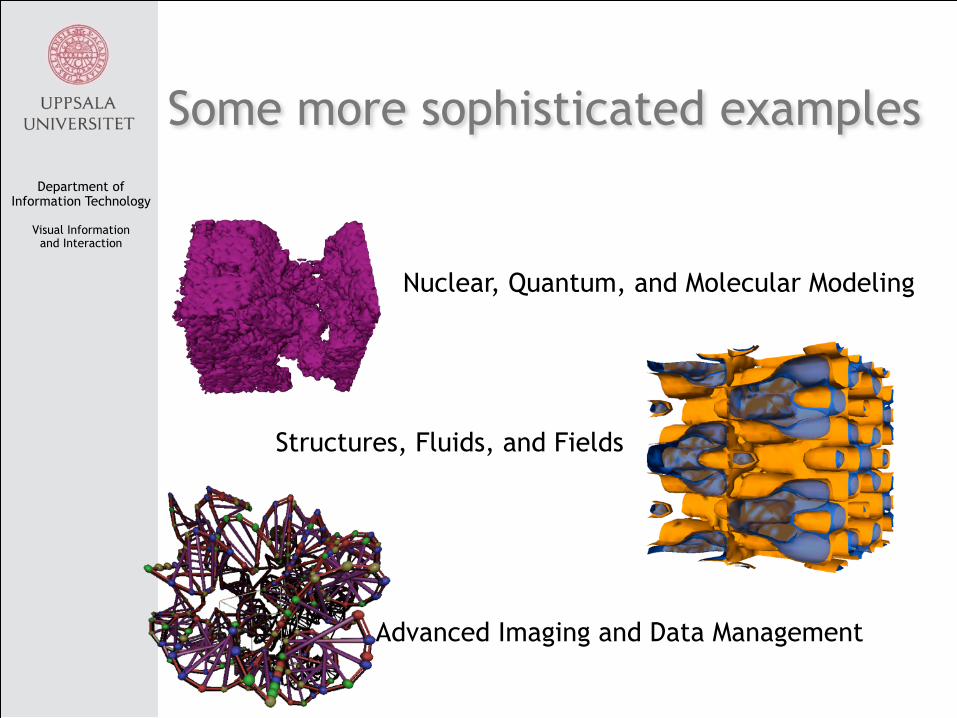
Some more sophisticated examples
Structures, Fluids, and Fields
Advanced Imaging and Data Management
Nuclear, Quantum, and Molecular Modeling
Department of Information Technology
Visual Information and Interaction
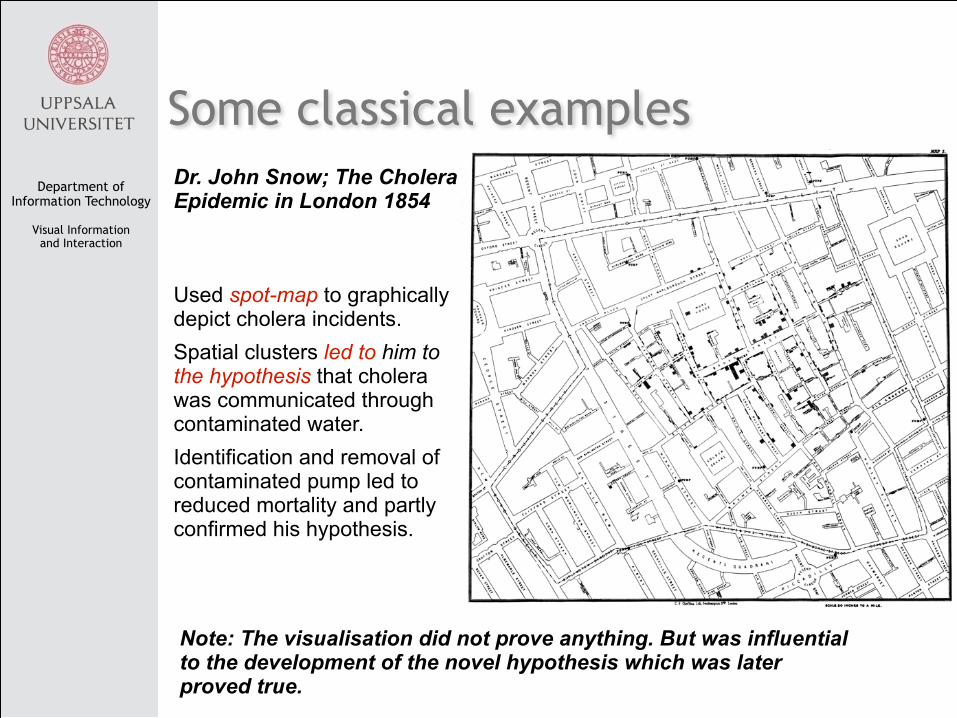
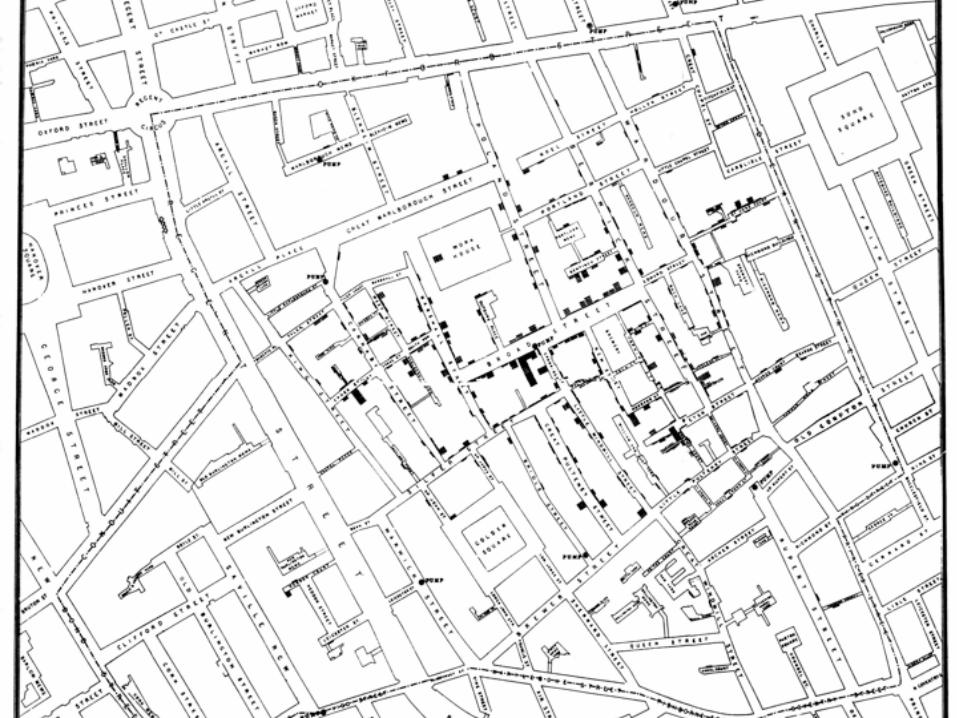
Some classical examplesDr. John Snow; The Cholera Epidemic in London 1854
Used spot-map to graphically depict cholera incidents. Spatial clusters led to him to the hypothesis that cholera was communicated through contaminated water. Identification and removal of contaminated pump led to reduced mortality and partly confirmed his hypothesis.
Note: The visualisation did not prove anything. But was influential to the development of the novel hypothesis which was later proved true.
Department of Information Technology
Visual Information and Interaction
27
Department of Information Technology
Visual Information and Interaction
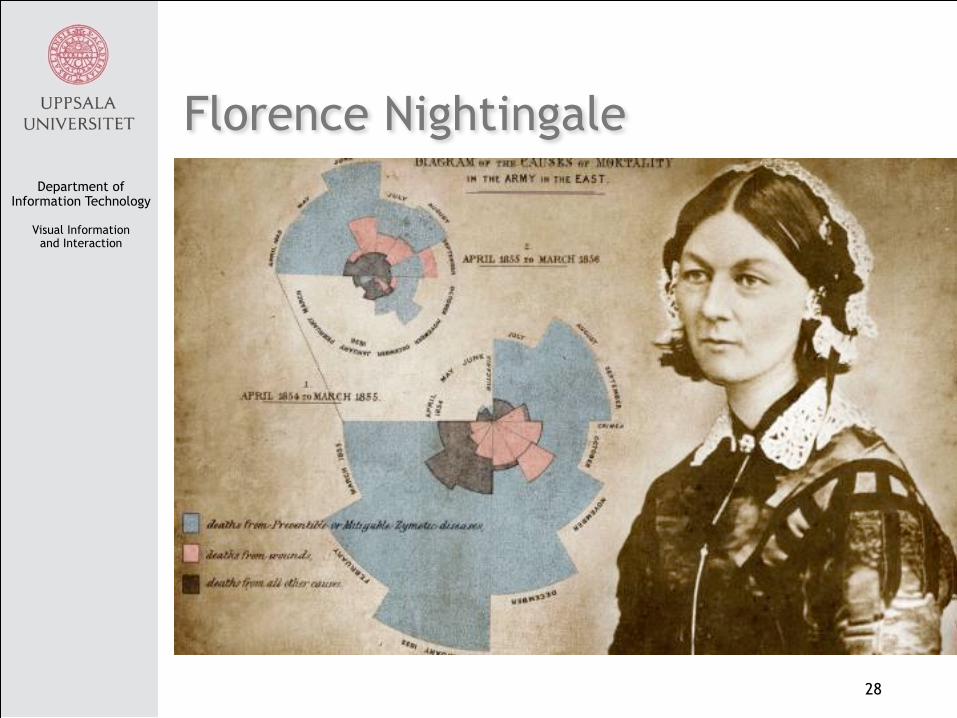
Florence Nightingale
28
Department of Information Technology
Visual Information and Interaction
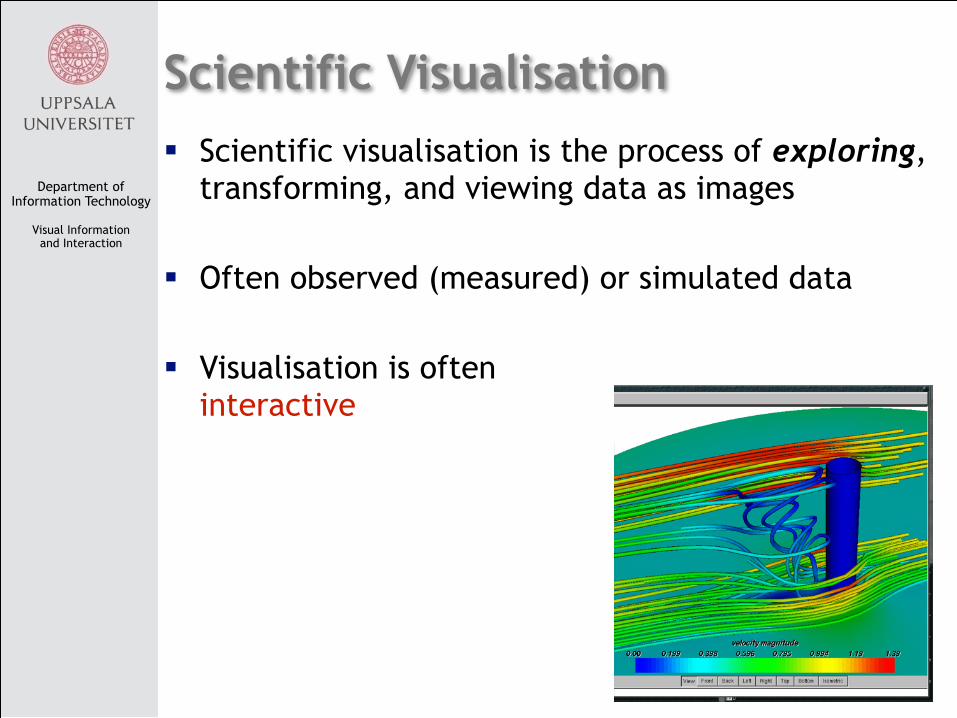
Scientific Visualisation# Scientific visualisation is the process of exploring,
transforming, and viewing data as images
# Often observed (measured) or simulated data
# Visualisation is often interactive
Department of Information Technology
Visual Information and Interaction
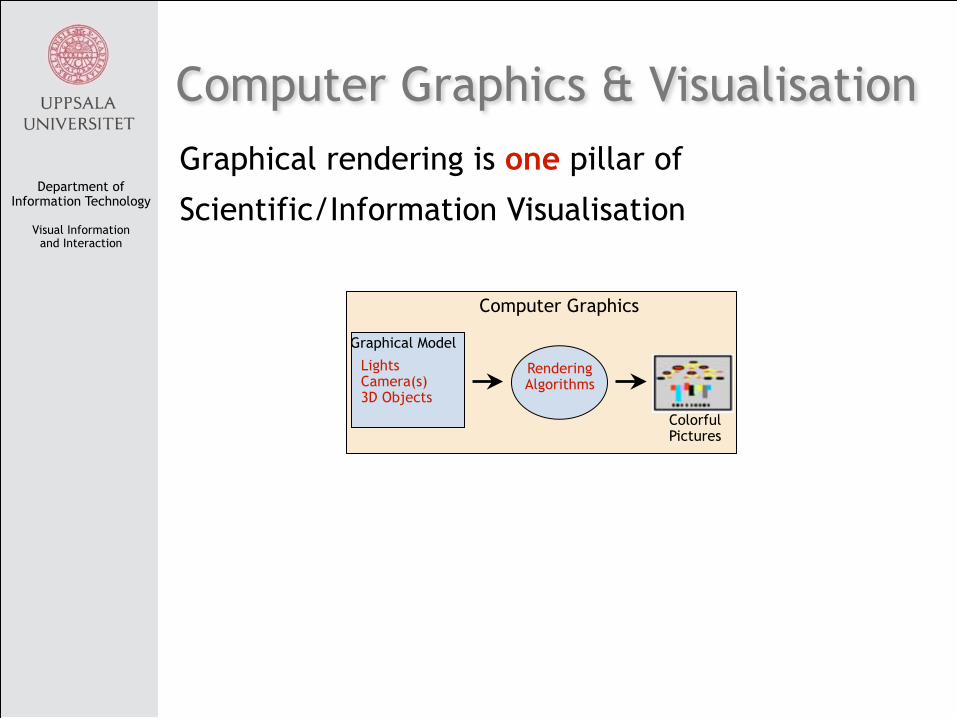
Computer Graphics
Computer Graphics & VisualisationGraphical rendering is one pillar of Scientific/Information Visualisation
Graphical Model
Lights Camera(s) 3D Objects
Rendering Algorithms
Colorful Pictures

Department of Information Technology
Visual Information and Interaction
Scientific/Information Visualisation
Computer Graphics
Computer Graphics & VisualisationGraphical rendering is one pillar of Scientific/Information Visualisation
Ah Ha!!!
Graphical Model
Lights Camera(s) 3D Objects
Rendering Algorithms
Colorful Pictures
We gain Insight
DataTransfor- Mation & Mapping
Conceptual Model
Department of Information Technology
Visual Information and Interaction
Conclusion
Visualisation helps to understand the data and get insight on the data
It also is a research tool to discover the data and find “hidden truths” in the data
Visualisation use Computer Graphics
32