Embed Size (px)
Citation preview

135
Simon Peter Njoroge (Contact author)
Airport Manager,
Jomo Kenyatta International Airport
Email: [email protected]
Dr. X.N Iraki
Senior Lecturer, School of Business,
University of Nairobi, Kenya
LIST OF ABBREVIATIONS
ACI Airports Council International
EIA Eldoret International Airport
IATA International Air Transport Association
JKIA Jomo Kenyatta International Airport
KAA Kenya Airports Authority
KIA Kisumu International Airport
KNBS Kenya National Bureau of Statistics
MIA Mombasa International Airport
SPSS Statistical Package for the Social Sciences
WTO World Tourism Organisation
USA United States of America
Abstract
The overall goal of this paper is to contribute to the research on customer satisfaction at airports. Existing studies
have focussed on airport service experience in America, Europe and Asia. Specifically it contributes to the
development of the knowledge of service quality expectations at a major airport hub in Africa.
The exploratory study integrated elements of the 22 item SERVQUAL scale developed by Parasuraman et al.,
(1988). A quantitative research was conducted and responses from 280 departing international travellers at the
Jomo Kenyatta International Airport was used to test five hypotheses. An independent samples t-test was utilised
to assess whether the means of two groups are statistically significant from one another. The variables to be tested
were service performance against the respective service expectation. The findings indicate atmosphere related
At Kenyan Airports
Service Quality and Customer Satisfaction
doi:10.18418/978-3-96043-060-5_135

136
aspects of the airport experience showed a significant influence on the respondents’ customer satisfaction. The
feeling of being safe in the airport, ease of way finding, facilities for people with reduced mobility and the
availability of leisure rooms were the most significant elements in the traveller’s positive experience while at the
airport.
The study was not without limitations. In utilising the gap analysis model, this study focused on understanding
what the customers want. Other elements of the gap analysis model require further illumination. The findings of
this study will help contribute to the development of a conceptual model for a much more exhaustive study on
airport passenger satisfaction at other Kenyan airports and internationally.
Introduction:
Air travel has been characterised by rapid change with improvements in travel comfort and technology which have
served to raise travellers’ expectations as regards the airport experience (Vanja, Yang, Bilgihan and Bujisic, 2013). In
order to evaluate their performance, airline and airport management companies have measured passengers’
perceptions of service provided. This is done without clearly understanding passengers’ expectations. Such
initiatives, when misunderstood, have the risk of substantial financial and market losses to providers (Chen and
Chang, 2005).
The air travel experience is composed of two major components: airport ground service and in-flight service. Prior
studies on airport services have identified factors relating to passenger satisfaction such as flight timeliness,
information convenience, efficient security and check-in procedures, signage and orientation, and terminal
amenities (Chen and Chang, 2005; De Barros Somasundaraswaran, and Wirasinghe, 2007; Fodness and Murray,
2007). However, the influence of these factors on overall passenger satisfaction is still not sufficiently focused on by
researchers.
Two key areas of airport customer satisfaction have gained significance in academic literature. First is airport
benchmarking and these practices are key for improving performance. Airports are required to identify the
organizational practices that might be related to the superior performance (Adler and Liebert, 2013), airport-
related literature mostly adopt an efficiency-based perspective for benchmarking. Airport service quality is the
second more frequent topic. In this area some approaches and methods usually applied within other industries
such as hospitality and tourism are adapted to air transport. There is an increasing interest in a broader
understanding of the multi-dimensional nature of airport service quality, particularly from a passenger perspective
(Bezerra and Gomes, 2015; Fodness and Murray, 2007).
Some international agencies have been systematically undertaking surveys, among them Airports Council
International (ACI) and the International Air Travel Association (IATA). These are usually published in international
journals and are mainly used as benchmarking reports that compare airports on the basis of region, passenger
numbers and other matrices into international league tables. Such reports are sometimes supported or
interchanged with ad hoc initiatives conducted by other survey organizations and airports (Zidarova and Zografos,
2011).This study attempts to derive a deeper understanding of the level of satisfaction experienced by the

137
departing passenger using the major air transport hub in Africa. The research question is ‘what does the customer
satisfaction in airports depend on?’
Trends in the industry
Since the late 1970s, with the deregulation of air transport, the United States of America (USA) was the first to
experience competition among airlines. There were similar changes followed by other countries, with the emphasis
being on fostering competition among airlines. More recently, the organization and delivering of infrastructure
services such as airports themselves have been driven by competition (Gillen, 2011). In this scenario, airports now
compete in two contexts. First as long haul connecting hubs, and second as multi-airport systems bidding for
airlines to provide service and to base aircrafts at the airport (Assaf et al., 2014). Airports have been facing
increased pressure for higher quality and efficiency because of competition between themselves and demands from
increasingly sophisticated customers.
During the intervening decades international air travel has changed due to a variety of factors. The increasing
demand for the service, deregulation in the industry, security challenges and the change in airport ownership and
governance forms have all contributed. New airline business models have influenced the change in airport
ownership and governance forms (Graham, 2011). Different types of privatization have been implemented
worldwide (Gillen and Mantin, 2014; Oum, Yan and Yu, 2008). That has meant that the airports have become
modern organizations delivering efficient and high quality services to different customers.
From about 1990 to 2014, the number of passengers using air travel improved by 214 percent (World Bank, 2015).
The demand for air travel is expected to growth at a 4.1 percent average annual rate, reaching 7.3 billion
passengers per year by 2034. This is more than twice the 3.3 billion passengers in 2014 (IATA, 2015). Airports are
infrastructure-intensive, and they require a high amount of investments if they are to make stepwise changes in
their size and capacity. As such, a non-effective response to the increasing traffic demand may lead to significant
events of congestion or even to capacity crunches. On the other hand, improving capacity in anticipation of
passenger traffic may be inefficient. All the while, airport operators are expected to efficiently accomplish
investment programs, optimize the available resources and review operating processes with a view to remaining
competitive (Adler and Liebert, 2014).
Industry researchers regularly measure passenger perceptions of airport services quality to benchmark performance
metrics directly from the voice of the customer (Chen, 2002), to identify opportunities for service improvement
(Yeh and Kuo, 2002) and to avoid losing valuable passenger traffic (Rhoades, Waguespack and Young, 2000).
Research on the air traveller has predominantly focussed on the air travellers experience as related to airline service
provision (Fodness and Murray, 2007). Some key examples of these professional studies are the ACI airport service
quality survey and the IATA SKYTRAX world airport and airline ratings.
Much of the professional research conducted in regards to airports has been focussed on efficiency, productivity
and benchmarking of the speed of processing (Gillen, 2011, Graham, 2011). All these are then related to
international league tables of performance (Losekoot, 2015). These studies largely ignore the other users of an
airport including air operators, government agencies, ground handling agents, airport based staff or local business
employees who use the airport’s retail restaurants, meeting and other facilities. The air traveller’s experience
138
remains the focal point for both airlines and airports in determining the level of customer satisfaction in their
service provision. For both airlines and airports, the outcomes service level and satisfaction performance are
generally the same; that is increased business and profit opportunities.
Following the September 11, 2001, attacks in New York there was a decline in the global air traffic. However,
Africa is expected to witness continued traffic growth for the foreseeable future (ICAO, 2002). There are a number
of reasons for this. First, Africa is the second largest continent in the world with a large population base that is
separated by geographically challenging terrain. Because of the poor state of land transport and the enormous cost
of addressing these deficiencies (Abrahams, 2002. p. 3), aviation is seen as a particularly ideal means of connecting
Africa with itself and the rest of the world (Irandu and Rhoades, 2006).
Second, relatively few Africans currently have access to air travel. The barriers to utilisation include poverty, lack of
aviation infrastructure, maintenance and financial support, safety and security concerns, and competition from
non-African airlines (Abrahams, 2002; Graham, 1995; World Bank Group, 2002). The expected opportunities for
growth in the demand for air transport in Africa is another key reason why a major airport hub in Africa is of
interest.
Air Transport in Kenya
The general traffic forecasts for air travel in Africa suggest that three major hubs in Sub-Saharan Africa would be
ideal for serving both international and regional needs. These hubs would be located in Southern, Eastern, and
Western Africa. Johannesburg in South Africa is the candidate for Southern Africa. The situation in Western and
Eastern Africa is less clear (Abrahams, 2002). This study aims to make the issue clearer.
Kenya has been a bright spot for air transport in Africa. Her tourism arrivals in 1995 were 918,000, in 2007 they
were 1,686,000, and in 2014 they were 1,148,000 (World Tourism Organisation, 2016). Kenya’s development
agenda as outlined in Vision 2030 aims at putting the economy on a high growth path, to ensure that double digit
economic growth is achieved, by the end of the plan period (Kenya Vision 2030). The major north-south and east-
west air routes pass over the country and Kenya possesses international airports used for technical and refuelling
stops. This geographical advantage could help facilitate the development of one of Kenya’s airports as a regional
hub and major player in transport development in the continent.
According to the Kenya Airports Authority (KAA) the four international airports in Kenya are Jomo Kenyatta
International Airport (JKIA), Mombasa International Airport (MIA), Kisumu International Airport (KIA) and Eldoret
International Airport (EIA) (KAA, 2017). Kenya’s two main international airports are MIA and JKIA. MIA handled a
total of 1,367,000 passengers and 4,545 metric tonnes of cargo in 2014. The largest airport, JKIA was used by
6,387,000 passengers and handled 258,627 tonnes of cargo in 2014 (Kenya National Bureau of Statistics, - KNBS,
2015).
Air transport has gained popularity among the Kenyan citizens and is no longer considered as a reserve for rich
foreigners and senior government officials (Irandu and Rhoades, 2006 pp. 54). The forecast for the growth of
aviation in Kenya’s Vision 2030, and the desire for the country to be the Eastern aviation hub in Africa is critical. In
addition, Kenya’s efforts to have direct flights to the United States of America looks promising. The national carrier

139
expects to commence these flights in June 2018 (Business Daily May 8, 2017). The table below provides a summary
of the arrivals in Kenya based on the mode of arrival.
Table 1: Kenya Arrivals by Mode of Transport
Kenya Arrivals by Mode of Transport ('000)
Year 2011 2012 2013 2014 2015
Air 1,301 1,292 1,133 888 771
Water 35 6 6 23 7
Road 487 413 381 439 403
Total 1,823 1,711 1,520 1,350 1,181
Source: World Tourism Organisation (2016)
The table above shows the total number of arrivals into Kenya from 2011 to 2015. Air travel is predominantly the
largest mode of travel for people wishing to visit the country. Thompson and Clements (2003), opine that airport
gateways have significant economic, political and social impacts in the environment in which they are located. The
airport is therefore a crucial economic, social and cultural gateway to a country. An investigation into passenger
satisfaction at airports is warranted because JKIA is the largest port for air travellers to enter, transfer through and
exit Kenya. In addition the country’s national carrier Kenya Airways uses JKIA as a hub for their global operations.
This study will focus on the air traveller’s experience at JKIA which is the major airport hub in East Africa.
Theoretical Foundations of the Study
Customer Satisfaction
Customer satisfaction is a psychological concept that involves the feeling of well-being and pleasure that results
from obtaining what one hopes for and expects from an appealing product and/or service (World Tourism
Organization, 1985). Satisfaction is a summary psychological state experienced by the consumer when confirmed
or disconfirmed expectations exist with respect to a specific service, transaction or experience. Customer
satisfaction is customers’ judgment that the consumption of a product or service is providing a pleasurable level of
fulfilment of the customers’ needs, desires and goals (Oliver, 1999).
Extant airport customer service studies have discovered a variety of items that have a bearing on the traveller’s level
of satisfaction with the airport’s service offerings. These elements are ambient conditions, cleanliness, availability of
food and beverage offerings, interior and exterior design or décor, spatial layout, functionality, physical facilities
and employee involvement (Rowley and Slack, 1999; Jeon and Kim 2012; Fodness and Murray 2007; Rhoades,
2000; De Barros, 2007; Tsai et al., 2011; Vanja et al. 2013, Chen and Chiang, 2012). These items are directly
related to the typologies of Bitner (1992).
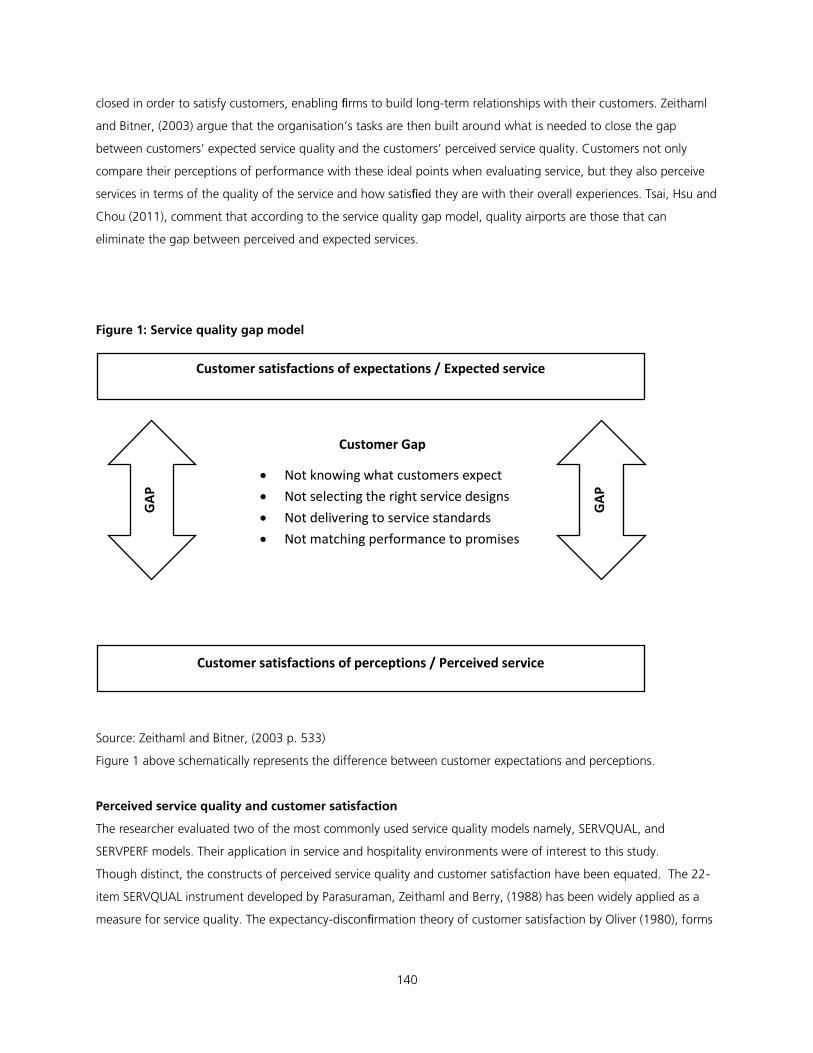
Parasuraman, Zeithaml and Berry, (1985); Parasuraman, Berry, and Zeithaml, (1988, 1991), developed the service
quality gap model. The main focus of the service quality gap model is the customer gap. This gap needs to be
140
closed in order to satisfy customers, enabling firms to build long-term relationships with their customers. Zeithaml
and Bitner, (2003) argue that the organisation’s tasks are then built around what is needed to close the gap
between customers’ expected service quality and the customers’ perceived service quality. Customers not only
compare their perceptions of performance with these ideal points when evaluating service, but they also perceive
services in terms of the quality of the service and how satisfied they are with their overall experiences. Tsai, Hsu and
Chou (2011), comment that according to the service quality gap model, quality airports are those that can
eliminate the gap between perceived and expected services.
Figure 1: Service quality gap model
Source: Zeithaml and Bitner, (2003 p. 533)
Figure 1 above schematically represents the difference between customer expectations and perceptions.
Perceived service quality and customer satisfaction
The researcher evaluated two of the most commonly used service quality models namely, SERVQUAL, and
SERVPERF models. Their application in service and hospitality environments were of interest to this study.
Though distinct, the constructs of perceived service quality and customer satisfaction have been equated. The 22-
item SERVQUAL instrument developed by Parasuraman, Zeithaml and Berry, (1988) has been widely applied as a
measure for service quality. The expectancy-disconfirmation theory of customer satisfaction by Oliver (1980), forms
Customer satisfactions of expectations / Expected service
Customer satisfactions of perceptions / Perceived service
Customer Gap
Not knowing what customers expect
Not selecting the right service designs
Not delivering to service standards
Not matching performance to promises
GA
P
GA
P

141
the basis of the SERVQUAL model. In the model, service quality is defined as the gap between expectation and
perception and customer satisfaction is understood in terms of meeting or exceeding these expectations.
The SERVQUAL model measures the quality of service in five quality dimensions. Reliability which is the service
provider’s ability to consistently perform the promised services dependably and accurately; tangibility refers to the
appearance of physical facilities, equipment, communication materials, and personnel associated with the service
encounter; responsiveness which is the willingness to help customers and provide prompt service; empathy which is
the firm’s readiness to provide each customer with personal service; and assurance which refers to the knowledge
and courtesy of the employees and their ability to inspire trust and confidence to customers (Parasuraman, et. al.,
1985, 1988, 1991).
The SERVQUAL model has been criticised for its focus on expectation as a comparison standard. Expectations are
dynamic in nature and may be influenced by customer’s experiences and consumption situations. In addition the
applicability of the five dimensions to different service settings has been challenged (Teas, 1994).
Cronin and Taylor, (1992) developed the SERVPERF scale as an alternative to the SERVQUAL model and it measures
the performance of the service. It is argued that the scale provides a useful tool for measuring overall service
quality. Oliver, (1993) argues that perceived service quality is evaluated by the actual performance of the service in
terms of particular service attributes in the specific context. Whereas customer satisfaction is assessed by the
customers’ overall experience of the service. According to this view, service quality is only one aspect of customer
satisfaction. Rust and Oliver, (1994) argue that customer satisfaction depends on a variety of factors, including
perceived service quality, customers’ mood, emotions, social interactions, and other experience-specific subjective
factors.
Bitner, (1990); Bolton and Drew, (1991) have suggested that customer satisfaction is an antecedent of perceived
service quality. They argue that satisfaction mediates a set of logical explanations regarding the expectations of
service and customers’ evaluations of service. For example, an acceptable explanation for a delayed flight might
create satisfaction for passengers and not result in an evaluation of bad service quality for the airline.
Oliver, 1997; Cronin and Taylor, 1992; Parasuraman et al., 1988 have a contrasting approach to the view that
customer satisfaction is an antecedent of perceived service quality. They contend that the constructs are reciprocal.
Accordingly service quality is a cognitive assessment of services in each occurrence, whereas satisfaction is the
accumulated effect on the customers’ evaluation of the services. Carrillat, Jaramillo and Mulki, (2007), suggest that
both models are adequate and equally valid predictors of overall service quality.
Due to its wide usage and comparability, this study adopted the SERVQUAL methodology.
Customer Contact and Customer Satisfaction
The service quality for an airport is often expressed in terms of perceived level of service delivered to the airport
user (Francis, Humphreys and Fry, 2003). Customer perceptions of service are focused on evaluations of satisfaction
that reflect the customers’ perceptions of physical environment, interaction and outcome (Zeithaml and Bitner,
2003). Accordingly, passengers will judge airport services based on their perceptions of the technical outcome, the
process by which the outcome was delivered and the quality of the physical surroundings where the service was
delivered (Tsai, Hsu and Chou, 2011).

142
Lovelock (1994), proposes that contacts that connect with brands in terms of the nature of service actions can be
divided into two forms, tangible actions and intangible actions. Tangible actions are those in which customers must
physically become involved in the service system because they are an integral part of the process. Further, they
argue that services interact with the mind-set of the customers through intangible actions. Pine and Gilmore
(1998), proposed four levels of offerings in all brands in which the different stages create a different experience for
the customers. These include service, image, facility and atmosphere orientation
A service-oriented contact has been described as a service encounter that serves as a sign of quality and value to
customers (Hartline and Jones, 1996). Frost and Kumar (2000), see encounter performance as the job of managers
and support staff to support and help front-line staff in their mission to please the end user, the customer. Fortini-
Campbell (2003), views customer and employee interaction as very critical to the success of the service experience.
It can serve as a contact realm to establish the brand of a service.
An image-oriented contact refers to the images, including cognitive and affective images, that are the sum of the
benefits, ideas, and impressions that people have of a store, place or destination (Baloglu and Brinberg, 1997).
Since a customer’s image is derived from the brand associations held in their memory that form the basis of a
brand identity, the brand associations toward affective objects plays an important role in how a brand image is
conceptualised (Keller, 1993).
A facility-oriented contact concerns tangibles that are directly or peripherally parts of a service (Berry and Clark,
1986). This view suggests that a facility-oriented contact represents service in a tangible way by focusing on the
physical aspects of a service from which the customers will receive performance benefits. Mittal and Baker (2002)
suggest that it would benefit service providers to identify some physical entities that would most effectively
represent the desired value to customers, and to use those entities to give substance and meaning to their
customers.
An atmosphere-oriented contact represents service in a tangible way by focusing on the atmospheric aspects of a
service from which the customers will receive emotion benefits. Bitner (1992) viewed surroundings of the specific
environment as helping customers form their attitude and behaviour. It creates an emotional response, which in
turn elicits approach or avoidance behaviour.
It can be inferred that the four key contact elements are the beginning points or inputs to the customer satisfaction
related to the service or product. For this study five hypotheses have been developed.
Hypothesis 1: Service related contacts influence customer satisfaction in airports positively
Hypothesis 2: Image related contacts influence customer satisfaction in airports positively
Hypothesis 3: Facility related contacts influence customer satisfaction in airports positively
Hypothesis 4: Atmosphere related contacts influence customer satisfaction in airports positively
Hypothesis 5: African hospitality influences customer satisfaction in airports positively
Review of Empirical Studies
Rowley and Slack (1999) conducted an empirical study on the hospitality and retail amenities within airport
departure lounges. Their exploratory study found that spacious, light and clean lounges with branded retail stores
positively influenced the passenger experience. Their study considered the retail and hospitality amenities. The full
complement of airport services is not covered in their study. Rhoades et al., (2000) considered the development of
143
airport quality factors from the perspective of different stakeholders. Their study identified passenger service
related issues namely efficiency of boarding, staff courtesy, availability of aerobridges, airport ground access and
inter terminal transport. These findings are insightful; however, they obtained input from airport managers and did
not obtain any feedback from actual air travellers in the airport.
De Barros (2007) evaluated the passenger perception of quality at airports by examining service attributes. They
collected data from transit passengers through a questionnaire. Their study confirmed the significance of airport
staff courtesy during security screening. In addition they found that the retail area was an evaluation criterion for
passenger satisfaction. Their study was conducted in Sao Paulo airport and it is therefore difficult to generalise the
results to different cultural contexts. Fodness and Murray (2007) examined airport service quality among domestic
departing passengers in the USA who were frequent fliers. Their study confirmed the significance of passenger
service quality that includes functional, interaction and diversion. Their study was very insightful, however one
study is not sufficient to form a fully developed theory of airport service quality.
Tsai et al., (2011) developed a gap analysis model for improving airport service quality in Taiwan. Their study
confirmed that waiting time, staff courtesy, flight information services, directional line arrangement and airport
circulation planning were factors that influenced passenger satisfaction. Their study combined three analytical
models; the analytical hierarchical process, the importance performance analysis technique and the multi-criteria
optimisation and compromise method. Like previous studies the results are not generalizable broadly to other
countries, cultures and regions. Vanja et al., (2013) exploratory study focussed on identifying which air travel
factors are distractors and which factors are enhancers of passenger satisfaction. Their study was based on
Herzberg’s two factor motivation theory as relates to the attributes of airport service quality. Their study utilized
content analysis of traveller comments posted on the airport website. A data mining approach using a web based
search randomly selected consumer comments related to 33 popular travel destinations. Cleanliness and a pleasant
airport environment were noted as satisfiers. Security check, airport signs and dining offers were found to be
dissatisfiers. Their study did not focus on a particular type of airport by way of location, size and number of
passengers per year. Their analysis was based on word count and did not have a direct insight into the context and
content of the comments. In addition their data was retrieved from a single website; consequently the
generalizability of the findings is limited.
Jeon and Kim (2012) evaluated servicescape attributes in relation to passengers’ emotional states and behavioural
intentions. Qualitative data on ambience, aesthetic factors, safety and social factors in an airport was collected. The
findings indicate that airport functionality, aesthetics and safety elicit travellers positive emotions tightly connected
to their behavioural intentions. Ambient conditions were found to contribute to passengers’ negative emotions.
Further, social servicescape was found to have an impact. The study was conducted in an airport in Korea and
focussed only and the airport servicescape. Losekoot (2015) study of the customer experience of meeters and
greeters at the landside area of an airport in New Zealand demonstrated that the physical environment, processing,
people, placeness and personal travel philosophy were key contributors to the level of satisfaction with the airport
experience.

144
Methodology
The current study can be described as pioneering research conducted at an international airport in Kenya, and
therefore the study was exploratory in nature. A survey of departing passengers was conducted using a structured
questionnaire. The specific questionnaire was adopted from Fodness and Murray (2007) study of customer
satisfaction among domestic travellers. Their study used a purchased list of frequent fliers from domestic airlines in
North America. In addition the study integrated elements of the 22 item scale developed by Parasuraman et al.,
(1988). An18 item Likert scale with responses rated 1 for extremely poor and 5 was the rating for excellent.
The study collected and measured the following data. Section A collected data on passenger socio-economic
characteristics such as age, gender, income, and level of education. Other travel related data of interest included
nature of travel, be it business, work or tourism related. Section B examined the service expectations of the
traveller. Section C examined the actual passenger experience based on the items identified on section B.
A pilot of the study was conducted among 10 air travellers and 10 airport staff deployed in facilitation functions as
respondents. The responses were then incorporated and the necessary adjustments made to the final instrument.
Data Collection and Sampling
The study used non-probability sampling as this was the exploratory stage of a much larger research project; it was
therefore a pilot survey. The data obtained from the respondents provide an information rich case study in which
the author explores the research question to gain theoretical insights. In addition, due to the limited time and
financial resources this approach was deemed the most practical. Due to the variety and large population of
passengers at the airport, quota sampling is considered ideal. Barnett (1991) states that a quota sample is a type of
stratified sampling that allows for the selection of cases within a stratum in a non-random fashion. The data
collected from the respondents is combined to provide the full sample. The study used a quota sampling technique.
This method is not without bias and is susceptible to interviewers choosing only respondents who are willing to
answer questions. The study focused on the departing travellers’ destination region namely; East Africa, West
Africa, South Africa, North America, Asia, Europe, and the Middle East who board their aircraft at specific gates at
the airport terminal.
Statistical analysis
The data was analysed using the Statistical Package for the Social Sciences (SPSS) version 17. The software was
utilized as the primary data analysis tool. Two types of primary statistical analysis were conducted. The first one was
descriptive analysis and the second one is factor analysis. Finally the hypotheses were tested using the two factor t-
test. The t-test assesses whether the means of two groups are statistically different from each other. This analysis is
appropriate whenever the researcher wishes to compare the means of two groups.
Study Findings and Hypothesis Testing
The current study is described as exploratory research conducted at an international airport hub in Africa. A total of
290 questionnaires were issued. The data was collected over three busiest days at the airport. A total of 280

145
questionnaires were returned giving a response rate of 96.5 percent which is very good for a study of this kind. Of
those responses 204 were considered usable for the statistical analysis.
Descriptive Statistics
The study collected demographic information relating to the respondents’ nationality, sex, age, occupation, marital
status, number of flights taken, whether the traveller was accompanied, level of education and age at the time of
one’s first air travel. All these factors were considered important in evaluating the airport experience.
Regarding the gender of the travellers 63.2% were male and 36.8% were females, indicating a preponderance of
male travellers over females. 76.5% of travellers were aged between 16 and 44 years, with those above the age of
60 making up 7.5% of respondents. The occupational status reported indicates that 73.8% are in employment as
full time employees or in self-employment.
44.8% of respondents reported themselves as single and 52.2% as married. These two groups accounted for 97%
of the responses to the question. The number of flights per year reveals that 70.8% of respondents have had less
than five flights this year and the rest have had more than five. The level of education responses indicate that those
with education level higher than diploma are 75.4% of respondents. 24.6% of respondents had lower levels of
education. 50% of the respondents reported travelling alone and 12.3% were travelling with their spouses.
As regards the reason for travel it was observed that 32% of respondents were travelling for leisure and 24.6%
were travelling to visit friends and relatives. Also 41.4% of the respondents reported that their travel was related to
travel for business or conferences. Travel for study respondents were 12.3%. The age at the time one took their
first flight responses indicate that a cumulative total of 83.6% of respondents took their first flight between birth
and the age of 29. With 52.6% taking their first aircraft flight between the age of 16 and 29. This means that
those respondents have had some kind of airport experience in their lives.
Exploratory Factor Analysis
To evaluate the pattern of the correlations of the variables exploratory factor analysis was conducted using SPSS
version 17. The 18 elements related to the airport services were evaluated by the items in the questionnaire
provided to the respondents.
Service Expectations
Service orientation variables related to the airport providing services as expected, the dependability of airport staff,
and the delivery of services right the first time. The test showed a Cronbach’s alpha of 0.828. Image orientation
related to the airport’s use of modern equipment, visually appealing facilities, and the appearance of employees
the Cronbach’s alpha was 0.835 in this regard. Facility orientation variables measured the cleanliness of the
terminal building, the availability of air conditioning, Wi-Fi services, duty free shopping, and availability of car parks,
and the availability of children’s play areas. These variables showed a Cronbach’s alpha of 0.863. Atmosphere
related variables examined the feeling of being safe in the airport, ease of way finding, facilities for people with
reduced mobility and the availability of leisure rooms. These variables report a Cronbach’s alpha of 0.769.
In summary the service expectations variables had a Cronbach’s alpha of between 0.769 and 0.863 which is in the
same range as the findings of Fodness and Murray (2007).

146
Service Performance
The respondents were asked to evaluate the performance of the airport in relation to the actual experience. Service
orientation variables are the same as those related to service expectation. The test showed a Cronbach’s alpha of
0.850. Image orientation variables produced a Cronbach’s alpha was 0.788 in this regard. Facility orientation
variables showed a Cronbach’s alpha of 0.811. Atmosphere related variables report a Cronbach’s alpha of 0.769.
In summary the service performance variables had a Cronbach’s alpha of between 0.769 and 0.850 which is in the
same range as the findings of Fodness and Murray (2007). The internal reliability of the variables was thus
acceptable to allow for a test of the five hypotheses.
Hypothesis Testing
The five hypotheses were tested using the independent samples t-test. This test is conducted to assess whether the
means of two groups are statistically significant from one another. The variables to be tested are the service
performance against the respective service orientation. A confidence interval of 95% was used.
Hypothesis 1: Service related contacts influence customer satisfaction in airports positively
The computed p-value of Levene’s test is 0.518 which is greater than 0.05. Therefore the null hypothesis is
accepted. Which indicates that customer satisfaction is not significantly related to service related contact at the
airport.
Hypothesis 2: Image related contacts influence customer satisfaction in airports positively
The computed p-value of Levene’s test is 0.991 which is greater than 0.05. Therefore the null hypothesis is
accepted. This indicates that customer satisfaction is not significantly related to image related aspects of the
airport.
Hypothesis 3: Facility related contacts influence customer satisfaction in airports positively
The computed p-value of Levene’s test is 0.813 which is greater than 0.05. Therefore the null hypothesis is
accepted. Which indicates that customer satisfaction is not significantly related to the facilities offered at the
airport.
Hypothesis 4: Atmosphere related contacts influence customer satisfaction in airports positively
The computed p-value of Levene’s test is 0.032 which is less than 0.05. Therefore the null hypothesis is not
accepted. Which indicates that customer satisfaction is significantly related to atmosphere related aspects of the
airport.
Hypothesis 5: The African hospitality influences customer satisfaction in airports positively
The computed p-value of Levene’s test is 0.129 which is greater than 0.05. Therefore the null hypothesis is
accepted. Which means that customer satisfaction is not significantly related to service related contact at the
airport.
In summary the testing of the five hypotheses indicates that only atmosphere related aspects of the airport
experience have a significant influence on the respondents’ customer satisfaction. The elements of the airport
atmosphere that were tested in the study include the feeling of being safe in the airport, ease of way finding,
facilities for people with reduced mobility and the availability of leisure rooms.
147
These findings provide room for further observations. Travellers who use the airport often might have become
accustomed to the facility. In addition, the frequent travel advisories following terror attacks in Kenya have meant
that the safety of travellers is a key concern. Further, the travellers might also be aware that redesigning an airport
will take some time and are therefore more understanding of the infrastructure and nature of services they
encounter while at the airport.
Study Limitations
The study was cross sectional. Due to time, access and cost constraints the researcher opted to collect data on the
three busiest days of airport operations. Also it was noted that while the response rate was high, a significant
number of questionnaires were not fully completed. The data collection took place at the busiest times of the
airport’s operations with a large number of passengers in the boarding gate areas. Due to time and anxiety related
pressure, respondents quickly answered the questionnaire.
Another limitation was theoretical in nature. While the gap analysis model evaluates four elements namely ; not
knowing what customers expect, not selecting the right service designs, not delivering to service standards, not
matching performance to promises. This study primarily concerned itself with understanding what customers
expect.
Conclusions
The survey tool was found to be suitable for the evaluation of service quality at airports. The study has found that
the feeling of being safe in the airport, ease of way finding, the availability of facilities for people with reduced
mobility and the availability of leisure rooms are important for travellers using the Jomo Kenyatta International
Airport.
These findings differ from those of Fodness and Murray (2007, however in some elements such as way finding
agreed with the findings of Tsai et al., (2011), Vanja et al. (2013) . More specifically they closely resemble Jeon and
Kim (2012) in the findings that indicate that airport functionality, aesthetics and safety elicit travellers’ positive
experiences. In general the study confirms the assertions by Bitner (1992) who viewed surroundings of the specific
environment as influencers of how customers form their attitude and behaviour.
These findings have managerial, theoretical and policy implications. The managerial input is that the airport
operator should provide leisure facilities, facilities for people with reduced mobility and way-finding signs effectively
throughout the airport in order to ensure a better customer experience. This is what the travellers want. These
requirements may lead to the redesigning of the airport and possibly further disruptions to the passenger
experience as the works are executed. The theoretical implications of the study are that more research needs to be
conducted to fully understand and identify variables to be examined while applying the SERVQUAL model to
airport service quality studies. Finally the policy implications include focussing the government’s agenda in
supporting the airport to provide a more secure environment for travellers.
This study provides useful insights into the service attributes that air travellers want at Kenyan airports. It forms a
foundation for the development of a conceptual model for a more exhaustive study on the subject in other airports
in Kenya and beyond.
148
REFERENCES
Abrahams, T. (2002). Key challenges facing air transport in Africa. Paper presented at the 8th Aviation and Allied
Business Leadership Conference, Johannesburg, South Africa, 1-2 July.
Adler, N. and Liebert, V. (2014), Joint impact of competition, ownership form and economic
regulation on airport performance and pricing, Transportation Research Part A: Policy and
Practice, . 64, pp. 92-109.
Baloglu, S., and Brinberg, D. (1997). Affective images of tourism destinations. Journal o
Travel Research, 35, pp. 11–15.
Assaf, A.G., Gillen, D. and Tsionas, E.G. (2014), Understanding relative efficiency
among airports: a general dynamic model for distinguishing technical and allocative
efficiency, Transportation Research Part B: Methodological, 70, pp. 18-34.
Berry, L.L., and Clark, T. (1986).Four ways to make service more tangible. Business,
36, pp. 53-54.
Bezerra, G.C.L. and Gomes, C.F. (2015), The effects of service quality dimensions and passenger characteristics on
passenger’s overall satisfaction with an airport, Journal of Air Transport Management, 44-45, pp. 77-81.
Bitner, M.J. (1990), Evaluating service encounters: the effects of physical surroundings and employee responses,
Journal of Marketing, 54, pp. 69-82.
Bitner, M.J. (1992). Servicescapes: The impact of physical surroundings on customer
And employees. Journal of Marketing, 56, pp. 57–71.
Bolton, R.N. and Drew, J.H. (1991), A longitudinal analysis of the impact of service changes on customer attitudes,
Journal of Marketing, 55, pp. 1-9.
Business Daily May 8, 2017 Kenya Airways Targets June 2018 for Direct US Flights.
http://www.businessdailyafrica.com/news/Kenya-Airways-targets-June-2018-for-direct
US-flights/539546-3918008-7td9huz/index.html. Retrieved 12 June 2017
Carrillat F.A, Fernando J., Mulki, J.P., (2007), The validity of the SERVQUAL and SERVPERF scales A meta-analytic
view of 17 years of research across five continents, International Journal of Service Industry Management, 18, pp.
472 – 490
Chen, F.Y. and Chang, Y.H. (2005), ‘‘Examining airline service quality from a process
perspective’ ’Journal of Air Transport Management, 11, pp. 79-87.
Chen, H.L., (2002), Benchmarking and quality improvement: a quality benchmarking
deployment approach, International Journal of Quality and Reliability Management, .
19, pp. 757-73.
Cronin, J.J. Jr and Taylor, S. (1992), Measuring service quality: a re-examination and
extension, Journal of Marketing, 56, pp. 55-68.
De Barros, A.G., Somasundaraswaran, A.K. and Wirasinghe, S.C. (2007), Evaluation of
level of service for transfer passengers at airports, Journal of Air Transport Management,
13, pp. 293-298.

149
Fodness, D. and Murray, B. (2007), Passengers’ expectations of airport service quality,
Journal of Services Marketing, 21, pp. 492-506.
Fortini –Campbell, L. (2003). Integrated marketing and the consumer experience. In D.
Iacobucci and B. Calder (Eds.), Kellogg on integrated marketing (pp. 54–89). Hoboken,
NJ: John Wiley and Sons.
Francis, G., Humphreys, I. and Fry, J. (2002), The benchmarking of airport performance,
Journal of Air Transport Management, 8, pp. 239-247.
Frost, F.A., and Kumar, M. (2000). INTSERVQUAL: An internal adaptation of the GAP
model in a large service organisation. Journal of Services Marketing, 14(5), pp.358–377.
Gillen, D. (2011), The evolution of airport ownership and governance, Journal of Air
Transport Management, 17, pp. 3-13.
Gillen, D. and Mantin, B. (2014), The importance of concession revenues in the
privatization of airports, Transportation Research Part E: Logistics and Transportation
Review, 68, pp. 164-177.
Graham, A. (2011), The objectives and outcomes of airport privatisation, Research in
Transportation Business and Management, 1 No. 1, pp. 3-14.
Graham, B. (1995). Geography and air transport. John Wiley and Sons, New York.
Hartline, M.D., and Jones, K.C. (1996). Employee performance cues in a hotel service
environment: Influence on perceived service quality, value, and word– of–mouth
intentions. Journal of Business Research, 35, pp. 207–215.
IATA (2015), Passenger forecast – global report, Geneva, www.iata.org/
publications/Pages/20-passenger-forecast.aspx
ICAO, (2002, October 2). One year after 11 September events: ICAO forecast world air
passenger traffic will exceed 2000 in 2003.
Irandu, E. M., Rhoades, D.L., (2006) the development of Jomo Kenyatta International
Airport as a regional aviation hub. Journal of Air Transportation, 11, pp. 50 –64
Keller, K.N. (1993). Conceptualising, measuring, and managing customer–based brand
equity. Journal of Marketing, 57, pp. 1–22.
Kenya Airports Authority (2017).https://kaa.go.ke/corporate/about-us/our-mandate/
Kenya National Bureau of Statistics (2016), Kenya Statistical Abstract 2015 pp. 173-176
Kenya Vision 2030, http://www.vision2030.go.ke/vision-2030-publications
Losekoot, E. (2015) Factors influencing the airport customer experience: A case study of
Auckland International Airport’s customers. Auckland University of technology
Mittal, B., and Baker, J. (2002).Advertising strategies for hospitality services. Cornell
Hotel and Restaurant Administration Quarterly, 43, pp. 51–63.
Oliver, R.L. (1993), A conceptual model of service quality and service satisfaction:
compatible goals, different concepts, in Swartz, T.A., Bowen, D.E. and Brown, S.W.
(Eds), Advances in Services Marketing and Management: Research and Practice,

150
Greenwich, CT, pp. 65-85.
Oliver, Richard L. (1980), A Cognitive Model of the Antecedents and Consequences of
Satisfaction Decisions, Journal of Marketing Research, 17, pp. 460–69.
Oum, T.H., Yan, J. and Yu, C. (2008), Ownership forms matter for airport efficiency: a
stochastic frontier investigation of worldwide airports, Journal of Urban Economics,
64, pp. 422-435.
Parasuraman, A., Berry, L.L., and Zeithaml, V.A. (1991). Refinement and reassessment of
the SERVQUAL scale. Journal of Retailing, 67, pp. 420–450.
Parasuraman, A., Zeithaml, V.A., and Berry, L.L. (1985).A conceptual model of service
quality and its implications for future research. Journal of Retailing, 49, pp. 41–50.
Parasuraman, A., Zeithaml, V.A., and Berry, L.L. (1988). SERVQUAL: A multiple –item
scale for measuring consumer perceptions of service quality. Journal of Retailing,
64, pp. 12–40.
Pine, B.J., and Gilmore, J.H. (1998). Welcome to the experience economy. Harvard
Business Review, 76, pp. 97–105
Rhoades, D. L., Waguespack Jr, B., and Young, S. (2000). Developing a quality index for
US airports. Managing Service Quality: An International Journal, 10, pp. 257-262.
Rowley, J., and Slack, F. (1999). The retail experience in airport departure lounges:
reaching for timelessness and placelessness. International Marketing Review, 16, pp.
363 - 376.
Rust, R.T. and Oliver, R.L. (1994), Service Quality: New Directions in Theory and
Practice, Thousand Oaks, CA.
Teas, K.R., (1994), Expectations as a Comparison Standard in Measuring Service Quality:
Assessment of a Reassessment, Journal of Marketing, 58, pp. 132-139
Thompson, M., and Clements, A. (2003).Where New Zealand touches the world.
Auckland, NZ: Pearson.
Tsai, W., Hsu, W., Chou, W.C., (2011) a gap analysis model for improving airport service
quality. Total Quality Management, 22, pp. 1025-1040
Vanja B., Wan Y., Anil B., Milos B., (2013), Airport service quality drivers of passenger
satisfaction , Tourism Review, 68, pp. 3 – 18
World Bank (2015), Air transport, passengers carried : http://data.worldbank.org/
indicator/IS.AIR.PSGR
World Bank Group. (2002). Making Monterrey Work for Africa: New Study Highlights
Dwindling Aid Flows, Mounting Challenges. Press Release no. 2002/273/S.
World Tourism Organization (1985), Identification and Evaluation of Those Components
of Tourism Services Which Have a Bearing on Tourist Satisfaction and Which can be Regulated, and State Measures
to Ensure Adequate Quality of Tourism Services.

151
World Tourism Organization (2016), Compendium of Tourism Statistics dataset,
UNWTO, http://statistics.unwto.org/news/2016-02-22/methodological-notes
tourism-statistics-database-2016-edition.
Yeh, C. H., and Kuo, Y.L. (2002), Evaluating passenger services of Asia-Pacific
international airports, Transportation Research Part E, pp. 39-48.
Zeithaml, V.A., and Bitner, M.J. (2003).Service marketing: Integrating customer focus
across the firm 2nd
Boston, MA: Irwin McGraw-Hill.
Zidarova, E.D. and Zografos, K.G. (2011), Measuring quality of service in airport passenger terminals,
Transportation Research Record: Journal of the Transportation Research Board, .2214, pp.69-76.
152
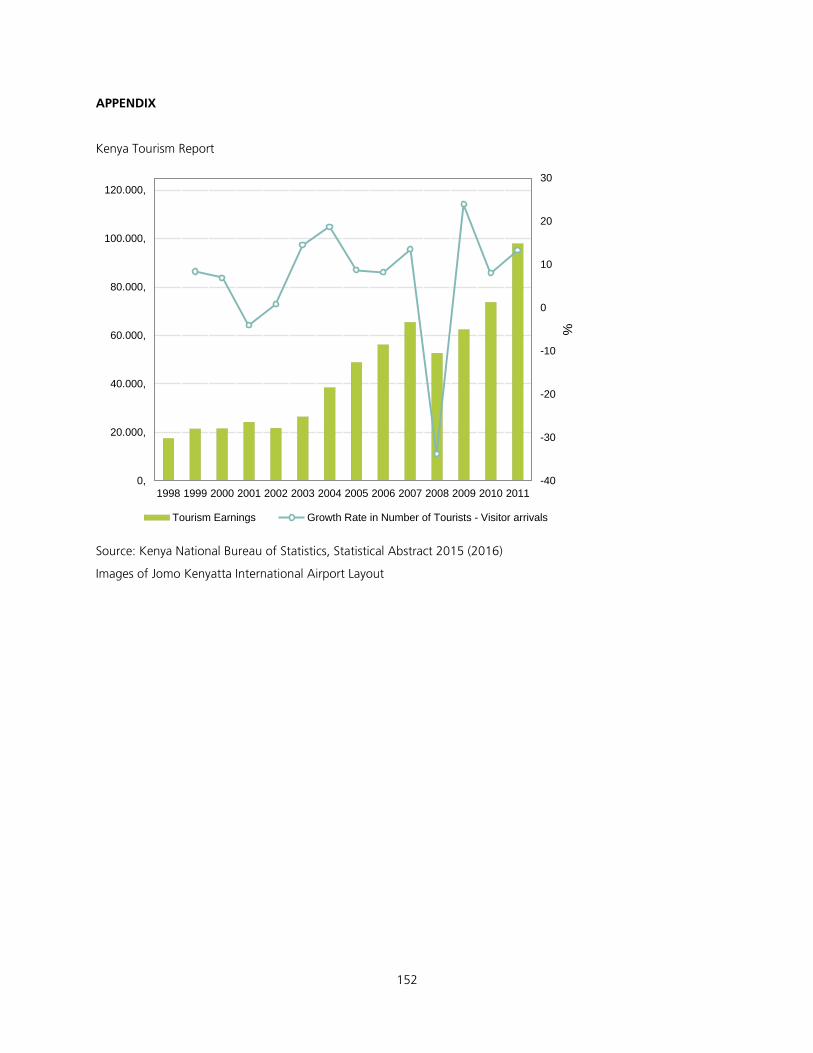
APPENDIX
Kenya Tourism Report
Source: Kenya National Bureau of Statistics, Statistical Abstract 2015 (2016)
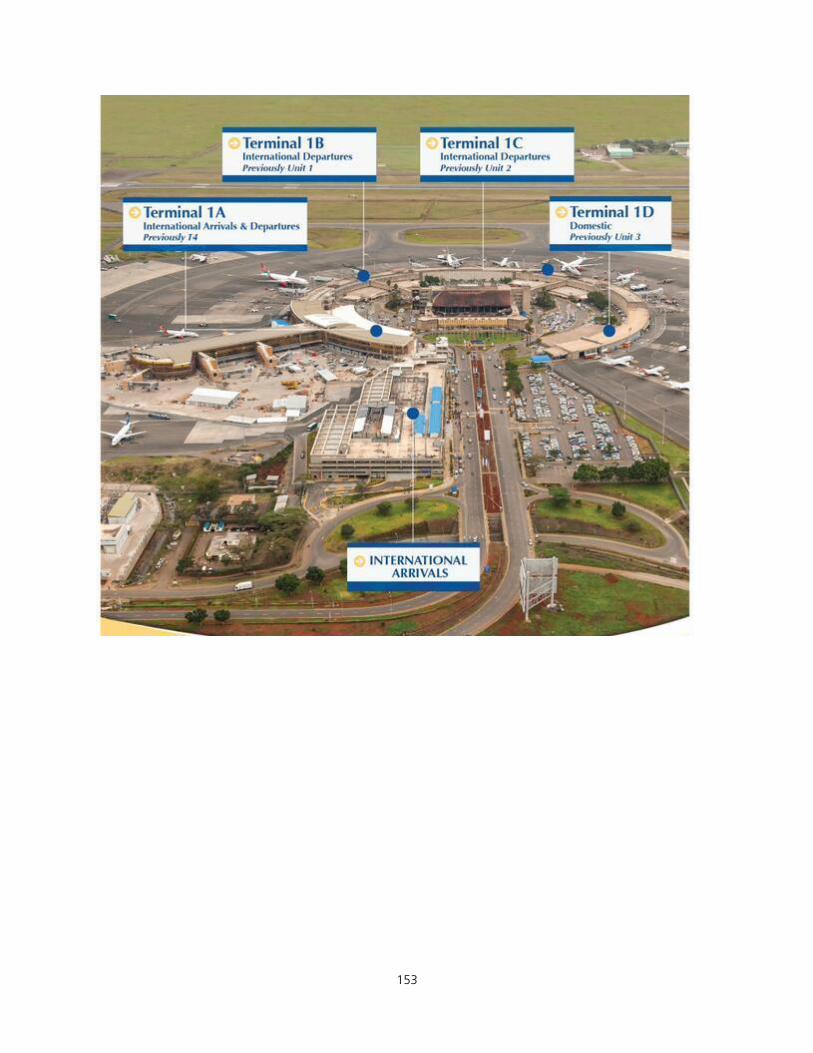
Images of Jomo Kenyatta International Airport Layout
-40
-30
-20
-10
0
10
20
30
0,
20.000,
40.000,
60.000,
80.000,
100.000,
120.000,
1998 1999 2000 2001 2002 2003 2004 2005 2006 2007 2008 2009 2010 2011
%
Tourism Earnings Growth Rate in Number of Tourists - Visitor arrivals
153