Embed Size (px)
Citation preview

Abstracts and Program
September 26 – 27, 2011 Discovery Park
Purdue University West Lafayette, Indiana

Isoscapes 2011
2
TABLE OF CONTENTS
Program ............................................................................................................................... 3
Oral and Working Sessions ................................................................................................. 5
Poster Session ...................................................................................................................... 8
Abstracts: Oral Sessions ..................................................................................................... 11
Abstracts: Poster Sessions ................................................................................................. 25
Sponsors ............................................................................................................................ 52

Isoscapes 2011
3
PROGRAM
Sunday, Sept. 25, 2011
6:00 – 8:00 pm Opening Reception, sponsored by the Purdue Climate Change Research Center Purdue Memorial Union Anniversary Drawing Room
Monday, Sept. 26, 2011
7:30 – 8:30 am Breakfast Burton Morgan Center for Entrepreneurship, Discovery Park
8:30 am – 12:00 pm Oral Sessions Burton Morgan Center for Entrepreneurship, Discovery Park
12:00 – 1:00 pm Lunch Burton Morgan Center for Entrepreneurship, Discovery Park
1:00 – 5:00 pm Working Sessions Burton Morgan Center for Entrepreneurship, Discovery Park
5:30 – 7:30 pm Poster Reception Mann Hall, Discovery Park

Isoscapes 2011
4
Tuesday, Sept. 27, 2011
7:30 – 8:30 am Breakfast Burton Morgan Center for Entrepreneurship, Discovery Park
8:30 am – 12:00 pm Oral Sessions Burton Morgan Center for Entrepreneurship, Discovery Park
12:00 – 1:00 pm Lunch Burton Morgan Center for Entrepreneurship, Discovery Park
1:00 – 5:00 pm Working Sessions Burton Morgan Center for Entrepreneurship, Discovery Park
6:00 – 8:30 pm Conference Banquet Sgt. Preston‟s, Lafayette

Isoscapes 2011
5
ORAL AND WORKING SESSIONS
Monday, Sept. 26, 2011
8:30 – 9:00 am Welcome and Introduction Gabe Bowen
9:00 – 10:00 am Keynote: Some Thoughts on Isoscapes Graham Farquhar
10:00 – 10:30 am Coffee Break
10:30 – 11:00 am Willamette Basin Surface Water Isoscape (δ18O and δ2H) for Interpreting Temporal Changes of Source Water within the River J. Renee Brooks
11:00 – 11:30 am Continental-scale Distributions of Plant Carbon Isotope Ratios Chris Still
11:30 am – 12:00 pm Isoscapes of Atmospheric Nitrate: What do they tell us? Greg Michalski
12:00 – 1:00 pm Lunch
1:00 – 3:00 pm Introduction to IsoMAP IsoMAP project team
3:00 – 3:30 pm Coffee Break
3:30 – 5:00 pm Breakout Session 1: Isoscapes Science
Isoscapes 2011
6
Tuesday, Sept. 27, 2011
8:30 – 9:00 am Reconstructing the Hydrologic Cycle Using Hydrogen Isotopes in Leaf-wax Molecules: Modern Calibration and an Isoscape Approach to the Miocene Water Cycle of California Pratigya Polissar
9:00 – 9:30 am Isotopic Analysis and Ancient Human Mobility: Recent Advances, Current Challenges, and Variability in the Nile Valley Michele Buzon
9:30 – 10:00 am Forensic Applications of Isoscapes Lesley Chesson and Brett Tipple
10:00 – 10:30 am Coffee Break
10:30 – 11:00 am Tracking Animal Movements with Isoscapes Keith Hobson
11:00 – 11:20 am Generating Precipitation Isoscapes for New Zealand: Comparison of Conventional vs Enhanced Climate Detail W. Troy Baisden
11:20 – 11:40 am Investigating the Source, Transport, and Fate of Ammonia Emissions Using Stable Isotopes J. David Felix
11:40 am – 12:00 pm Development of Next-generation, Off-axis ICOS Analyzers for Long Term Isotope Monitoring in the Field Manish Gupta
12:00 – 1:00 pm Lunch
1:00 – 1:30 pm CyberGIS for Empowering Geospatial Sciences Shaowen Wang

Isoscapes 2011
7
1:30 – 2:15 pm Introduction to Environmental Web-GIS Gabe Bowen, Jason West, Chris Miller
2:15 – 4:00 pm Breakout Session 2: Cyberinfrastructure for Isoscapes (Coffee Available)
4:00 – 5:00 pm Group Reports and Synthesis

Isoscapes 2011
8
POSTER SESSION
1
Stephen P. Good, Keir Soderberg, Lixin Wang, Kathleen Ryan and Kelly K. Caylor
Air Mass Trajectory Influence on East African Rainfall Isotopic Composition
2 R. J. Colón-Rivera, R. A. Feagin, J. B. West and K. M. Yeager
Hydrological Connectivity in Salt Marsh Ponds: Multiple Methods Including Gauges, Water Isotopes, and LIDAR Elevation Models
3 Joshua Blackstock and Travis Horton
Tracing Groundwater Recharge Source Areas Using Groundwater Isoscapes and Groundwater Level Mapping
4 Shuning Li, Naomi E. Levin and Lesley A. Chesson
Triple Oxygen Isotope Composition of Tap Waters from the Conterminous United States
5 Katherine M. Redling and Emily M. Elliott
Isoscapes of Dry Nitrogen Deposition Across Local and Rregional Scales
6 Adam G. West, Edmund C. February and Gabriel J. Bowen
South African Tap Water Isoscapes
7 Jason E. Laffoon and Menno L. P. Hoogland
A Bioavailable Strontium Isoscape: Caribbean region
8 Clement P. Bataille and Gabriel J. Bowen
Mapping 87Sr/86Sr Variations in Bedrock and Water for Regional Migration Studies
9
Robert Posey, Henriette Ueckerman, Khudooma Al Na'imi and Jurian Hoogewerff
Development of Spatial Prediction "Isoscape" Maps for the Determination of Provenance of Unidentified Human Remains: A new Probabilistic Approach
10 Steven L. Van Wilgenburg, Keith A. Hobson and Leonard I. Wassenaar
Refining Geographic Assignments of Animals to Isoscapes: Examples Using Informed Priors and Biological Constraints

Isoscapes 2011
9
11
Bobbie-Jo Webb-Robertson, Garret Hart, Helen Kreuzer, Jim Ehleringer and Jason West
Integration of C, N, O, H, and Sr Isotope Ratios for Geographic Sourcing of Castor Seeds
12
Anastasia Holobinko, Wolfram Meier-Augenstein, Helen F. Kemp, Tracy Prowse and Henry Schwarcz
2H Stable Isotope Analysis of Human Tooth Dentine: A Pilot Study
13
Peter E. Sauer, Hervé Bocherens, Darren R. Gröcke, Anne Bridault, Dorothée G. Drucker and Mietje Germonpré
Hydrogen Isotopic Variations in Mammalian Bone Collagen from Late Glacial- to Holocene Archeological Sites in Western Europe
14 Maura Pellegrini, Julia Lee-Thorp and Randolph Donahue
Investigating Faunal Transhumance in Late-Glacial Central Italy
15 Andrew J. Laughlin, D. Ryan Norris, David W. Winkler and Caz M. Taylor
Establishing the Migratory Connectivity of Tree Swallows Using a Stable Isotope Basemap
16 K. Rogers, L.I. Wassenaar, D.X. Soto and J.A. Bartle
A Feather-precipitation Hydrogen Isoscape for New Zealand
17 Kirsteen M. MacKenzie, Clive N. Trueman and Martin R. Palmer
Towards Dynamic Marine Isoscapes: A Case Study Using δ13C Values in Salmon
18
Kara R. Radabaugh, Sheri A. Huelster, David J. Hollander and Ernst B. Peebles
Application of δ13C and δ15N Isoscapes to Studies of Fish Site Fidelity and Basal Resource Variation on the West Florida Shelf
19 Norton Ribeiro de Freitas Jr., Andrea Lini and Marisa Domingos
Documenting and Understanding Ecological Changes Affecting the Sustainability of Forest Ecosystem Services in São Paulo, Brazil
20 Jorge del-Castillo, Juan Pedro Ferrio, Monica Aguilera and Jordi Voltas
Modeling the Spatial Variability of Δ13C in Tree-Rings Using Geographical Information Systems (GIS)

Isoscapes 2011
10
21 Breanna A. Skeets, Anya B. Byers and Holly R. Barnard
Transpiration Source Water and Geomorphological Potential of Root Growth in the Boulder Creek CZO, Colorado
22 Glendon B. Hunsinger and Libby A. Stern
Resolving N2 Interferences for δ18O Analysis of N-rich Organics by TC/EA
23 Robert J. Panetta, Riana Parvez, Danthu Vu and Aaron Van Pelt
Sapping Pines and Curdling Cheese: Induction Module CRDS analysis of matrix-bound waters
24
C.C. Miller, Lan Zhao, Ajay Kalangi, Hyojeong Lee, Gabriel J. Bowen, Jason West, Tonglin Zhang and Zhongfang Liu
The IsoMAP CI Stack: The Open Source, Grid-Enabled Technologies Behind the IsoMAP Project
25
Jason B. West, Shivani Mittal, Gabriel J. Bowen, Ajay Kalangi, Hyojeong Lee, Chris Miller, Tonglin Zhang and Lan Zhao
Web-based Leaf Water Isoscapes in IsoMAP Using Raster Modeling
26
Tonglin Zhang, Zhongfang Liu, Hyojeong Lee, Chris Miller, Jason West, Lan Zhao and Gabriel J. Bowen
The Statistical Method in the IsoMAP Precipitation Toolkit

Isoscapes 2011
11
ABSTRACTS: ORAL SESSIONS

Isoscapes 2011
12
SOME THOUGHTS ON ISOSCAPES
Graham Farquhar1, John Lloyd1,2, and Lucas Cernusak1
1Research School of Biology, Australian National University. [email protected]
2presently at James Cook University and the University of Leeds.
We discuss a notable time series of isotope measurements, that of the „Dole Effect‟, the difference between the oxygen isotopic composition of gaseous atmospheric oxygen and that of mean ocean water. On the spatial front we briefly examine carbon isotope transects in Australian vegetation. And as a general point we discuss new corrections that need to be made in isotope measurements and modelling in the context of leaf gas exchange.

Isoscapes 2011
13
WILLAMETTE BASIN SURFACE WATER ISOSCAPE (18O AND 2H) FOR
INTERPRETING TEMPORAL CHANGES OF SOURCE WATER WITHIN THE
RIVER.
J. Renée Brooks1, Parker J. Wigington1, Randy Comeleo1, and Rob Coulombe2
1Western Ecology Division U.S. EPA/NHEERL Corvallis, OR 97333. [email protected]
2Dynamac Corporation, Corvallis, OR 97333.
Understanding how water sources for rivers are shifting spatially over time will greatly aid our ability to understand climate impacts on rivers. Because stable isotopes of precipitation vary geographically, variation in the stable isotopes of river water can
indicate source water dynamics. We monitored the stable isotopes (18O and 2H) of river and stream water within the southern Willamette Basin in Western Oregon over two years. Within this basin, eighty-four percent of the isotopic variation in stream water from the small catchments could be explained by the mean elevation of the catchment, while seasonal variation was minimal. However, water within the Willamette River showed distinct isotopic seasonal patterns. This seasonal variation likely comes from a change in source elevation for water in the river. Willamette River isotopic values were at their lowest during summer low flow and at their highest during Feb/March when snow was accumulating in the mountains. We estimated that the mean elevation of the Willamette River source water shifted over 500 m seasonally. During winter when rain occurs in the valley and snow is accumulating in the mountains, the river reflects a mixture of low mountains and valley bottom precipitation. During the dry Mediterranean summer, 60-80% of the river water comes from the snow zone above 1200 m, which is only 12% of the land area and accounts for 15.6 % of the annual precipitation within the Willamette Basin. Reliance on high-elevation water during summer low flow highlight the vulnerability of this system to influences of climate change, where snowpacks in the Cascade Mountains are predicted to decrease in the future.

Isoscapes 2011
14
CONTINENTAL-SCALE DISTRIBUTIONS OF PLANT CARBON ISOTOPE RATIOS
Christopher Still1, Rebecca Powell2, Stephanie Pau3, and Erika Edwards4
1Department of Geography, University of California, Santa Barbara. [email protected]
2Department of Geography, University of Denver 3National Center for Ecological Analysis and Synthesis (NCEAS), University of
California, Santa Barbara 4Department of Ecology and Evolutionary Biology, Brown University
The stable carbon isotope composition (denoted 13C) of terrestrial vegetation is important for a variety of scientific applications in fields ranging from biogeochemistry
to zoology to paleoclimatology. Plant 13C values result from biological and chemical fractionations during photosynthesis and subsequent metabolic and biosynthetic reactions. To a large degree in extra-boreal regions, landscape-to-regional-scale spatial
patterns in plant 13C and the 13C of biosphere-atmosphere CO2 exchanges are imparted by variations in the C3/C4 composition of vegetation. The C3/C4 vegetation composition is a function of natural ecological sorting along environmental and climate gradients, combined with cropping patterns and anthropogenic land cover changes.
We will present results from a project to predict the 13C of terrestrial vegetation using a combination of MODIS Vegetation Continuous Fields (VCF) satellite data, climate data, and crop type maps. Our approach relies on the strong ecological sorting of C3 and C4 grasses along temperature gradients, as well as the near-universal restriction of C4 photosynthesis to the herbaceous growth form. By combining these products, we can predict the C4 fraction of vegetation at continental to global scales, and also its contribution to productivity. We will present continental-scale mapping and modeling
of C3 and C4 biogeography and productivity in Africa and South America. The 13C of vegetation on these continents is estimated from their C3/C4 composition, assuming constant values of -27 ‰ and -12 ‰ for C3 and C4 organic matter, respectively. We will compare these distributions with previous land surface modeling results that include variable C3 fractionation. We will also discuss whether closely related C3 and C4 grass taxa (that differ primarily in photosynthetic pathway) occupy fundamentally different temperature niches (the assumption that underlies our large-scale C3 and C4 vegetation mapping).

Isoscapes 2011
15
Figure: The percentage of vegetation predicted to use the C4 photosynthetic pathway in South America.

Isoscapes 2011
16
ISOSCAPES OF ATMOSPHERIC NITRATE: WHAT DO THEY TELL US?
Greg Michlski, Krystin Riha, David Mase, Lindsey Crawley, Helen Waldschmidt, and Michelle Kolonowski
Department of Earth and Atmospheric Sciences, Purdue University, West Lafayette, IN. 47907. [email protected]
What drives the high degree of spatial and temporal variability in the amount and isotopic composition of atmospheric nitrate? Deposition of atmospheric nitrate can range from over 50 to less than 1 kg/ha yr and seasonally vary by an order of magnitude. These variations are largely a function of proximity to sources of nitrogen oxides (NOx) such as power plants, cities, and agricultural centers. Does the isotopic composition of nitrate primarily reflect these different sources or is it mainly controlled by the kinetic and equilibrium isotope effects that occur during NOx oxidation into nitrate? Several research groups are beginning to generate large US isoscapes of atmospheric nitrate. This has been facilitated by analytical breakthroughs that have allowed rapid, accurate isotopic analysis of trace amounts of nitrate. This has resulted in the ability to use archived samples from the National Atmospheric Deposition Program and US- EPA‟s aerosol monitoring program for analysis and multiple isoscapes are expected in the near future. What can the isotope data tell us about nitrogen cycling in the atmosphere? Interpreting spatial and temporal trends in atmospheric nitrate‟s isotopic composition requires incorporating isotopes into sophisticated computer models, which can work on
local, regional, and global scales. I will present some recent data on the 15N, 18O, and
17O composition of atmospheric nitrate obtained utilizing the NADP sample archive. New modeling approaches will be discussed including what roles aerosols, trace gas concentrations and atmospheric water play in the isotope composition of atmospheric nitrate. Current limitations and future directions will also be discussed.
Figure: Modeled 18O values of atmospheric nitrate for January 2002

Isoscapes 2011
17
RECONSTRUCTING THE HYDROLOGIC CYCLE USING HYDROGEN ISOTOPES
IN LEAF-WAX MOLECULES: MODERN CALIBRATION AND AN ISOSCAPE
APPROACH TO THE MIOCENE WATER CYCLE OF CALIFORNIA
Pratigya J. Polissar1*, Katherine H. Freeman2, Jonathan P. LaRiviere3, A. Christina Ravelo3 and Linda Heusser1
1Department of Biology and Paleo Environment, Lamont-Doherty Earth Observatory of Columbia University, Palisades, NY 10960, *[email protected]
2Department of Geosciences, The Pennsulvania State University, University Park, PA 16802.
3Department of Ocean Sciences, University of California, Santa Cruz, Santa Cruz, CA 95064.
The earth‟s water cycle leaves a distinct imprint on the hydrogen isotopic composition of precipitation, lake and ocean waters. Therefore, we can reconstruct the functioning of the water cycle in the past by measuring the hydrogen isotopic composition of these waters. These waters are also used by plants and algae as the primary hydrogen source for organic molecules such as lipids. Thus, the H isotopic composition of lipids preserved in sediments can provide a unique record of the hydrologic cycle.
Modern calibration studies document several physiologic and environmental factors which set the hydrogen isotopic composition of lipids such as plant waxes. The type of vegetation appears to control the fundamental offset between lipids and growth water
while aridity increases the isotopic enrichment of lipid D. Using this interpretive framework we can reconstruct past changes in the water cycle using sedimentary
archives of lipid D.
Combining lipid D and an Isoscapes approach, we are investigating the late Miocene-present evolution of the western U.S. water cycle. Previous studies in western North America describe a gradual transition out of the wet/warm state of the middle Miocene to generally drier conditions by the Pleistocene. However the absolute timing of aridification, the rate of climatic change, the spatial extent, and the amount of precipitation change are not well constrained. Our preliminary results along a 14° latitudinal gradient suggest a transition from year-round precipitation during the late Miocene to an increasingly mediterranean climate (wet winters and dry summers) in the late Pleistocene. These changes are consistent with GCM models that predict aridification of the southwestern N. America in response to strengthened meridional sea surface temperature gradients in the Pacific.

Isoscapes 2011
18
ISOTOPIC ANALYSIS AND ANCIENT HUMAN MOBILITY: RECENT ADVANCES,
CURRENT CHALLENGES, AND VARIABILITY IN THE NILE VALLEY
Michele R. Buzon1, Antonio Simonetti2, and Gabriel J. Bowen3
1Department of Anthropology, Purdue University, West Lafayette, IN 47907. [email protected]
2Department of Civil Engineering and Geological Sciences, University of Notre Dame, Notre Dame, IN 46556.
3Department of Earth and Atmospheric Sciences and Purdue Climate Change Research Center, Purdue University, West Lafayette, IN 47907.
In the last few decades, we have witnessed the advancement of various techniques to investigate ancient human mobility using stable and radiogenic isotope analysis. Now commonplace in many archaeological research projects, the multitude of recent studies have generated a substantial database of environmental and human samples that can be used to trace the movement of humans in the past. Investigations using δ18O, and 87Sr/86Sr, as well as dietary isotopes δ13C and δ15N, and more recently several Pb isotopes have succeeded in addressing many important archaeological questions regarding such topics as ancient empire dynamics, including colonialism and imperial displacements, especially in South America and Europe. Due to the complex nature of these techniques, it is becoming clear that the most useful research incorporates isotopic analysis of multiple elements. Additionally, improvements in methods, such as laser ablation multi-collector inductively coupled plasma mass spectrometry (LA-MC-ICP-MS), are allowing for very minimally destructive sampling and time resolution during tooth crown development. Despite the progress, challenges still remain, especially with regard to diagenesis of archaeological human tissues and our ability to establish the biogeochemically available local isotopic signatures.
Our collaborative research has focused on establishing baseline data for δ13C, δ18O, and 87Sr/86Sr in the Nile Valley of Africa with the goal of investigating human mobility and contact in ancient Egyptian and Nubian populations. Additionally, the isotopic variability in the region is being used to understand population dynamics at Tombos, an archaeological site in ancient Nubia with evidence for Egyptian cultural interaction during the New Kingdom Empire and its aftermath. Our analyses of various sites in the Nile Valley suggest for both δ13C and δ18O that human samples from ancient Nubian locations appear to be more variable than Egyptian sites. Factors affecting these values likely include hydrological differences including the contribution of aquifers to river water, variation in availability and quality of agricultural land, irrigation practices over time, and food preparation (such as beer making). Emerging patterns for recent 87Sr/86Sr data in the region indicate some discernable differences between Egyptian samples, which are more radiogenic, with Lower Nubian and Upper Nubian samples. These datasets have assisted in building our development of the models that we can use to track ancient human mobility in this region.

Isoscapes 2011
19
FORENSIC APPLICATIONS OF ISOSCAPES
James Ehleringer1,2, Lesley Chesson1,2*, Luciano Valenzuela1,2, Brett Tipple1,2, and others†
1IsoForensics, Inc., Salt Lake City, UT 84108. [email protected] 2Department of Biology, University of Utah, Salt Lake City, UT 84112
The stable isotope abundances of biological tissues often contain information that is of forensic interest. Among those elements of interest are hydrogen, carbon, nitrogen, oxygen, sulfur, lead, neodymium, and strontium. The stable isotope abundances of organic and geologic particulates attached to a piece of evidence may also be of forensic interest. What is particularly useful is combining two different approaches to create forensic isoscapes: (a) an understanding the fundamental biochemical processes that result in isotopic signals in molecules and (b) isotopic variations based on spatial variations in climate, water, and soil across discrete regions. With these isoscape models, we can address two fundamental questions in forensic investigations: “Is the evidence consistent with a known location?” and “What are the possible locations from which a piece of evidence could or could not have come from?”
We will explore the application of isoscapes in forensics through three distinct investigations: (a) H, C, N, and O isotopes and the origins of anthrax used in the 2001 Amerithrax Attack, (b) O isotopes and the origins of unidentified murder victim found in Massachusetts and Nevada, and (c) O and Sr isotopes and the origins of a man and woman found buried together at a gravesite.
Regions consistent with the origins of an unidentified murder victim found in a Massachusetts park (left) found along a highway in Nevada (right).
†Many colleagues have contributed to forensic isoscape efforts over the last decade including J. Barnette, G. Bowen, T. Cerling, J. Howa, J. Hurley, H. Kreuzer. M. Lott, S. O‟Grady, D. Podlesak, A. Thompson, A. West, and J. West.

Isoscapes 2011
20
TRACKING ANIMAL MOVEMENTS WITH ISOSCAPES
Keith A. Hobson
Environment Canada, Saskatoon, SK, Canada. [email protected]
A fundamental challenge in understanding the ecology and conservation of migratory animals is a reasonable knowledge of where they spend various components of their annual cycle. Such information on origins of individuals or populations is also becoming critical in the assessment of how wildlife may be involved in disease transmission and the potential movement of contaminants among biomes. For most organisms, the only feasible means of inferring origins is through the forensic use of isoscapes and the measurement of isotopic concentrations in tissues of individuals that move among isotopically discrete regions. This process involves a knowledge of isoscape pattern but also the ways in which isotopic composition changes between geological and biotic substrates and the recording tissue in the organism of interest. The additional challenge is the best use of statistical inference given substantive sources of variance. This paper will provide examples of how we have considered these factors in the assignment of migratory birds and other organisms to isoscapes at continental and regional scales. Emphasis will be placed on where we are currently and where we need to go in order to refine models of migratory connectivity using isoscapes.
The figure below summarizes the relationship we have found between feather δD and mean growing-season average precipitation δD for non-raptor birds in North America.
Isoscapes 2011
21
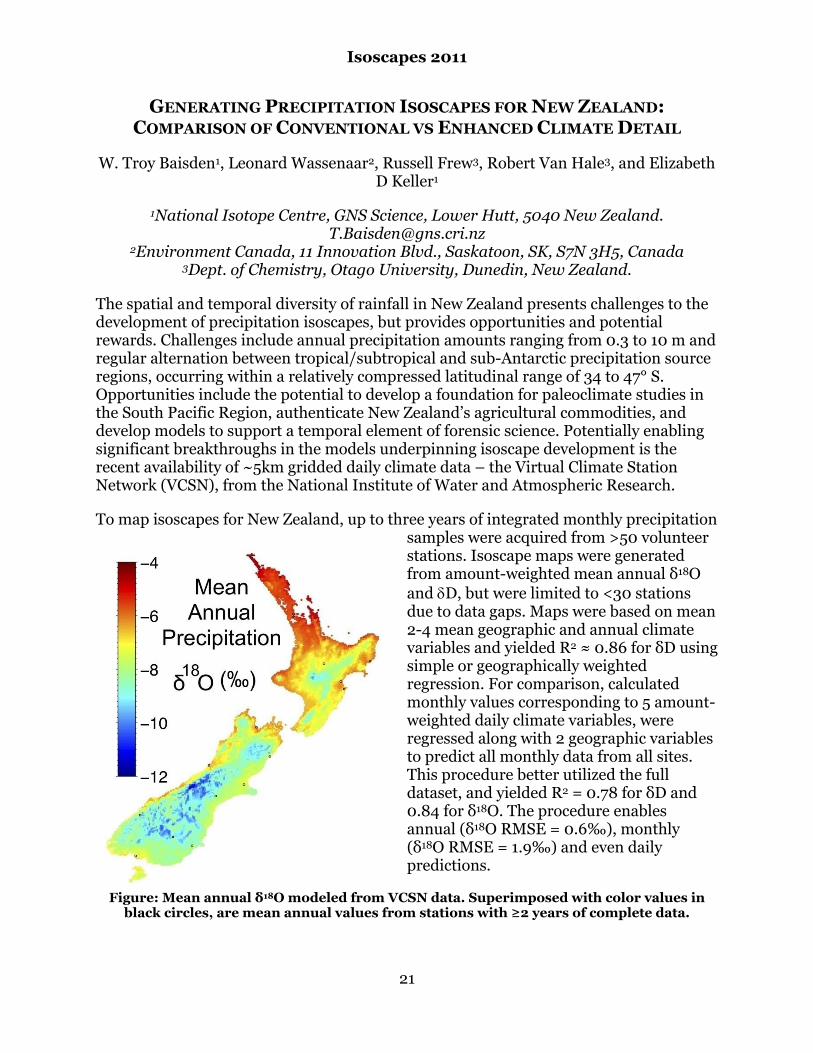
GENERATING PRECIPITATION ISOSCAPES FOR NEW ZEALAND:
COMPARISON OF CONVENTIONAL VS ENHANCED CLIMATE DETAIL
W. Troy Baisden1, Leonard Wassenaar2, Russell Frew3, Robert Van Hale3, and Elizabeth D Keller1
1National Isotope Centre, GNS Science, Lower Hutt, 5040 New Zealand. [email protected]
2Environment Canada, 11 Innovation Blvd., Saskatoon, SK, S7N 3H5, Canada 3Dept. of Chemistry, Otago University, Dunedin, New Zealand.
The spatial and temporal diversity of rainfall in New Zealand presents challenges to the development of precipitation isoscapes, but provides opportunities and potential rewards. Challenges include annual precipitation amounts ranging from 0.3 to 10 m and regular alternation between tropical/subtropical and sub-Antarctic precipitation source regions, occurring within a relatively compressed latitudinal range of 34 to 47° S. Opportunities include the potential to develop a foundation for paleoclimate studies in the South Pacific Region, authenticate New Zealand‟s agricultural commodities, and develop models to support a temporal element of forensic science. Potentially enabling significant breakthroughs in the models underpinning isoscape development is the recent availability of ~5km gridded daily climate data – the Virtual Climate Station Network (VCSN), from the National Institute of Water and Atmospheric Research.
To map isoscapes for New Zealand, up to three years of integrated monthly precipitation samples were acquired from >50 volunteer stations. Isoscape maps were generated from amount-weighted mean annual δ18O
and D, but were limited to <30 stations due to data gaps. Maps were based on mean 2-4 mean geographic and annual climate variables and yielded R2 ≈ 0.86 for δD using simple or geographically weighted regression. For comparison, calculated monthly values corresponding to 5 amount-weighted daily climate variables, were regressed along with 2 geographic variables to predict all monthly data from all sites. This procedure better utilized the full dataset, and yielded R2 = 0.78 for δD and 0.84 for δ18O. The procedure enables annual (δ18O RMSE = 0.6‰), monthly (δ18O RMSE = 1.9‰) and even daily predictions.
Figure: Mean annual δ18O modeled from VCSN data. Superimposed with color values in black circles, are mean annual values from stations with ≥2 years of complete data.

Isoscapes 2011
22
INVESTIGATING THE SOURCE, TRANSPORT, AND FATE OF AMMONIA
EMISSIONS USING STABLE ISOTOPES
J. David Felix and Emily M. Elliott
University of Pittsburgh, Pittsburgh, PA, [email protected]
While the Clean Air Act and associated amendments have effectively reduced nitrate loading in precipitation across the Eastern U.S., ammonium ion (NH4
+) concentrations in wet deposition have increased during the last two decades, particularly in the mid-Western U.S. As a source of reactive nitrogen, ammonia (NH3) and NH4
+ deposition contributes to air and water quality degradation. NH3 emissions are dominated by agricultural activities, particularly livestock operations and fertilizer applications, but fossil-fuel combustion can be a significant NH3 emission source in urban areas. NH3 emissions can be deposited locally but conversion to NH4
+ increases atmospheric lifetime and allows for transport across regions. In order to effectively mitigate recent increases in NH4
+ deposition, it is critical to improve our understanding of how individual NH3 sources vary across spatial scales.
The stable isotopic composition of NH3 may be a valuable tool for characterizing the sources, transport, and fate of NH3 emissions. This work developed a comprehensive inventory of the isotopic composition of NH3 from agricultural and fossil fuel sources. This source inventory was then utilized to trace NH3 emissions across various landscapes including: a dairy operation, a conventionally managed cornfield, a tallgrass prairie, and a concentrated animal feeding operation. To assess efficacy of δ15N-NH3 as a tracer across larger regions, NH3 passive samplers were deployed monthly for one year at nine sites across the U.S. in conjunction with the AMoN monitoring initiative sponsored by the NADP and CASTNET programs. Preliminary isotope data at each site shows spatial variability due to predominant NH3 sources. This work was made possible by the development of a new preparation method for the isotopic analysis of low NH3 concentration samples. Further, we tested the validity of using NH3 passive samplers as a collection medium for isotopic analysis using closed chamber laboratory experiments to study the effects of temperature, saturation, and co-existing N compounds on isotopic composition. This work provides proof of concept that stable isotopic composition of reactive N emissions can aid in tracing reactive N emissions across landscapes and
regions.
Figure: January 2010 δ15NH3 values for 7 AMoN sites.
Preliminary data shows more negative δ15NH3 values
associated with agricultural operations and less δ15NH3
negative values associated with fossil fuel combustion.

Isoscapes 2011
23
DEVELOPMENT OF NEXT-GENERATION, OFF-AXIS ICOS ANALYZERS FOR
LONG TERM ISOTOPE MONITORING IN THE FIELD
Elena Berman, Feng Dong, Douglas Baer, and Manish Gupta*
Los Gatos Research, 67 East Evelyn Avenue, Suite 3, Mountain View, CA 94041.
The generation of isoscapes requires large volumes of accurate, spatially-specific, and temporally-resolved isotope data. We will discuss the development of next-generation, Off-Axis ICOS analyzers for long term isotope monitoring in the field. Technological advancements include improving thermal stability, implementing autonomous calibration, and extending the technology to address additional species. With these advancements, Off-Axis ICOS analyzers can now provide long-term (~ 1 year),
unattended measurements of stable isotopes in H2O (18O and 2H), CO2 (13C), CH4
(13C), and N2O (15N) on monitoring stations or mobile platforms. Isotope data will be presented for a variety of field deployments, including the monitoring of precipitation, groundwater, water vapor, and carbon sequestration leakage.

Isoscapes 2011
24
CYBERGIS FOR EMPOWERING GEOSPATIAL SCIENCES
Shaowen Wang1
1Department of Geography and National Center for Supercomputing Applications (NCSA), University of Illinois at Urbana-Champaign. [email protected]
Cyberinfrastructure represents integrated computation, communication, and information technologies for high-performance and distributed information processing, and coordinated knowledge discovery. The purpose of this presentation is to describe a CyberGIS framework for the synthesis of cyberinfrastructure, Geographic Information Systems (GIS), and spatial analysis (broadly including spatial modeling). This framework focuses on enabling computationally intensive and collaborative geospatial sciences. The presentation underpins new trends in the development and use of CyberGIS while illustrating particular CyberGIS components. Geospatial middleware glues CyberGIS components and corresponding services while managing the complexity of accessing cyberinfrastructure. Geospatial middleware, tailored to GIS and spatial analysis, is developed to capture important spatial characteristics of geospatial scientific problems through spatially explicit representations of compute, data, and communication intensity (collectively termed as computational intensity), which enables GIS and spatial analysis to locate, allocate, and use cyberinfrastructure resources effectively and efficiently. The GISolve Toolkit has been developed as geospatial middleware to systematically integrate cyberinfrastructure and GIS capabilities, including high performance and distributed computing, data management and visualization, and virtual organization support. Currently, GISolve is deployed on the National Science Foundation XSEDE and the Open Science Grid – two key elements of the U.S. and worldwide cyberinfrastructure. Multiple case studies are demonstrated with a particular focus placed on assessing the computational performance of GISolve on resolving the computational intensity of a diverse set of spatial analysis and modeling, performed in a collaborative fashion. Computational experiments show that GISolve achieves a high performance, distributed, and collaborative CyberGIS implementation.

Isoscapes 2011
25
ABSTRACTS: POSTER SESSIONS

Isoscapes 2011
26
AIR MASS TRAJECTORY INFLUENCE ON EAST AFRICAN RAINFALL
ISOTOPIC COMPOSITION
Stephen P. Good1, Keir Soderberg1, Lixin Wang2,1, Kathleen Ryan1 and Kelly K. Caylor1
1Civil And Environmental Engineering Department, Princeton University, Princeton NJ, 80528. [email protected]
2School of Civil and Environmental Engineering, University of New South Wales, Sydney, Australia
The stable isotope composition of water (δ2H and δ18O) found in soils, plants, ice cores, and the surface boundary layer is directly linked to that of incident precipitation. Thus understanding, predicting, and modeling the isotopic composition of rainfall is frequently important in geochemical and biochemical studies utilizing stable isotopes. Elevation, temperature, rainout volumes and air parcel trajectory are known to influence the composition of precipitation, however the effect of each specific factor may vary with location and season. While some analysis of the influence of these confounding factors has been conducted over North America and Europe, little research has addressed the influence of Indian Ocean air particle trajectories on East African rainfall signatures. Using the Hybrid Single Particle Lagrangian Integrated Trajectory (HYSPLIT) Model developed by the Air Resources Laboratory at the National Oceanic and Atmospheric Administration (NOAA), the back trajectories of 55 rain events occurring at our research station in central Kenya from February 2010 to June 2011 were mapped and meteorological data along these trajectories were gathered. Our analysis demonstrates a significant correlation between isotopic composition of rainfall and the percent of the 240hr back trajectory estimated to be over land. Furthermore this relationship demonstrates intra-annual seasonality. We conclude that within our East Africa study region, two types of storms occur; short trajectory wet season events with a depleted isotope signature, and longer trajectory dry season events that are more enriched in the heavier isotopes.

Isoscapes 2011
27
HYDROLOGICAL CONNECTIVITY IN SALT MARSH PONDS: MULTIPLE
METHODS INCLUDING GAUGES, WATER ISOTOPES, AND LIDAR
ELEVATION MODELS
Colón-Rivera, R. J1, Feagin, R. A.1, West, J. B.1 and Yeager, K. M.2
1 Texas A&M University, College Station, USA [email protected]
2 University of Southern Mississippi, Stennis Space Center, USA
Salt marshes are often thought of as being hydrologically connected to the ocean via tidal creeks, though water bodies within a salt marsh may also be semi-permanently disconnected ponds. At a salt marsh in Matagorda, Texas, there are many „isolated‟ ponds, located at varying elevations. Our objective was to quantify the hydrologic connectivity of spatially isolated ponds at this site. We sampled water for stable isotopes (δ2H, δ18O) and salinity to determine the relative contribution of tidal water and precipitation within each pond. We also quantified the water level at which each pond floods its banks and connects to each of the other ponds, using a LIDAR elevation model. We found that the similarity in isotopic value or salinity between any two sampled ponds was correlated with the water level elevation at which they connected together. Tidal gauge readings corroborated this relationship. We conclude that the connectivity of the hydrological network, and the similarity of water samples within it, profoundly changes when specific water level thresholds are exceeded.

Isoscapes 2011
28
TRACING GROUNDWATER RECHARGE SOURCE AREAS USING
GROUNDWATER ISOSCAPES AND GROUNDWATER LEVEL MAPPING
Joshua Blackstock1,2 and Travis Horton1
1Department of Geological Sciences, University of Canterbury, Christchurch, New Zealand, 8041.
2Arkansas Water Science Center, U.S. Geological Survey, Little Rock, Arkansas, 72211. ([email protected])
Sustainable groundwater resource utilization is a globally significant problem. Determining sustainable versus unsustainable water resource allocation rates depend upon accurate quantification of catchment-scale hydrological cycles. The central Canterbury Plains, immediately west of Christchurch, New Zealand, are an ideal place to apply sable isotopic tracers of hydrological processes as the regional physical hydrogeology has been well studied and monitored, significant aqueous geochemical data of surface and groundwater bodies are publicly available, and water resource allocation is a highly debated topic relevant to human populations and regional economic growth. Previous physical and isotopic investigations have shown the dominant sources of recharge to the Christchurch Groundwater System (CGS) are alpine rivers and local precipitation. However, the interpreted flowpaths and relative contributions of these discrete recharge sources vary by as much as 20% between investigations. Ultimately, this has contributed to significant ambiguity in governmentally set resource allocation limits. Here we show that groundwater isoscapes and flow-nets both show discrete recharge flow-paths originating from alpine rivers and preferentially following abandoned river channels characterized by higher hydrological transmissivity. Rainfall recharge is restricted to areas where an overlying confining layer is not present. Chloride concentrations maps further reinforce these findings. A binary single-isotope mixing model allows for quantification of the relative contributions of alpine river and precipitation derived inputs to local depression springs. The isotopic model indicates that approximately 80 % of spring discharge was derived from alpine rivers, in good agreement with recently published physical mass balance model results. This research demonstrates the utility of stable isotopes as tracers of hydrogeological processes and their potential contributions to the water resource allocation decision making process.

Isoscapes 2011
29
TRIPLE OXYGEN ISOTOPE COMPOSITION OF TAP WATERS FROM THE
CONTERMINOUS UNITED STATES
Shuning Li1, Naomi E. Levin1, and Lesley A. Chesson2
1Department of Earth and Planetary Sciences, Johns Hopkins University, Baltimore, MD, 21218. [email protected]
2IsoForensics Inc., Salt Lake City, UT, 84108.
The excess of 17O in meteoric waters (17O-excess) is the deviation from the Global
Meteoric Water Line for 18O and 17O. This parameter is analogous to d-excess in that it is sensitive to relative humidity during evaporation. However, unlike d-excess, it is largely insensitive to temperature and thus should provide additional, independent information on relative humidity of source regions. Here we present results from a national-level survey of 17O-excess of tap waters collected from 92 localities across the conterminous United States (US). Assuming tap water is a reliable integrator of local precipitation, these 17O-excess values should approximate the seasonally integrated 17O-excess of precipitation at a location. We observed high 17O-excess values in tap waters from most regions of the western US, the Appalachian Mountains and the Mississippi Delta region, whereas lower 17O-excess values are generally observed in the central US. The first-order spatial patterns of 17O-excess values of tap waters likely reflect variation in relative humidity at different moisture sources (e.g., dry Arctic source vs. wet Gulf of Mexico). We also found some second-order features in the 17O-excess distribution of the tap waters. For example, 17O-excess values from tap waters in the Great Central Valley and southern Arizona average 0.013±0.007‰ and are relatively low compared to the average 17O-excess (0.039±0.009‰) in the western US; this could be related to evaporation either during or after precipitation events. Overall, these results suggest that 17O-excess may be used as a diagnostic tool to distinguish marine moisture sources and identify continental recycling of water.
Figure: Spatial distribution of 17O-excess of tap waters in the continental United States. The location of individual sample sites are shown as circles, and the background color field
shows spatial patterns of 17O-excess interpolated by ordinary krigging. Some of the sharp contours in the map may be due to the unbiased technique of the ordinary krigging and/or
the uneven distribution of data points in some regions. All values are in units of per meg (1 per meg = 0.001‰).
The typical standard error of replicate measurements of
the same sample is 5 per meg.

Isoscapes 2011
30
ISOSCAPES OF DRY NITROGEN DEPOSITION ACROSS LOCAL AND REGIONAL
SCALES
Katherine M. Redling, Emily M. Elliott
Department of Geology & Planetary Science, University of Pittsburgh, Pittsburgh, PA 15260. [email protected]
While nitrogen is an important plant nutrient, in surplus it can have widespread detrimental environmental and human health effects. For example, dry nitrogen deposition can contribute to acidification and eutrophication of surface water and soil, and it can negatively affect vegetation and human health. While fossil fuel combustion is a key contributor to the formation of excess dry N deposition, particularly in urban areas and near roadways, our knowledge of urban deposition fluxes and sources is relatively poorly characterized. For example, the Clean Air Status and Trends Network (CASTNET), the national dry deposition monitoring network, has sites primarily located at remote locations, far from anthropogenic sources of dry N deposition. This may lead to an underestimation of total landscape dry N deposition and, consequently, watershed N budgets.
Stable isotopes of nitrogen can be an effective tool for tracking sources of atmospheric nitrogen in precipitation and dry deposition. Major atmospheric NOx sources exhibit distinct isotopic signatures, allowing source apportionment of reactive N emissions sources and resulting wet and dry deposition. For example, coal combustion generates NOx emissions with δ15N values of +6 to +20‰. In contrast, automobile NOx is characterized by lower δ15N values, ranging from +3.7 to +5.7‰. Biogenic soil NO emissions δ15N values are lower than fossil fuel sources with values between -19‰ and -49‰.
This study evaluates δ15N “isoscapes” of dry nitrogen deposition along two regional transects spanning urban to rural gradients, and along a local transect radiating from a highly trafficked highway. All sites were equipped with passive diffusion samplers to capture NO2, HNO3 and NH3 for concentration and isotopic analysis (δ15N).
Results indicate that along both urban to rural transects, dry N flux was higher at the urban site than at the rural site. δ15N-NO2 along the Pittsburgh transect was highest at the urban site in all months, corresponding with high δ15N-NO2 values from anthropogenic fossil-fuel combustion sources. However, this trend was not consistently observed along the Baltimore gradient. Seasonal variations in δ15N of dry N deposition correspond with winter heating/summer air conditioning demand. Along the road transect, near road N deposition had higher δ15N values than background, reflecting the relative contributions from automobile and soil biogenic NOx emissions, respectively.

Isoscapes 2011
31
SOUTH AFRICAN TAP WATER ISOSCAPES
Adam G. West1, Edmund C. February1 and Gabriel J. Bowen2
1Botany Department, University of Cape Town, Rondebosch, 7701, South Africa, [email protected]
2Earth and Atmospheric Sciences, Purdue University, West Lafayette, IN 47907, USA
We present the first tap water isoscapes from Southern Africa. These isoscapes reveal coherent spatial pattern in the stable isotope composition of tap water across South Africa. Samples were collected from 410 locations across South Africa using a collaborative collection approach with the South African Post Office. Our tap water
samples spanned a considerable isotopic range. For 2H, the range was 77.4‰ (-54.5‰
to +22‰). For 18O, the range was 13.1‰ (-7.7‰ to 5.4‰). For d-excess the range was -30.9‰ and 22.7‰. Tap water prediction maps were produced following the methods of Bowen et al. (2007), involving a direct comparison with modeled precipitation isotope values. In general, coastal areas had more isotopically enriched tap water than inland areas. The most enriched values occur on the eastern seaboard, a summer rainfall area with high dependence on surface waters for municipal supply. The most depleted values occur in the Kalahari and southwestern interior, arid and winter rainfall dominated areas, respectively. Over extensive areas of the country, tap water and modeled precipitation (from OIPC) are isotopically similar. However, there are many areas where there are considerable differences between these datasets. The nature of these differences potentially provides information about the tap water source, but may also reflect inaccuracy in our precipitation estimates. Our maps provide an important baseline for future monitoring efforts as well as opening the door for novel hydrological, ecological and forensic research.
Figure: 18O tap water isoscape for South Africa.

Isoscapes 2011
32
A BIOAVAILABLE STRONTIUM ISOSCAPE: CARIBBEAN REGION
Jason E. Laffoon, and Menno L. P. Hoogland
Faculty of Archaeology, Leiden University, Leiden, The Netherlands. [email protected]
Isotope analysis of human remains from archaeological contexts throughout the world has proven to be an effective tool for paleomobility research. In this vein, we have carried out an integrated biogeochemical and bioarchaeological approach to investigate patterns of ancient human and animal mobility, utilizing multiple isotope analyses of human dental enamel. Strontium isotope results generated from human remains (n=350) are interpreted relative to baseline bioavailable Sr isotope variation for a particular locality, based on comparative analyses of isotope results from local faunal and floral samples (n=300). This paper presents the results of our Caribbean Sr isotope mapping project and preliminary results of analyses of oxygen, lead, and carbon isotopes (n=50) on a subset of our human sample population. We discuss the implications of these findings for analyses of isotopic spatial-temporal variations and their potential for contributing to research on paleomobility within this region.
The figure below presents a map of the Caribbean with the major archipelagoes included in our study and a Chart displaying the mean ± 1 SD of Sr isotope measurements for each of them.
Figure: Map and Chart of 87Sr/86Sr variation within the Caribbean region.

Isoscapes 2011
33
Mapping 87Sr/86Sr Variations in Bedrock and Water for Regional Migration Studies
Clement P. Bataille, Gabriel J. Bowen
EAS Department, Purdue University, Lafayette, IN, 47907. [email protected]
Although 87Sr/86Sr variations have been widely pursued as a tracer of provenance in environmental studies, forensics, archeology and food traceability , accurate methods for mapping the variations in archeological 87Sr/86Sr at regional scale are not available. In this work, we build upon earlier efforts to model 87Sr/86Sr in bedrock developing GIS-based models for Sr isotopes in rock and water that include the combined effects of lithology and time. We fit lithology-specific model parameters for generalized equations describing the concentration of radiogenic Sr in silicate and carbonate rocks using published data. The new model explains more than 50% of the observed variance in measured Sr isotope values from independent global databases of igneous, metaigneous, and carbonate rocks, but performs less well (explaining 33% of the variance) for sedimentary and metasedimentary rocks. In comparison, a previously applied model formulation that does not include lithology-specific parameters explains only 20% and 8% of the observed variance for igneous and sedimentary rocks, respectively, and exhibits an inverse relationship with measured carbonate rock values.
Building upon the bedrock model, we also developed and applied equations to predict the contribution of different rock types to 87Sr/86Sr variations in water as a function of their weathering rates and strontium content. The resulting surface water model was compared to data from 68 catchments and shown to give more accurate predictions of surface water 87Sr/86Sr (R2=0.70) than models that do not include lithological weathering parameters. We applied these models to produce maps (“isoscapes”) predicting 87Sr/86Sr in bedrock and surface water across the contiguous USA. In many areas where geology is heterogeneous over short distances, bedrock and water isoscapes display large 87Sr/86Sr variations over a range of spatial scales that are promising for provenance studies. We compared the mapped Sr isotope distributions with two recent datasets gathering 87Sr/86Sr measurements in plants and archeological samples from the USA and found the strongest correlations in comparisons with the water model . Although the maps produced here are demonstrably imperfect and leave significant scope for further refinement, they provide an enhanced framework for lithology-based Sr isotope modeling and offer a baseline for environmental studies by constraining the 87Sr/86Sr in strontium sources at regional scales.

Isoscapes 2011
34
DEVELOPMENT OF SPATIAL PREDICTION “ISOSCAPE” MAPS FOR THE
DETERMINATION OF PROVENANCE OF UNIDENTIFIED HUMAN REMAINS: A
NEW PROBABILISTIC APPROACH
Robert Posey1, Henriette Ueckerman1, Khudooma Al Na‟imi2 and Jurian Hoogewerff1
1The Centre for Forensic Provenancing, University of East Anglia, Norwich, UK. [email protected]
2Forensic Evidence Dept., General Directorate of Abu Dhabi Police, United Arab Emirates.
Stable and radiogenic isotope composition of human tissue provides a chemical “history” of an individual‟s origin and migration during life. This information is invaluable to forensic investigations involving the identification of human remains. Application of isotope intelligence for forensic human identification is in its infancy and to date there are no validated published isoscapes for human tissue other than for hair (Ehleringer et al, 2008).
Presented are our efforts to produce a multi isotope (δ18O and 87Sr/86Sr) spatial prediction “isoscape” model for the identification of human remains in the Middle East. This study has focused on human tooth enamel, a material that provides chemical information from an individual‟s early childhood. Oxygen and strontium isoscapes were produced based on empirical data from a collection of 66 modern human teeth from the Middle East.
Presentation of forensic evidence can be challenging when using complex or uncommon chemical techniques such as isotope analysis. By applying a technique that has recently been used for the tracking of bird migration (as described by Wunder, 2010), it is possible to invert the Isoscape models to produce a map of probability, highlighting the regions from which it is most probable that the remains originated. This is a very attractive technique for the presentation of forensic isotope data as justice systems rapidly moves towards a probabilistic approach to presentation of evidence in court. The potential of such a model is demonstrated by the presentation of a recently developed “Probability-scape” model of the Middle East that combines δ18O and 87Sr/86Sr isotope data from human tooth enamel in order to provide a prediction of origin of an unidentified woman found dead in Abu Dhabi (United Arab Emirates).
References: 1) Ehleringer, J.R. et al, Hydrogen and oxygen isotope ratios in human hair are related to geography. Proc Natl Acad Sci USA, 2008, 105:2788–2793. 2) Wunder, M.B. Using Isoscapes to model probability surfaces for determining geographic origins. Isoscapes, Springer, 2010, 251-270

Isoscapes 2011
35
REFINING GEOGRAPHIC ASSIGNMENTS OF ANIMALS TO ISOSCAPES:
EXAMPLES USING INFORMED PRIORS AND BIOLOGICAL CONSTRAINTS
Steven L. Van Wilgenburg, Keith A. Hobson, and Leonard I. Wassenaar
Science & Technology Branch, Environment Canada, Saskatoon, SK, S7N 3H5. [email protected]
The application of stable-isotope analysis has greatly improved our understanding of the movements of migratory animals. Isoscapes have played an important role in portraying the geographic origins of sampled tissues from migratory wildlife. However, the recognition that there is error inherent in the geographic assignment of origins has lead to the increased use of likelihood-based methods. While this may present some analytical hurdles, it has also presented a natural framework in which to incorporate other sources of prior information that can be used inform assignments. We present examples illustrating how other sources of information on migration patterns can be used as informed priors in a Bayesian framework, and how other biologically relevant constraints can be first used to restrict isoscapes, thus limiting likelihood-based geographic assignments to origin to more biologically plausible origins. Examples using a variety of migratory birds assigned to feather δ2H isoscapes will be presented.
Figure 1: Example likelihood based assignment to geographic origin on the breeding grounds of a migrating White-throated Sparrow captured in Manitoba, Canada. A) depicts
likelihood based assignment to a δ2H isoscape alone; B) depicts prior probability of originating from a given direction, derived from analysis of circular statistics C) based upon analysis of band recovery data (inset); and D) depicts the refined assignment to
geographic origin incorporating prior probabilities in the likelihood-based assignment test.

Isoscapes 2011
36
INTEGRATION OF C, N, O, H, AND SR ISOTOPE RATIOS FOR GEOGRAPHIC
SOURCING OF CASTOR SEEDS
Bobbie-Jo Webb-Robertson1, Garret Hart1*, Helen Kreuzer1, Gary Gill1, Douglas
Duckworth1, Jim Ehleringer2, Jason West3
1Pacific Northwest National Laboratory, Richland WA, USA. [email protected] 2Stable Isotope Ratio Facility for Environmental Research, Salt Lake City, UT, USA
3Texas A&M University System, Uvalde, TX, USA
We investigated whether statistical integration of light element (C, N, O, and H) stable isotope ratios and Sr isotope ratios of plant materials improves the accuracy with which the region of origin can be determined. Our sample set consisted of 68 castor seed acquisitions from 8 geographic regions. We defined and used 3 categories of data; (1) C, N, O, and H isotope ratios of the seeds, (2) C, O, and H isotope ratios of oil extracted from the seeds, and (3) 87Sr/86Sr ratios of the seeds. We included isotope ratios of the oil as a data source because the seeds themselves are mixtures of components, while the oil is a relatively chemically homogeneous. Probabilistic-based classification scores were generated by Bayesian integration for each sample, which yields the probability of each region given the sample; )|( ji SampleRP where there are 8 regions. Given the
discrete nature of the regions, 1)|( i
ji SampleRP . If all samples were correctly
classified at a false positive rate of zero all samples would be identified for a true positive rate of 1. A plot of true positive rate versus false positive rate would yield a maximum area within the graph of 1.0. If all samples were randomly classified, the area under the curve would be 0.5. It is evident that although our classifications of region were not perfect, all were well above what would be expected by random chance. Integrating the light element and Sr isotope ratios of the beans yielded the highest overall area under the curve (0.94) and also the best overall classification accuracy (perfect classifications) at ~65%.

Isoscapes 2011
37
2H STABLE ISOTOPE ANALYSIS OF HUMAN TOOTH DENTINE: A PILOT
STUDY
Anastasia Holobinko*1, Wolfram Meier-Augenstein2,3, Helen F. Kemp3, Tracy Prowse1, Henry Schwarcz1
1Anthropology Department, McMaster University, Hamilton, ON Canada L8S 4L9. [email protected]
2Centre for Anatomy and Human Identification, University of Dundee, Dundee, UK, DD1 5EH.
3The James Hutton Institute, Invergowrie, UK, DD2 5DA.
Stable isotope analysis of biogenic tissues such as tooth enamel, bone, and hair has become a well-recognized and commonly implemented technique for determining provenance of human remains in bioarchaeological contexts and, more recently, in the forensic identification of unidentified human remains (Lee-Thorp, 2008; Meier-Augenstein and Fraser, 2008). Particularly, 18O and 2H stable isotope signatures are well established proxies as environmental indicators of climate (temperature) and source water and are therefore considered as indicators of geographic life trajectories of animals and humans (Hobson et al., 2004; Schwarcz and Walker, 2006). While studies focusing on the isotopic analysis of mammalian tooth dentine have emerged in the literature, few if any studies have systematically investigated the multi-isotopic signatures in human tooth dentine (Stuart-Williams and Schwarcz 1997, beaver; Balasse et al., 2001, cattle; Kirsanow et al., 2008, sheep; Dupras and Tocheri 2007, humans). Since isotopic make-up of tooth enamel from late-erupting permanent teeth are a source of information on geographic origins, and the isotopic signatures in continuously forming tissues (i.e., hair) yield more recent geolocational data, we hypothesize that potentially valuable information can be obtained from the stable isotopic composition of human crown dentine related to geographic provenance and dietary intake.
This pilot study determined isotopic abundance of 15N, 13C, 18O, and 2H in human tooth dentine using continuous-flow isotope ratio mass spectrometry (IRMS). Our preliminary findings suggest that multi-isotope signatures but in particular the information locked into 2H isotopic composition of tooth dentine may improve the chances of victim identification.

Isoscapes 2011
38
HYDROGEN ISOTOPIC VARIATIONS IN MAMMALIAN BONE COLLAGEN
FROM LATE GLACIAL- TO HOLOCENE ARCHEOLOGICAL SITES IN WESTERN
EUROPE
Peter E. Sauer1, Hervé Bocherens2, Darren R. Gröcke3, Anne Bridault4, Dorothée G. Drucker5, Mietje Germonpré6
1Dept. of Geological Sciences, Indiana University, Bloomington, IN 47405 USA. [email protected]
2Institut für Geowissenschaften, Biogeologie, Univ. Tübingen, Germany. 3Dept of Earth Sciences, Durham University, Durham, U.K.
4Équipe Archéologies environnementales, Maison de l’Archéologie et de l’Ethnologie René Ginouvès, Nanterre Cedex, France
5Institut für Ur- und Frühgeschichte und Archäologie des Mittelalters, Inst. für Naturwissenschaftliche Archäologie, Universität Tübingen, Germany
6Dept Paléontologie, KBIN, Brussels, Belgium
Stable isotopes of hydrogen and oxygen in meteoric waters are strongly controlled by hydrologic processes and form a central part of many studies of hydrology, climate, and paleoclimate. The relative ease of collecting water samples and the large number of geologic and archeaologic proxies for environmental waters ensure that H and O isotope ratios are central to the development of regional and global isoscapes models, in which regional patterns and covariations of stable isotopes are synthesized to form detailed pictures of biogeochemical patterns at a geographic scale. The relevance of these models depends on the quality, diversity, and spatial distribution of isotopic observations that support them.
We report new hydrogen isotope data for three archeological sites in western Europe. Collagen was extracted from mammal bones using established methods. After an initial evaluation of protein preservation based on elemental C and N content, the best preserved specimens were selected for H isotopic analysis using a recently developed steam-equilibration technique which allows the separation of the non-exchangeable (mostly C-bound) H from the exchangeable (O- bound) H (Sauer et al., 2009, RCM).
The sites span the Pleistocene-Holocene transition, including the late Pleistocene (Goyet Cave, Belgium, 27-40 ka), late glacial / transitional (Kesserloch, Switzerland, 12 to 14 ka) and early Holocene (Noyen-sur-Seine, France, ca. 8 ka) periods. Representative species include herbivores (deer, aurochs, horse, hare, ground squirrel), carnivores (bear, cave lion, wolf, lynx, fox) and omnivores (boar). The diversity of species enables us to investigate the effects on D/H isotopic ratios of diet, body size, and climate, all of which have been shown to influence collagen H isotope ratios. This dataset demonstrates that D/H isotope ratios in bone collagen increase with higher trophic levels, and supports the interpretation that larger herbivores are the best proxy for environmental water. Changes in D/H ratios in collagen from the larger herbivores, particularly the deer, parallel increases in temperature associated with major climatic transitions.

Isoscapes 2011
39
INVESTIGATING FAUNAL TRANSHUMANCE IN LATE-GLACIAL CENTRAL
ITALY
Maura Pellegrini1-2, Julia Lee-Thorp1, and Randolph Donahue2
1Research Laboratory for Archaeology and the History of Art, University of Oxford, South Parks Road, Oxford, UK, OX13QY. [email protected]
2Division of Archaeological Sciences, University of Bradford, Richmond Road, Bradford, UK, BD71DP.
Historically, transhumance of domestic herds along established routes from coastal lowlands to inner uplands was a common practice in peninsular Italy. It has been suggested that the same routes would have been exploited since the Late Glacial, as herd animals would naturally move seasonally in search of fresh pastures and, consequently, Upper Palaeolithic hunter-gatherers would follow these movements in pursuit of their main prey animals.
In order to assess whether these animals moved seasonally from lowlands to highlands,
we carried out sequential 18O, 13C and 87Sr/86Sr isotope analyses in specimens of equid and red deer tooth enamel from five late Glacial Epigravettian coastal and Apennine
archaeological sites. The combination of consecutive 18O and 13C with 87Sr/86Sr should allow us to establish animals‟ locations in the seasons. We focussed on browsing-based (Cervus elaphus) and grazing-based (Equus hydruntinus) species in order to assess ecological and transhumance differences. Samples from stratigraphic layers at the sites associated with colder (stadial) or warmer (interstadial) conditions in the last late Glacial (c.a. 20-10 ky BP) were studied to assess the influence of climate shifts on such patterns, if any. Here, we present the preliminary intra-tooth results and an associated study on the bioavailable 87Sr/86Sr around the area of one of these sites (Grotta di Settecannelle, central Italy). The latter study includes rocks, soils, plants, waters, snails and modern fauna, against which the 87Sr/86Sr and stable light isotope ratios of fossil tooth enamel and intra-tooth variations can be compared. The results of the bioavailability study confirm that 87Sr/86Sr variability is high enough to facilitate animal tracking, but the average intra-tooth variation observed in the animals is orders of magnitude lower, which likely suggests a major dampening effect during tooth routing from the biosphere to tooth mineral. The combined isotope data nevertheless suggest movement of the animals across the landscape with individual trends apparently not associated to consistent migratory patterns. Contrary to expectations, there is no evidence to suggest that migratory habits changed with time, in spite of the large climate oscillations through this period.

Isoscapes 2011
40
ESTABLISHING THE MIGRATORY CONNECTIVITY OF TREE SWALLOWS
USING A STABLE ISOTOPE BASEMAP
Andrew J. Laughlin1, D. Ryan Norris2, David W. Winkler3, and Caz M. Taylor1
1Ecology and Evolutionary Biology, Tulane University, New Orleans, LA 70118. [email protected]
2Department of Integrative Biology, University of Guelph, Guelph, Ontario, Canada, N1G 2W1
3Ecology and Evolutionary Biology and Lab of Ornithology, Cornell University, Ithaca, NY 14853.
A major obstacle in the study of migratory species is establishing the link between the breeding and wintering grounds for any given population. Such a link is vital in order to fully understand the effect that events on the winter grounds have on events the next breeding season, and vice versa. Satellite telemetry can only work for animals large enough to successfully carry a satellite transmitter, but for smaller organisms, different approaches are necessary. Stable isotopes have been used to establish migratory connectivity for songbirds. For birds that molt their feathers near their breeding grounds, the isotope ratios in that location are incorporated into their inert feathers. By catching a bird on its winter grounds and studying the isotope ratios of their feathers, one can tell where that bird molted, and hence where it spent the previous breeding season.
For Tree Swallows (Tachycineta bicolor), an isotope basemap already exists for much of
its‟ North American breeding grounds, using the isotopes deuterium and strontium (D and 87Sr/86Sr) found in their feathers (Sellick et al. 2009). We are collecting feathers from birds at three disjunct sites on their Gulf Coast wintering grounds to compare isotope values to those from the basemap. Most connectivity studies using stable isotopes use only 1 element, and the combination of two isotopes in establishing migratory connectivity greatly enhances the predictive power of the basemap.
To help validate the results of this approach, data from another source of connectivity data using light-logging geolocators will be compared to the isotope study. Geolocators are miniature devices that log light levels at specified increments throughout the day. After recapturing the bird the following year on its breeding grounds, this data can be used to infer the latitude and longitude of the bird throughout the last year. The combination of isotopes and geolocators to establish the connectivity of a small migratory bird has not yet been performed to our knowledge, and data from both studies will be used to validate the results of the other.

Isoscapes 2011
41
A FEATHER-PRECIPITATION HYDROGEN ISOSCAPE FOR NEW ZEALAND
K. Rogers1, L.I. Wassenaar2*, D.X. Soto3, and J.A. Bartle3
1National Isotope Centre, GNS Science, Lower Hutt, 5040 New Zealand. 2Environment Canada, 11 Innovation Blvd., Saskatoon, SK, Canada.
[email protected]. 3Museum of New Zealand Te Papa Tongarewa, Cable Street, Wellington New Zealand.
Forensic isotopic assays of feathers from historical Maori cloaks are a potential tool to link historical artefacts back to their native locales (Iwi) in New Zealand. In order to test this approach, we sampled feathers from extant museum archived birds of known origin for their feather hydrogen isotopes (δ2Hf) to assign their regional origin and location over time. We obtained feathers from two non-migratory bird species widely distributed around New Zealand, tui (Prosthemadera novaeseelandiae) and quail (Callipepla californica). Feathers were sampled from archived birds collected between 1880-2002 held in 3 New Zealand museum collections. We determined regression coefficients of δ2H on location, latitude, δ2Hprecipitation, and age. The data showed that ground dwelling quail had higher regression coefficients with respect to latitude (r2=0.46) than the nectar feeding tui (r2=0.39). On the whole, both resident birds showed promise as regional geographical indicators of their habitat (r2=0.58). Year of collection had no meaningful effect on isotopic composition. We conclude that isotopic assays may therefore be used to aid in regional assignments relevant to the interpretation of historical artefacts.
-70 -60 -50 -40 -30 -20
precipitation D
-120
-100
-80
-60
-40
-20
0
feath
er D
both species (DHf=-27+0.91*DHprec)
1975-2006
1950-1975
before 1950
Indet.
Figures: (left) Weighted mean annual δ2H in precipitation (courtesy Russell Frew), and (right) correlation with δ2H in tui and quail feathers from museum collections (r2 =0.58).

Isoscapes 2011
42
TOWARDS DYNAMIC MARINE ISOSCAPES: A CASE STUDY USING 13C
VALUES IN SALMON
Kirsteen M. MacKenzie1, Clive N. Trueman1, and Martin R. Palmer1
1National Oceanography Centre, University of Southampton Waterfront Campus, European Way, Southampton, SO51 8FD, UK.
Isoscapes have gained prevalence over recent years for their value in identifying location in wide-ranging terrestrial species. In the marine environment, however, isotope ratios of oxygen, hydrogen and strontium have relatively homogenous distributions. Latitudinal and offshore gradients in the isotopic compositions of carbon and nitrogen have previously been used to track movements of marine mammals. Short-term temporal and spatial variations in the isotopic compositions of C and N at the marine ecosystem base, however, restrict the geographic resolution available from fixed isoscape approaches to broad basin-scale differences or latitudinal effects. As the carbon isotope composition of primary production varies with sea surface temperature, marine
location can be identified by matching time series of 13C measured in tissues to sea surface temperature records. Applying this technique to populations of Atlantic salmon (Salmo salar L.) produces isotopically-derived maps of oceanic feeding grounds, consistent with the current understanding of salmon migrations, that additionally reveal geographic segregation in feeding grounds between individual philopatric populations and age-classes. Carbon isotope ratios can be used to identify the location of open ocean feeding grounds for any pelagic animals for which tissue archives and matching records of sea surface temperature (SST) are available. This method is a significant move towards the creation of dynamic marine isoscapes, using animals as natural samplers.
Figure: Northeast UK coast 1 sea-winter salmon marine distribution inferred from tissue
13C measurements and SST records.

Isoscapes 2011
43
APPLICATION OF 13C AND 15N ISOSCAPES TO STUDIES OF FISH SITE
FIDELITY AND BASAL RESOURCE VARIATION ON THE WEST FLORIDA
SHELF.
Kara R. Radabaugh, Sheri A. Huelster, David J. Hollander, and Ernst B. Peebles
College of Marine Science, University of South Florida, St. Petersburg, FL 33701. [email protected]
Geographic variation in river discharge, light environment, and biological activity
impart heterogeneity to the stable-isotope baselines of coastal marine food webs. 13C
and 15N isoscapes provide new spatial and temporal perspectives on the site fidelities of fish species and the dominant primary producers (basal resources) that support marine fish biomass. SEAMAP (Southeast Area Monitoring and Assessment Program) groundfish surveys at more than 130 locations on the West Florida Shelf (eastern Gulf of Mexico, USA) were used to acquire over 1,600 fish, invertebrate, and primary producer
samples for analysis of bulk-tissue 13C and 15N. West Florida Shelf 15N isoscapes exhibited strong latitudinal and longitudinal isotopic gradients and high interannual
and seasonal stability. Low variability in 15N values revealed strong site fidelities for
these trawl-caught fishes. 13C isoscapes exhibited depth gradients with greater seasonal
and interannual variability. 13C values of benthic algae from sea urchin stomachs
averaged 4.2‰ higher than 13C of phytoplankton, providing an isotopic tracer for trophic pathways that originate from benthic primary producers. Some fish species (e.g.,
littlehead porgy, Calamus proridens) exhibit high 13C values and appear to obtain nearly all of their biomass via benthic primary production through trophic intermediates. Other species (inshore lizardfish, Synodus foetens, and dusky flounder, Syacium papillosum) ultimately derive their biomass from a combination of benthic and planktonic primary producers. Future surveys will further document the spatiotemporal stability of the West Florida Shelf isoscapes.
Figure: 15N Isoscape of Syacium papillosum (dusky flounder) muscle samples from the West Florida Shelf, Eastern Gulf of Mexico.

Isoscapes 2011
44
DOCUMENTING AND UNDERSTANDING ECOLOGICAL CHANGES AFFECTING
THE SUSTAINABILITY OF FOREST ECOSYSTEM SERVICES IN SÃO PAULO,
BRAZIL
Norton Ribeiro de Freitas Jr.1, Andrea Lini2, and Marisa Domingos 3
1Gund Institute for Ecological Economics, University of Vermont, Burlington, VT, 05405. [email protected]
2Department of Geology, University of Vermont, Burlington, VT, 05405. 3Instituto de Botânica de São Paulo, São Paulo, Brazil
The sustainability of ecosystem services provided by the Atlantic Rainforest and Cerrado Biomes is critical to human wellbeing. The state of São Paulo in Brazil has a land area of 24.821 million hectares and during the past sixty years human activities have reduced forested areas to a very small fraction of their original size. Combining field measurements, biogeochemical analyses, GIS datasets and orbital satellite images, we are developing a geostatistical model to determine the response of five forest fragments to disturbance closely associated with the utilization of surrounding areas by a major oil refinery in the metropolitan Campinas. These small fragments play significant roles in generating ecosystem services for the benefit of urban residents subject to exposure to pollutants, and therefore are being mapped and monitored. Here we review the methods we used to map pollutant exposure and ecosystem response with a focus on geochemical proxies including δ13C, δ15N, %C, %N, and C/N. The preliminary analyses were performed on leaf samples from seven major plant species collected in five forest fragments across the refinery pollution gradient in February 2011 (wet season). At each site, samples were collected from both fragment sides facing and opposite to the refinery. To account for seasonal variability of the investigated proxies another round of sampling will take place in September 2011, during the dry season.
Figure: Studied forest fragments within the metropolitan region of Campinas in the state of São Paulo, Brazil

Isoscapes 2011
45
MODELING THE SPATIAL VARIABILITY OF Δ13C IN TREE-RINGS USING
GEOGRAPHICAL INFORMATION SYSTEMS (GIS)
Jorge del-Castillo1, Juan Pedro Ferrio1, Mónica Aguilera1 and Jordi Voltas1
1Crop and Forest Science Department, University of Lleida, Spain. [email protected]
The aim of this project is to model the spatial variability of carbon isotope discrimination (Δ13C) of two typical Mediterranean species by using only geographical variables, following a method developed by Ninyerola et al. (2005) to spatially reconstruct the Iberian climate. Two Δ13C networks of 44 and 39 points from Quercus Ilex L. and Pinus Halepensis Mill. respectively, derived from 30-year tree-ring pools were used in order to predict the spatial Δ13C distribution. Briefly, stepwise multiple regression analyses were used to select the geographic variables used to model Δ13C for each species. A layer of modeled Δ13C was then generated. The Quercus model was based on three variables (logarithmic cost distance from all seas, latitude, and altitude-
in this order of significance) explaining 52% of 13C total variance. On the other hand, the Pinus model, using latitude, Euclidian distance from all seas, and altitude, explained
49% of 13C total variance. We produced maps of estimated precipitation based on the relationship between this variable and Δ13C (Pyear = 144.0×Δ13CPinus -1830, R2 = 0.57; PAutumn = 45.5×Δ13CQuercus -621, R2 = 0.42) , which were then validated with precipitation maps of the Iberian Peninsula (Figure 1). Our results offer an insight into the controlling aspects of Δ13C spatial variability, and confirm the possibility to track Δ13C records at a regional scale.
Figure 1. A) Precipitation map of the study area (Climatic Atlas of the Iberian Peninsula, Ninyerola et al. 2005), including the sampling sites. B) Error map of estimated annual
precipitation based on 13C of P. halepensis. Areas outside of the potential distribution of the species are masked in black.
Reference: Ninyerola M, Pons X and Roure JM. 2005. Atlas Climático Digital de la Península Ibérica. Metodología y aplicaciones en bioclimatología y geobotánica. Universidad Autónoma de Barcelona, Bellaterra. Funding: Projects CGL2009-13079-C02-01 (MCINN) and ERC-AdG-230561 (FP7, EU). JdC has a PhD fellowship (MCINN). JPF holds a “Ramon y Cajal” contract (MCINN).

Isoscapes 2011
46
TRANSPIRATION SOURCE WATER AND GEOMORPHOLOGICAL POTENTIAL
OF ROOT GROWTH IN THE BOULDER CREEK CZO, COLORADO
Breanna A. Skeets1, Anya B. Byers2, and Holly R. Barnard2*
1Department of Geology, Lawrence University, Appleton, WI, 54911. 2Department of Geography, Institute of Arctic and Alpine Research,
University of Colorado, Boulder, 80309. [email protected]
The influence of vegetation on the hydrological cycle and the possible effect of roots in geomorphological processes are poorly understood. Gordon Gulch in the Front Range of the Rocky Mountains, Colorado, is a montane catchment within the Boulder Creek Critical Zone Observatory whose study adds to the body of ecohydrological work in varied climates. This work sought to identify the sources of water used by different tree species and to determine how trees growing in rock outcrops may contribute to the fracturing and weathering of bedrock.
Stable isotopes (18O and 2H) were analyzed from water extracted from soil and xylem samples. Pinus ponderosa on the south-facing slope accessed water from below the soil-saprolite interface during dry periods and demonstrated a lag in uptake of new rainfall event water. Isotopic results from Pinus contorta on the north -facing slope demonstrated a more dynamic response to rainfall events and rapidly accessed newly available soil moisture. We found that trees (Pinus ponderosa) growing within rock outcrops were unlikely to be using water within the thin surrounding soils and were accessing much deeper water sources presumably from water held within deep fractures. However, this deep water remains isotopically dissimilar to the catchment groundwater.
An underexplored question in geomorphology is the role roots play in long-term geomorphological processes by physically deteriorating the bedrock. The visible, dominant root of measured trees growing in rock fractures contributed approximately 30 - 80% of total water use, especially after rainfall events. Preliminary analysis of root growth rings indicates that root growth is capable of expanding rock outcrop fractures at an approximate rate of 0.6 – 1.0 mm per year. These results in conjunction with stable isotope data demonstrate the significant role roots play in both tree physiological processes and in bedrock deterioration.

Isoscapes 2011
47
RESOLVING N2 INTERFERENCES FOR 18O ANALYSIS OF N-RICH ORGANICS
BY TC/EA
Glendon B.Hunsinger1,2 and Libby A. Stern1
1FBI Laboratory, Counterterrorism & Forensic Science Research Unit, Quantico, VA 22135
[email protected] 2Sponsored by Oak Ridge Institute for Science and Education, Oak Ridge, TN.
The application of stable isotope ratio mass spectrometry (SIRMS) exhibits promise as a tool for discrimination of sources or linkages between analogous organic materials in the forensic sciences. Extensive use of SIRMS via high temperature
conversion/elemental analyzer (TC/EA) for 18O analysis of nitrogenous organics is presently hindered by isobaric interference from 14N16O+, generated in the ion-source via N2 interaction with trace O, versus the target ion 12C18O+. To this end, we evaluated modifications to the standard TC/EA design in order to best resolve the issue. Three adaptations to the TC/EA were tested: [1] increasing the gas chromatographic column length to a 1.5 m 5Å molecular sieve, [2] reduction of N2 peak via He dilution, and [3] diversion of N2 to waste via an automated 4-port valve. These tests were performed on caffeine (IAEA-600 reference material), glycine, 4-nitroacetanilide, pentaerythritol tetranitrate (PETN), and cyclo-trimethylene trinitramine (RDX), having N:O ratios ranging from 0.3 to 1.8 and variable N2 production in the TC/EA. With the exception of
caffeine, dilution was not as effective as diversion in resolving the effects of N2 on 18O
results, even using the 1.5 m column. The 18O values of RDX using the 1.5 m column alone were ~ 3‰ lower than the 4-port diversion technique, clearly indicating that
accurate and reliable inter-laboratory comparisons of 18O for N-rich organics may require elimination of N2. Once an optimal solution is achieved, this method should be utilized in the development of additional N-rich organic reference materials essential for
18O analysis.

Isoscapes 2011
48
SAPPING PINES AND CURDLING CHEESE: INDUCTION MODULE CRDS
ANALYSIS OF MATRIX-BOUND WATERS
Robert J. Panetta1,2, Riana Parvez2,3, Danthu Vu2, and Aaron Van Pelt2*
1Picarro, B.V.. den Haag, The Netherlands, 2594, [email protected] 2Picarro, Inc., Santa Clara, CA, 95054.
3Department of Biology, University of California, Berkley, CA, 94720
The recent introduction of the Induction Module coupled to Cavity Ring-Down Spectroscopy (IM-CRDS) for extraction of matrix bound water has opened the door for novel and/or more detailed studies that can be readily applied to Isomaps work. First, the study of water isotope fractionation along a Pinus spp. from branch to leaf-tip will be
discussed. Very little isotope fractionation is identified through 7 cm of branch (D = -
55.02 ± 0.98 ‰ and 18O = -5.06 ± 0.26 ‰), however from leaf base to tip, D and 18O are enriched by 75.1 and 27.4 ‰, respectively. The fractionation of both isotopes is very linear with distance (r2 = 0.99), and the slope of the water line is well below meteoric (2.7), showing direct evapotranspiration. The entire data set, comprised of 11 data points covering ~30 cm of plant, took 99 minutes to obtain. The second application is food authenticity, in which matrix-bound water is extracted from cheese (Cheddar, Chèvre and Camembert) originating from around the World (New Zealand, Europe, California, Northeastern USA) and purchased at a local grocery. The water lines are again very linear (r2 ~0.98), however the cheddar and soft cheeses show markedly different slopes (6.8 vs. 12.1, respectively). Geographic trends (Isolocation) are maintained. The cheddar, which is aged in wax so does not evaporate, showed values much closer to the meteoric than the soft cheeses. This data set, comprised of 14 distinct cheeses measured 5 times each as well as 3 standards (85 measurements in all), was accomplished in one and a half working days split between two analysts (a PhD and undergraduate intern).
Figure. D and 18O profiles along the length of stem and one leaf. Black × denotes sample slice location on the branch, each data point of the branch is a single 0.05 mm slice.

Isoscapes 2011
49
THE ISOMAP CI STACK: THE OPEN SOURCE, GRID-ENABLED
TECHNOLOGIES BEHIND THE ISOMAP PROJECT
C.C. Miller1, Lan Zhao2, Ajay Kalangi3, Hyojeong Lee2, Gabriel Bowen4, Jason West5, Tonglin Zhang6, Zhongfang Liu4
1Purdue University Libraries, Purdue University, West Lafayette, IN, 47906. [email protected]
2Rosen Center for Advanced Computing, Purdue University, West Lafayette, IN, 47906.
3Department of Computer Science, Purdue University, West Lafayette, IN, 47906. 4Department of Earth & Atmospheric Sciences, Purdue University, West Lafayette, IN,
47906. 5Department of Ecosystem Science and Management, Texas A&M University, College
Station, TX, 77843. 6Department of Statistics, Purdue University, West Lafayette, IN, 47906.
The IsoMAP project is intended to fundamentally change our knowledge of the water cycle and ecological and biogeochemical processes through TeraGrid-powered analysis of network-based isotope data. By collecting multi-scale, multi-format geospatial datasets and utilizing various data-based statistical analyses and models, IsoMAP will result in a cyberinfrastructure that empowers and streamlines spatially-explicit stable isotope research and makes powerful tools and processing available to users over the web. In addition to the scientific agenda that guides IsoMAP development, we believe the infrastructure itself – a collection of technologies and methods contributed by domain scientists, statisticians, computer and library scientists – provides a valuable model and toolkit for further cyberinfrastructure development in support of water cycle science.
This presentation focuses on IsoMAP's infrastructure – the (open source) technologies, frameworks, protocols and standards that are allowing us to build into one portal (1) data source exploration and selection procedures and controls, (2) statistical analysis and model development; (3) predictive simulation of isotope distributions using models developed in (1) and (2); (4) analysis and interpretation of simulated spatial isotope distributions; and 5) a fully interactive web GUI with model development, execution, sharing and search, and instant, live rendering of spatial output. Topics include IsoMAP's TeraGrid scheduling logic; spatial data management packages and servers; web front end frameworks and languages; and internal job management and tracking mechanisms. Emphasis will be placed on the openness and sustainability of IsoMAP's technology stack as well as its adaptability to new data and portal functionality.

Isoscapes 2011
50
WEB-BASED LEAF WATER ISOSCAPES IN ISOMAP USING RASTER
MODELING
Jason B West1, Shivani Mittal1, Gabriel J Bowen2, Ajay Kalangi3, Hyo J Lee3, Chris Miller4, Tonglin Zhang5, Lan Zhao2
1Department of Ecosystem Science and Management, Texas A&M University, College Station, TX 77843. [email protected]
2Department of Earth & Atmospheric Sciences, 3Department of Computer Science, 4Libraries, 5Department of Statistics, 6Rosen Center for Advanced Computing, Purdue
University, West Lafayette, IN 47907
The isotopic composition of leaf water acts as a relatively short-term recorder of transpiration and soil moisture access, is an important driver of the δ18O of atmospheric O2 and CO2 and is also the medium in which photosynthesis occurs, affecting the isotopic composition (δ18O and δ2H) of all organic compounds produced by plants. Understanding what causes isotopic variation in leaf water is therefore of critical importance to the use of oxygen and hydrogen isotope ratios of plant materials to make inferences about a variety of processes in hydrology, ecology, atmospheric science, and paleoecology, and others. Although understanding the large-scale spatial variation in leaf water isotopic composition is particularly important for drawing inferences from several proxies, modeling the spatial variation of leaf water isotopic variation has presented challenges. Here we describe a component of a new online portal (IsoMAP; http://isomap.org) that provides researchers with tools to produce, utilize, and evaluate leaf water and other plant isoscapes. We believe that facilitating the use of plant isoscapes by a variety of researchers will enhance not only individual research efforts targeted at drawing inferences from plant hydrogen and oxygen isotope ratios, but will also facilitate a productive dialog and framework for plant physiologists interested in directly modeling the processes that drive isotopic variation in plants. IsoMAP is a web-based portal that provides users with free global access to a diverse set of tools for spatial isotopic data analysis, modeling and the generation of isoscapes. The IsoMAP plant modeling component implements three steady-state models of leaf water isotope enrichment: the core “Craig-Gordon” model, a “Two-pool” model, and the “Péclet” model, giving user the opportunity for inter-model comparison completely within the web portal system. The model takes as input publicly-available climate grids and IsoMAP-generated precipitation isotope grids in a common IsoMAP format to allow model execution by the user. In addition, the user can modify several model parameters (e.g., air temperature, leaf temperature, or stomatal conductance). The new leaf water modeling tool has been used in a variety of test cases relevant to spatially-distributed data collection efforts and provided key insights both from the standpoint of hypothesis testing, as well as hypothesis generation. In addition to providing a new tool for isoscapes-based research, IsoMAP is designed to generate dialog across disciplines and yield synergies as researchers use and compare various models and as we expand the models available to the IsoMAP user community.

Isoscapes 2011
51
THE STATISTICAL METHOD IN THE ISOMAP PRECIPITATION TOOLKIT
Tonglin Zhang1, Zhongfang Liu2, Hyojeong Lee3, Chris Miller4, Jason West5, Lan Zhao6, Gabriel Bowen2
1Department of Statistics, 2 Department of Earth and Atmospheric Sciences, 3Department of Computer Sciences, 4Libraries, 6Rosen Center for Advanced
Computing, Purdue University, West Lafayette, IN 47907. [email protected] 4Department of Ecosystem Science and Management, Texas A & M University, College
Station, TX 77843-2138.
We have developed a statistical code to interpolate the stable isotope ratio of precipitation at continental to global scales. The statistical code is developed under the general framework of the universal kriging method and has been applied in the IsoMAP precipitation isotope analysis package. In general, a universal kriging model contains a mean function and a correlated error term, which is a natural statistical method, used geosciences. In this code, we model the mean function by a linear or quadratic function of independent variables and the error term by a Gaussian random field, where the correlation of the Gaussian random field is modeled by the Matern correlation function. An efficient numerical algorithm has been developed in the code, which include the profile likelihood method to estimate the Matern correlation function and the general least square method to estimate the mean function. Broader statistical evaluation methods, including the ANOVA (analysis of variance), CV (cross validation), and hypothesis testing, have been incorporated in the code. These methods have been developed in C++ and are implemented within the IsoMAP software system, wherein they are executed using user-specified datasets on TeraGrid computational resources, providing flexible model development, exploration, and application through a web-GIS interface.

Isoscapes 2011
52
SPONSORS